
BACKGROUND - Asymptotix · Main Topics: Asset-liability Management, Chemometrics, Design of...
52
1 EURISBIS AND ECRIM THE JOURNEY OF AN IDEA IN 2009 BACKGROUND THE EUROPEAN ACADEMIC CONFERENCE CIRCUIT IN ECONOMETRICS SOCIAL NETWORKING IN APPLIED ECONOMETRICS CREDIT ECONOMIC CAPITAL AND FINANCIAL PREDICTIVE ANALYTICS TOWARDS A ‘FINAL SOLUTION’ PREDICATED UPON SEMANTIC INTEGRATION PREDICTIVE TOOLSET AGNOSTIC PROCESS MODEL AWARE
Transcript of BACKGROUND - Asymptotix · Main Topics: Asset-liability Management, Chemometrics, Design of...

1
EURISBIS AND ECRIM THE JOURNEY OF AN IDEA
IN 2009
BACKGROUNDTHE EUROPEAN ACADEMIC CONFERENCE CIRCUIT IN ECONOMETRICSSOCIAL NETWORKING IN APPLIED ECONOMETRICS
CREDIT ECONOMIC CAPITAL AND FINANCIAL PREDICTIVE ANALYTICSTOWARDS A ‘FINAL SOLUTION’
PREDICATED UPON SEMANTIC INTEGRATIONPREDICTIVE TOOLSET AGNOSTICPROCESS MODEL AWARE

2
EURISBIS09 & ERCIM09
CONFERENCE DOCUMENTATIONFOR
CREDIT ECONOMIC CAPITAL AND FINANCIAL PREDICTIVE ANALYTICS
BYJ A MORRISON
2009
November 2009
FINAL VERSION
3
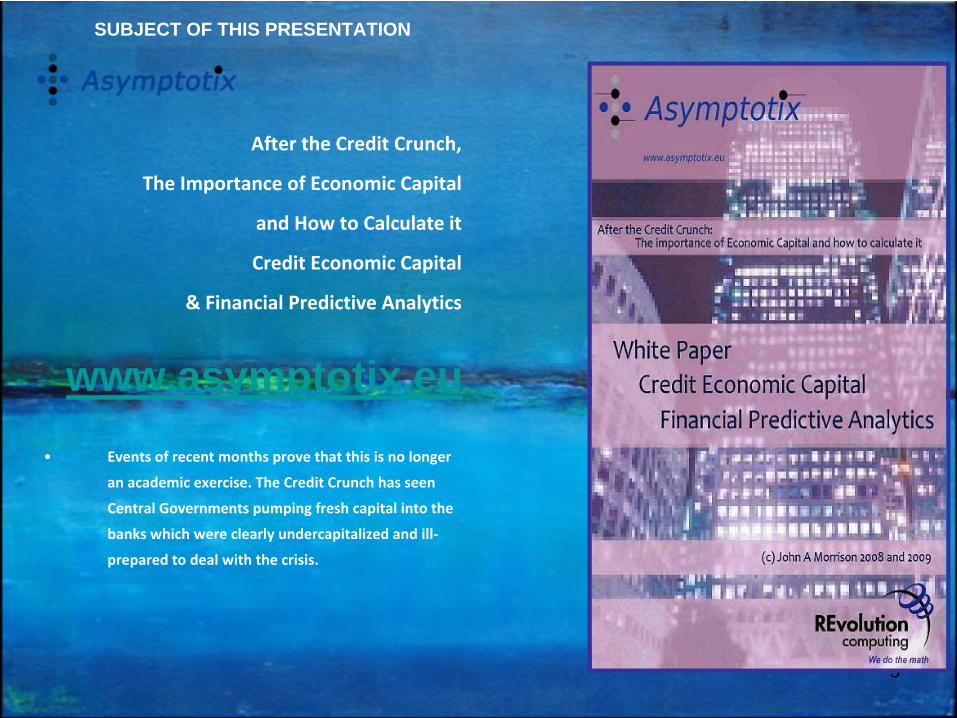
After the Credit Crunch,
The Importance of Economic Capital
and How to Calculate it
Credit Economic Capital
& Financial Predictive Analytics
•
Events of recent months prove that this is no longer
an academic exercise. The Credit Crunch has seen
Central Governments pumping fresh capital into the
banks which were clearly undercapitalized and ill‐
prepared to deal with the crisis.
SUBJECT OF THIS PRESENTATION
www.asymptotix.eu

4
CALL FOR PAPERS EURISBIS09
EURISBIS’09 European Regional Meeting of the International Society for Business and Industrial Statistics
with special emphasis on Quantitative Methods for Banking and Finance, Environment,
Quality of Services for SMEs, Transport and Tourism Cagliari, Italy, May 30 – June 3, 2009URL: www.eurisbis09.it Host Institution: Department of Economics
-
University of Cagliari
-
Italy Venue: Hotel Flamingo in Santa Margherita
di
Pula (Cagliari, Italy –
www.hotelflamingo.it) Main Sponsor: International Society for Business and Industrial Statistics (ISBIS) Participating Organisations: Faculty of Economics -
University of Cagliari
IASC (International Association for Statistical Computing ISI (International Statistical
Institute) SIS (Italian Statistical Society) ESSEC Business School of Paris and Singapore Main themes: This conference will focus on statistical issues aimed at improving decision-making processes in Banking and Finance, Environment,
Quality of Services for Small and Medium Enterprises (SMEs), Transport and Tourism. Main Topics: Asset-liability Management, Chemometrics, Design of Experiments, Environmentrics, Information Technology, Life Insurance,
Pharmaceutical Statistics, Pension Schemes, Portfolio Management, Process Control, Quality Control, Ratings, Reliability, Risk Management, Risk Analysis and Market Research, Software Engineering, Statistical Learning and Data Mining, Survey Methods, Tourism Statistics, Transport Statistics.
Keynote speakers: William S. Cleveland (Bell-labs, USA) Alessandro Fassò
(University of Bergamo, Italy) SPC chairs: Nicholas Fisher (ValueMetrics, Australia)
Francesco Mola
(University of Cagliari, Italy) Vincenzo
Esposito Vinzi
(ESSEC Business School, France) Scientific Secretary: Claudio Conversano
(University of Cagliari, Italy –
conversa_at_unica.it) LOC chairs: Claudio Conversano
(University of Cagliari, Italy); Francesco Mola
(University of Cagliari, Italy)
Important Dates: Abstract Submission : January 15, 2009. Notification of Acceptance : January 31, 2009 Early Registration
: March 1, 2009 Late Registration : May 25, 2009
The University of The University of CagliariCagliari
5
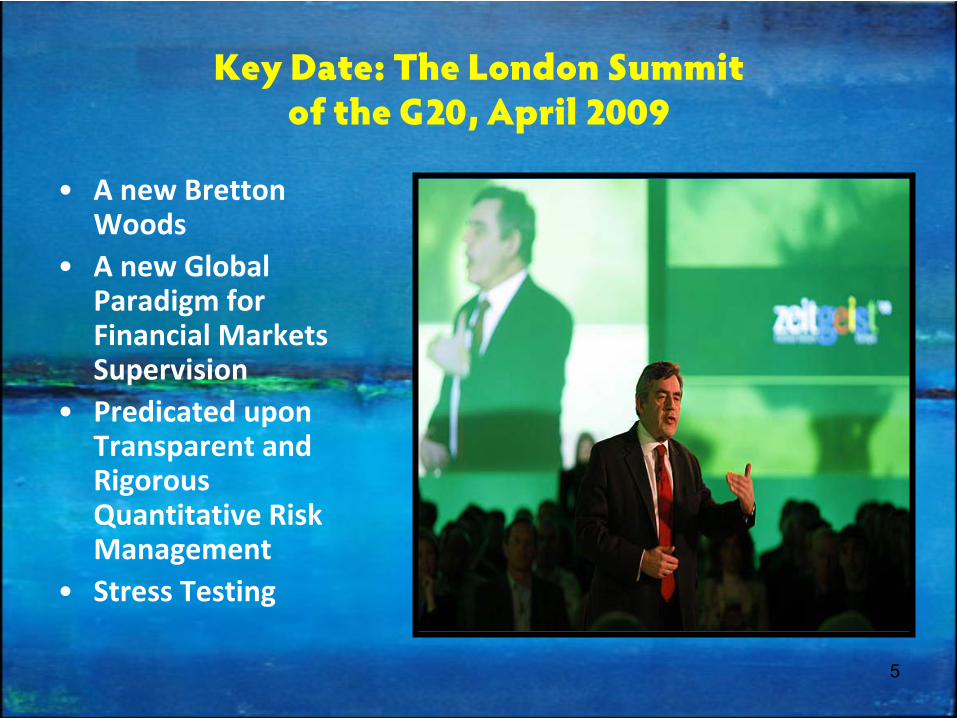
Key Date: The London Summit of the G20, April 2009
•
A new Bretton Woods
•
A new Global Paradigm for Financial Markets
Supervision•
Predicated upon
Transparent and Rigorous
Quantitative Risk Management
•
Stress Testing

6
MY FO
LLOW
UP R
ESEAR
CH
FRO
M EU
RISB
IS09Im
plementation of the C
opula -Interesting work from
Italy and w
ider Europe http://w
ww
.analyticbridge.com/profiles/blogs/im
plement
ation-of-the-copula
We did not have the tools
in place to count the hits

7
A G
LO
BA
L
BL
OG
GIN
GC
ON
TR
IBU
TIO
N

8
THIS PA
PER W
AS A
LSO PR
ESENTED
AT
ECR
IM09

9
ERCIM09
•
Book of Abstracts–
http://www.dcs.bbk.ac.uk/ercim09/BoACFEER
CIM09.pdf
Πανεπιστήμιο
Κύπρου
10
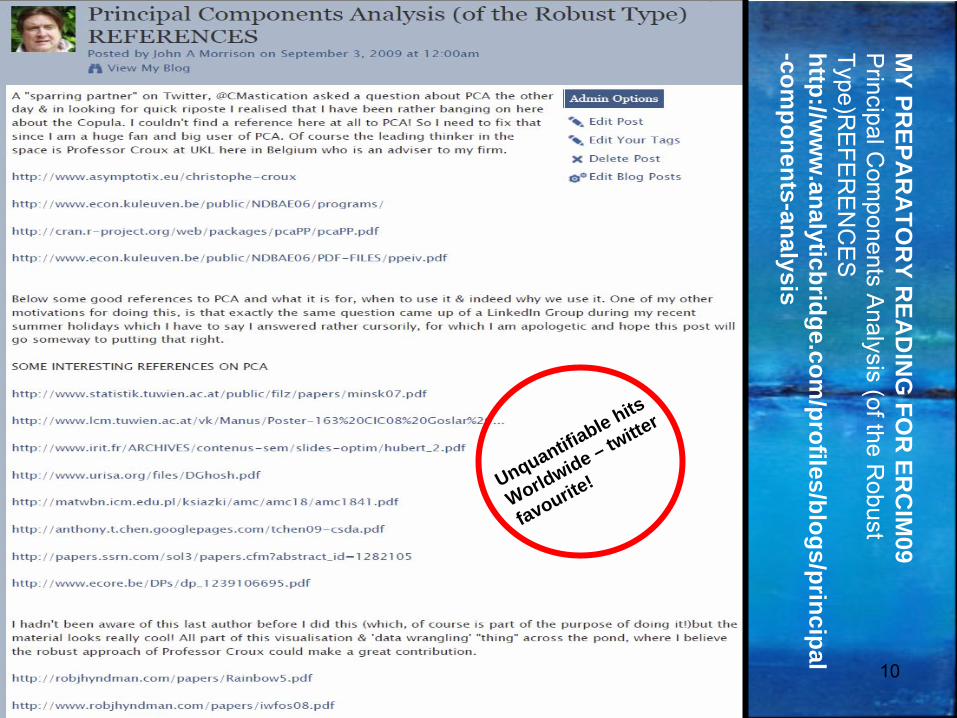
MY PR
EPAR
ATO
RY R
EAD
ING
FOR
ERC
IM09
Principal C
omponents A
nalysis (of the Robust
Type)RE
FER
EN
CE
Shttp://w
ww
.analyticbridge.com/profiles/blogs/principal
-components-analysis
Unquantifiable hits
Worldwide – twitter
favourite!

11
AR
E Y
OU
/w
e P
AY
ING
A
TT
EN
TIO
N? IS
TH
E IN
DU
ST
RY
?

12
After the Credit Crunch,
The Importance of Economic Capital
and How to Calculate it
Credit Economic Capital
& Financial Predictive Analytics
•
Events of recent months prove that this is no longer
an academic exercise. The Credit Crunch has seen
Central Governments pumping fresh capital into the
banks which were clearly undercapitalized and ill‐
prepared to deal with the crisis.
SUBJECT OF THIS PRESENTATION
www.asymptotix.eu

13

14
REvolutionComputing

15
The Market has Failed! Let’s Face It?
•
Banking in the US has ceased to function.
•
The Transmission Mechanism (from Federal Money creation to domestic credit) has halted
•
Capital Markets are only looking at one variable; Government.
•
Only the Federal Reserve and The Treasury is capable of Liquidity Provision
•
This situation has to be resolved and
•
Only rigorous Risk Management and Transparency in the Private Commercial Sector will do it.
•
This requirement is intrinsically aligned with good governance and social responsibility.

16
•
We need to see banking assets transferred ASAP from
“public” (State) ownership back to the Private Sector
(commercial) banking ownership.
–
Our very democratic liberty is dependent upon that transfer.
•
The public sector failed to enforce its own regulations and
standards of supervision pre-credit crisis!
–
To make good on that it is now implementing what should have
been done in the private sector pre-credit crunch (Stress Tests,
Fair Value).
•
‘Technology Transfer’ (of Statistical or Analytic technology)
is required now from the Central Banks, Universities and
Supervisors (and now Government Agencies) to the
Commercial (Private) Banking Sector!
•
This is a channel of (IP) transfer created by Basel II Pillar 2
which was an attempt to underpin stewardship in banking
through good governance by ‘outsourcing’ supervision back
to the supervised entities through a framework of rules, it
failed!–
Now we have to try that again, more precisely, more transparently,
more specifically, more prescriptively;-
•
How else to do it but Open Source?
The ‘Get out of Jail Card’? OUTSOURCED BANKING SUPERVISION

17
•
There does not exist right now a black box product which integrates Credit and Market Risk (never mind all the other risk types)
•
Therefore given that Supervisors seem to be requiring Holistic integrated risk analytics today
•
“The inability of the user to intensify assumptions of default dependence (as is possible in the deployment of the copula) means that these black box models with constant assumptions of asset correlations are not appropriate modelling tools for economic risk capital under extreme conditions.” [page 24]
•
“The main criticism of the manner of deployment of these Credit Risk model packages is that shortcuts are deployed uncritically and that explicit dependency modelling is generally not done by the banks”. [page 16]
Stress Testing has to be DIY
IS E
CO
NO
ME
TR
ICS
TH
E B
IGG
ES
TM
OS
T M
AT
UR
E‘O
PE
N S
OU
RC
E C
OM
MU
NIT
YO
N T
HE
PL
AN
ET
?

18
Risk, Quantification and Supervision
Risk is always with us; we either learn the language to describe
it (mathematics)
and go some way to approximating it or we are not actually in the risk business.
If we have a supervisory regime which we know to be operational,
then each bank
knows that other banks hold sufficient risk or economic capital not to be a
systemic risk. Issues of inter‐bank confidence are thereby reduced.
One of the primary causes of the Credit Crunch (CC) was the failure to comprehensively compute risk capital in structured instruments.
It is clear however that these products cannot be abandoned entirely since that would send the banking industry and the wider economy back to a prehistoric wilderness.
Securitisation is a policy response to the credit crisis but predicated upon open stress testing

19
•
What the copula approach adds is a way of isolating that
dependence structure, allowing the analyst to focus in detail
explicitly on the dependency between factors in a joint
distribution (in Credit Economic Capital terms, examples would
be GNP and Retail Lending Defaults or The Term Structure and
SME default rates).
•
Where you model Economic Capital (or risk) as a function of a
multivariate distribution; e.g. historic default in Asset Class A,
Asset Class B, the term structure and FTSE100 (a Factor Model,
implemented in a GARCH function), you can also say how default
in Asset Class A is dependent specifically on the FTSE100 for
example or any other factor in your model.
•
As QRM concludes in the strictest sense the concept of
correlation is meaningless unless applied in the context of a well
defined joint model. Any interpretation of correlation values in
the absence of such a model should be avoided.
20
•
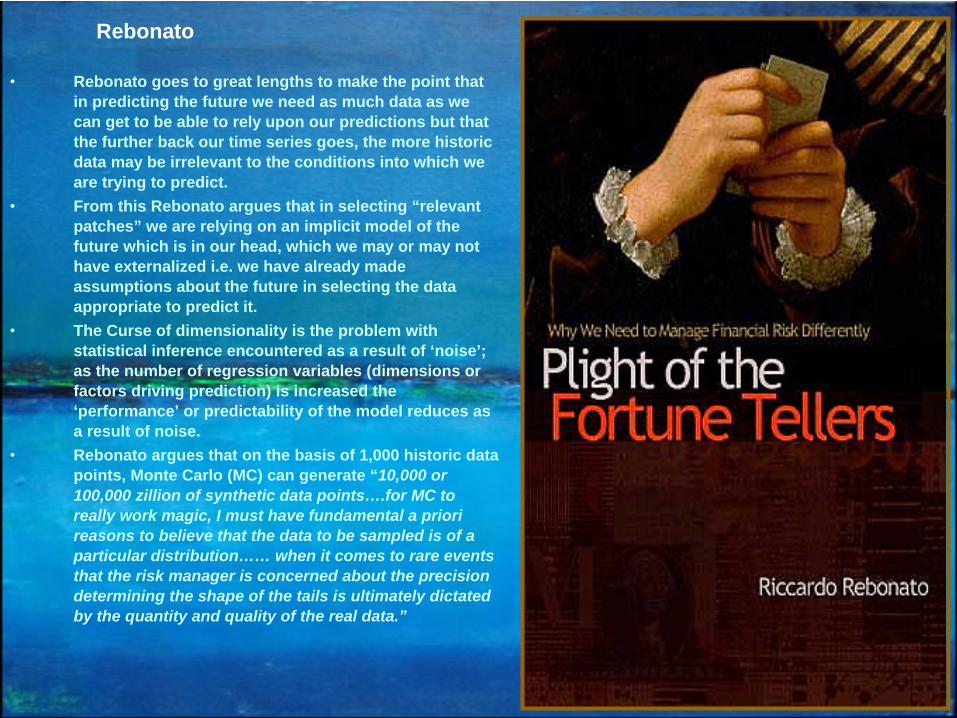
Rebonato goes to great lengths to make the point that in predicting the future we need as much data as we can get to be able to rely upon our predictions but that the further back our time series goes, the more historic data may be irrelevant to the conditions into which we are trying to predict.
•
From this Rebonato argues that in selecting “relevant patches” we are relying on an implicit model of the future which is in our head, which we may or may not have externalized i.e. we have already made assumptions about the future in selecting the data appropriate to predict it.
•
The Curse of dimensionality is the problem with statistical inference encountered as a result of ‘noise’; as the number of regression variables (dimensions or factors driving prediction) is increased the ‘performance’ or predictability of the model reduces as a result of noise.
•
Rebonato argues that on the basis of 1,000 historic data points, Monte Carlo (MC) can generate “10,000 or 100,000 zillion of synthetic data points….for MC to really work magic, I must have fundamental a priori reasons to believe that the data to be sampled is of a particular distribution…… when it comes to rare events that the risk manager is concerned about the precision determining the shape of the tails is ultimately dictated by the quantity and quality of the real data.”
Rebonato

21
STRESS TESTING
(SAP B2P2 WP re-visited)•
The correct approach, then, to Stress Testing Credit Economic Capital, is called Factor Modelling. This is consistent with the approach to Stress Testing outlined by BIS in the paper by Marco Sorge (2004).
•
Factor Modelling is the optimal approach to the Stress Test and the Basel II ICAAP; it models portfolios simply and tractably. It is a methodology which can be deployed by any type of Financial Institution within the governance processes required by BIS and CEBS for P2, supported by an appropriate Solution Architecture.

22
Fa
ct
or
Mo
de
ll
ing
-Re
gr
es
sio
n M
od
el
lin
g P
ro
ce
ss

23
•
Recently Factor Models have been developed to take account
of market prices as key indicators of risk. There is some
controversy here since this approach relies upon the seemingly
slightly tenuous idea that the market can price risk in a financial
institution or a corporate from an external perspective when
only that institution’s private and confidential internal data
should be able to support accurately and up to date prices of its
risk. “Do they know something we don’t?!”•
On the basis of Credit Default Swap (CDS) prices (spreads in
particular); repeated empirical testing of this proposition
(generally expressed in factor models) has demonstrated its
efficacy and validity and many theoretic explanations have
been presented in terms of the Factor Model’s latent variable .
The data, the ‘fit’
and the explanation all seem to add up and
there is movement towards general consensus that the CDS
price (both index and stock‐specific) is becoming a common
shared indicator of credit risk. Significant market developments
in loan pricing predicated upon CDS prices rather than LIBOR,
consequent upon the failure of the latter in the CC are good
evidence of this and further evidence of the application of
quantitative techniques in mainstream financial transactions.•
The proposition is that statistical modelling (using the Factor
Model) is possible based upon multiple default indicators (CDS
spreads) to drive out the latent variable scores , thus
quantifying risk economic capital. This type of factor analytic is
typical in other areas of applied statistical modelling that use
multiple observable indicators of the true (latent) endogenous
variable (risk).
1616
www.asymptotix.eu/ecap.pdf
Factor Models and Market (CDS) Prices

24
1717
Pricing Structured Portfolios•
If one is engaged in a process to consider the fair or market or
‘economic’
value of
Structured Products (Collateralized Debt Obligations (CDOs) etc) which is the challenge of
the moment, right now; then one has to start from a reliable (well researched) theoretical
standpoint. These ‘things’
are ‘tough customers’!•
In addition all the evidence points to the necessity of the most
advanced predictive analytic
computing power being at your disposal coupled with the most tractable and yet
disaggregated data management. After all is this not just what the banks did not deploy
before the crisis?•
These ‘structured assets’
are by definition ‘Level 3’
in IFRS7 terms and thus the valuation
philosophy of ‘mark to model’
must apply since no active reference market for such
securities exists in anyway globally. The question is what is the optimum model? This has to
be a model defined by practitioners (academic, supervisory or market participants) & in the
public domain.•
Little is known about how and why spreads of asset‐backed securities are influenced by
loan tranche characteristics. Default and recovery risk characteristics represent the most
important group in explaining loan spread variability. Marketability explains a significant
portion of the spreads’
variability but that factor is irrelevant to a current model, most of
the common pricing characteristics between ABS, MBS and CDO differ significantly.
Furthermore, applying the same pricing estimation model to each security class revealed
that most of the common pricing characteristics associated with these classes have a
different impact on the primary market spread exhibited by the value of the coefficients.•
The predominant industry approach to pricing and hedging CDOs
and tranched
index
products is known as the “copula.”
The version of the copula model most commonly used
for quotation purposes, is known as the “base correlation.”
A recent article on the Copula
in Wired magazine, was interesting in its depth (it had none!). The article was heavily
commented upon but it reflects a zero level understanding of the
Gaussian Copula which
then maybe reflects why "the wizards of wall street" got it so drastically wrong, its nothing
to do with the technique, its just that they did not understand 1) what it is for and 2) how it
does what it is for.

25
1818
The Argument for•
Commercial econometric software in the US started in Boston at the Massachusetts Institute of Technology (MIT), more specifically at the Center for Computational Research in Economics and Management Science.
•
In the 1970s, code developed at MIT was not really copyright protected; it was built to be shared with the FED and other universities.
•
Through the 60s and 70s various statistical modeling packages for economics were built particularly at Wharton, the University of Michigan and the University of Chicago (where the Cowles Commission had been located).
•
At Princeton the focus was on development of econometric models in FORTRAN. The use of FORTRAN is much declining now but Chris Sims, now at Princeton, who developed the VAR methodology in an applied manner and was at the forefront of RE in the 1970s now makes all his models freely available in R.
•
More and more econometricians are switching to the freely-available statistical system R. Free procedure libraries are available for R, http://www.r-project.org
, an Open Source statistical system which was initiated by statisticians Ross Ihaka
and Robert Gentleman.
So
lv
ing
th
e a
na
ly
tic
an
d t
ra
ns
pa
re
nc
y b
itNOT A HISTORY
LECTURE
THE YOUNG TURKS
ARE GOING TOWARDS
MACHINE LEARNING
& BATTLE ROOM
VISUALISATION
26
REvolution R Enterprise is Optimized
In addition to the performance optimizations included in all versions of REvolution R (http://revolution-computing.com/products/r- performance.php ), additional performance features are included in REvolution R Enterprise, such as ParallelR to significantly speed time to results in multiprocessor environments, including multicore workstations. The Cluster Edition extends ParallelR to include integration with scheduling systems, including full support for Windows HPC environments, and fault-tolerant processing, which enables your calculation to complete even if one or more of your worker nodes goes offline during processing. ParallelR detects the fault, and automatically re-routes the remaining computations to the surviving worker nodes. Read more about reducing computation times using ParallelR for parallel and distributed processing: http://revolution-computing.com/products/parallel-r.php
REvolution R Enterprise is Validated
The word "validation" has different meanings, depending upon the industry but for all products REvolution applies an extensive testing and build process within a controlled, documented, software development lifecycle. If you're looking for a platform for validated statistical analysis in a regulated environment such as life sciences and finance, consider Revolution R Enterprise for the stability and long-term support you'll require. Read more about running REvolution R Enterprise in a validated environment: http://revolution- computing.com/products/enterprise-validation.php

27
•
# Enhanced Script Editor
Hover-over help, word completion, find-across-files capability, automatic syntax checking, bookmarks, and navigation buttons.
� #
R Code Snippets
Automatically generate fill-in-the-blank sections of R code for a variety of analyses. Tooltip
help gives
guidance in filling out the snippet. R function authors can write their own code snippets to share with other users.
� # Object Browser
Allow users to see all the data and function objects that are available, including those in loaded and installed R packages. Context menus provide the capability to quickly edit and plot data or load a package.
� # Full-featured Visual Debugger
Debug R scripts, with step-in, step-over, and step-out capability, allowing users to inspect and modify R objects as they are debugging
REvolution R
Enterprise 3.0Productivity for R
Developers
28
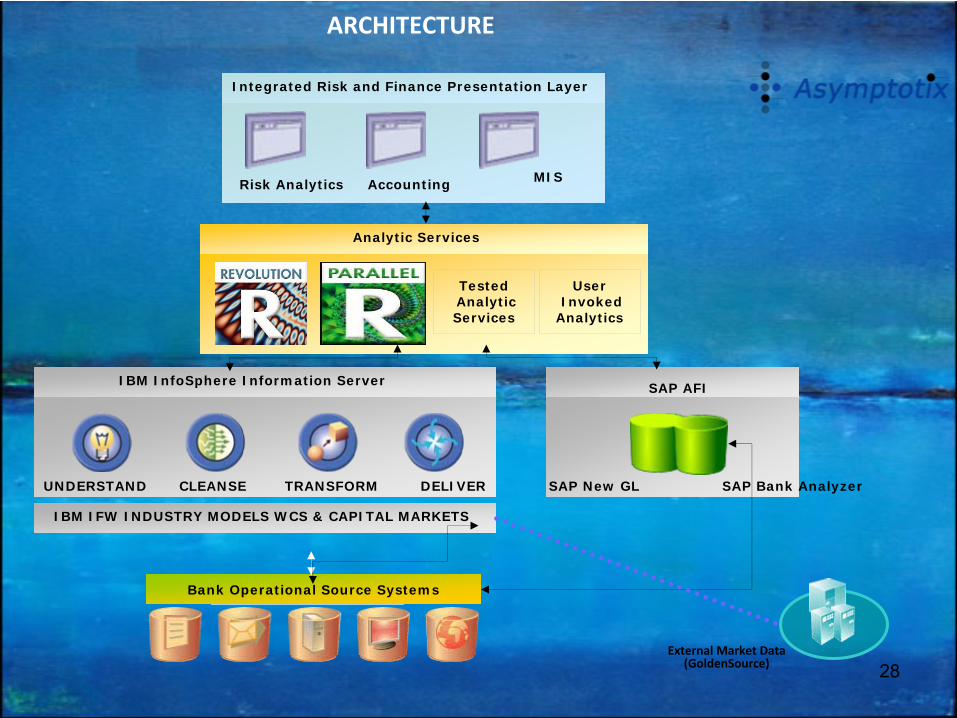
ARCHITECTURE
Risk Analytics MISAccounting
Integrated Risk and Finance Presentation Layer
Analytic Services
TestedAnalyticServices
UserInvoked
Analytics
SAP AFI
SAP New GL SAP Bank Analyzer
IBM InfoSphere Information Server
UNDERSTAND CLEANSE TRANSFORM
Bank Operational Source Systems
DELIVER
IBM IFW INDUSTRY MODELS WCS & CAPITAL MARKETS
External Market Data(GoldenSource)

29
The Fallout from the Credit Crisis
•
Source of the Credit Crisis was in large part
crucial failures in internal reporting and IT
systems which comply with “Transparency
Standards”
•
Bradford & Bingley, Northern Rock, UBS, Credit
Suisse; all referred this explicitly, in the public
domain as did Mervyn King (BoE Governor).
•
The Transparency Standards are being toughened
by the Governments worldwide, right now; to be
defined finally after the G20 in London in April
2009
•
Reviews of regulation in US and UK are
coordinated through the FSF (Financial Stability
Forum) driven by Gordon Brown (during lame
duck US presidency)
•
There is general consensus that the banks and
insurance companies never even met the
transparency standards in place in 2006. Now
they are being ‘enhanced’, ‘tightened’.
•
Instead of the rear mirror witch hunt which is
now in progress in the US, UK and Ireland, we
should be focused on practical steps which the
banks and governments can take immediately to
strengthen the banks and to ensure that a crisis
like this never happens again.

30
Hoggarth (Bank of England) Credit Risk Stress Test Process Model Factor framework

31
The Stress Basel II / IFRS7 Stress Test Use Case
Example: Interest rate Risk in the Banking Book
IRR future ECAP IRR positions described as per the BIS maturity ladder
Historic ECAP (Bank model) (Duration based)
ICU
CEOCRO
Supervisor
Stressed Macroeconomic data incorporated in IRR
Factor Model

32
Support for The ICU (The Internal Capital Unit)
•Environments: 4 main requirements–Modelling development environment
for quant use –Reporting environment for presentation
to C level execs–Data management –Support for Sub-Ledger Update–Support for Unit Tested Regression
Engines Updating BA/SL as ‘black boxes’.
•Components are as follows:–IBM InfoSphere Information Server
–
Data Management
Time Series Handling–RPro
Integrated with Information Server–Reporting Layer
(General Framework for XML
or HTTP render (Portal)–SAP Bank Analyzer (in the Sub-Ledger Role) [BA/SL].
UsersUsersComponentsComponents
ICUQuantitative
RiskAnalysts
RPro
CEOCROReporting
Layer
IBMInfo-
Server
Head of BU
SAPBank
AnalyzerSub
Ledgers

33
The Maturity Ladder {Asset/Liability Vector} (IRR) “Time Band” (Duration) determines the members of the Asset/Liability Vector
The Standardised Rate Shock – Calculation Steps
1.
The first step is to offset the longs and shorts in each time band, resulting in a single short or long position in each time band.
2.
The second step is to weight these resulting short and long positions by a factor that is designed to reflect the sensitivity of the positions in the different time bands to an assumed change in interest rates. The set of weighting factors for each time band is set out in Table 1 below. These factors are based on an assumed parallel shift of 200 basis points throughout the time spectrum, and on a proxy of modified duration of positions situated at the middle of each time band and yielding 5%.
3.
The third step is to sum these resulting weighted positions, offsetting longs and shorts, leading to the net short-
or long-
weighted position of the banking book in the given currency.
4.
The fourth step is to calculate the weighted position of the whole banking book by summing the net short-
and long-
weighted positions calculated for different currencies.
5.
The fifth step is to relate the weighted position of the whole banking book to capital.

34
The Factor Equation for IRR (Banking Book) John A Morrison version (this equation is not a published one)
•
g(IRR) = [Liability vector] * [Asset vector] * [Term structure] * [Yield curve]
* {Weighting Factors}
The Equation (Baseline)•
The Yield Curve defines the liability side (payments)•
The Term Structure defines the asset side (receivables)•
Yield is continuous, Term is discrete•
Risk is more concentrated on the Yield side (Yield is more Volatile)•
It is not inappropriate for the bank to apply weighting determinants to the factors, provided that these can be justified to the Supervisor
Stress testing:•
Term structure – uplift of 200 bps•
Term structure – twist (TR1, TR2)•
Yield curve – sharpened convexity (YC1), depleted convexity (YC2), downturn in yield curve (YC3)
•
1/1000 event (shock) is defined by joint instance of TRn / YCn
g = E.Cap

35
Levels of the fair value hierarchy
Level Characteristic Example
Level 1
Quoted prices in active markets for identical assets / liabilities (unadjusted); no blockage factors (i.e., Price X Quantity).
•
Listed equity / fixed income securities traded on an active exchange
•
Exchange traded derivatives
Level 2
Other observable inputs –
including quoted prices for similar assets / liabilities (adjusted) and market corroborated inputs; discounts for liquidity can be applied
•
OTC derivative with value based upon observable LIBOR forward interest rate curves
Level 3
Unobservable inputs –
entity’s own assumptions about market participant assumptions, including assumptions about risk, developed based on the best information available in the circumstances (subject to the cost-benefit constraint); may include the entity’s own data; discounts for liquidity can be applied
•
Private equity investment•
Intangible asset •
Long dated financial instrument

36www.asymptotix.eu 36
IFRS7 Solution ArchitectureNovember 2009John Morrison
AsymptotixVersion 2
IFRS 7 High Level Disclosure Requirements
Credit Risk: The risk that one party to a financial instrument will cause a financial loss for the other
party by failing to discharge an obligation.
Liquidity Risk: The risk that entity will encounter difficulty in meeting obligations associated with
financial liabilities.
Market Risk: The risk that the FV or future cash flow of a financial instrument will fluctuate because of
change in market prices •Currency Risk•Interest rate risk•Other price risk (Equity price risk,
commodity price risk, prepayment risk.)
37www.asymptotix.eu 37
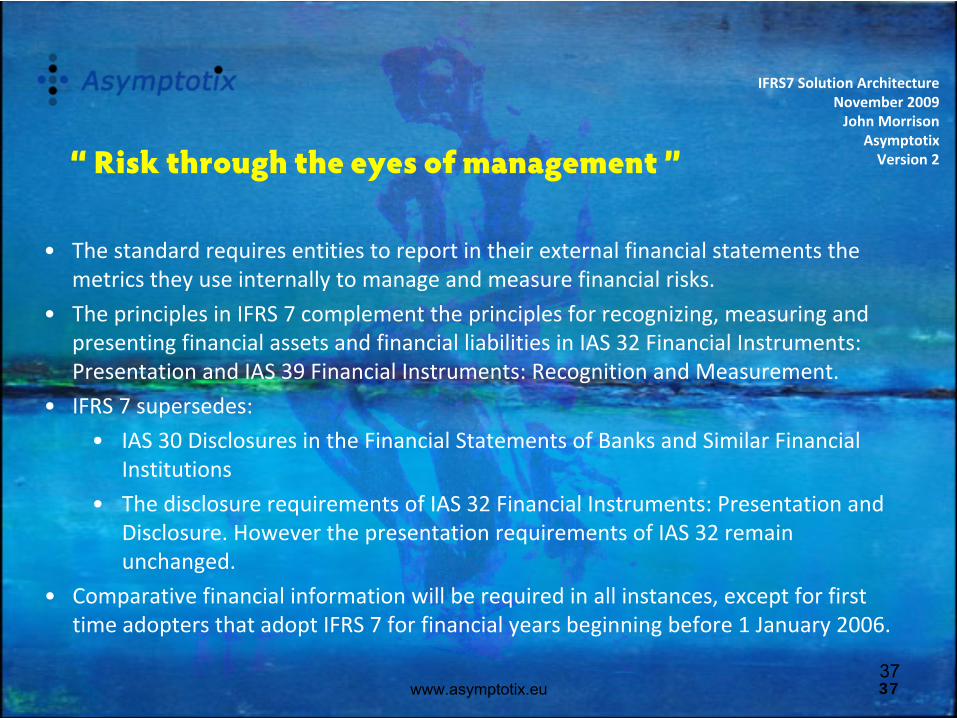
•
The standard requires entities to report in their external financial statements the
metrics they use internally to manage and measure financial risks.
•
The principles in IFRS 7 complement the principles for recognizing, measuring and
presenting financial assets and financial liabilities in IAS 32 Financial Instruments:
Presentation and IAS 39 Financial Instruments: Recognition and Measurement.
•
IFRS 7 supersedes:
•
IAS 30 Disclosures in the Financial Statements of Banks and Similar Financial
Institutions
•
The disclosure requirements of IAS 32 Financial Instruments: Presentation and
Disclosure. However the presentation requirements of IAS 32 remain
unchanged.
•
Comparative financial information will be required in all instances, except for first
time adopters that adopt IFRS 7 for financial years beginning before 1 January 2006.
IFRS7 Solution ArchitectureNovember 2009John Morrison
AsymptotixVersion 2“
Risk through the eyes of management ”

38
Basel II and IT Systems The Bank for International Settlements (2005)
•
The limitations in information technology that lie at the origin of the existing gaps in risk management systems have constrained both the elaboration of the corresponding concepts and their practical implementation.
•
The elaboration of the concepts naturally reflects the speed at which our understanding of fundamental valuation and risk measurement proceeds.
•
Implementation is more closely associated with the actual cost of elaborating the information, as determined by the cost of computational capacity and of putting in place the necessary organizational processes.
•
Risk measurement technology has made enormous strides over the last 30 years or so. The ability to price options represented a major breakthrough (Black and Scholes (1973)),
•
At the same time, the technology has not developed sufficiently to provide a coherent set of disclosures
•
Quite apart from the lack of consensus on the most appropriate methodologies,
•
There are still significant advances to be made in the aggregation of risks across apparently disparate categories, such as credit and liquidity risk.
•
the application of conceptual breakthroughs to the day-to-day risk management of firms is challenging the capital investments in the IT systems required to measure risk, and the associated human capital, can be costly.

39www.asymptotix.eu 39
IFRS7 Solution ArchitectureNovember 2009John Morrison
AsymptotixVersion 2
The IFRS 7 challenge in a Systems Context
DATA & TOOLSOVERLAP
LIQUIDITYREPORTING
40
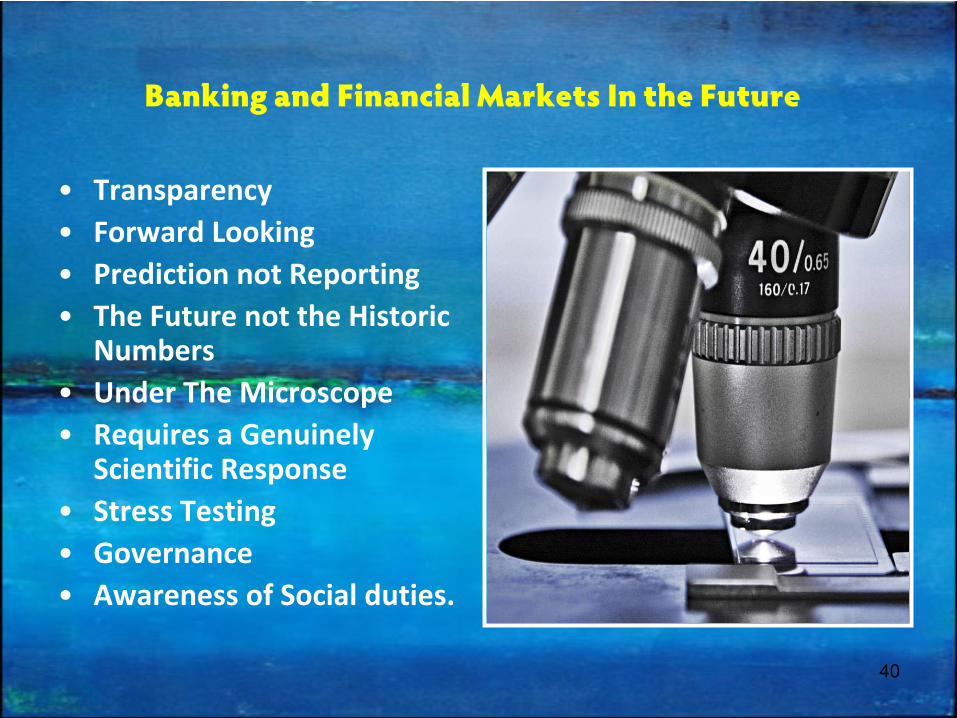
Banking and Financial Markets In the Future
•
Transparency•
Forward Looking
•
Prediction not Reporting•
The Future not the Historic
Numbers•
Under The Microscope
•
Requires a Genuinely Scientific Response
•
Stress Testing•
Governance
•
Awareness of Social duties.
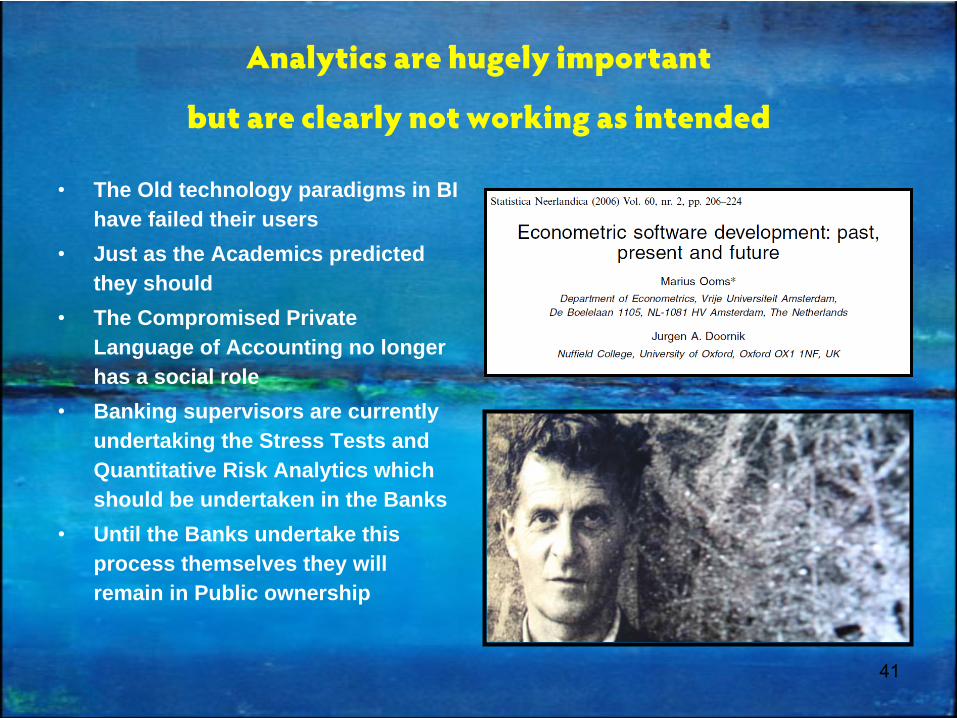
41
Analytics are hugely important
but are clearly not working as intended
•
The Old technology paradigms in BI have failed their users
•
Just as the Academics predicted they should
•
The Compromised Private Language of Accounting no longer has a social role
•
Banking supervisors are currently undertaking the Stress Tests and Quantitative Risk Analytics which should be undertaken in the Banks
•
Until the Banks undertake this process themselves they will remain in Public ownership

42
Business Intelligence and Predictive Analytics REvolution Computing = Predictive Analytics
Traditional Analytics1st
Generation Analytics (Query & Reporting)2nd
Generation Analytics (OLAP, Data Warehousing)
Advanced Analytics/Optimization
RulesPredictive Analytics
Real-time and traditional Data Mining
Stream AnalyticsReal-time, continuous, sequential analysis(ranging from basic to advanced analytics)
3rd-Generation BI
Predictive
Analytics

43
•
R is the modern choice for data analysis (e.g. New York Times article) & the consequent debate that article triggered
•
R has become the lingua franca of Predictive Analytics
•
All new talent in model development knows R.
•
R is inherently a Community based tool.
•
Community is the basis of culture today, in music, television and the arts, like it or not, it is what it is.
•
HPC for R and support for the technology are
necessary to set open source predictive analytics
to work in a "production" environment.
•
In some instances the predictive techniques are
so computing intensive that they require to run
for 10s of hours on a standard, even large scale
system rack, that is why predictive analytics
draws in the requirement for the High
Performance Computing (HPC) platform, which
means putting clusters of processers together in
parallel to run simultaneously at one problem
rather than running sequentially at several
problems.
•
R is designed by statisticians for
statisticians.
The implication is that it is not
designed by computer scientists, let alone HPC
experts.
•
It is crucial to retain the attention and
“affection”
of users, (stickiness in a way) to a
complex development environment like that
necessary for econometric modeling
•
R runs in serial if left to its own devices.
On
datasets where really compute intensive models
are applied it can simply run for hours or run out
of memory/crash or both.
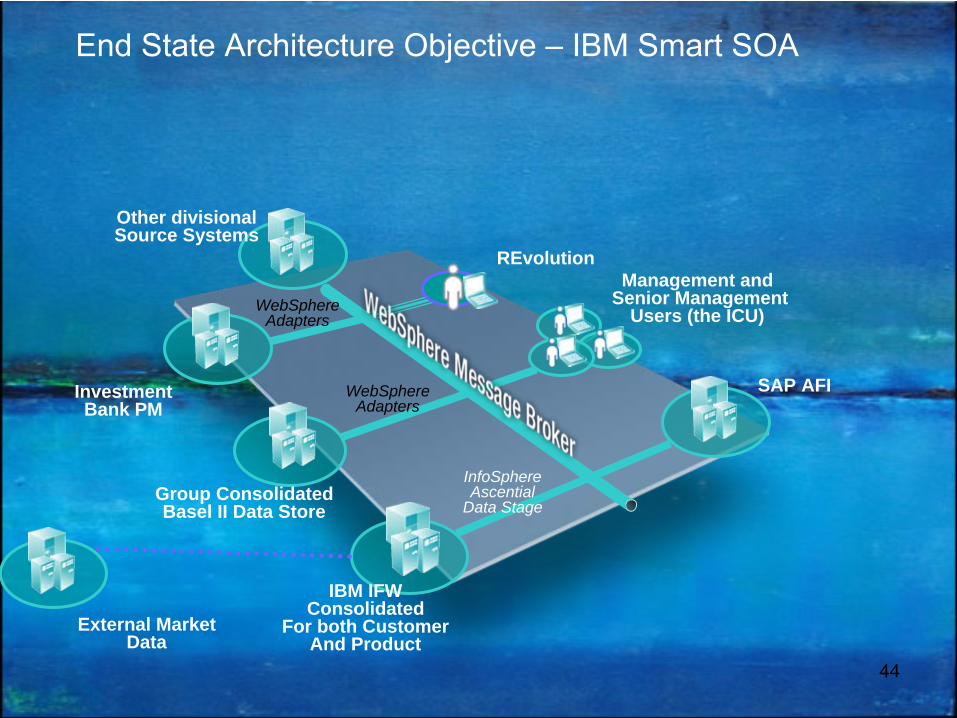
44
InvestmentBank PM
Group ConsolidatedBasel II Data Store
IBM IFWConsolidated
For both CustomerAnd Product
Management andSenior Management
Users (the ICU)WebSphere Adapters
InfoSphere Ascential
Data Stage
WebSphere Adapters
End State Architecture Objective –
IBM Smart SOA
External MarketData
SAP AFI
REvolution
Other divisionalSource Systems

45
Integration of REvolution Products with IBM InfoSphere Information Management
Risk Management RequirementsValuation & Risk Store
Credit Risk Exposure
Risk Control Quantification
Risk Scenario Generation & Stress Testing
IBM InfoSphere Information Server
UNDERSTAND TRANSFORM DELIVER
IBM Banking and Financial Market Models
CLEANSE

46www.asymptotix.eu
46
IFRS7 Solution ArchitectureNovember 2009John Morrison
AsymptotixVersion 2
Integration Proof of Concept-Technical overview

47
Comm
ent!

48
Questions?OUR
SINGLEBIGGESTWEBSITEHITEVER

49
appendices
For Q&A

50
Partners with w
hom w
e work w
hen givingR
isk Managem
ent andInstrum
ent Valuation A
dvice

51www.asymptotix.eu 51
Contact Asymptotix:
John Morrison+32 475 63 2991
or
Peter Lindmark+352 691 156 388
Artist (the background) –
Carmel Doherty

52