background documentation for AP-42 Section 9.9.1 … 2003 Emission Factor Documentation for AP-42...
369
April 2003 Emission Factor Documentation for AP-42 Section 9.9.1 Grain Elevators and Grain Processing Plants Final Report Prepared for U. S. Environmental Protection Agency Office of Air Quality Planning and Standards Emission Factors and Inventory Group Research Triangle Park, NC 27711 RTI Project No. 08775.000 Prepared by RTI International 3040 Cornwallis Road Research Triangle Park, NC 27709
Transcript of background documentation for AP-42 Section 9.9.1 … 2003 Emission Factor Documentation for AP-42...
April 2003
Emission Factor Documentation for AP-42Section 9.9.1
Grain Elevators and Grain Processing Plants
Final Report
Prepared for
U. S. Environmental Protection AgencyOffice of Air Quality Planning and Standards
Emission Factors and Inventory GroupResearch Triangle Park, NC 27711
RTI Project No. 08775.000
Prepared by
RTI International3040 Cornwallis Road
Research Triangle Park, NC 27709

April 2003
Emission Factor Documentation for AP-42Section 9.9.1
Grain Elevators and Grain Processing Plants
Final Report
Prepared for
U. S. Environmental Protection AgencyOffice of Air Quality Planning and Standards
Emission Factors and Inventory GroupResearch Triangle Park, NC 27711
Attn: Mr. Dallas Safriet (MD-14)
RTI Project No. 08775.000
Prepared by
RTI International3040 Cornwallis Road
Research Triangle Park, NC 27709
ii
NOTICE
The information in this document has been funded wholly or in part by the National Feed andGrain Association for the U. S. Environmental Protection Agency under Project Number 08775.000 toRTI International. It has been reviewed by the Office of Air Quality Planning and Standards, U. S.Environmental Protection Agency, and has been approved for publication. Mention of trade names orcommercial products does not constitute endorsement or recommendation for use.
iii
Table of Contents
Section Page
1.0 Introduction . . . . . . . . . . . . . . . . . . . . . . . . . . . . . . . . . . . . . . . . . . . . . . . . . . . . . . . . . . . . . . . . . 1-1
2.0 Industry Description . . . . . . . . . . . . . . . . . . . . . . . . . . . . . . . . . . . . . . . . . . . . . . . . . . . . . . . . . . 2-12.1 Industry Characterization . . . . . . . . . . . . . . . . . . . . . . . . . . . . . . . . . . . . . . . . . . . . . . . . 2-1
2.1.1 Grains and Their Uses . . . . . . . . . . . . . . . . . . . . . . . . . . . . . . . . . . . . . . . . . . . 2-12.1.2 Grain Elevators . . . . . . . . . . . . . . . . . . . . . . . . . . . . . . . . . . . . . . . . . . . . . . . . . 2-32.1.3 Grain Milling and Processing Industry . . . . . . . . . . . . . . . . . . . . . . . . . . . . . . . 2-7
2.2 Process Description . . . . . . . . . . . . . . . . . . . . . . . . . . . . . . . . . . . . . . . . . . . . . . . . . . . . 2-92.2.1 Grain Elevators . . . . . . . . . . . . . . . . . . . . . . . . . . . . . . . . . . . . . . . . . . . . . . . . . 2-92.2.2 Grain Milling and Processing . . . . . . . . . . . . . . . . . . . . . . . . . . . . . . . . . . . . . 2-13
2.3 Emissions . . . . . . . . . . . . . . . . . . . . . . . . . . . . . . . . . . . . . . . . . . . . . . . . . . . . . . . . . . . 2-322.3.1 Grain Elevators . . . . . . . . . . . . . . . . . . . . . . . . . . . . . . . . . . . . . . . . . . . . . . . . 2-332.3.2 Grain Milling and Processing . . . . . . . . . . . . . . . . . . . . . . . . . . . . . . . . . . . . . 2-36
2.4 Emission Control Technology . . . . . . . . . . . . . . . . . . . . . . . . . . . . . . . . . . . . . . . . . . . 2-412.5 References for Section 2 . . . . . . . . . . . . . . . . . . . . . . . . . . . . . . . . . . . . . . . . . . . . . . . 2-45
3.0 General Data Review and Analysis Procedures . . . . . . . . . . . . . . . . . . . . . . . . . . . . . . . . . . . . . 3-13.1 Literature Search and Screening . . . . . . . . . . . . . . . . . . . . . . . . . . . . . . . . . . . . . . . . . . 3-13.2 Data Quality Rating System . . . . . . . . . . . . . . . . . . . . . . . . . . . . . . . . . . . . . . . . . . . . . . 3-23.3 Emission Factor Quality Rating System . . . . . . . . . . . . . . . . . . . . . . . . . . . . . . . . . . . . 3-33.4 Reference for Section 3 . . . . . . . . . . . . . . . . . . . . . . . . . . . . . . . . . . . . . . . . . . . . . . . . . 3-3
4.0 AP-42 Section Development . . . . . . . . . . . . . . . . . . . . . . . . . . . . . . . . . . . . . . . . . . . . . . . . . . . . 4-14.1 Review of Specific Data Sets . . . . . . . . . . . . . . . . . . . . . . . . . . . . . . . . . . . . . . . . . . . . 4-1
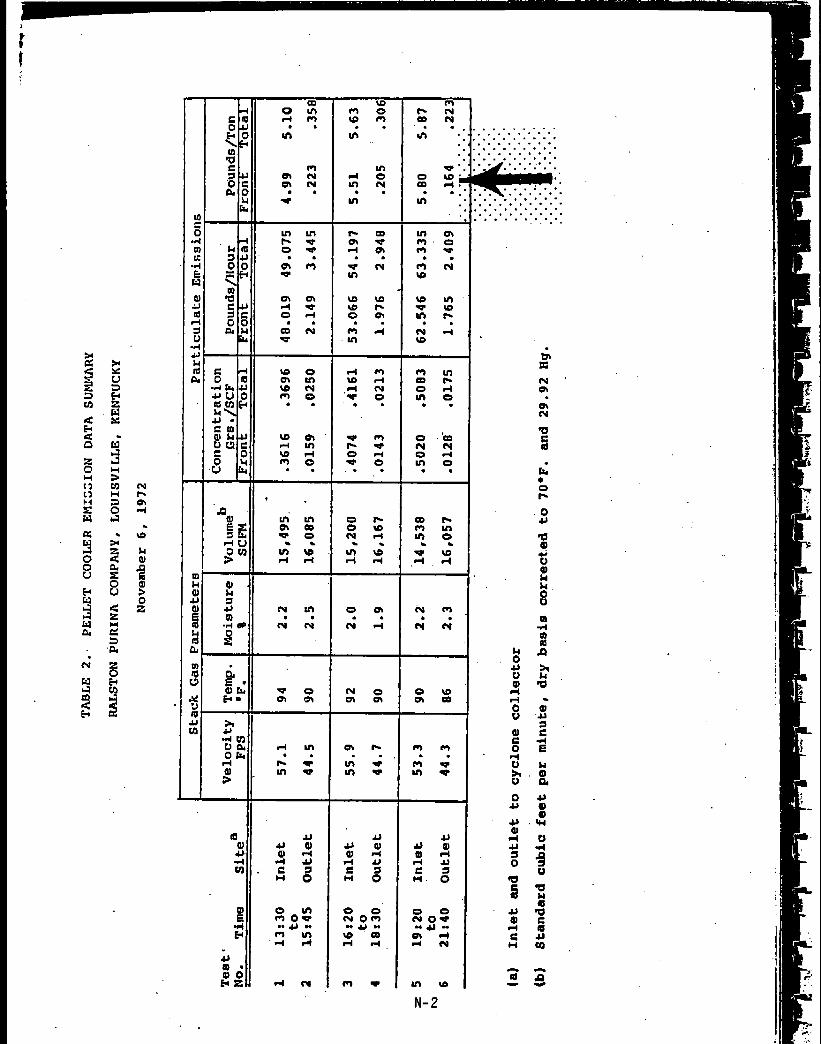
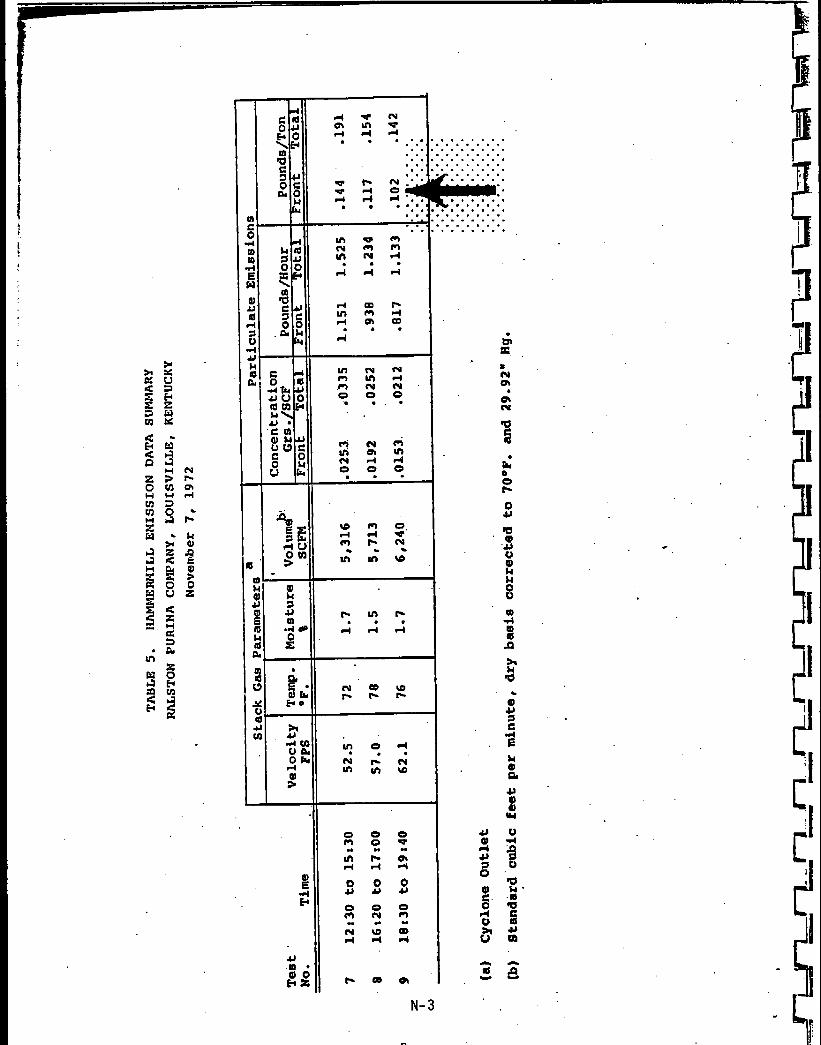
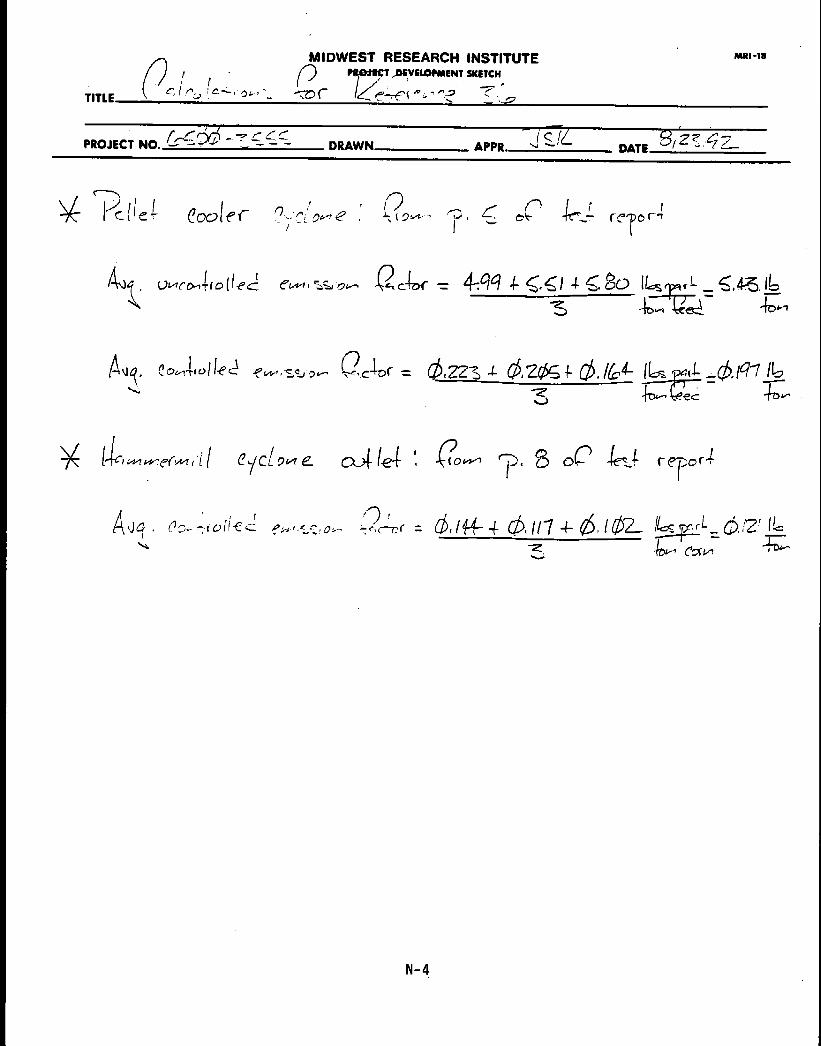
4.1.1 Reference 4 (1987) . . . . . . . . . . . . . . . . . . . . . . . . . . . . . . . . . . . . . . . . . . . . . . 4-24.1.2 References 6, 10, and 12 (1984, 1979, and 1978) . . . . . . . . . . . . . . . . . . . . . . 4-44.1.3 Reference 11 (1979) . . . . . . . . . . . . . . . . . . . . . . . . . . . . . . . . . . . . . . . . . . . . . 4-74.1.4 Reference 22 (1976) . . . . . . . . . . . . . . . . . . . . . . . . . . . . . . . . . . . . . . . . . . . . . 4-74.1.5 Reference 23 (1976) . . . . . . . . . . . . . . . . . . . . . . . . . . . . . . . . . . . . . . . . . . . . . 4-84.1.6 Reference 25 (1976) . . . . . . . . . . . . . . . . . . . . . . . . . . . . . . . . . . . . . . . . . . . . . 4-84.1.7 Reference 26 (1975) . . . . . . . . . . . . . . . . . . . . . . . . . . . . . . . . . . . . . . . . . . . . . 4-94.1.8 Reference 27 (1974) . . . . . . . . . . . . . . . . . . . . . . . . . . . . . . . . . . . . . . . . . . . . 4-104.1.9 Reference 33 (1974) . . . . . . . . . . . . . . . . . . . . . . . . . . . . . . . . . . . . . . . . . . . . 4-114.1.10 Reference 35 (1974) . . . . . . . . . . . . . . . . . . . . . . . . . . . . . . . . . . . . . . . . . . . . 4-124.1.11 Reference 36 (1973) . . . . . . . . . . . . . . . . . . . . . . . . . . . . . . . . . . . . . . . . . . . . 4-124.1.12 Reference 37 (1973) . . . . . . . . . . . . . . . . . . . . . . . . . . . . . . . . . . . . . . . . . . . . 4-124.1.13 Reference 38 (1972) . . . . . . . . . . . . . . . . . . . . . . . . . . . . . . . . . . . . . . . . . . . . 4-134.1.14 Reference 39 (1972) . . . . . . . . . . . . . . . . . . . . . . . . . . . . . . . . . . . . . . . . . . . . 4-144.1.15 Reference 40 (1972) . . . . . . . . . . . . . . . . . . . . . . . . . . . . . . . . . . . . . . . . . . . . 4-144.1.16 Reference 41 (1972) . . . . . . . . . . . . . . . . . . . . . . . . . . . . . . . . . . . . . . . . . . . . 4-154.1.17 Reference 42 (1972) . . . . . . . . . . . . . . . . . . . . . . . . . . . . . . . . . . . . . . . . . . . . 4-164.1.18 Reference 43 (1972) . . . . . . . . . . . . . . . . . . . . . . . . . . . . . . . . . . . . . . . . . . . . 4-174.1.19 Reference 46 (1982) . . . . . . . . . . . . . . . . . . . . . . . . . . . . . . . . . . . . . . . . . . . . 4-174.1.20 Reference 47 (1992) . . . . . . . . . . . . . . . . . . . . . . . . . . . . . . . . . . . . . . . . . . . . 4-194.1.21 Reference 48 (1993) . . . . . . . . . . . . . . . . . . . . . . . . . . . . . . . . . . . . . . . . . . . . 4-204.1.22 Reference 49 (1974) . . . . . . . . . . . . . . . . . . . . . . . . . . . . . . . . . . . . . . . . . . . . 4-21
Table of Contents (continued)
Section Page
iv
4.1.23 Reference 53 (1983) . . . . . . . . . . . . . . . . . . . . . . . . . . . . . . . . . . . . . . . . . . . . 4-224.1.24 Reference 54 (1992) . . . . . . . . . . . . . . . . . . . . . . . . . . . . . . . . . . . . . . . . . . . . 4-234.1.25 Reference 56 (1994) . . . . . . . . . . . . . . . . . . . . . . . . . . . . . . . . . . . . . . . . . . . . 4-234.1.26 Reference 57 (1994) . . . . . . . . . . . . . . . . . . . . . . . . . . . . . . . . . . . . . . . . . . . . 4-244.1.27 Reference 58 (1994) . . . . . . . . . . . . . . . . . . . . . . . . . . . . . . . . . . . . . . . . . . . . 4-254.1.28 Reference 60 (1996) . . . . . . . . . . . . . . . . . . . . . . . . . . . . . . . . . . . . . . . . . . . . 4-264.1.29 Reference 61 (1997) . . . . . . . . . . . . . . . . . . . . . . . . . . . . . . . . . . . . . . . . . . . . 4-274.1.30 Reference 67 (1995) . . . . . . . . . . . . . . . . . . . . . . . . . . . . . . . . . . . . . . . . . . . . 4-284.1.31 Reference 68 (1991) . . . . . . . . . . . . . . . . . . . . . . . . . . . . . . . . . . . . . . . . . . . . 4-294.1.32 Reference 69 (1996) . . . . . . . . . . . . . . . . . . . . . . . . . . . . . . . . . . . . . . . . . . . . 4-294.1.33 Reference 70 (2001) . . . . . . . . . . . . . . . . . . . . . . . . . . . . . . . . . . . . . . . . . . . . 4-30
4.2 Review of Existing Emission Factors . . . . . . . . . . . . . . . . . . . . . . . . . . . . . . . . . . . . . 4-304.3 Development of Candidate Emission Factors . . . . . . . . . . . . . . . . . . . . . . . . . . . . . . . 4-31
4.3.1 Data Analysis for Total Particulate Matter . . . . . . . . . . . . . . . . . . . . . . . . . . . 4-314.3.2 Particle Size Data Analysis . . . . . . . . . . . . . . . . . . . . . . . . . . . . . . . . . . . . . . . 4-354.3.3 Candidate Emission Factor Development . . . . . . . . . . . . . . . . . . . . . . . . . . . . 4-36
5.0 Proposed AP-42 Section 9.9.1 . . . . . . . . . . . . . . . . . . . . . . . . . . . . . . . . . . . . . . . . . . . . . . . . . . 5-1
Appendices
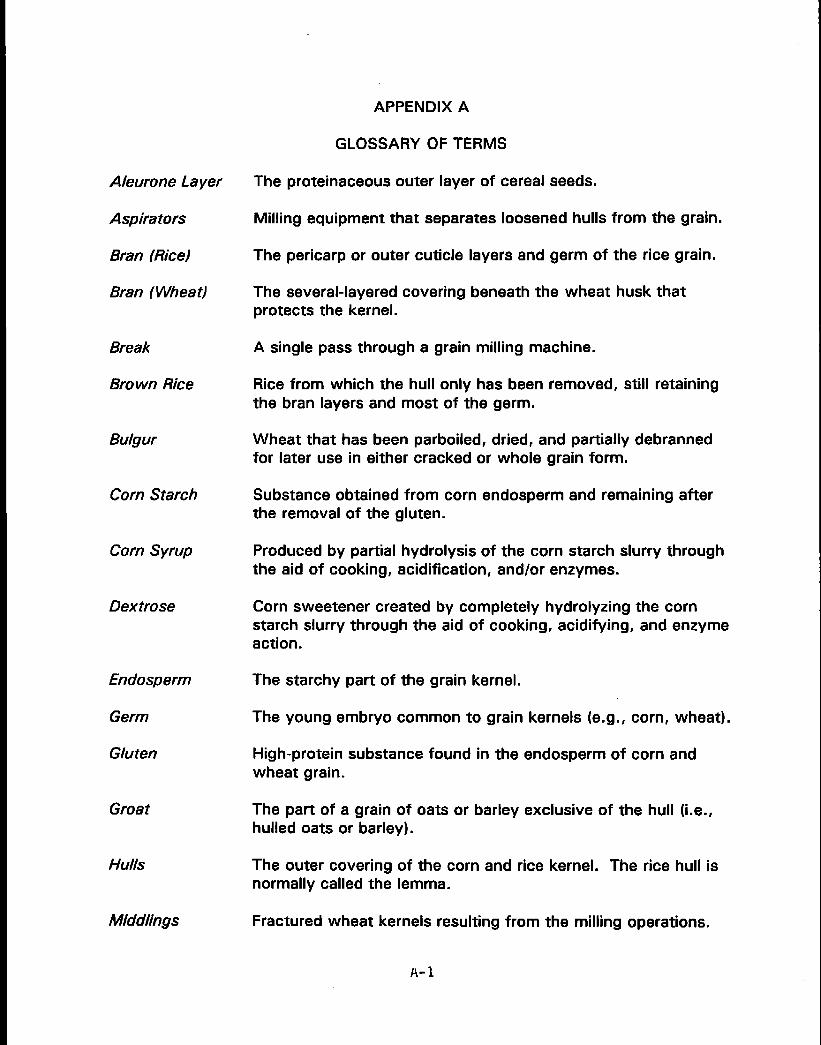
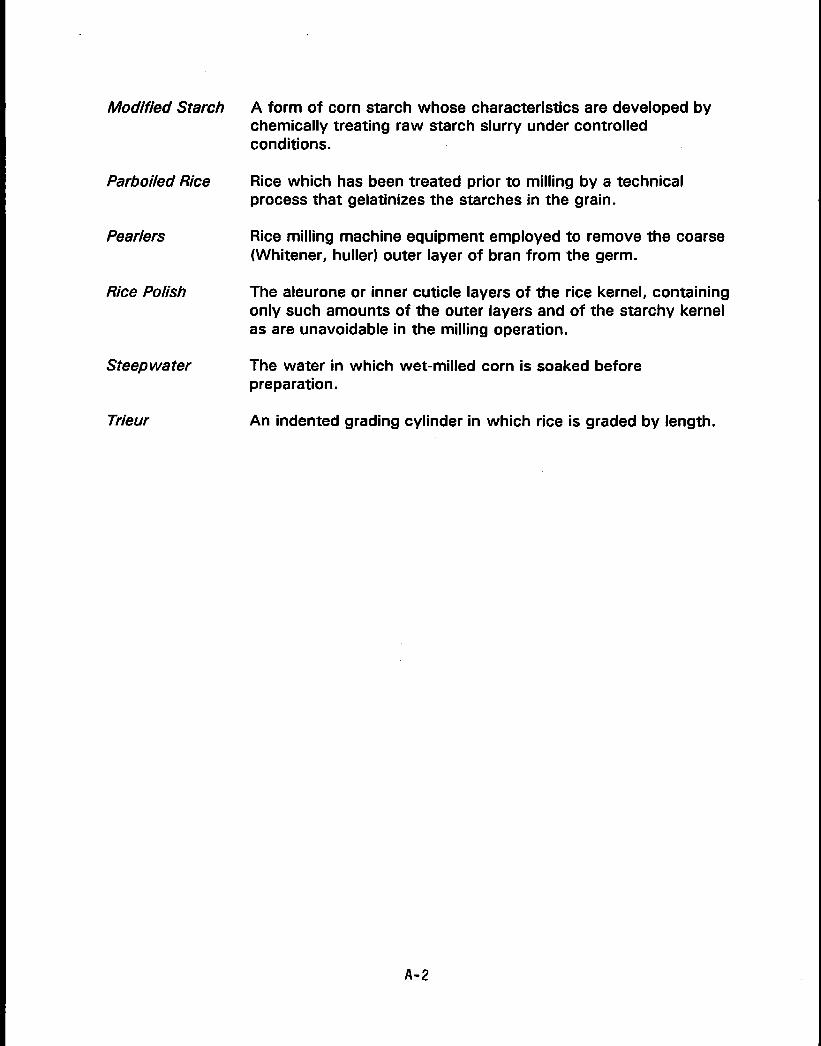
A Glossary of Terms . . . . . . . . . . . . . . . . . . . . . . . . . . . . . . . . . . . . . . . . . . . . . . . . . . . . . . . . . A-1
B Report Excerpts and Calculations for Reference 4 . . . . . . . . . . . . . . . . . . . . . . . . . . . . . . . . B-1
C Report Excerpts from References 6, 10, and 12 . . . . . . . . . . . . . . . . . . . . . . . . . . . . . . . . . . C-1
D Report Excerpts from Reference 11 . . . . . . . . . . . . . . . . . . . . . . . . . . . . . . . . . . . . . . . . . . . . D-1
E Report Excerpts from Reference 18 . . . . . . . . . . . . . . . . . . . . . . . . . . . . . . . . . . . . . . . . . . . . E-1
F Report Excerpts from Reference 22 . . . . . . . . . . . . . . . . . . . . . . . . . . . . . . . . . . . . . . . . . . . . . F-1
G Report Excerpts from Reference 25 . . . . . . . . . . . . . . . . . . . . . . . . . . . . . . . . . . . . . . . . . . . . G-1
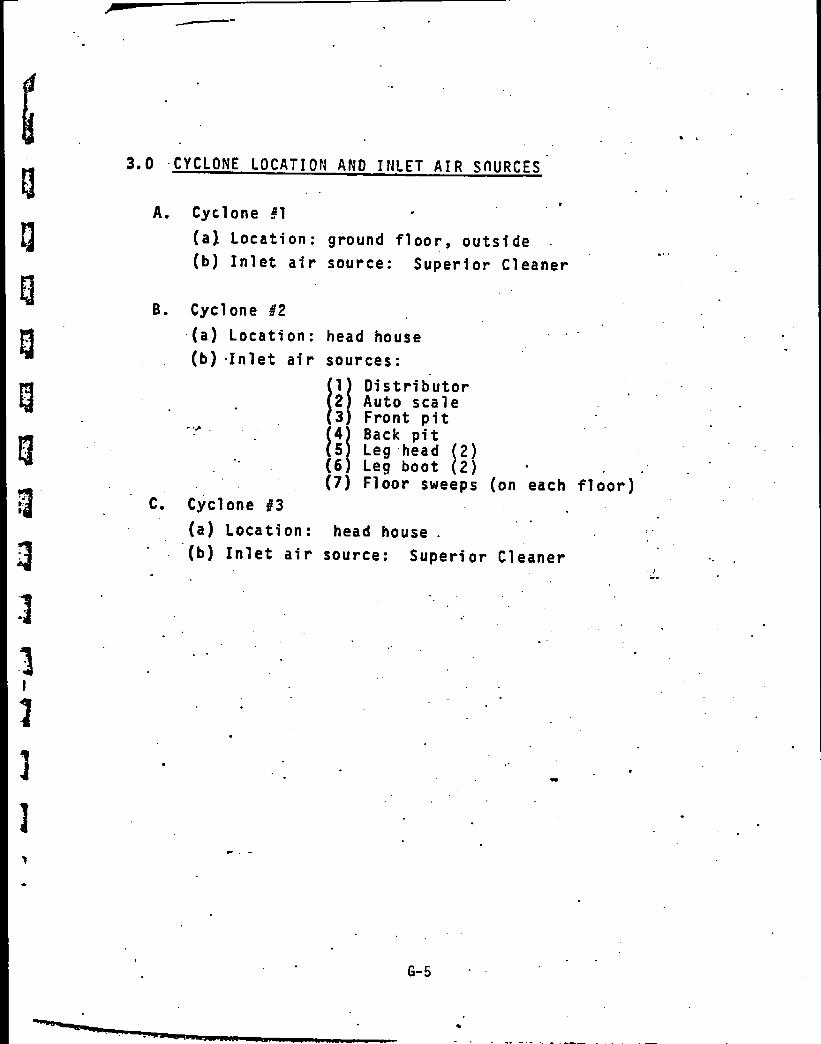
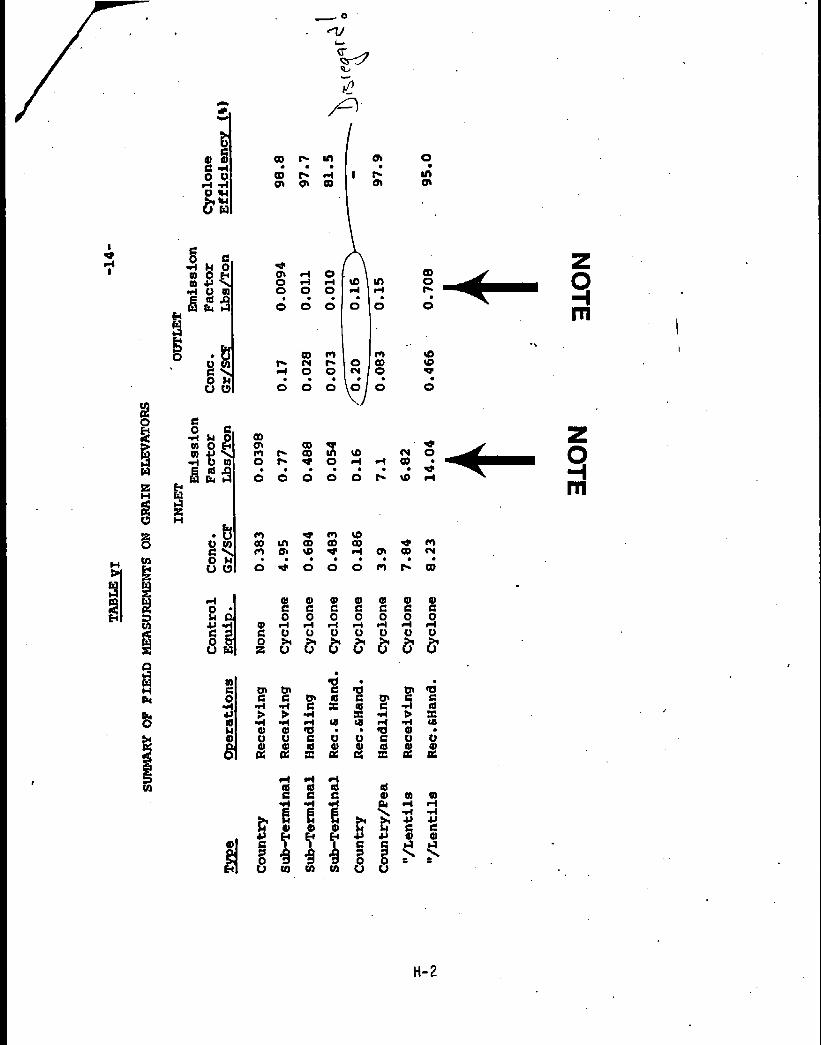
H Report Excerpts and Calculations for Reference 26 . . . . . . . . . . . . . . . . . . . . . . . . . . . . . . . H-1
I Report Excerpts and Calculations for Reference 27 . . . . . . . . . . . . . . . . . . . . . . . . . . . . . . . . I-1
J Report Excerpts and Calculations for Reference 33 . . . . . . . . . . . . . . . . . . . . . . . . . . . . . . . . J-1
K Report Excerpts from Reference 35 . . . . . . . . . . . . . . . . . . . . . . . . . . . . . . . . . . . . . . . . . . . . K-1
L Report Excerpts and Calculations for Reference 36 . . . . . . . . . . . . . . . . . . . . . . . . . . . . . . . L-1
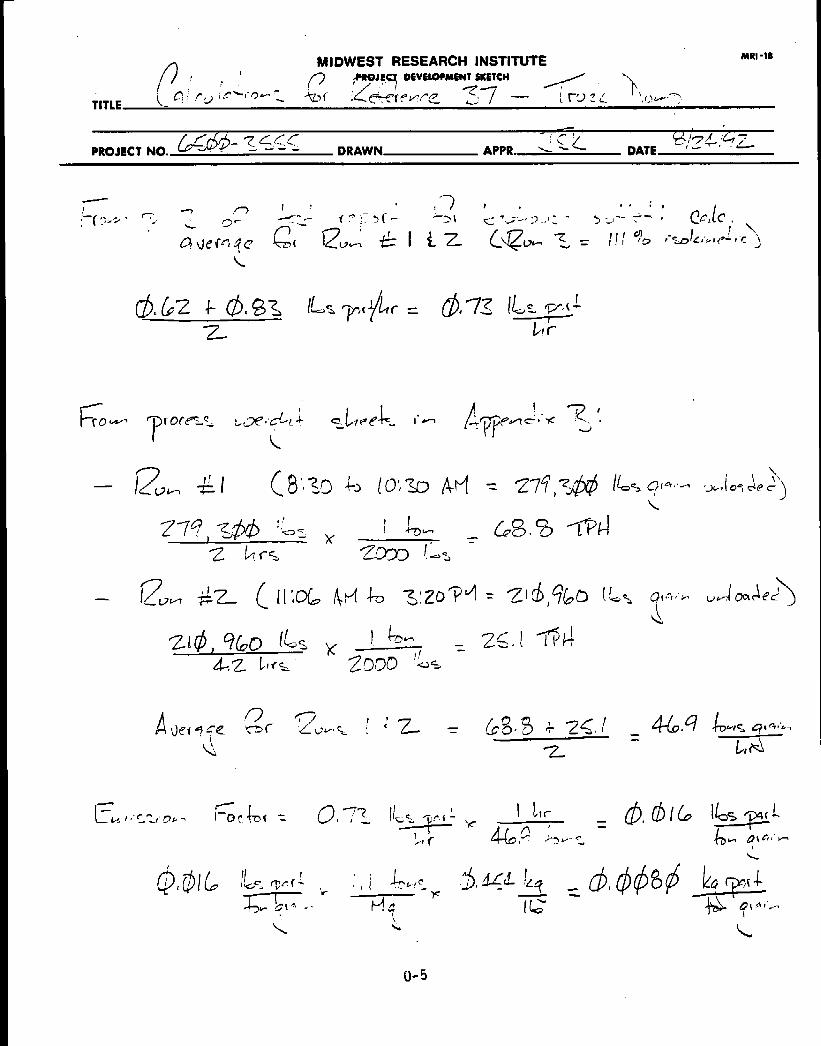
M Report Excerpts from Reference 37 . . . . . . . . . . . . . . . . . . . . . . . . . . . . . . . . . . . . . . . . . . . . M-1
N Report Excerpts and Calculations for Reference 38 . . . . . . . . . . . . . . . . . . . . . . . . . . . . . . . N-1
O Report Excerpts and Calculations for Reference 39 . . . . . . . . . . . . . . . . . . . . . . . . . . . . . . . O-1
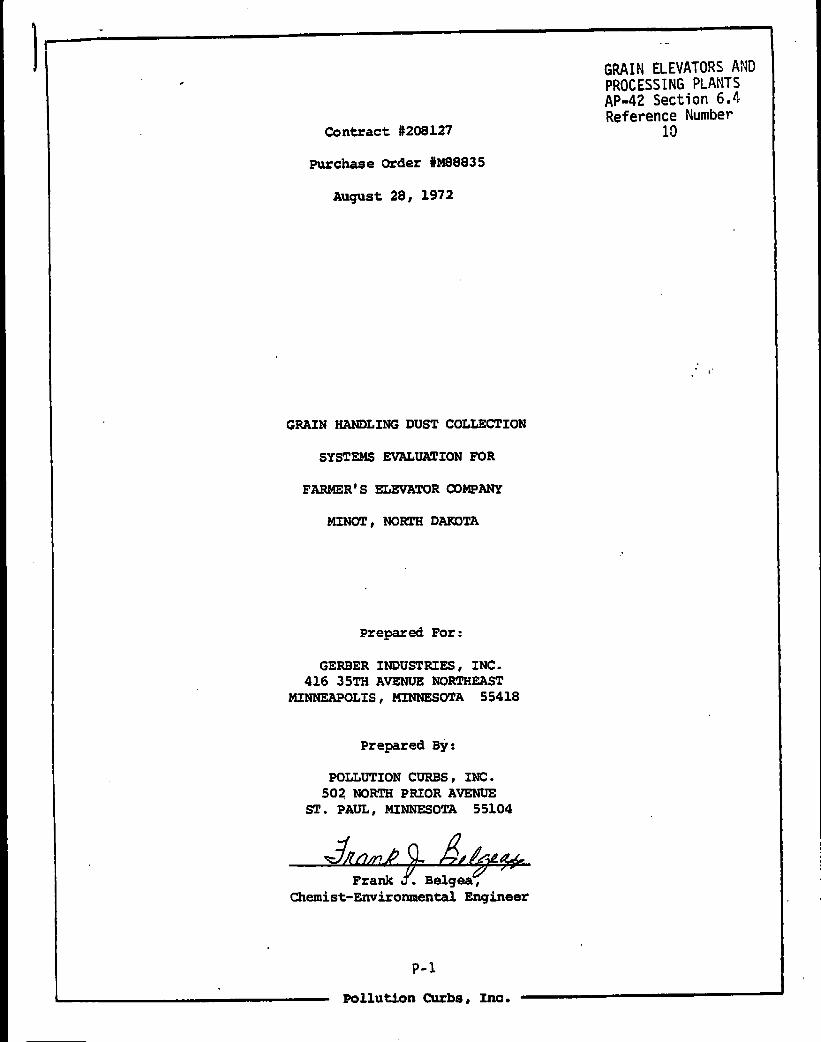
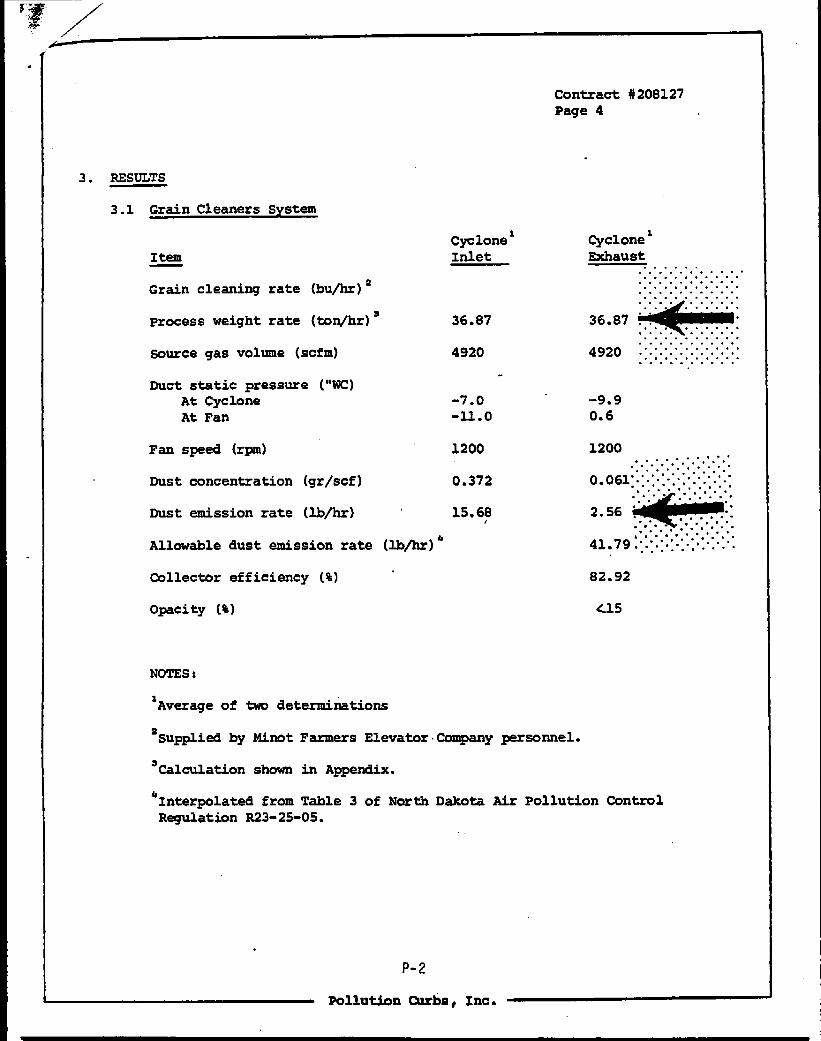
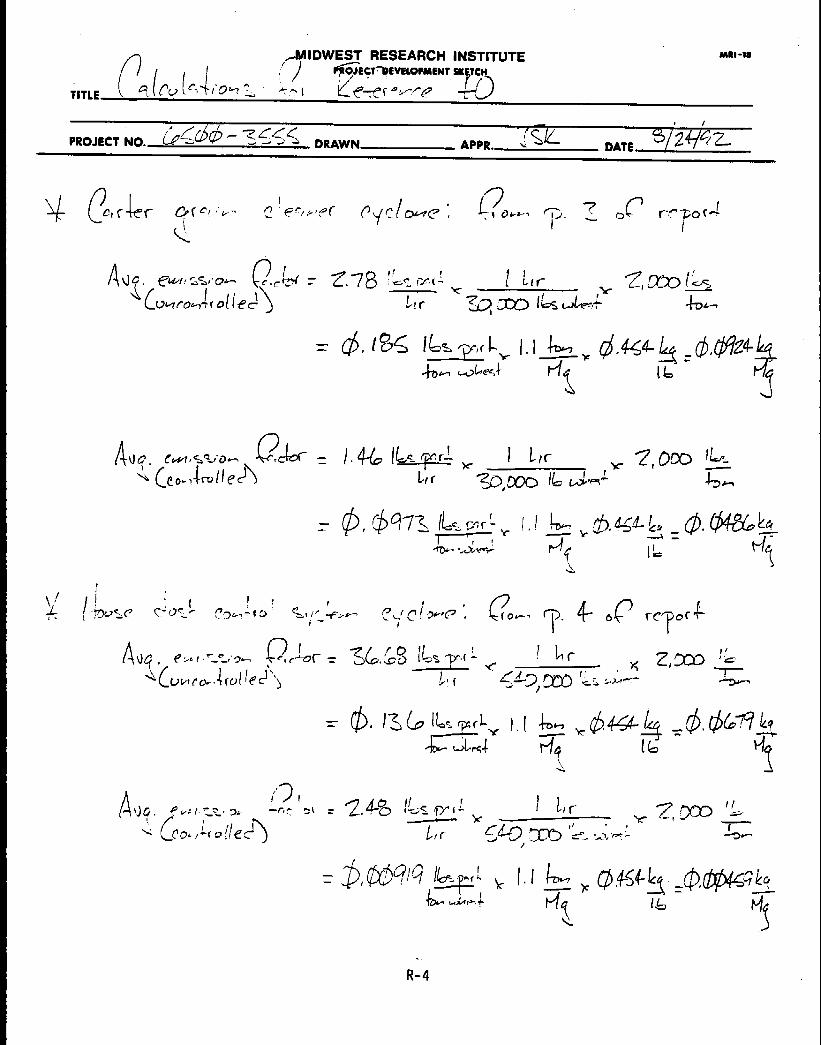
P Report Excerpts from Reference 40 . . . . . . . . . . . . . . . . . . . . . . . . . . . . . . . . . . . . . . . . . . . . . P-1
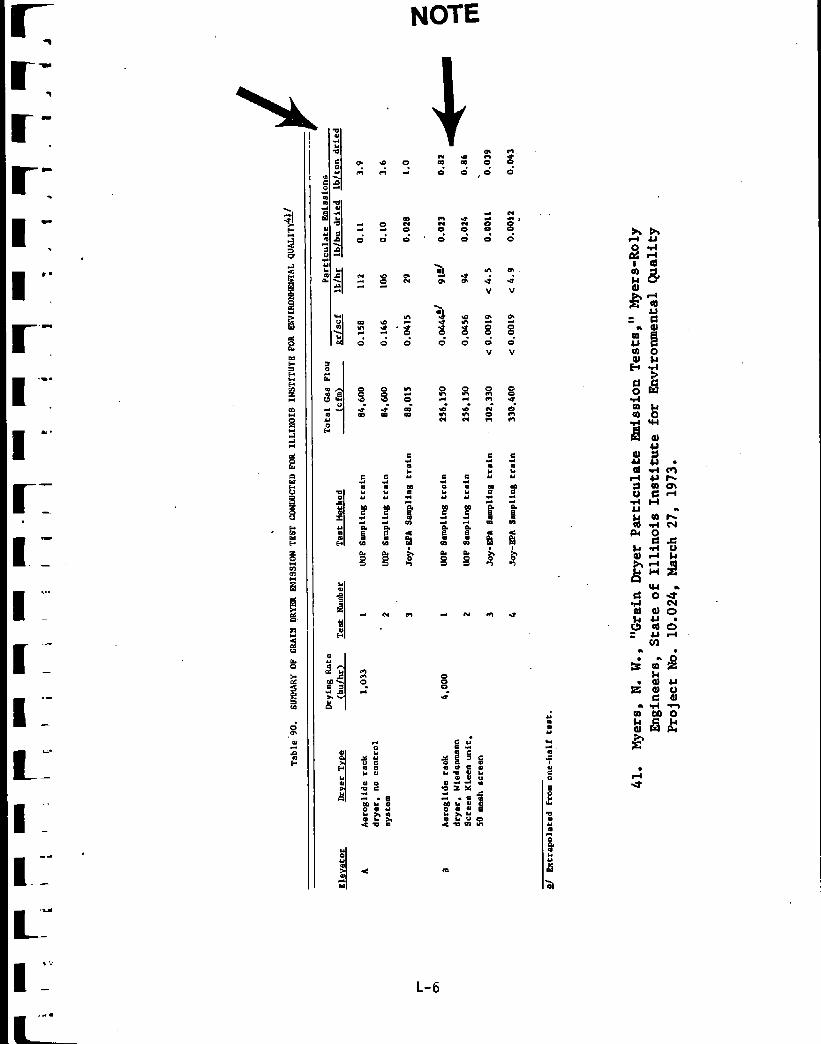
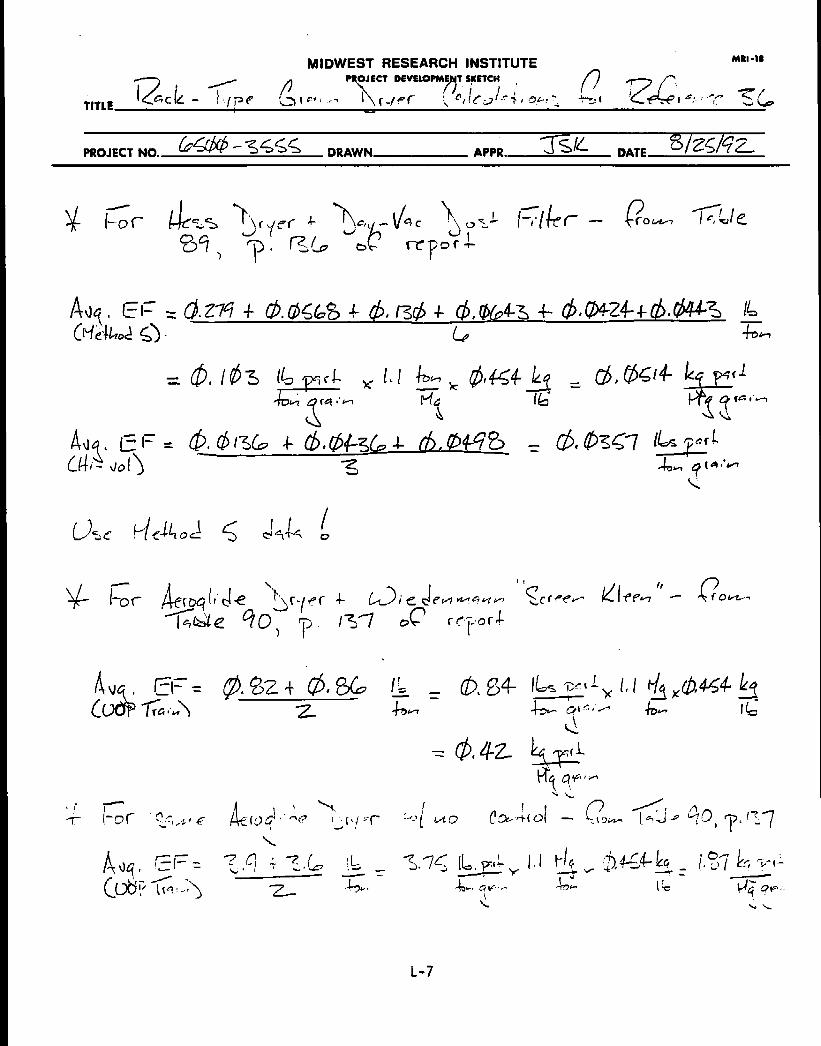
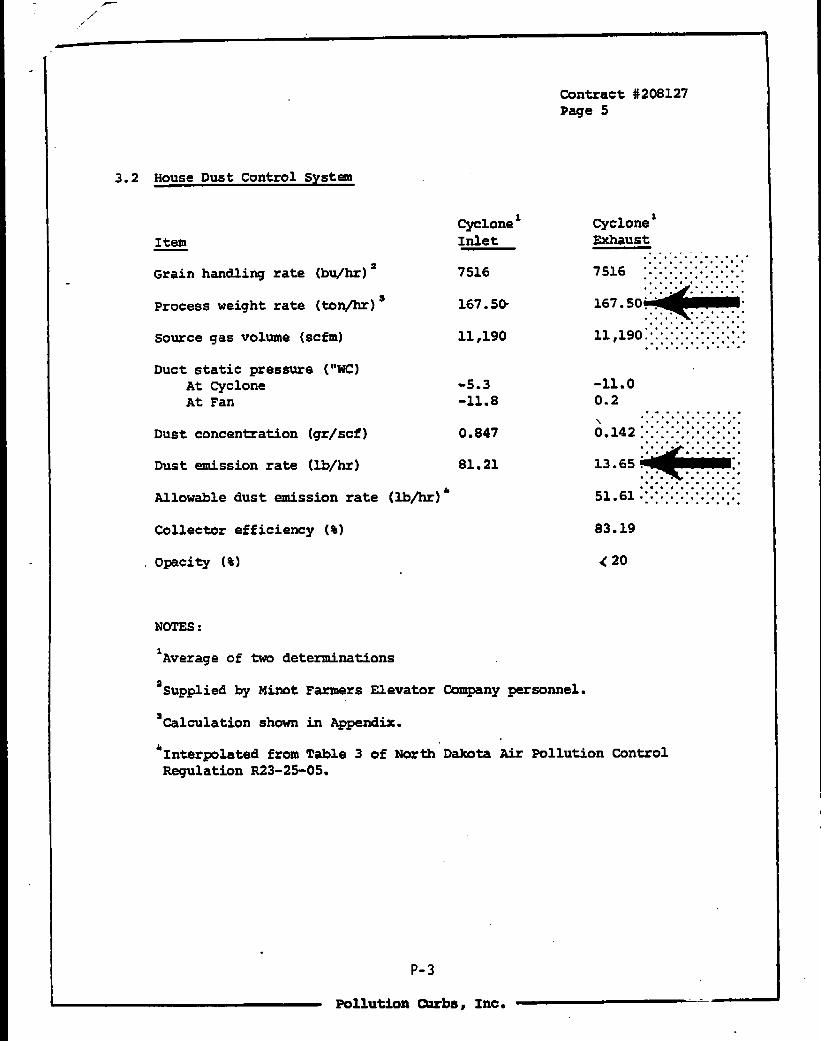
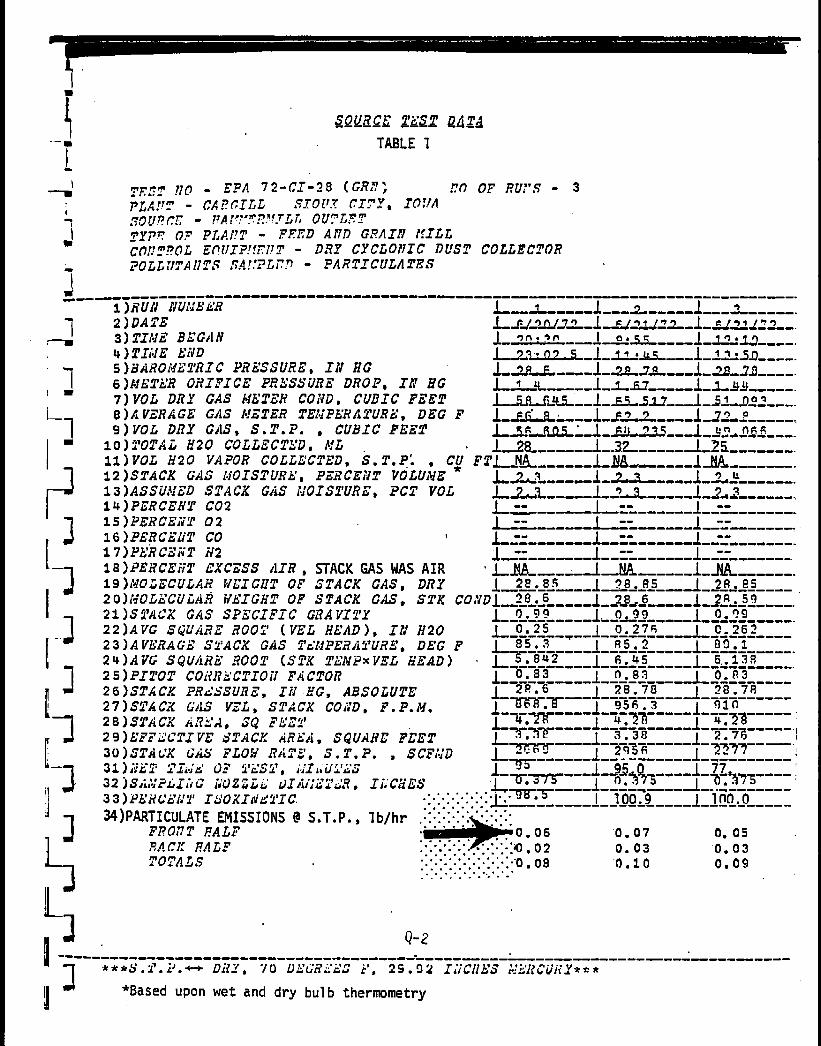
Q Report Excerpts and Calculations for Reference 41 . . . . . . . . . . . . . . . . . . . . . . . . . . . . . . . Q-1
R Report Excerpts and Calculations for Reference 42 . . . . . . . . . . . . . . . . . . . . . . . . . . . . . . . R-1
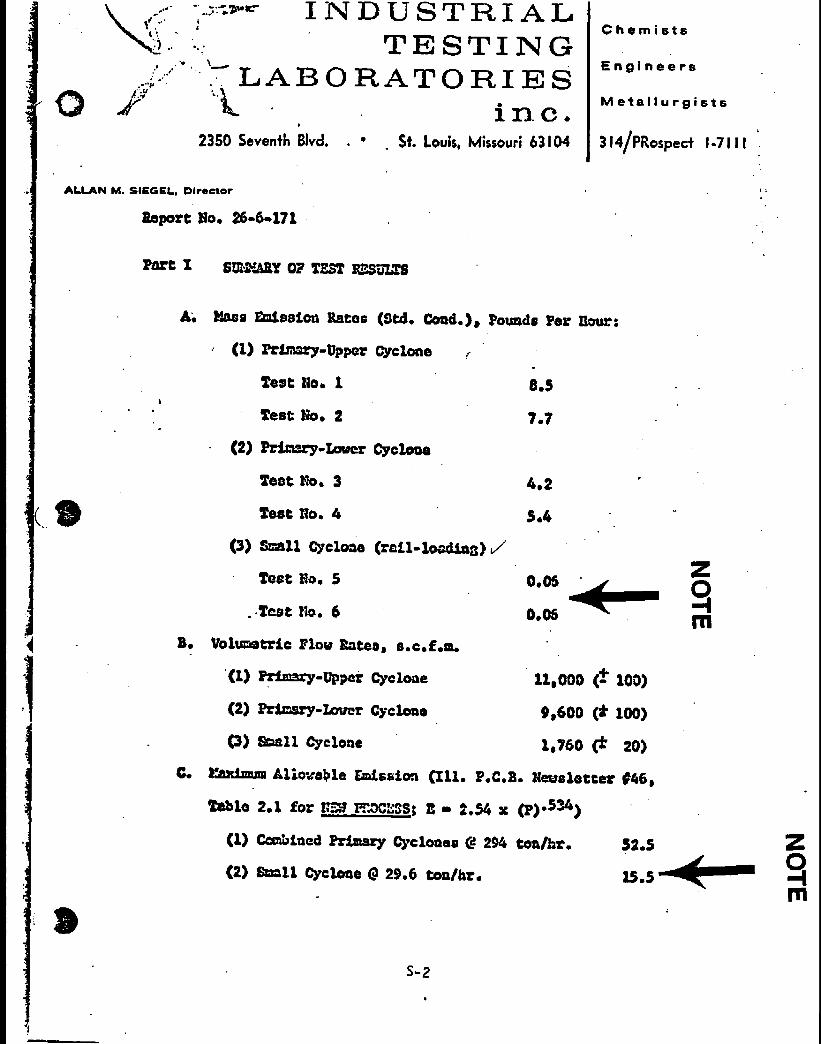
S Report Excerpts from Reference 43 . . . . . . . . . . . . . . . . . . . . . . . . . . . . . . . . . . . . . . . . . . . . . S-1
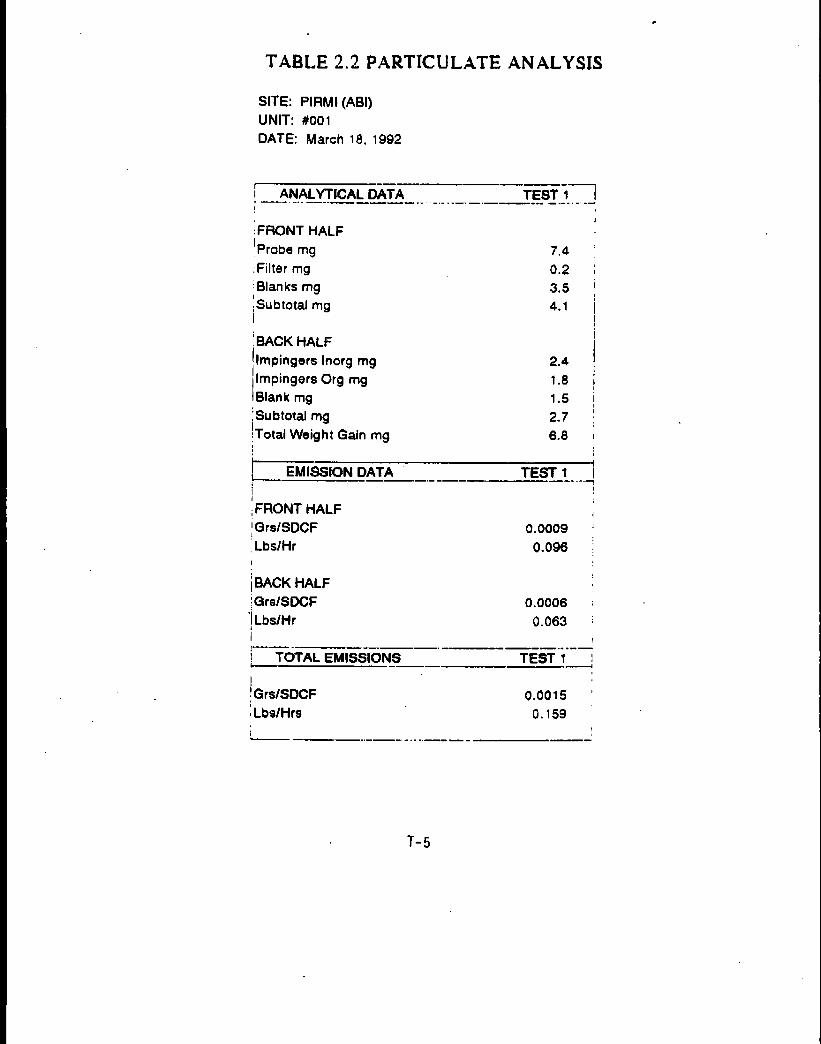
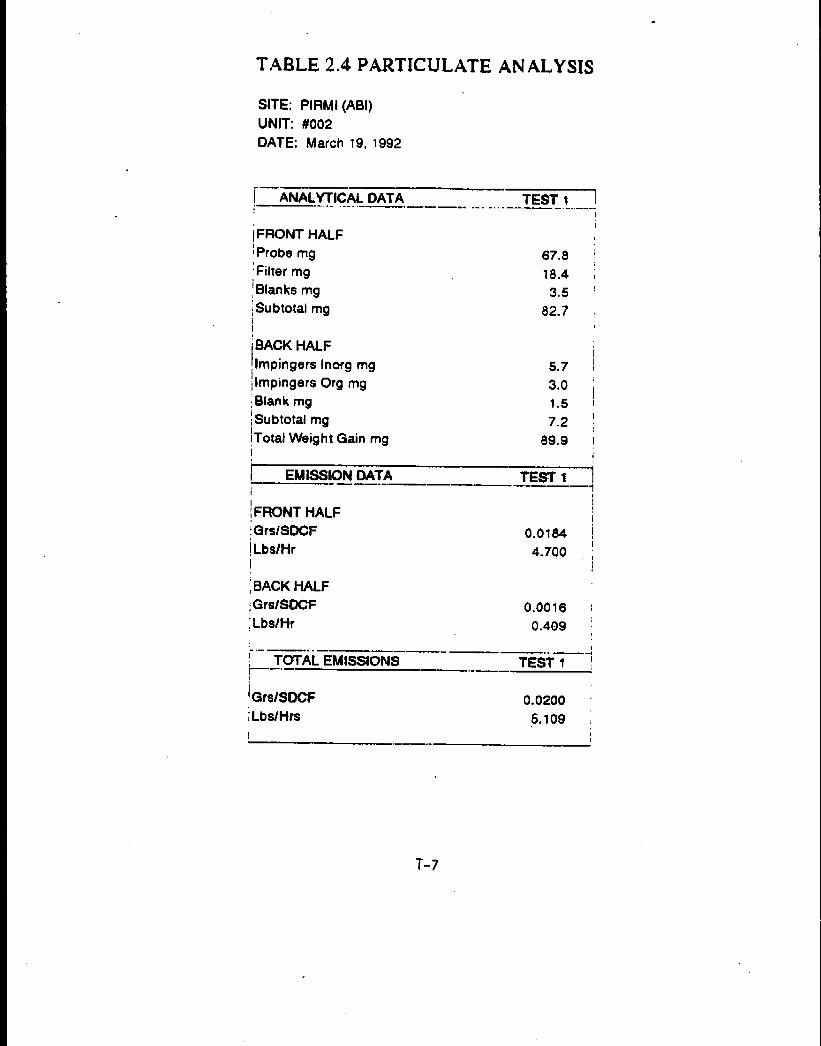
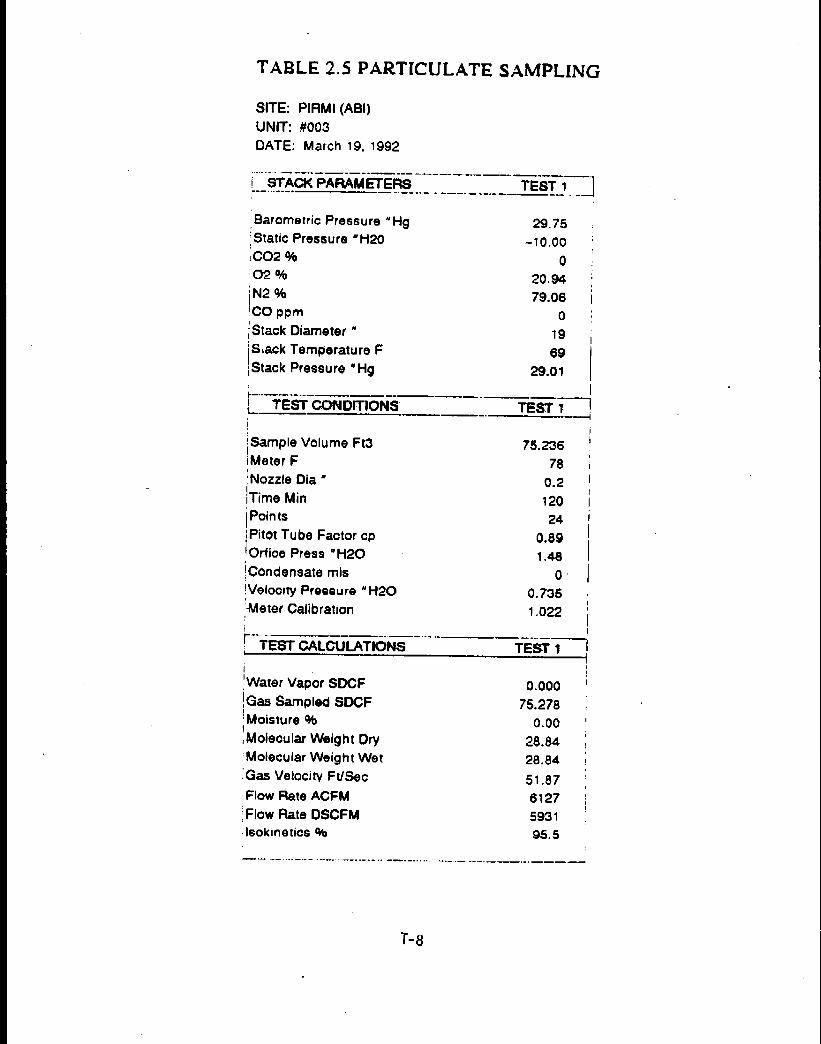
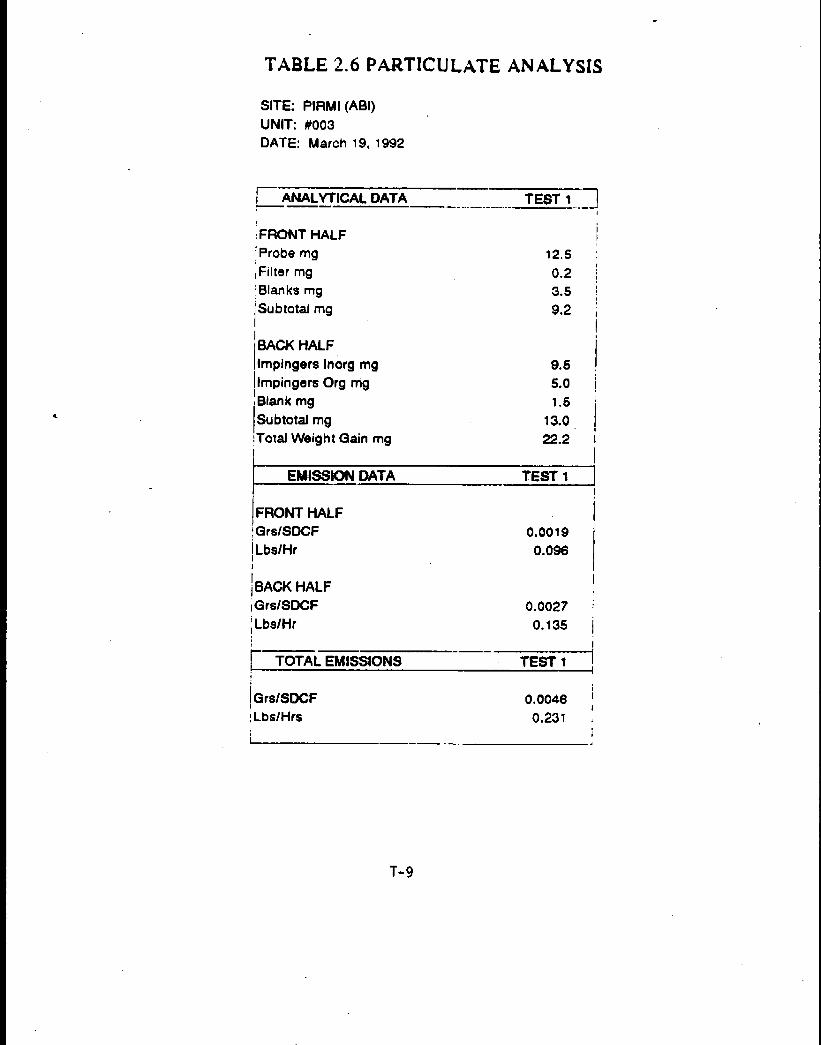
T Report Excerpts from Reference 47 . . . . . . . . . . . . . . . . . . . . . . . . . . . . . . . . . . . . . . . . . . . . T-1
Table of Contents (continued)
Section Page
v
Appendices (continued)
U Report Excerpts from Reference 48 . . . . . . . . . . . . . . . . . . . . . . . . . . . . . . . . . . . . . . . . . . . . U-1
V Report Excerpts from Reference 49 . . . . . . . . . . . . . . . . . . . . . . . . . . . . . . . . . . . . . . . . . . . . V-1
W Report Excerpts from Reference 53 . . . . . . . . . . . . . . . . . . . . . . . . . . . . . . . . . . . . . . . . . . . . W-1
X Report Excerpts from Reference 54 . . . . . . . . . . . . . . . . . . . . . . . . . . . . . . . . . . . . . . . . . . . . X-1
Y Report Excerpts from References 55 and 56 . . . . . . . . . . . . . . . . . . . . . . . . . . . . . . . . . . . . . Y-1
Z Report Excerpts from Reference 57 . . . . . . . . . . . . . . . . . . . . . . . . . . . . . . . . . . . . . . . . . . . . Z-1
AA Report Excerpts from Reference 58 . . . . . . . . . . . . . . . . . . . . . . . . . . . . . . . . . . . . . . . . . . . AA-1
BB Report Excerpts from Reference 60 . . . . . . . . . . . . . . . . . . . . . . . . . . . . . . . . . . . . . . . . . . . BB-1
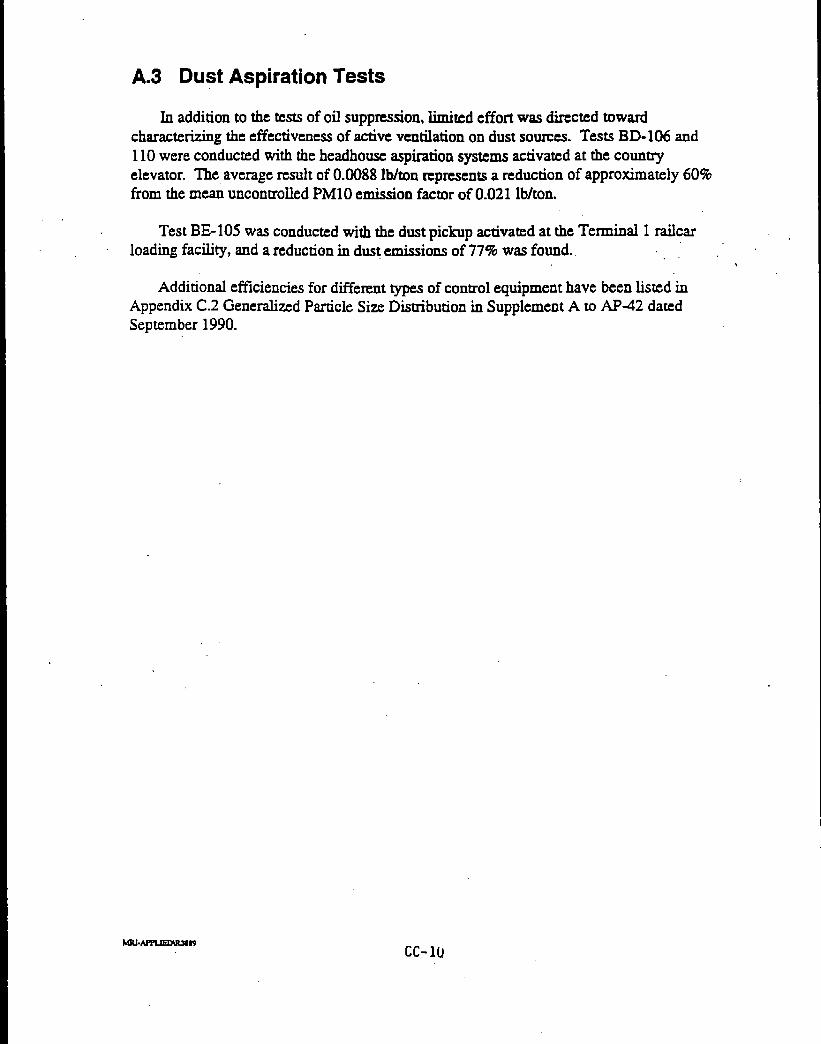
CC Report Excerpts from Reference 61 . . . . . . . . . . . . . . . . . . . . . . . . . . . . . . . . . . . . . . . . . . . CC-1
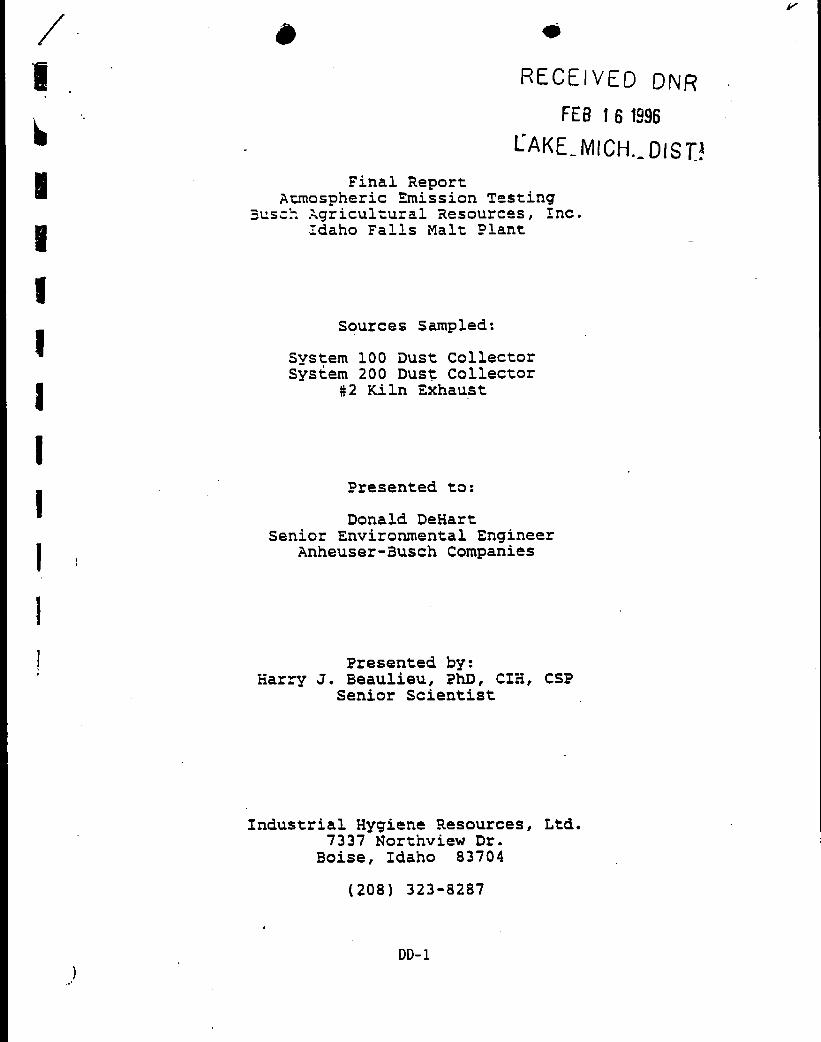
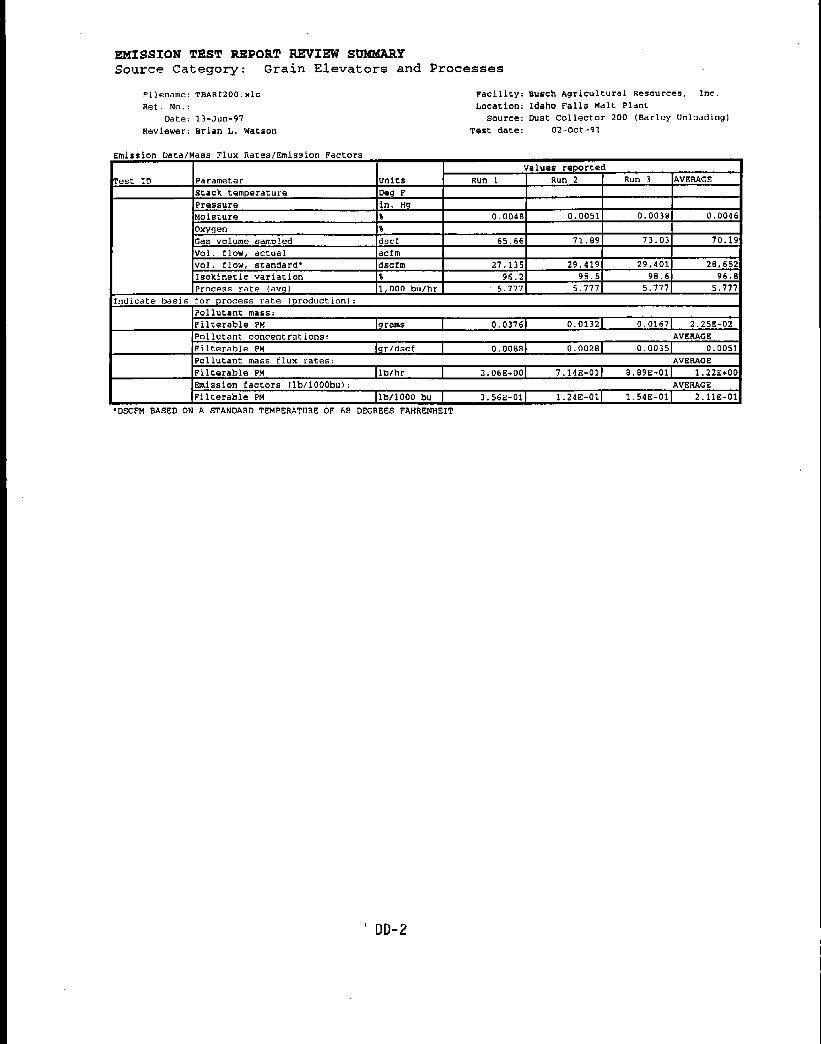
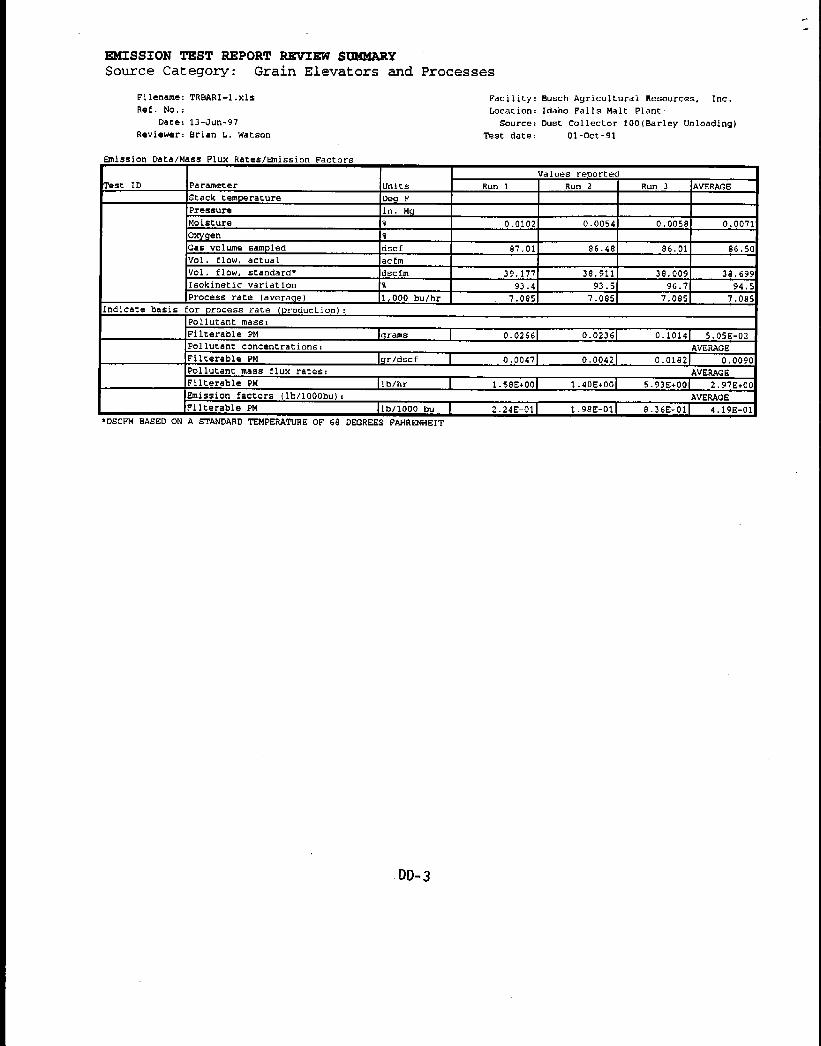
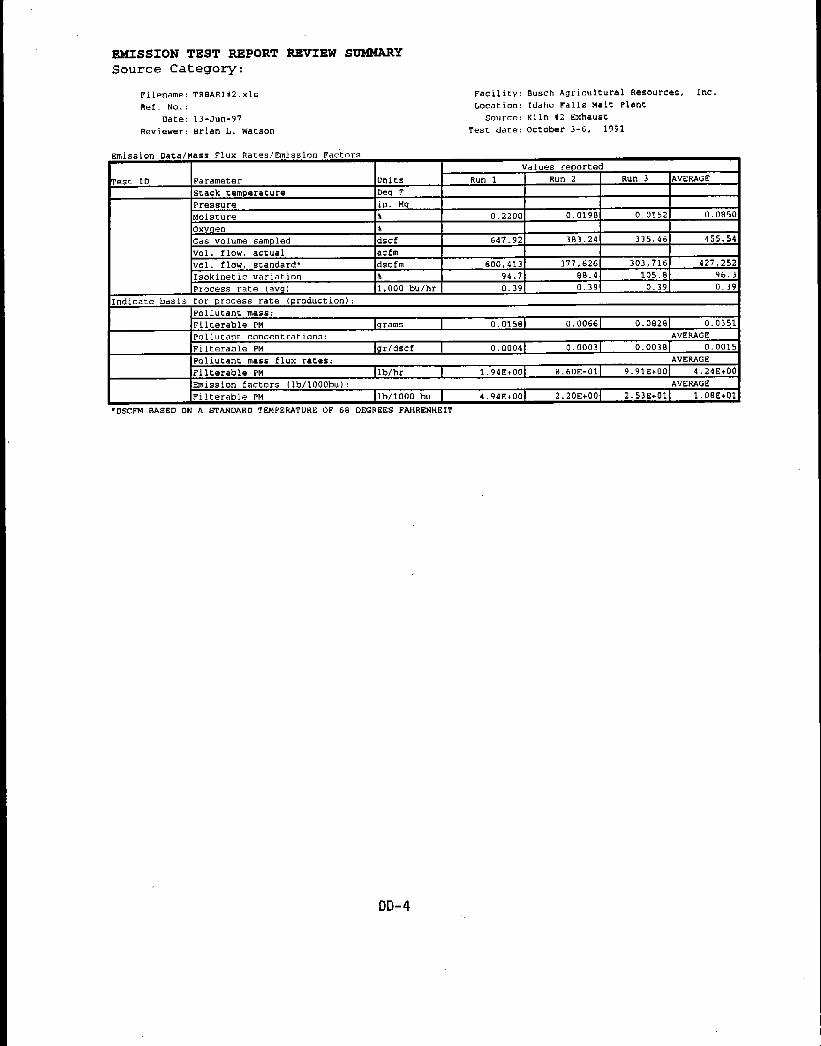
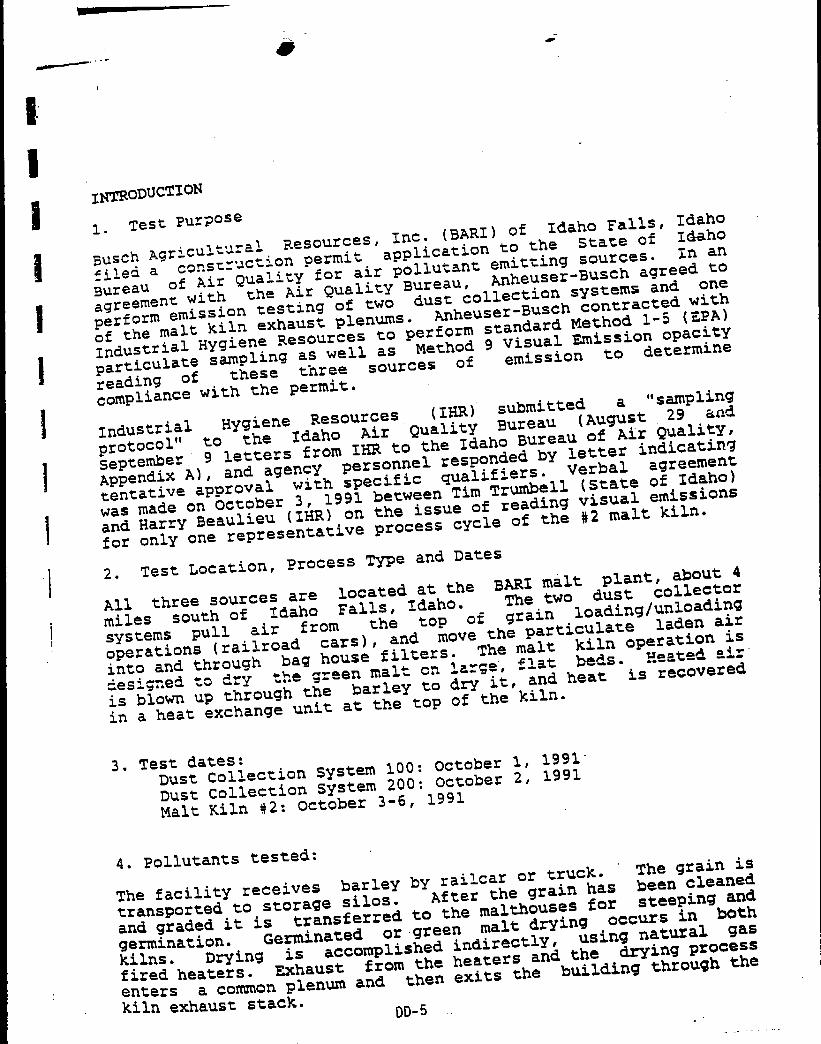
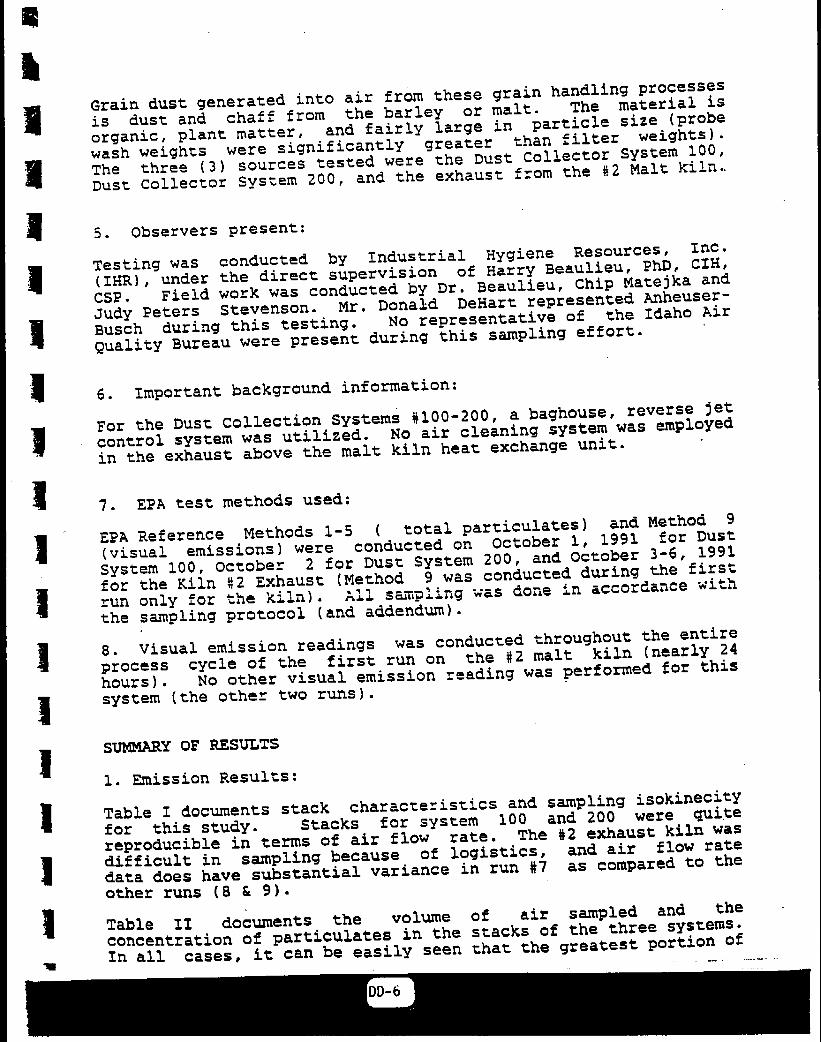
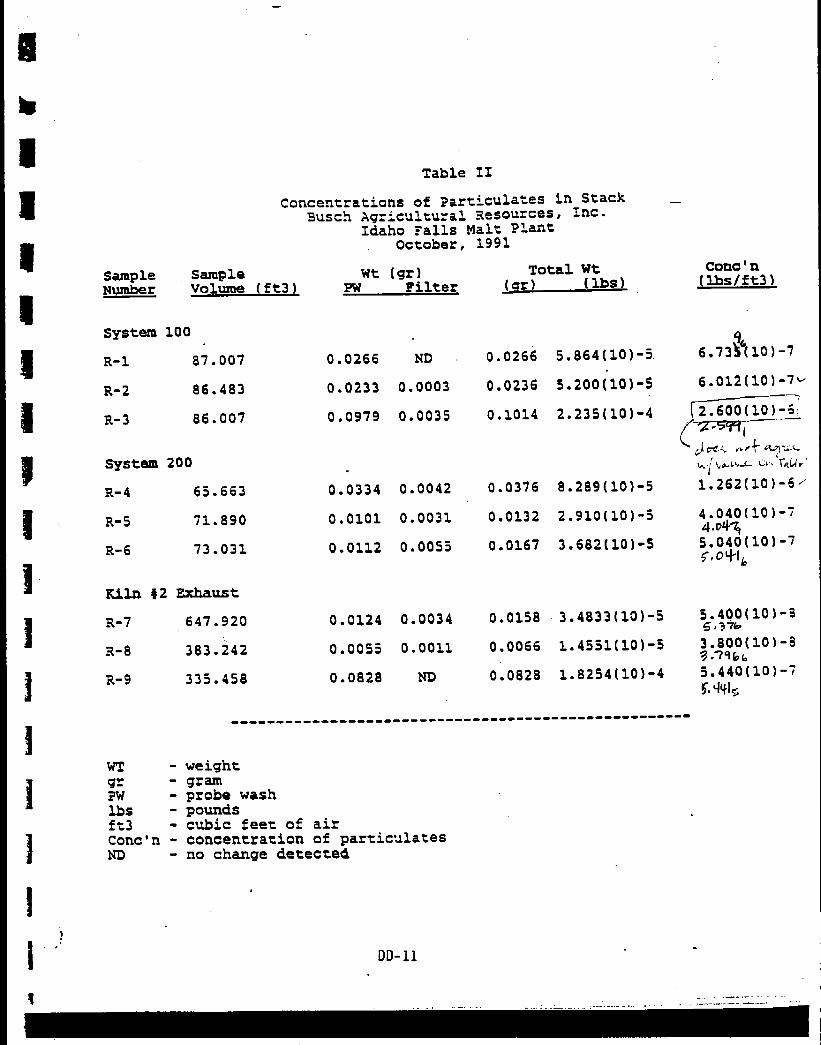
DD Report Excerpts and Calculations for Reference 68 . . . . . . . . . . . . . . . . . . . . . . . . . . . . . . DD-1
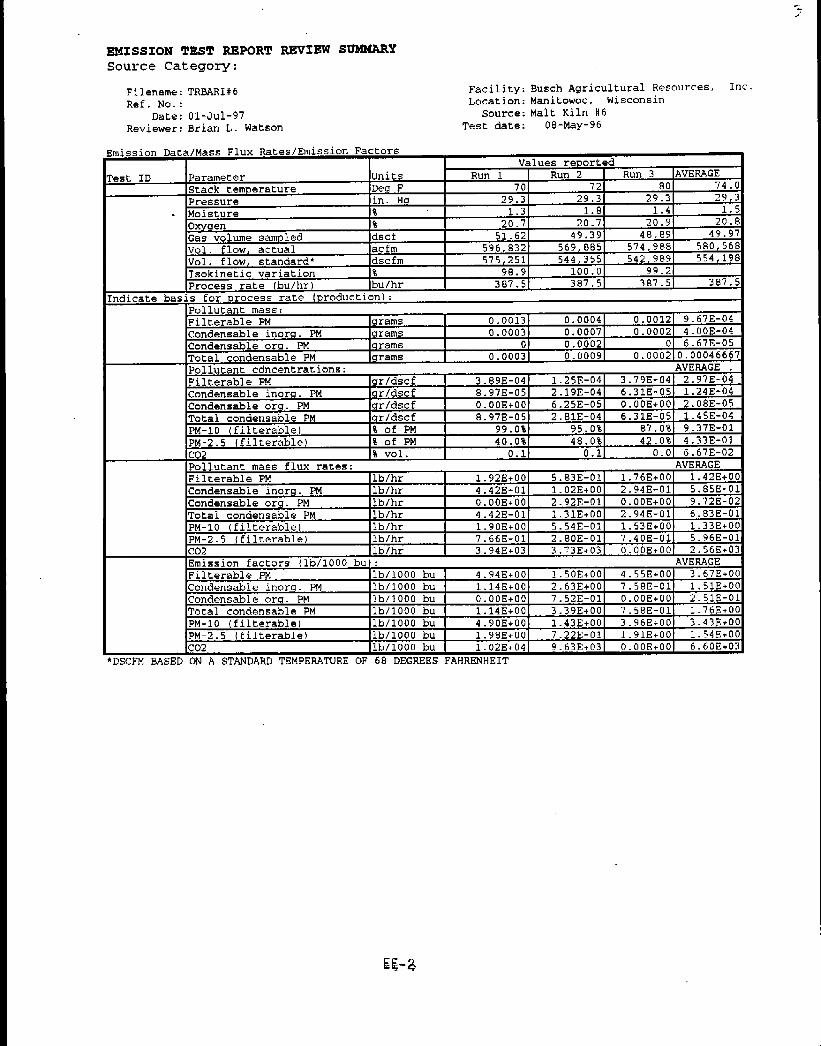
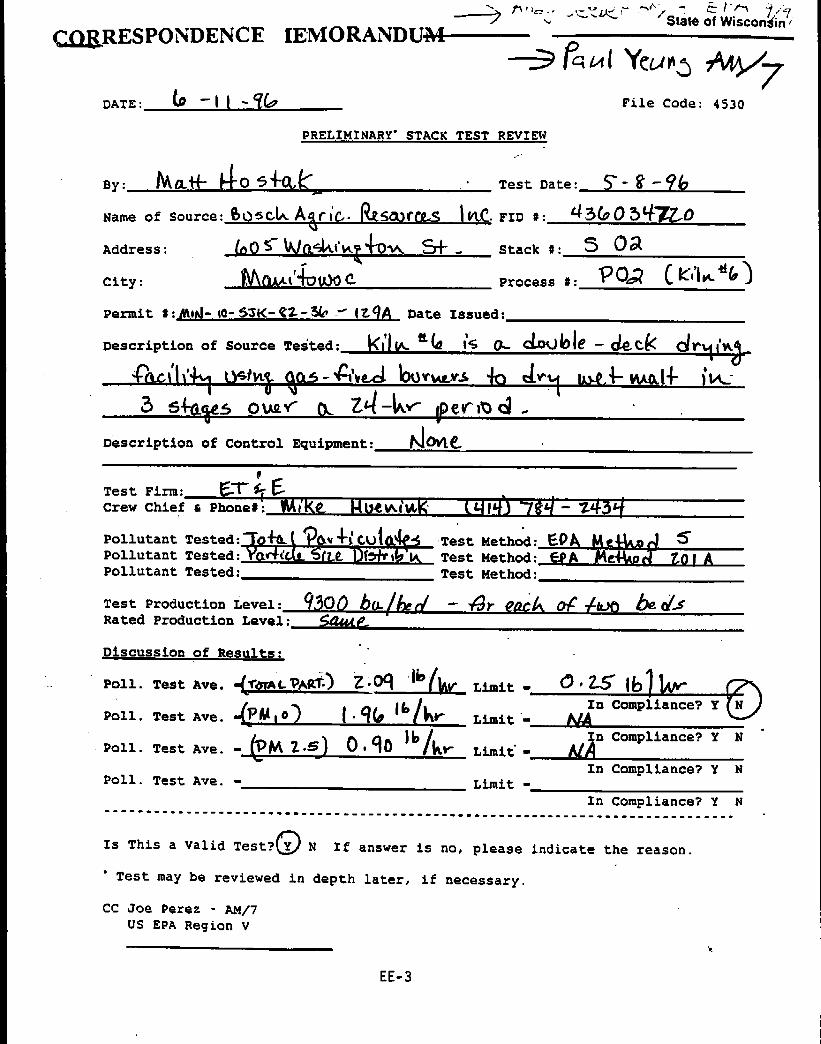
EE Report Excerpts and Calculations for Reference 69 . . . . . . . . . . . . . . . . . . . . . . . . . . . . . . EE-1
List of Figures
Figure
2-1. Various uses of corn . . . . . . . . . . . . . . . . . . . . . . . . . . . . . . . . . . . . . . . . . . . . . . . . . . . . . . . . . . . 2-2
2-2. Major process operations at a grain elevator . . . . . . . . . . . . . . . . . . . . . . . . . . . . . . . . . . . . . . . 2-11
2-3. Schematic of rack- and column-type grain dryers . . . . . . . . . . . . . . . . . . . . . . . . . . . . . . . . . . . 2-14
2-4. Simplified process flow diagram of a typical flour mill . . . . . . . . . . . . . . . . . . . . . . . . . . . . . . 2-15
2-5. Flow diagram for oat processing operations . . . . . . . . . . . . . . . . . . . . . . . . . . . . . . . . . . . . . . . 2-20
2-6. Distribution of rice products and by-products . . . . . . . . . . . . . . . . . . . . . . . . . . . . . . . . . . . . . . 2-23
2-7. Flow diagram for conventional and parboil rice mills . . . . . . . . . . . . . . . . . . . . . . . . . . . . . . . . 2-25
2-8. Simplified process flow diagram for a corn dry milling operation with degerming . . . . . . . . . 2-27
2-9. Typical animal feed milling process flow diagram . . . . . . . . . . . . . . . . . . . . . . . . . . . . . . . . . . 2-30
2-10. Choke unloading for a grain receiving process . . . . . . . . . . . . . . . . . . . . . . . . . . . . . . . . . . . . . 2-42
2-11. Dead box for reducing loading/shipping emissions . . . . . . . . . . . . . . . . . . . . . . . . . . . . . . . . . . 2-43
2-12. Receiving pit capture/collection (ventilation) system . . . . . . . . . . . . . . . . . . . . . . . . . . . . . . . . 2-44
6
List of Tables
Table Page
2-1. United States Acreage in Farms, 1996 . . . . . . . . . . . . . . . . . . . . . . . . . . . . . . . . . . . . . . . . . . . . . 2-3
2-2. 1996 Statistics for Grain Produced . . . . . . . . . . . . . . . . . . . . . . . . . . . . . . . . . . . . . . . . . . . . . . . . 2-5
2-3. Number and Location of Grain Elevators, 1996 . . . . . . . . . . . . . . . . . . . . . . . . . . . . . . . . . . . . . 2-5
2-4. Grain Handling and Processing Facilities in the United States, 1992 . . . . . . . . . . . . . . . . . . . . . 2-8
2-5. Primary Feed Production by Region: 1995 . . . . . . . . . . . . . . . . . . . . . . . . . . . . . . . . . . . . . . . . . 2-9
2-6. Potential Sources of Air Emissions in a Wheat Flour Mill Complex . . . . . . . . . . . . . . . . . . . . 2-36
2-7. Potential Sources of Air Emissions in an Oat Mill . . . . . . . . . . . . . . . . . . . . . . . . . . . . . . . . . . 2-37
2-8. Potential Sources of Air Emissions in Rice Mills . . . . . . . . . . . . . . . . . . . . . . . . . . . . . . . . . . . 2-38
2-9. Potential Sources of Air Emissions in a Dry Corn Mill . . . . . . . . . . . . . . . . . . . . . . . . . . . . . . . 2-39
2-10. Process Control and Exhaust Systems for Grain Handling and Processing . . . . . . . . . . . . . . . . 2-41
4-1. Documents Not Included in Emission Factor Development . . . . . . . . . . . . . . . . . . . . . . . . . . . . 4-1
4-2. Summary of Pm Emission Data from Reference 4 . . . . . . . . . . . . . . . . . . . . . . . . . . . . . . . . . . . . 4-4
4-3. Results of Downwind Andersen Impactor Measurements During Ship Loading . . . . . . . . . . . . 4-5
4-4. Summary of Ship Hold Dust Concentrations . . . . . . . . . . . . . . . . . . . . . . . . . . . . . . . . . . . . . . . . 4-6
4-5. Particle Size Distributions for Dust Generated in Hold During Ship Loading of Wheat . . . . . . 4-6
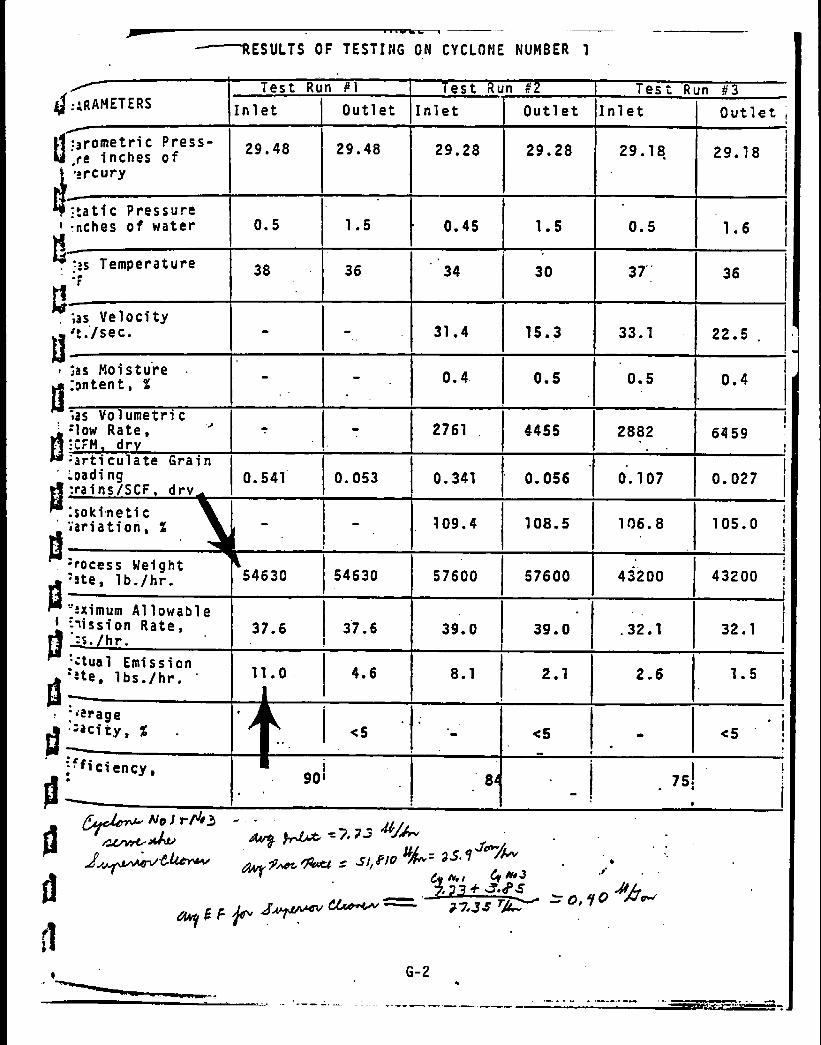
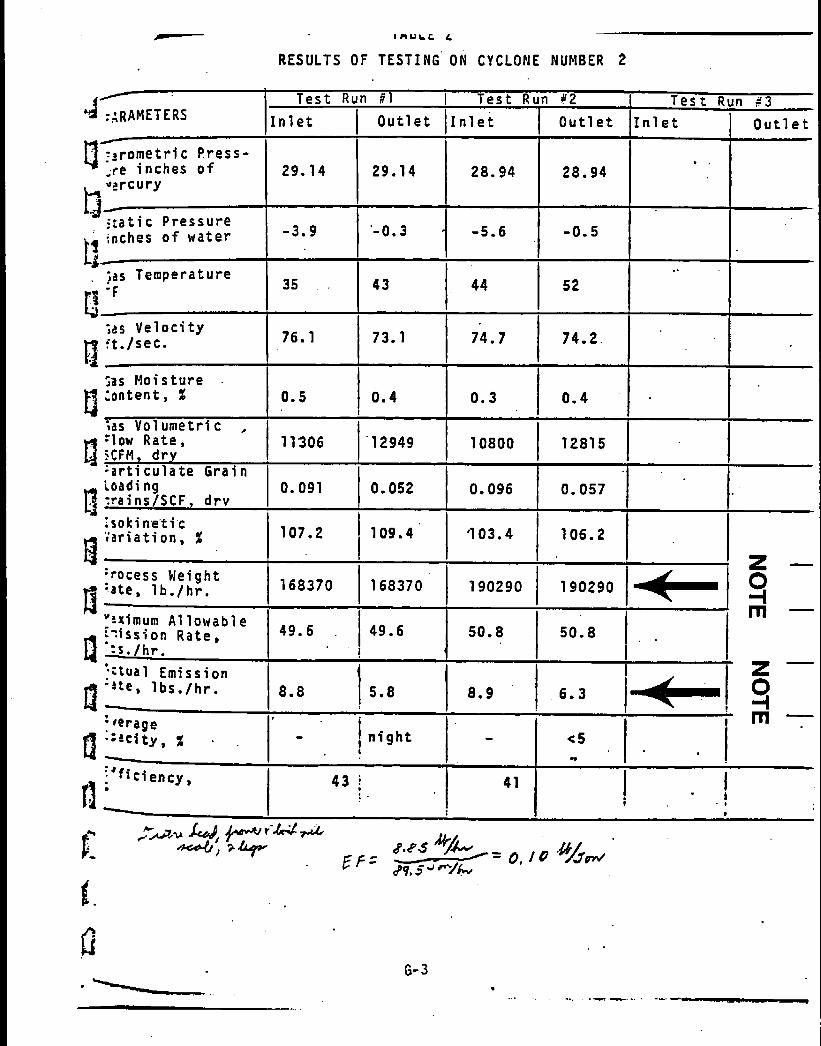
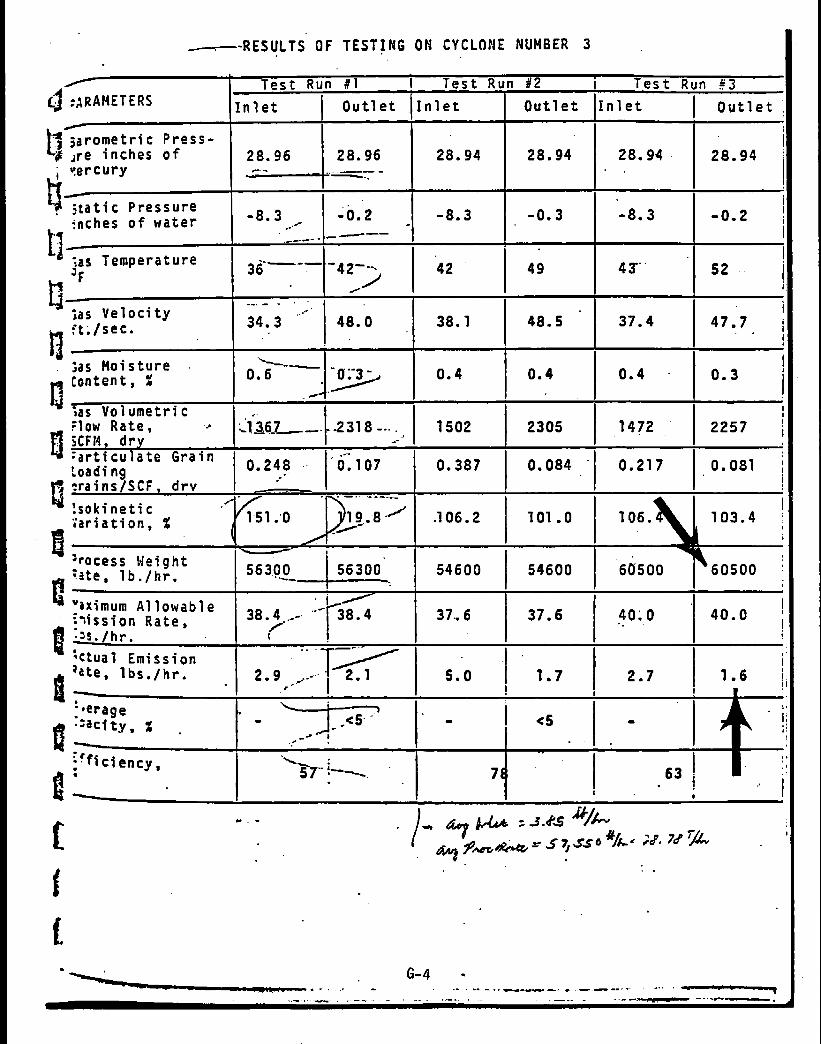
4-6. Summary of Total PM Emission Data from Reference 25 . . . . . . . . . . . . . . . . . . . . . . . . . . . . . . 4-8
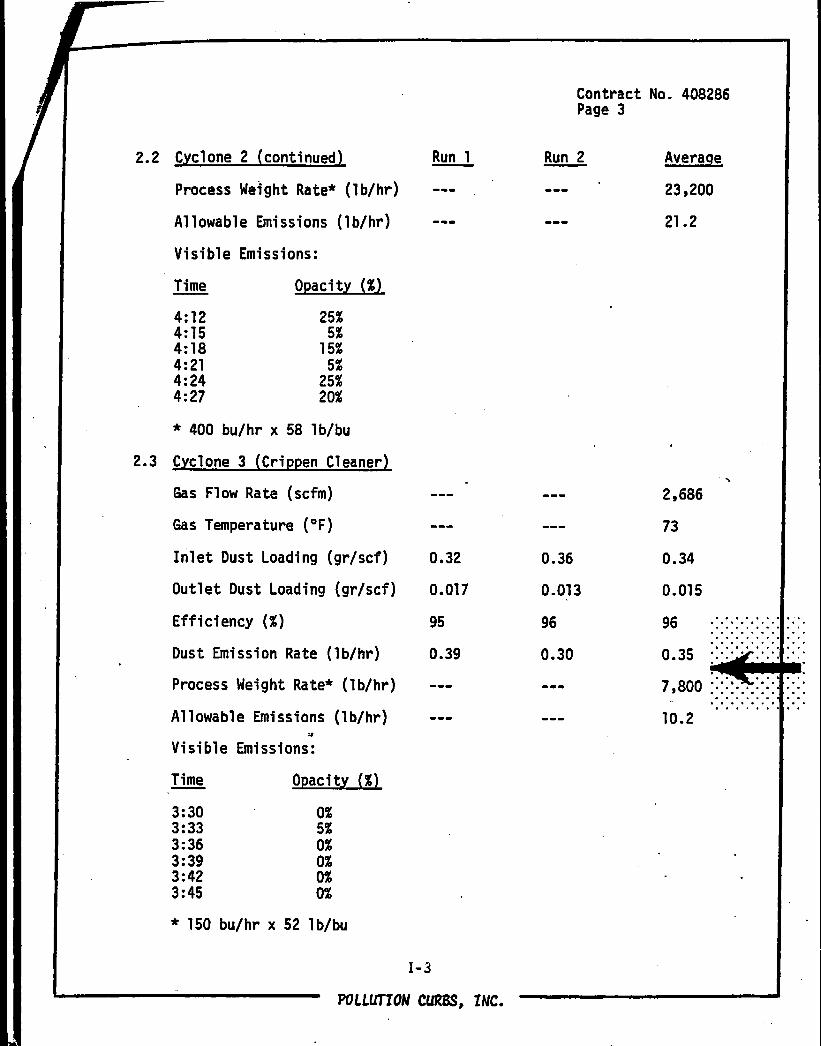
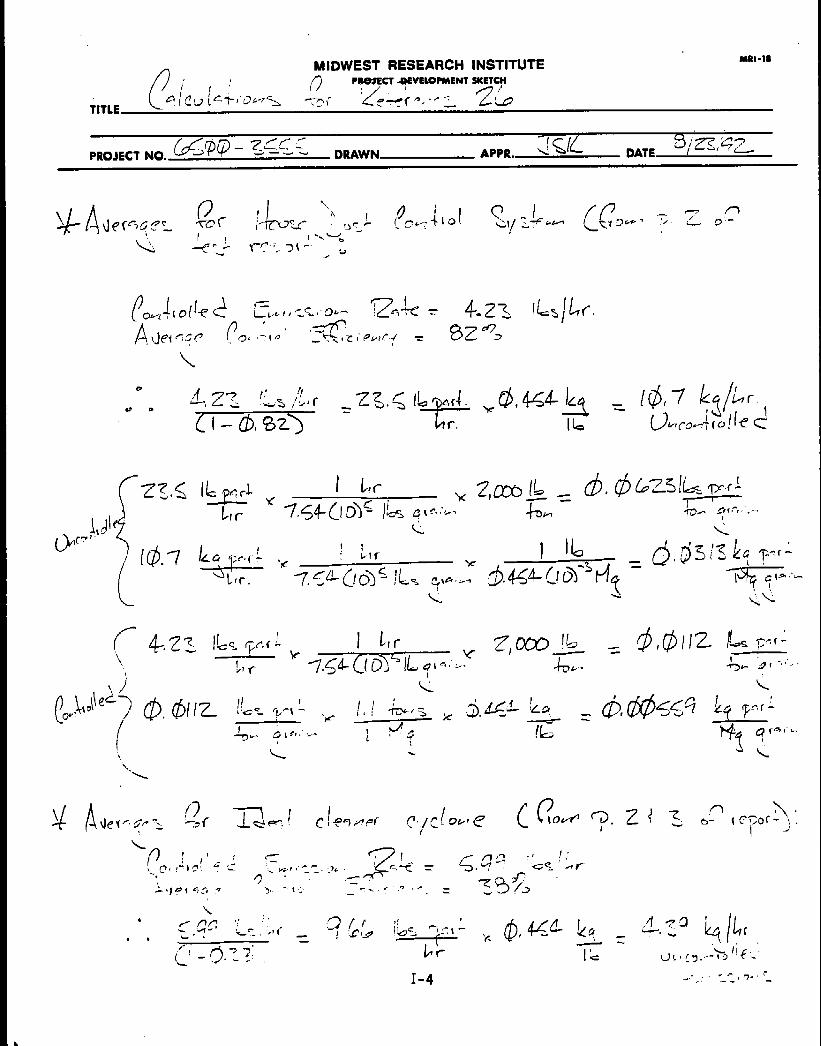
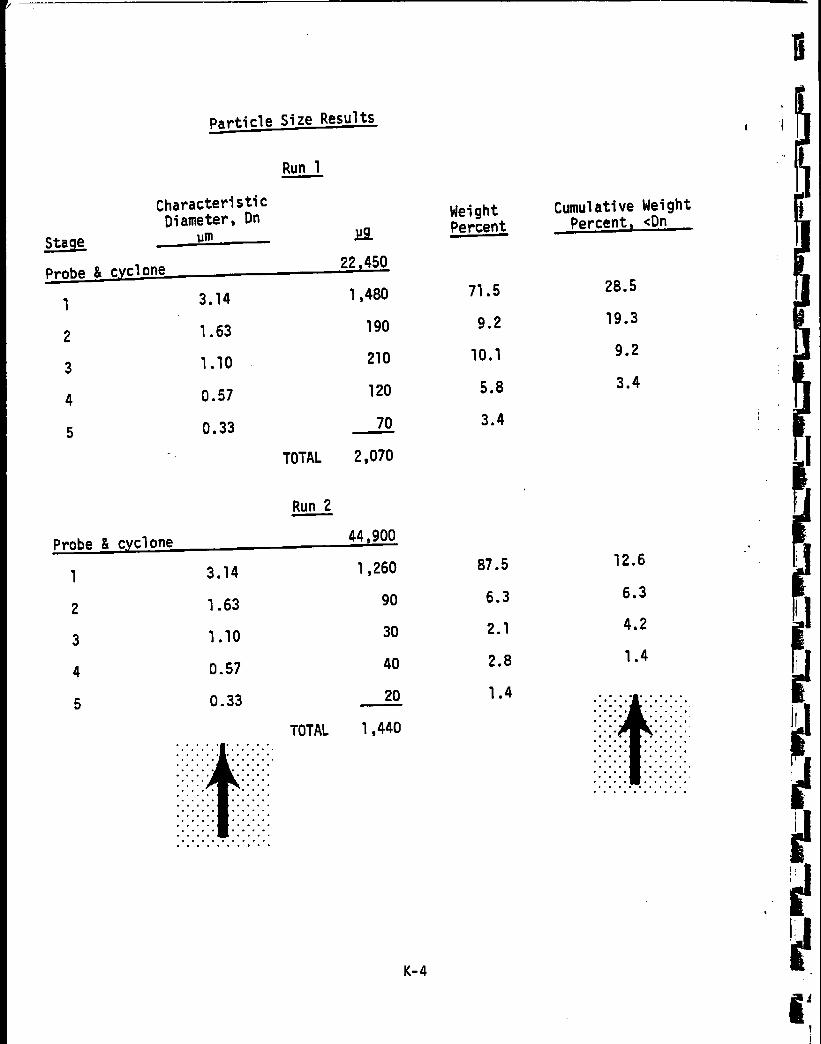
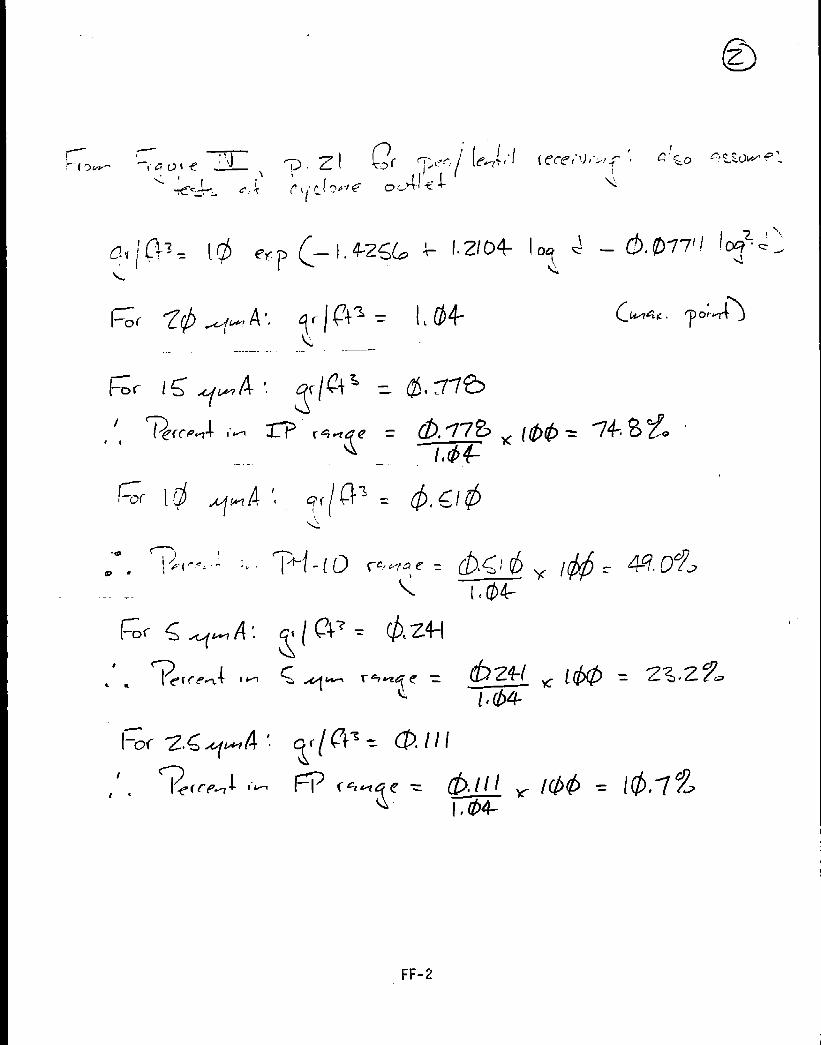
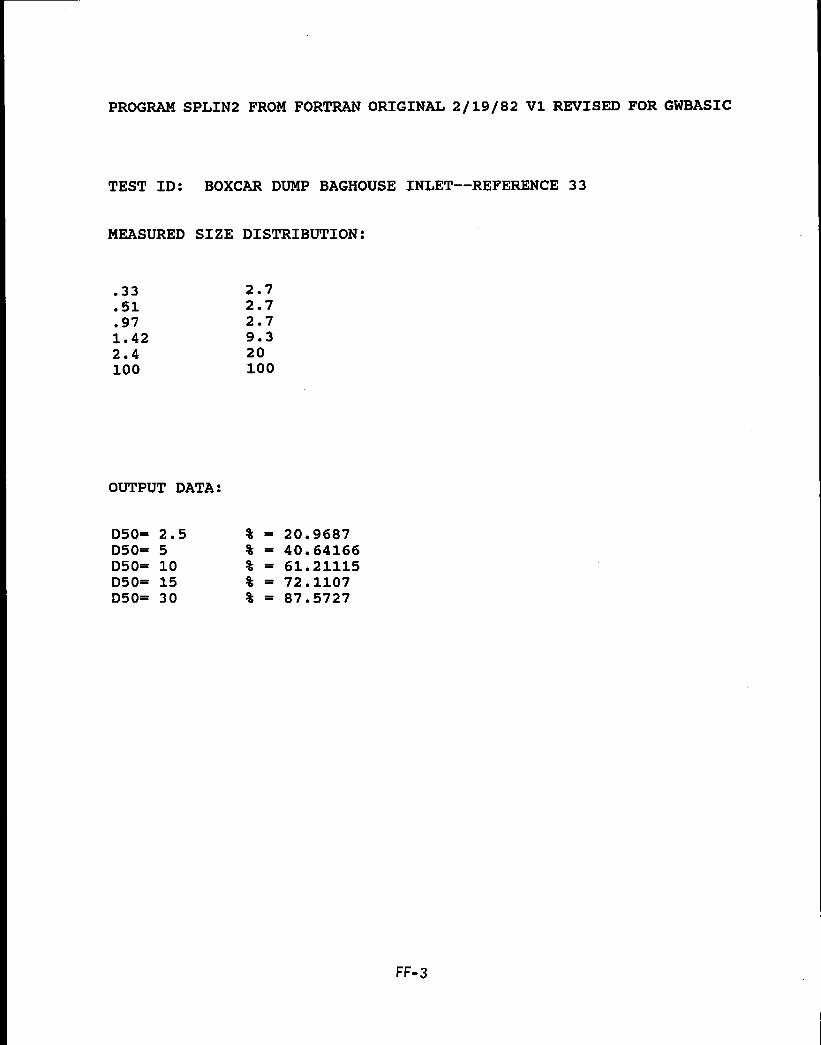
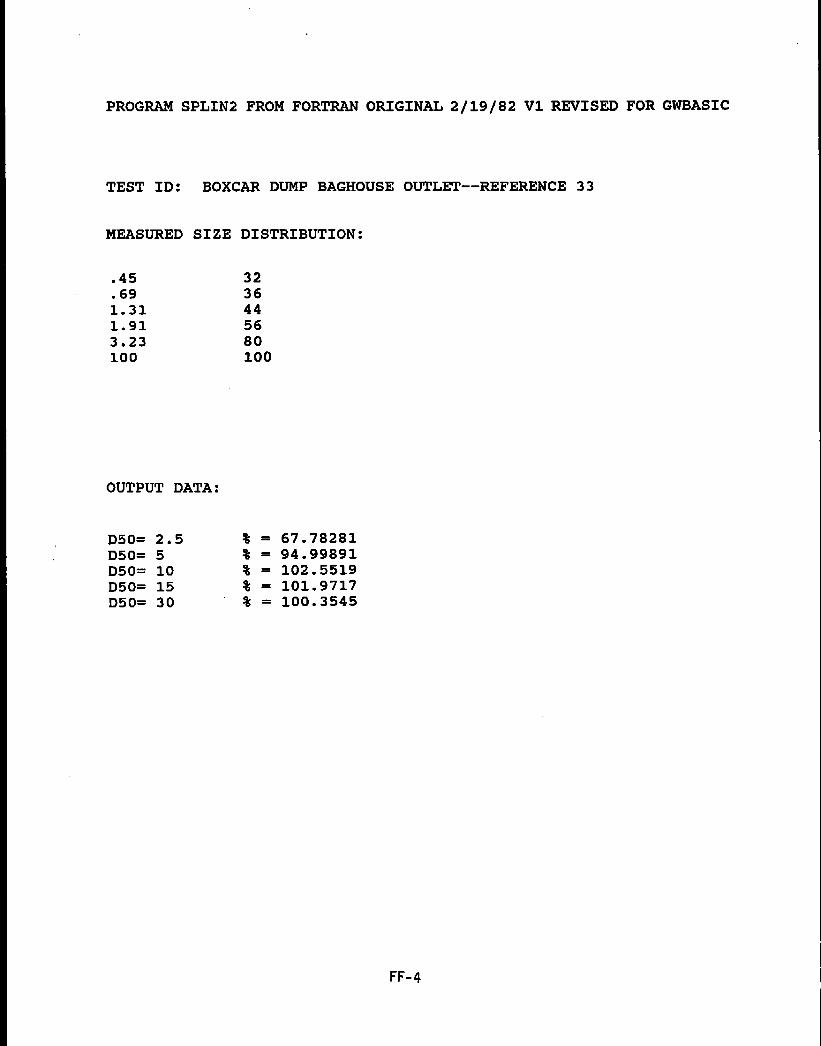
4-7. Particle Sizing Results from Reference 33 . . . . . . . . . . . . . . . . . . . . . . . . . . . . . . . . . . . . . . . . . 4-11
4-8. Dust Concentration Associated with Dust Suppression Tests from Reference 46 . . . . . . . . . . 4-18
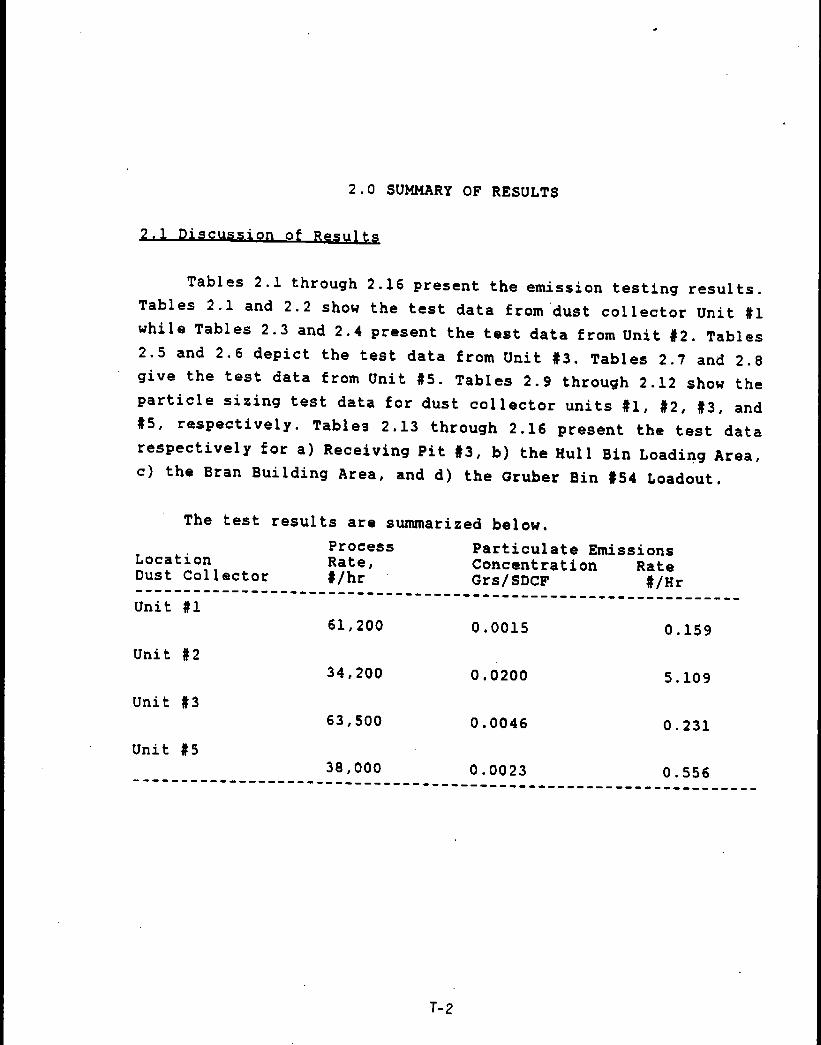
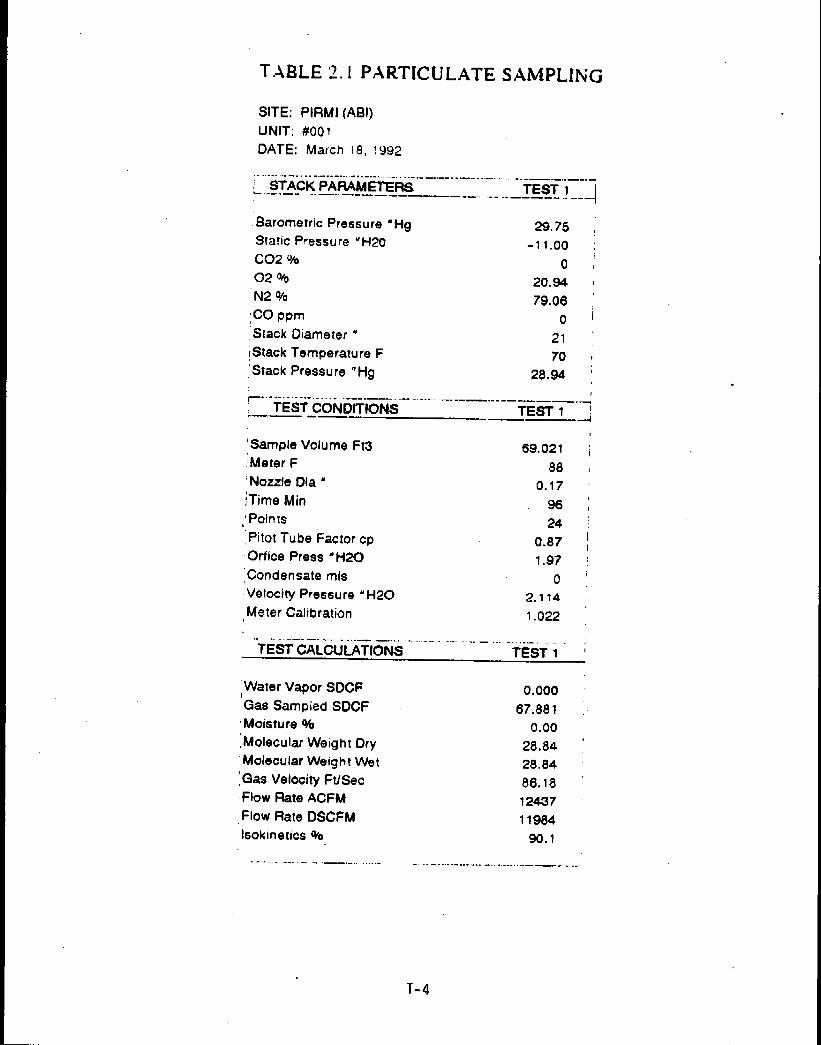
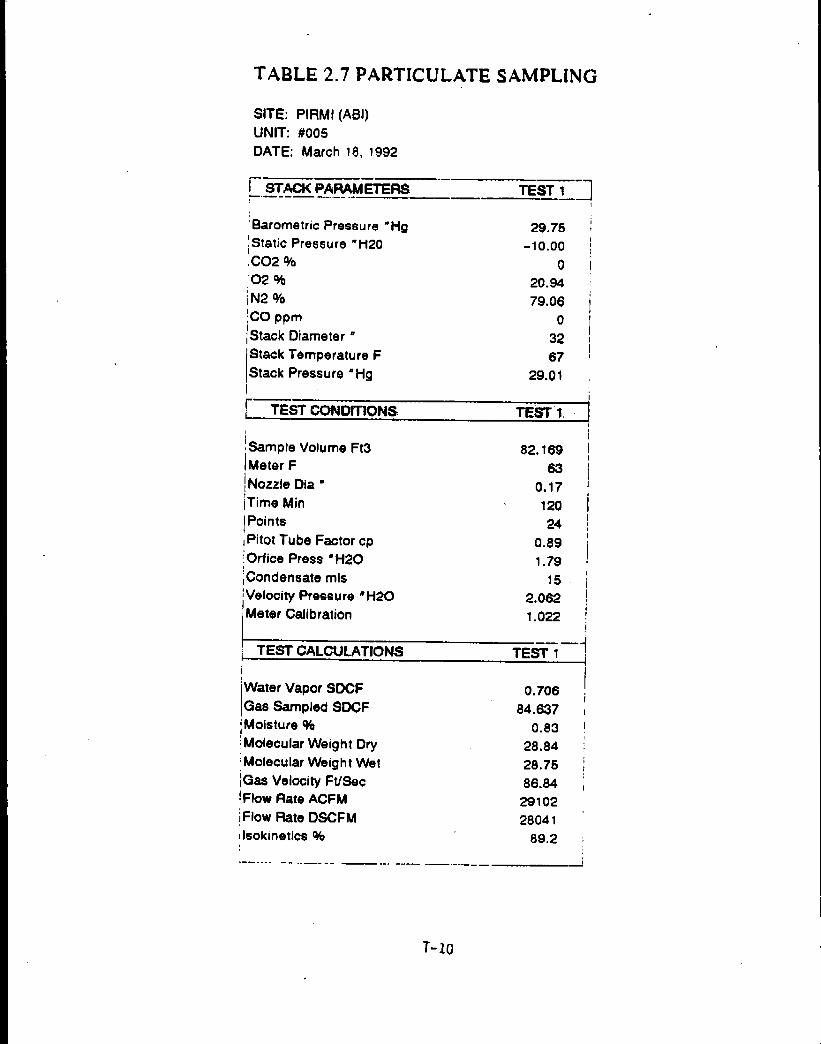
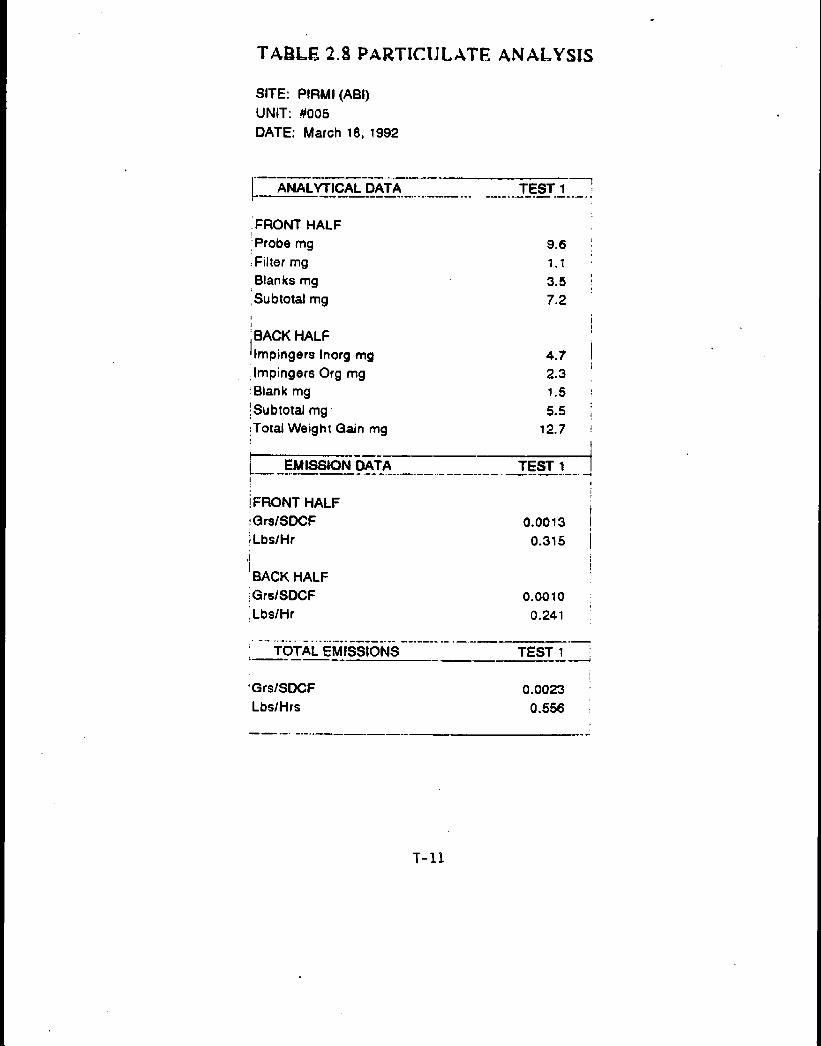
4-9. Particulate Emissions from a Rice Milling Operation Reference 47 . . . . . . . . . . . . . . . . . . . . . 4-20
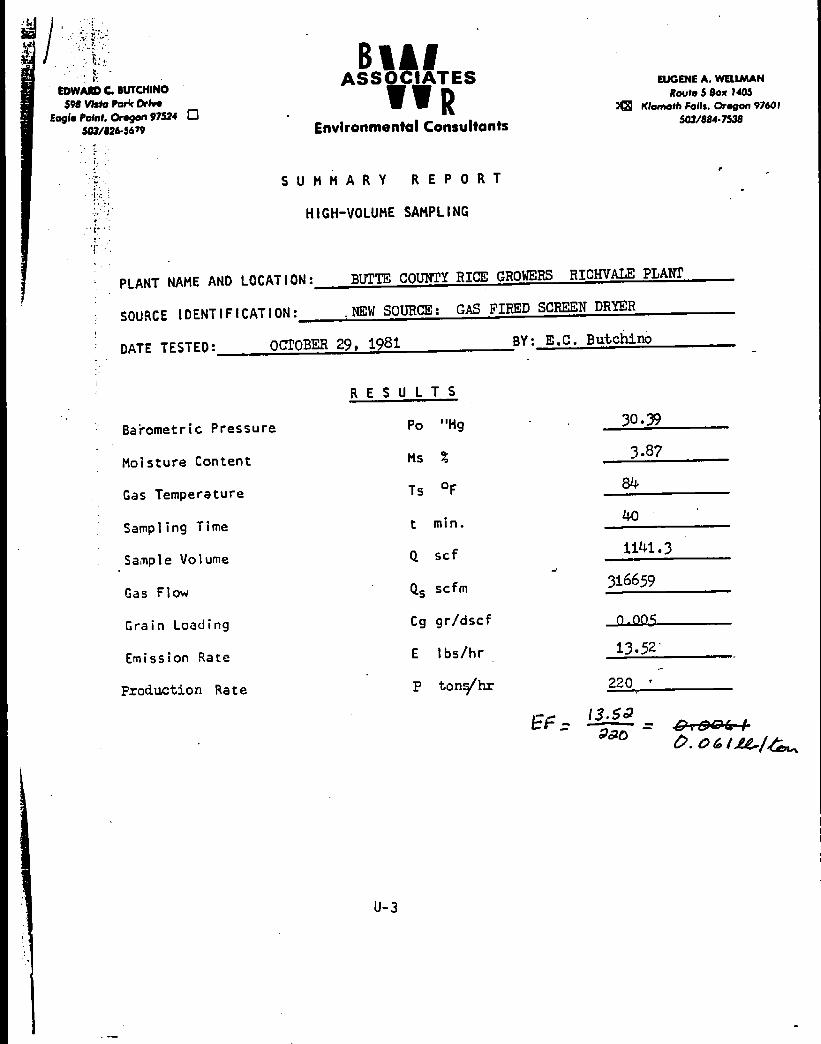
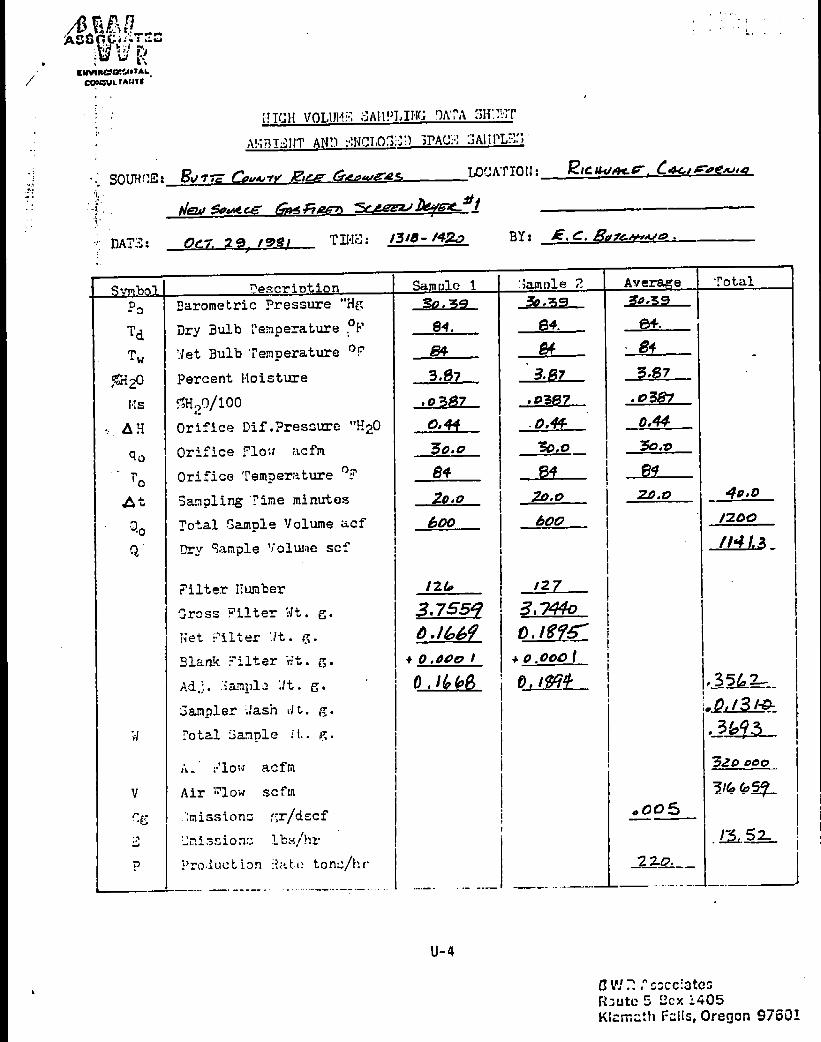
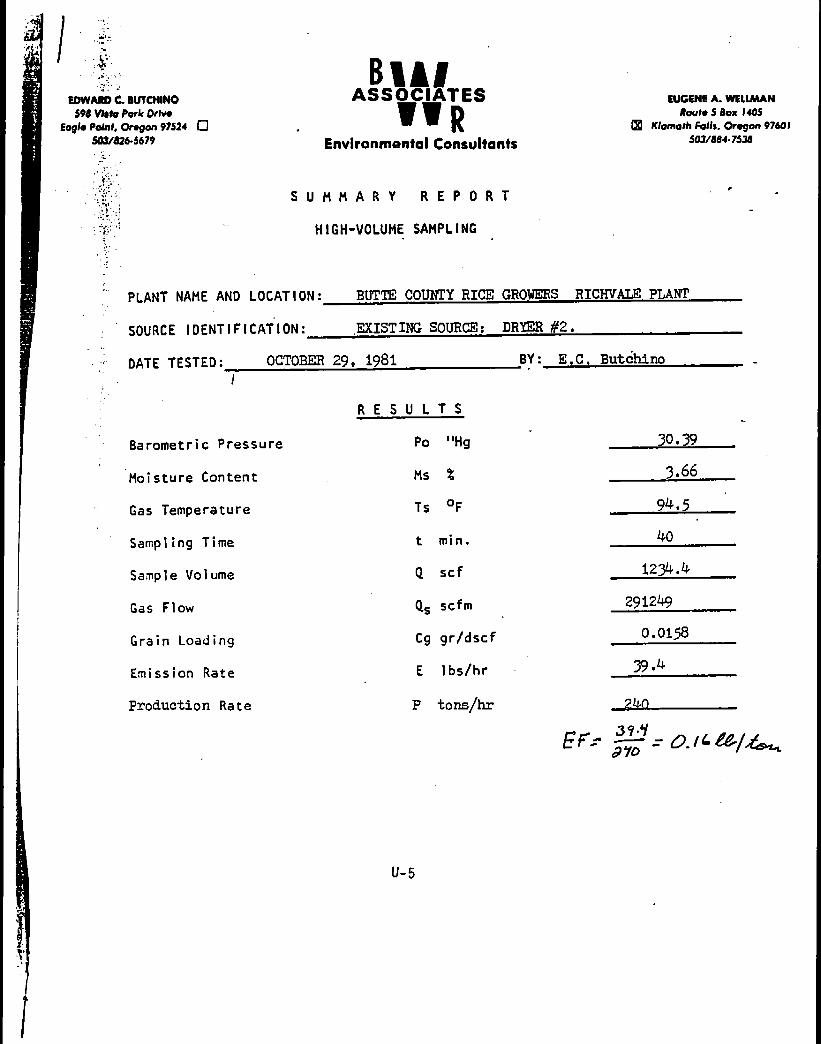
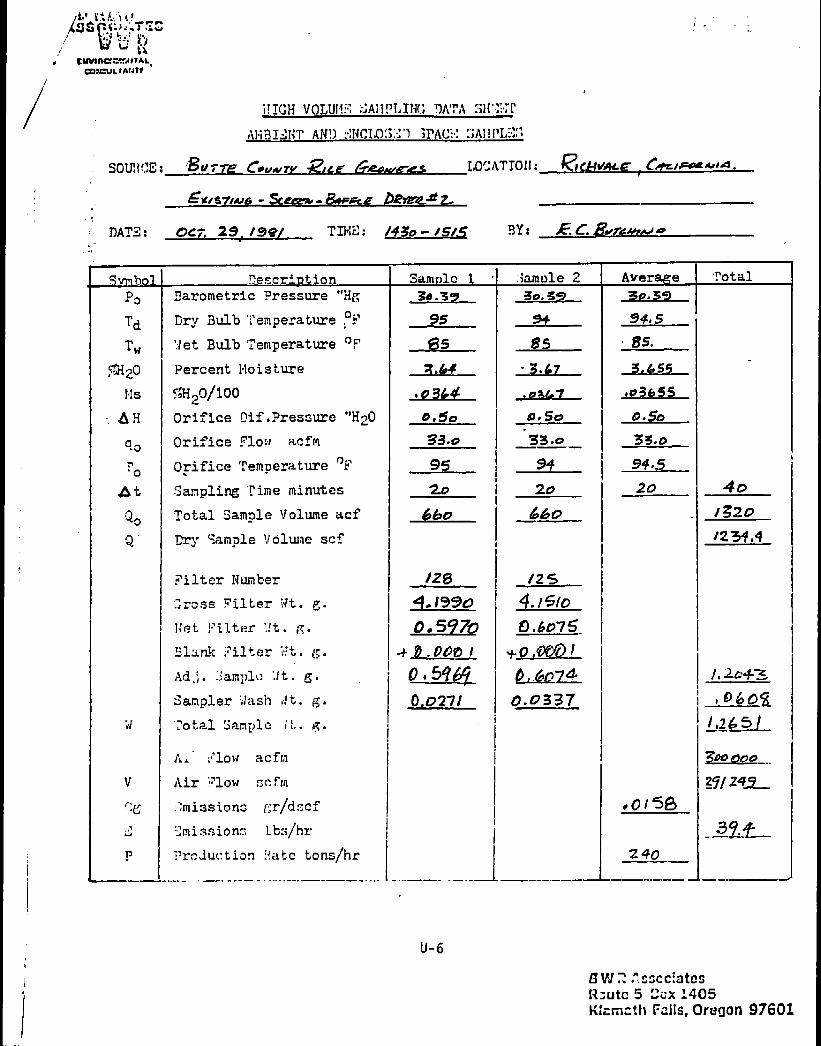
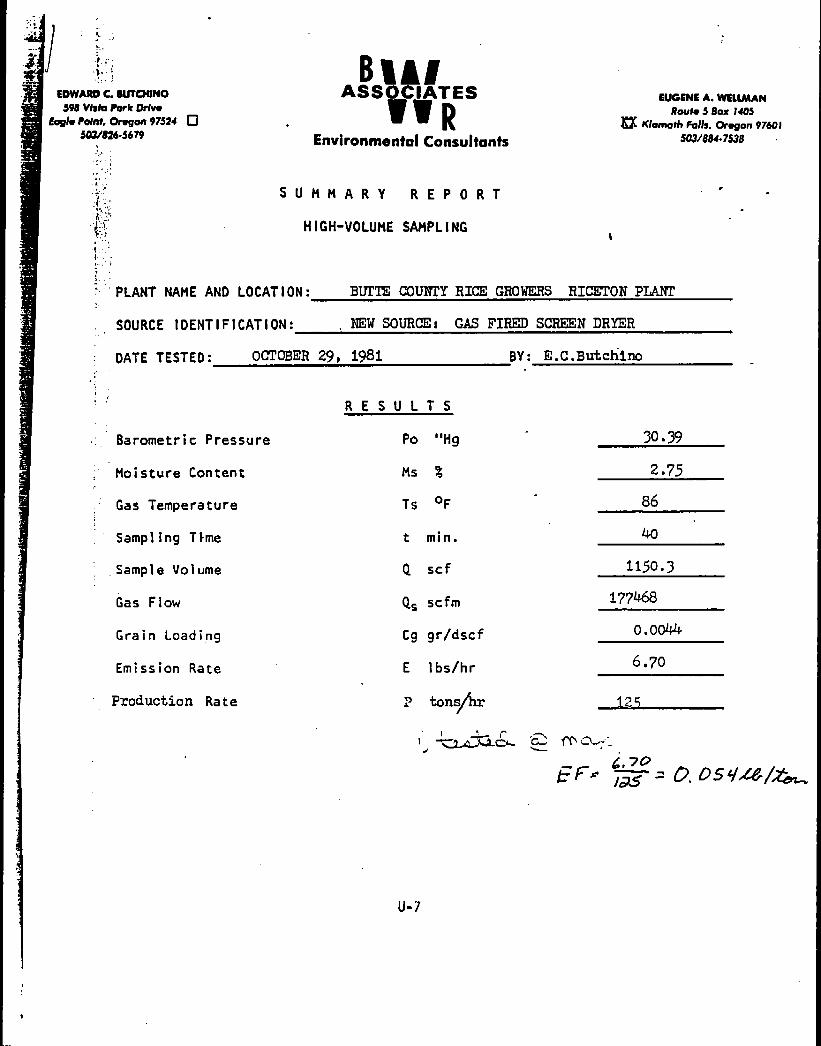
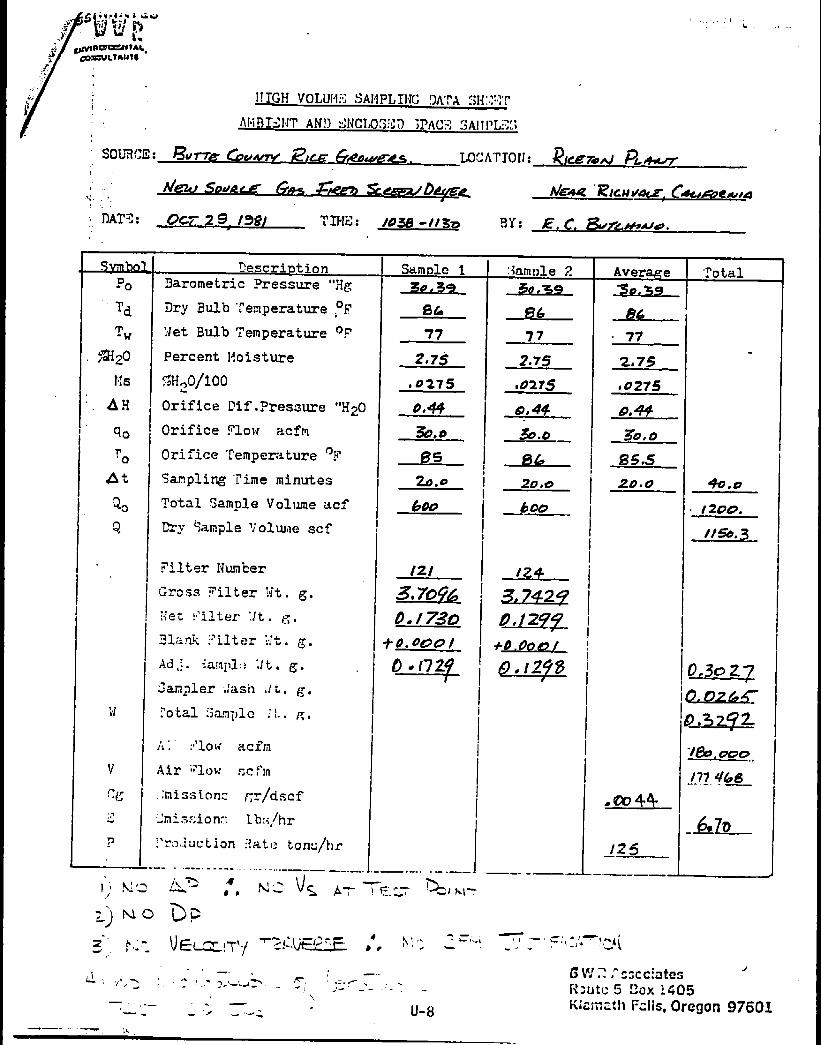
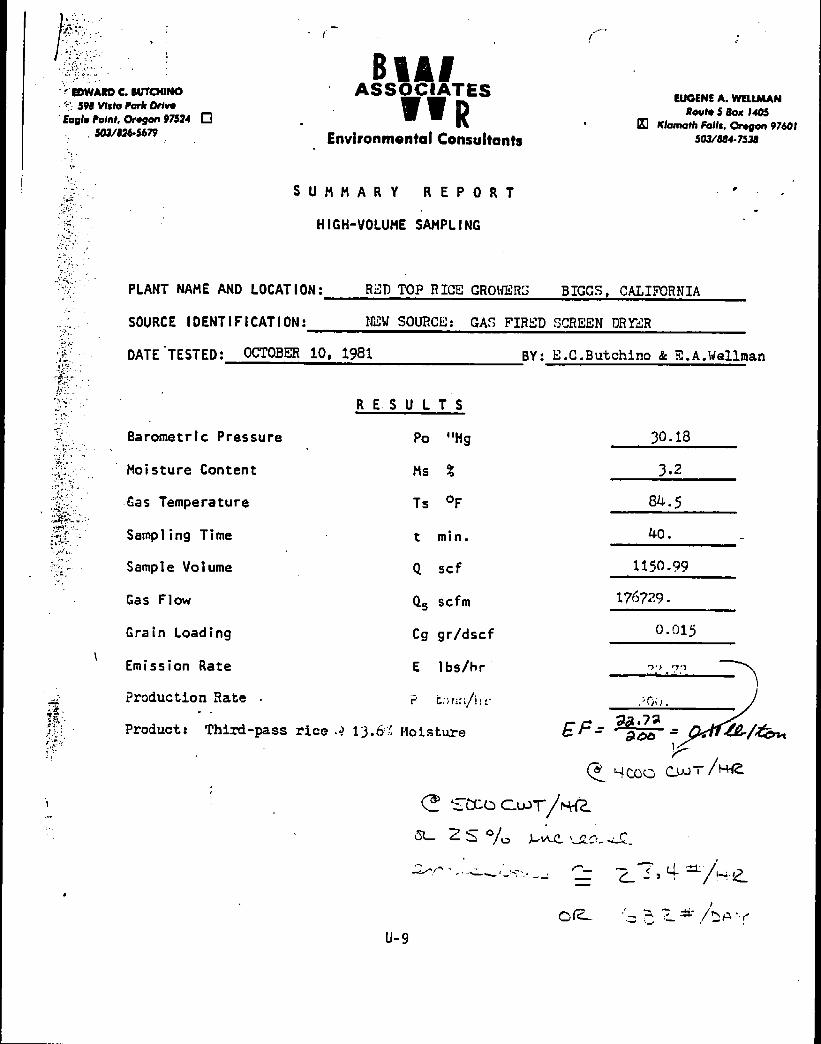
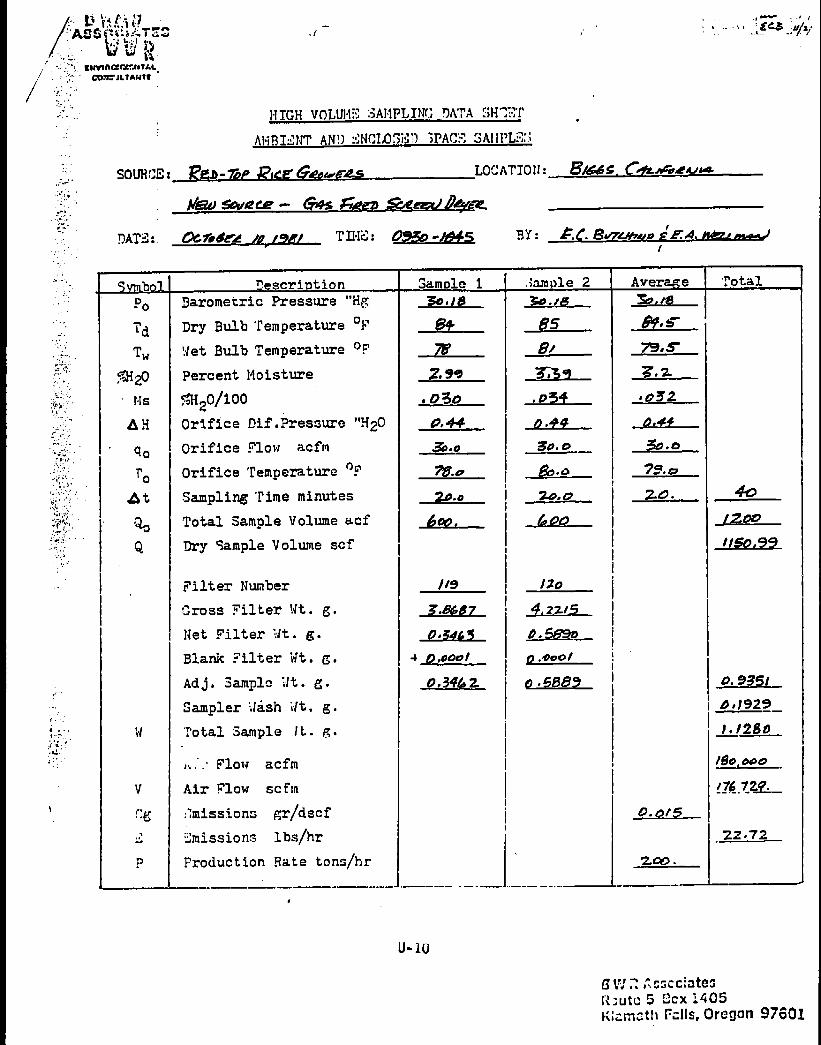
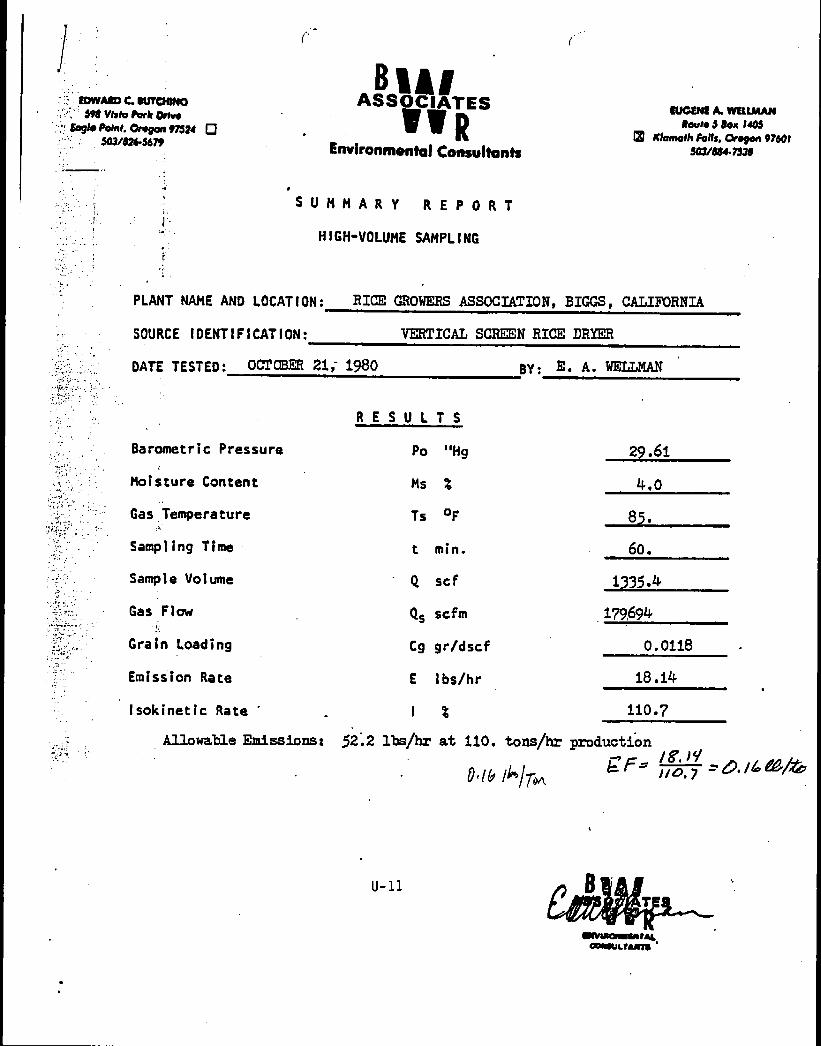
4-10. Summary of Rice Dryer Emission Factors from Reference 48 . . . . . . . . . . . . . . . . . . . . . . . . . 4-21
4-11. Summary of Emission Factors from Carb Rice Dryer Tests Reference 49 . . . . . . . . . . . . . . . . 4-22
4-12. Data Used to Develop Filterable PM, PM-10, and PM-2.5 Emission Factors for GrainElevators . . . . . . . . . . . . . . . . . . . . . . . . . . . . . . . . . . . . . . . . . . . . . . . . . . . . . . . . . . . . . . . . . . . 4-32
4-13. Data Used to Develop Filterable PM and PM-10 Emission Factors for Grain ProcessingFacilities . . . . . . . . . . . . . . . . . . . . . . . . . . . . . . . . . . . . . . . . . . . . . . . . . . . . . . . . . . . . . . . . . . . 4-33
4-14. Data Used to Develop Condensable PM Emission Factors for Grain Processing Facilities . . . 4-34
4-15. Comparison of Computer Programs . . . . . . . . . . . . . . . . . . . . . . . . . . . . . . . . . . . . . . . . . . . . . . 4-36
4-16. Summary of Candidate Particulate Emission Factors for Grain Elevators . . . . . . . . . . . . . . . . 4-37
4-17. Summary of Candidate Particulate Emission Factors for Grain Processing Facilities . . . . . . . 4-38
1.0 Introduction
1-1
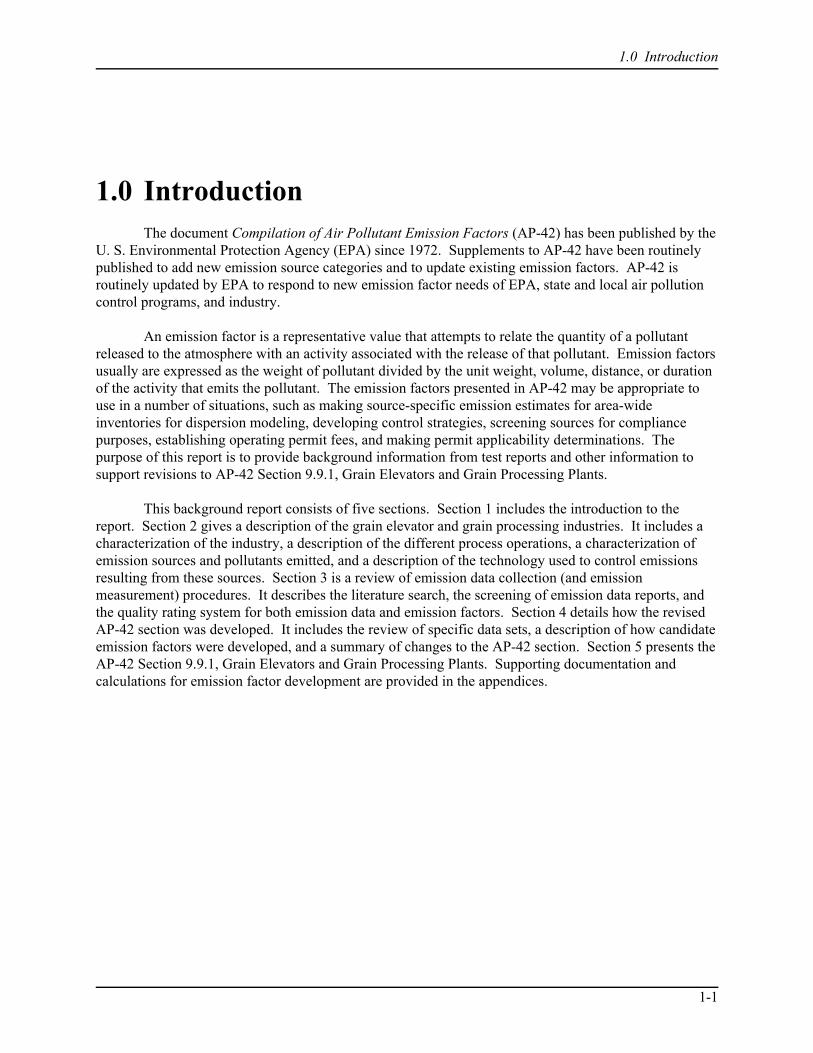
1.0 IntroductionThe document Compilation of Air Pollutant Emission Factors (AP-42) has been published by the
U. S. Environmental Protection Agency (EPA) since 1972. Supplements to AP-42 have been routinelypublished to add new emission source categories and to update existing emission factors. AP-42 isroutinely updated by EPA to respond to new emission factor needs of EPA, state and local air pollutioncontrol programs, and industry.
An emission factor is a representative value that attempts to relate the quantity of a pollutantreleased to the atmosphere with an activity associated with the release of that pollutant. Emission factorsusually are expressed as the weight of pollutant divided by the unit weight, volume, distance, or durationof the activity that emits the pollutant. The emission factors presented in AP-42 may be appropriate touse in a number of situations, such as making source-specific emission estimates for area-wideinventories for dispersion modeling, developing control strategies, screening sources for compliancepurposes, establishing operating permit fees, and making permit applicability determinations. Thepurpose of this report is to provide background information from test reports and other information tosupport revisions to AP-42 Section 9.9.1, Grain Elevators and Grain Processing Plants.
This background report consists of five sections. Section 1 includes the introduction to thereport. Section 2 gives a description of the grain elevator and grain processing industries. It includes acharacterization of the industry, a description of the different process operations, a characterization ofemission sources and pollutants emitted, and a description of the technology used to control emissionsresulting from these sources. Section 3 is a review of emission data collection (and emissionmeasurement) procedures. It describes the literature search, the screening of emission data reports, andthe quality rating system for both emission data and emission factors. Section 4 details how the revisedAP-42 section was developed. It includes the review of specific data sets, a description of how candidateemission factors were developed, and a summary of changes to the AP-42 section. Section 5 presents theAP-42 Section 9.9.1, Grain Elevators and Grain Processing Plants. Supporting documentation andcalculations for emission factor development are provided in the appendices.
1.0 Introduction
1-2
This page intentionally left blank.
2.0 Industry Description
2-1
2.0 Industry DescriptionThis section of the report is divided into four major subsections. The first subsection (2.1) of
this chapter characterizes the industry and includes a general overview of grains and their uses, data ongrain elevators (including their number, location, and capacity), and a discussion of grain milling andprocessing industries, including flour mills, rice mills, dry corn mills, and animal feed manufacturingfacilities. The second subsection (2.2) describes the steps involved in grain handling and processing ingrain elevators and processing facilities. The third subsection (2.3) describes air pollutant emissionsfrom sources in the grain elevator and grain processing industries. The fourth subsection (2.4) describesthe emission control technologies typically applied to air emission sources in the grain elevator and grainprocessing industries.
2.1 Industry Characterization
Industry characterization provides background information on various grains and oilseeds orfeeds and their uses. The subsequent subsections characterize the grain elevator industry and the grainprocessing industries.
2.1.1 Grains and Their Uses1-12
Grains are produced from a very large family of flowering plants referred to as grasses. Grainsinclude corn, wheat, rice, oats, rye, barley, and grain sorghum (or milo), all of which are commonlyreferred to as cereal grains or cereals. Soybeans, lentils, cottonseed, and alfalfa are not grains, but are,however, classified under the category of oilseeds or feeds.
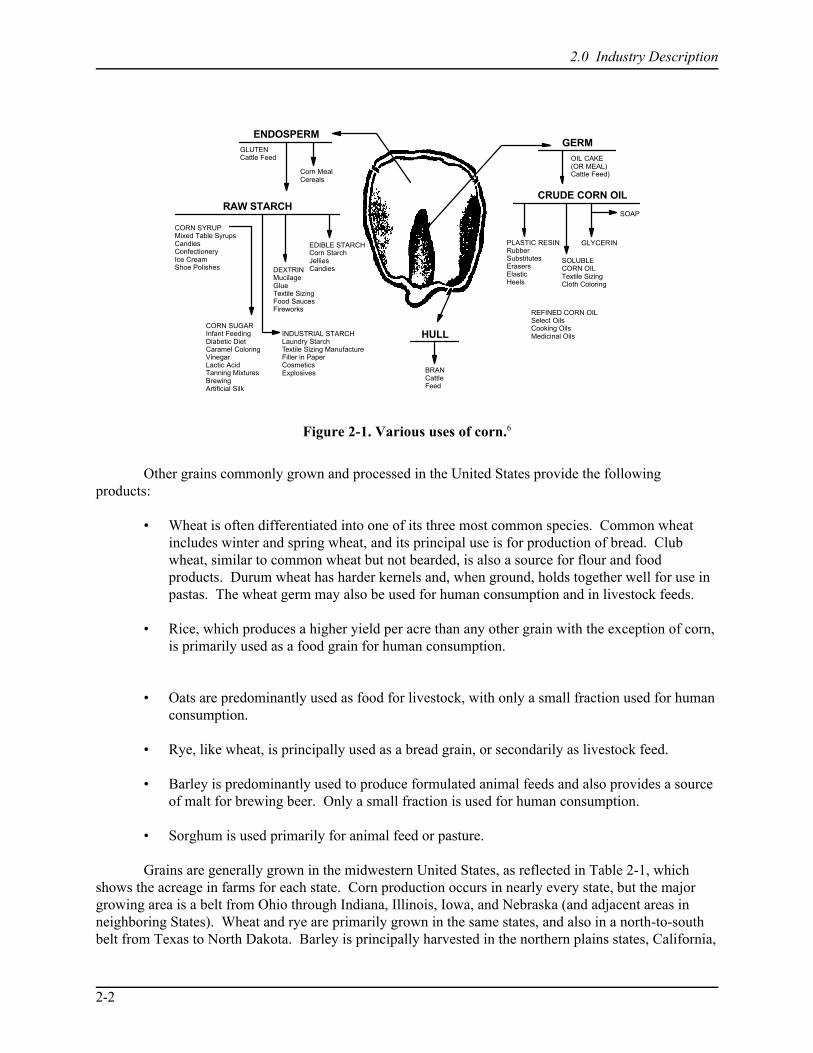
Grain seeds, or kernels, are the focus of grain production, harvesting, and processing. Thekernels of the various grains are generally similar, consisting of primarily germ, endosperm, a bran coat,and hull. During processing, the hull, and frequently the outer bran, the germ, and the endosperm areseparated from each other. Each of these components is used to produce various meals, feeds, and otherproducts. Figure 2-1 illustrates the various uses of the three materials obtained from one grain, corn. The husk or hull can be used or mixed with other ingredients to provide a source of bran in cattle orlivestock feed. The germ, or inner portion of the kernel, can be used to produce meal or various corn oilproducts. The endosperm can be processed to provide meal, cereals, livestock feed (for hogs, cattle,sheep, and poultry), or a number of starch and sugar products. Corn may also be used to produce ethylalcohol (ethanol), which can be used as a gasoline additive for motor vehicle fuel or for the production ofnumerous industrial chemicals.
2.0 Industry Description
2-2
ENDOSPERM
RAW STARCH
GLUTENCattle Feed
Corn MealCereals
EDIBLE STARCHCorn StarchJelliesCandies
CORN SYRUPMixed Table SyrupsCandiesConfectioneryIce CreamShoe Polishes
CORN SUGARInfant FeedingDiabetic DietCaramel ColoringVinegarLactic AcidTanning MixturesBrewingArtificial Silk
DEXTRINMucilageGlueTextile SizingFood SaucesFireworks
INDUSTRIAL STARCHLaundry StarchTextile Sizing ManufactureFiller in PaperCosmeticsExplosives
HULL
BRANCattleFeed
GERMOIL CAKE(OR MEAL)Cattle Feed)
CRUDE CORN OIL
PLASTIC RESINRubberSubstitutesErasersElasticHeels
SOLUBLECORN OILTextile SizingCloth Coloring
GLYCERIN
SOAP
REFINED CORN OILSelect OilsCooking OilsMedicinal Oils
Figure 2-1. Various uses of corn.6
Other grains commonly grown and processed in the United States provide the followingproducts:
• Wheat is often differentiated into one of its three most common species. Common wheatincludes winter and spring wheat, and its principal use is for production of bread. Clubwheat, similar to common wheat but not bearded, is also a source for flour and foodproducts. Durum wheat has harder kernels and, when ground, holds together well for use inpastas. The wheat germ may also be used for human consumption and in livestock feeds.
• Rice, which produces a higher yield per acre than any other grain with the exception of corn,is primarily used as a food grain for human consumption.
• Oats are predominantly used as food for livestock, with only a small fraction used for humanconsumption.
• Rye, like wheat, is principally used as a bread grain, or secondarily as livestock feed.
• Barley is predominantly used to produce formulated animal feeds and also provides a sourceof malt for brewing beer. Only a small fraction is used for human consumption.
• Sorghum is used primarily for animal feed or pasture.
Grains are generally grown in the midwestern United States, as reflected in Table 2-1, whichshows the acreage in farms for each state. Corn production occurs in nearly every state, but the majorgrowing area is a belt from Ohio through Indiana, Illinois, Iowa, and Nebraska (and adjacent areas inneighboring States). Wheat and rye are primarily grown in the same states, and also in a north-to-southbelt from Texas to North Dakota. Barley is principally harvested in the northern plains states, California,
2.0 Industry Description
2-3
Table 2-1. United States Acreage in Farms, 1996a
1996 land in farms,State 1,000 acresTexas 127,000Montana 59,700Kansas 47,800Nebraska 47,000South Dakota 44,000New Mexico 43,700North Dakota 40,300Arizona 35,400Wyoming 34,600Oklahoma 34,000Iowa 33,200Colorado 32,500California 30,000Missouri 30,000Minnesota 29,800Illinois 28,100Oregon 17,500Wisconsin 16,800Indiana 15,900Washington 15,700Ohio 15,100Arkansas 15,000Kentucky 14,000Idaho 13,500Mississippi 12,600Georgia 11,800
1996 land in farms,State 1,000 acresTennessee 11,800Utah 11,000Michigan 10,600Florida 10,300Alabama 9,800North Carolina 9,200Nevada 8,800Louisiana 8,700Virginia 8,600New York 7,700Pennsylvania 7,700South Carolina 5,000West Virginia 3,700Maryland 2,100Hawaii 1,590Vermont 1,350Maine 1,340Alaska 920New Jersey 840Massachusetts 570Delaware 565New Hampshire 430Connecticut 380Rhode Island 63
U.S. TOTAL 968,048aReference 11.
and to a lesser degree in the Midwest and Northwest. Sorghum and oats are grown most commonly in abelt extending from Texas to the Great Lakes region.
2.1.2 Grain Elevators13-16
Grain elevators facilitate the movement of grain from the farmer to the processor or exporter. Operations at most grain elevators are similar, but elevators are generally divided into functionalclassifications according to their size, source of grain, and destination of shipments. The U.S.Department of Agriculture identifies two classes of elevators, country and terminal, on the basis thatterminal elevators furnish USDA official weights under the supervision of a state inspector.
The definitions generally used are less precise, classifying country elevators as those that receivethe bulk of their grain directly from the farm. These elevators are usually of a smaller size than terminalelevators. Terminal elevators are defined as those that receive grain from country elevators and shipgrain directly to a processor or exporter. Terminal elevators are often classified further as either port orinland terminals. An intermediate class of elevators, subterminals, receive the bulk of their shipments
2.0 Industry Description
2-4
from country elevators but still receive a significant amount of grain from farms. Subterminal elevatorsmay ship grain both to terminal elevators and directly to processors.
Regardless of whether the elevator is a country or terminal, there are two basic types of elevatordesign: traditional and modern. Traditional grain elevators are typically designed so the majority of thegrain handling equipment (e.g., conveyors, legs, scales, cleaners) are located inside a building orstructure, normally referred to as a headhouse. The traditional elevator often employs belt conveyorswith a movable tripper to transfer the grain to storage in concrete or steel silos. The belt and trippercombination is located above the silos in an enclosed structure called the gallery or bin deck. Grain isoften transported from storage using belt conveyors located in an enclosed tunnel beneath the silos. Particulate emissions inside the elevator structure may be controlled using equipment such as cyclones,fabric filters, dust covers, or belt wipers; grain may be oil treated to reduce emissions. Controls are oftenused at unloading and loading areas and may include cyclones, fabric filters, baffles in unloading pits,choke unloading, and use of deadboxes or specially designed spouts for grain loading. The operations oftraditional elevators are described in more detail in Section 2.2.1. Traditional elevator design isgenerally associated with facilities built prior to 1980.
Country and terminal elevators built in recent years have moved away from the design of thetraditional elevators. The basic operations performed at the elevators are the same; only the elevatordesign has changed. Most modern elevators have eliminated the enclosed headhouse and gallery (bindecks). They employ a more open structural design, which includes locating some equipment such aslegs, conveyors, cleaners, and scales, outside of an enclosed structure. In some cases, cleaners andscreens may be located in separate buildings. The grain is moved from the unloading area using enclosedbelt or drag conveyors and, if feasible, the movable tripper has been replaced with enclosed distributorsor turn-heads for direct spouting into storage bins and tanks. The modern elevators are also moreautomated, make more use of computers, and are less labor-intensive. Some traditional elevators havealso been partially retrofitted or redesigned to incorporate enclosed outside legs, conveyors, cleaners, andother equipment. Other techniques used to reduce emissions include deepening the trough of the open-belt conveyors and slowing the conveyor speed, and increasing the size of leg belt buckets and slowingleg velocity. At loading and unloading areas of modern elevators, the controls cited above for traditionalelevators can also be used to reduce emissions.
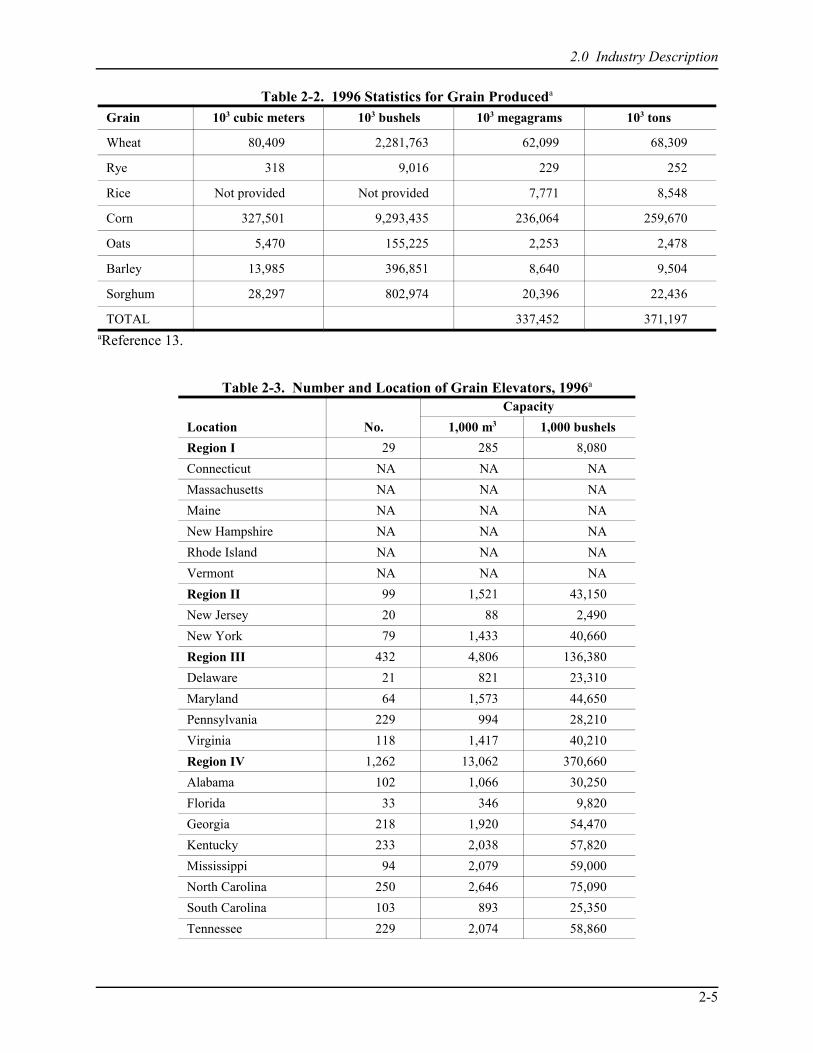
Statistics for the amount of grain produced in the United States in 1996 are shown in Table 2-2. A substantial portion of grain produced in the U.S. is handled through grain elevators. Data available onthe number, size, and location of grain elevators are based on USDA information maintained on off-farmstorage facilities. As of December 1996, a total of 10,717 elevators with a total capacity of2.85 x 108 cubic meters (m3) (8.09 x 10⁹ bushels [bu]) were reported by USDA. The number andcapacity of these elevators listed by EPA region and state is presented in Table 2-3. The average storagecapacity of country elevators is about 2.1 x 10⁴ m3 (6 x 10⁵ bu), and the average capacity of terminals isabout 1.6 x 10⁵ m3 (4.4 x 10⁶ bu). However, there is significant variation in country and terminal elevatorcapacities, with capacities in excess of 50 million bu in one terminal elevator. This capacity includesgrains stored in bins, storage tanks, and warehouse-type facilities that have been added to the originalfacility.
2.0 Industry Description
2-5
Table 2-2. 1996 Statistics for Grain Produceda
Grain 103 cubic meters 103 bushels 103 megagrams 103 tons
Wheat 80,409 2,281,763 62,099 68,309
Rye 318 9,016 229 252
Rice Not provided Not provided 7,771 8,548
Corn 327,501 9,293,435 236,064 259,670
Oats 5,470 155,225 2,253 2,478
Barley 13,985 396,851 8,640 9,504
Sorghum 28,297 802,974 20,396 22,436
TOTAL 337,452 371,197aReference 13.
Table 2-3. Number and Location of Grain Elevators, 1996a
Location No.
Capacity
1,000 m3 1,000 bushels
Region I 29 285 8,080
Connecticut NA NA NA
Massachusetts NA NA NA
Maine NA NA NA
New Hampshire NA NA NA
Rhode Island NA NA NA
Vermont NA NA NA
Region II 99 1,521 43,150
New Jersey 20 88 2,490
New York 79 1,433 40,660
Region III 432 4,806 136,380
Delaware 21 821 23,310
Maryland 64 1,573 44,650
Pennsylvania 229 994 28,210
Virginia 118 1,417 40,210
Region IV 1,262 13,062 370,660
Alabama 102 1,066 30,250
Florida 33 346 9,820
Georgia 218 1,920 54,470
Kentucky 233 2,038 57,820
Mississippi 94 2,079 59,000
North Carolina 250 2,646 75,090
South Carolina 103 893 25,350
Tennessee 229 2,074 58,860
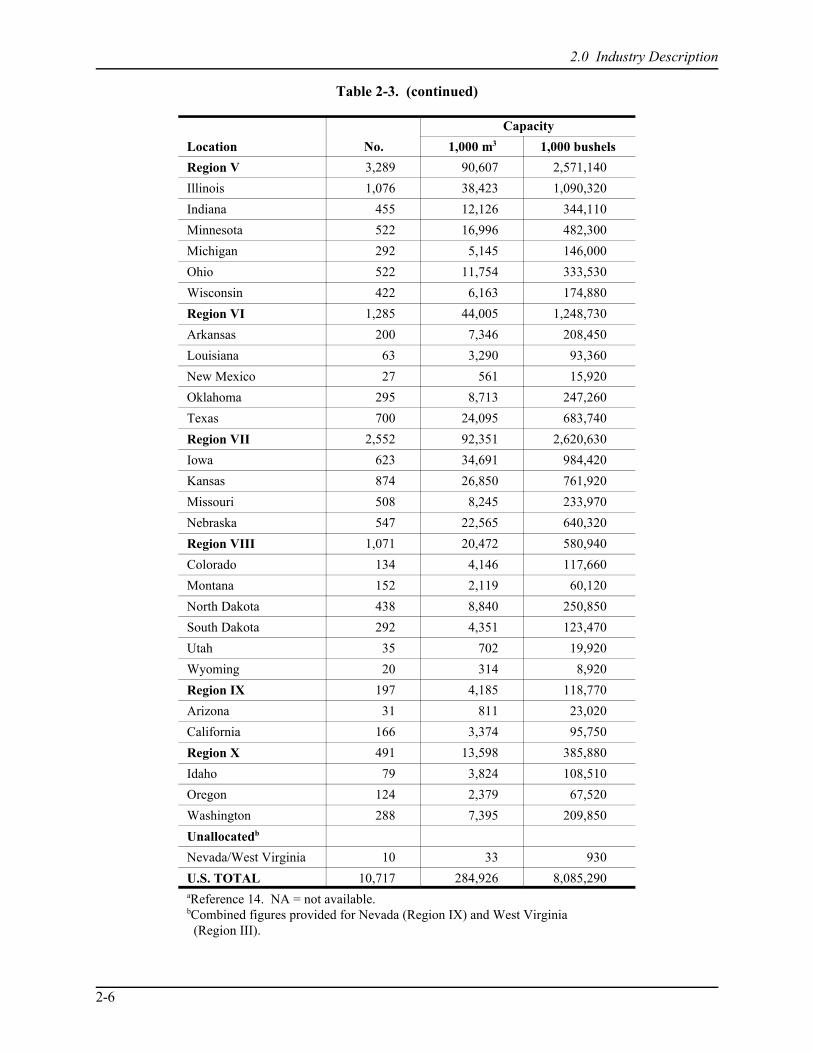
Table 2-3. (continued)
2.0 Industry Description
Location No.
Capacity
1,000 m3 1,000 bushels
2-6
Region V 3,289 90,607 2,571,140
Illinois 1,076 38,423 1,090,320
Indiana 455 12,126 344,110
Minnesota 522 16,996 482,300
Michigan 292 5,145 146,000
Ohio 522 11,754 333,530
Wisconsin 422 6,163 174,880
Region VI 1,285 44,005 1,248,730
Arkansas 200 7,346 208,450
Louisiana 63 3,290 93,360
New Mexico 27 561 15,920
Oklahoma 295 8,713 247,260
Texas 700 24,095 683,740
Region VII 2,552 92,351 2,620,630
Iowa 623 34,691 984,420
Kansas 874 26,850 761,920
Missouri 508 8,245 233,970
Nebraska 547 22,565 640,320
Region VIII 1,071 20,472 580,940
Colorado 134 4,146 117,660
Montana 152 2,119 60,120
North Dakota 438 8,840 250,850
South Dakota 292 4,351 123,470
Utah 35 702 19,920
Wyoming 20 314 8,920
Region IX 197 4,185 118,770
Arizona 31 811 23,020
California 166 3,374 95,750
Region X 491 13,598 385,880
Idaho 79 3,824 108,510
Oregon 124 2,379 67,520
Washington 288 7,395 209,850
Unallocatedb
Nevada/West Virginia 10 33 930
U.S. TOTAL 10,717 284,926 8,085,290aReference 14. NA = not available.bCombined figures provided for Nevada (Region IX) and West Virginia (Region III).

2.0 Industry Description
2-7
Another measure of “size” of grain elevators is the annual throughput (i.e., the total amount ofgrain handled by an elevator during a year). The ratio of grain handled to capacity varies between typesof elevators and at individual elevators from year to year. The variation at country elevators is primarilydependent upon the amount of grain harvested in the area during a particular year and upon theaccessibility of shipping capacity to the elevator. The volume of grain handled by inland terminals isdependent upon quantity of grain harvested, movement of grain, quantity of exports, and marketingchannels used by grain merchants and processors as well as transportation and geographic factors.15
Both country and terminal elevators are classified in Standard Industrial Classification (SIC)Code 5153. No other industries are classified within this SIC code.
2.1.3 Grain Milling and Processing Industry17-22
Grain milling and processing industries encompass those facilities that use grains (wheat, corn,rice, oats, sorghum, barley, and rye) as the primary feedstock and produce final or intermediate grainproducts. These facilities include flour mills (primarily wheat flour mills but also oat and rye mills), ricemills, dry corn mills, and animal feed mills. (Note that in earlier AP-42 editions, soybean processing andcorn wet milling were included in this AP-42 section. In this edition, soybean processing has beenmoved to Section 9.11.1, Vegetable Oil Processing, and corn wet milling has been moved toSection 9.9.7, Corn Wet Milling.)
Flour milling operations are classified in SIC Code 2041, Flour and Other Grain Mill Products,which includes establishments primarily engaged in milling flour or meal from grain except rice. Facilities within this category are engaged primarily in wheat flour milling, but the category also includesbuckwheat, durum, corn, graham (i.e., unbolted wheat flour), oat, and rye flour production as well as cornmeal production via dry corn milling. As of 1992, the U.S. Department of Commerce estimates that therewere 365 facilities in the United States that produced flour and other milled grain products.18 A 1992publication states that there are 205 wheat flour mills, 23 durum wheat mills, and 12 rye mills in theUnited States.17 Table 2-4 lists the number of facilities, by state, for those states with more than100 employees involved in grain milling.
Rice milling operations are classified under SIC Code 2044, Rice Milling. Establishments withinthis SIC code process raw rice to obtain brown rice, milled rice (including polished rice), rice flour, ricemeal, and rice bran. In 1992, there were 53 rice mills in the United States.18 States with the largestnumbers of plants were Arkansas (15), California (11), Louisiana (8), Texas (8), and Mississippi (3).
Animal feed manufacturing facilities process grains, grain milling byproducts, oil extractionbyproducts, and nongrain ingredients to produce formula feeds for livestock and poultry. These facilitiesare included as a part of SIC Code 2048, Prepared Feeds and Feed Ingredients for Animals and Fowls,Except Dogs and Cats. This SIC code is quite broad. In addition to grain processing facilities, itincludes facilities that process hay, alfalfa, animal byproducts, feed supplements, and feed concentratesused to produce animal feed. This section of AP-42 considers only those facilities that process grain toproduce animal feed.
Because both the feed stocks and products for this industry are so diverse, different sources ofinformation on the number of facilities in the industry show substantial discrepancies. The latestinformation presented in the Census of Manufactures indicates that in 1992 a total of 1,714 facilitiesclassified as feed manufacturing facilities under SIC Code 2048 were operating in the United States.18 Table 2-4 shows the distribution of these facilities among the larger producing states. However, a 1985study of the industry reported that the commercial feed industry included about 3,000 primary feedmanufacturing facilities and 10,000 secondary manufacturing facilities.21 (Primary feed manufacturing is

2.0 Industry Description
2-8
Flour and other grain millingState No. of facilitiesCalifornia 29Pennsylvania 26North Carolina 23Kansas 22New York 20Minnesota 18Texas 18Illinois 14Indiana 14Missouri 13Virginia 12Michigan 11Ohio 11Washington 10Iowa 9Tennessee 9Utah 9Georgia 8Wisconsin 8Colorado 6Nebraska 6Florida 5Kentucky 5Oklahoma 5Maryland 3Montana 3Oregon 3North Dakota 2Hawaii 1U.S. TOTAL 365
Animal feed manufacturingc
State No. of facilitiesIowa 117California 110Texas 102Pennsylvania 89Wisconsin 85Illinois 83Nebraska 79North Carolina 72Minnesota 68Georgia 59Kansas 57Arkansas 56Missouri 56Ohio 51New York 49Indiana 47Alabama 46Oklahoma 38Florida 35Colorado 34Washington 33Virginia 30Mississippi 29Kentucky 27Michigan 26Tennessee 26Louisiana 22Oregon 20
U.S. TOTAL 1,714
Table 2-4. Grain Handling and Processing Facilities in the United States, 1992a,b
aOnly States with more than 100 employees within the SIC code listed.bReference 18.cOnly States with more than 20 facilities listed.
2.0 Industry Description
2-9
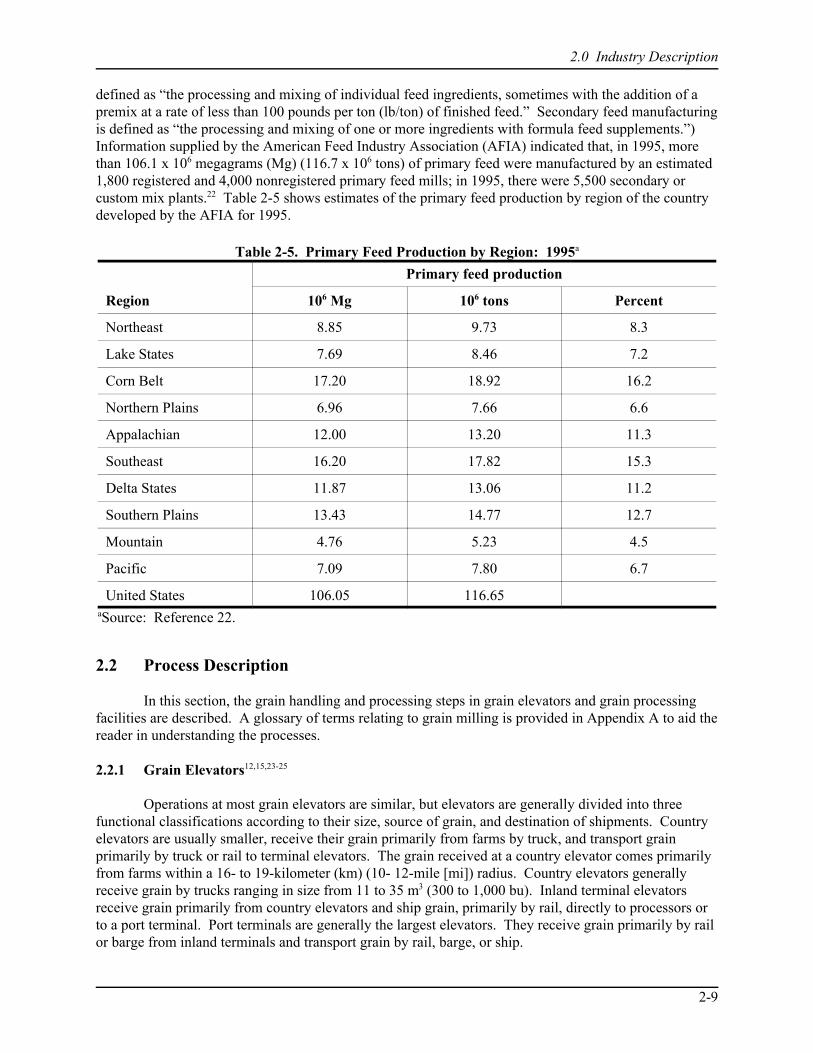
Table 2-5. Primary Feed Production by Region: 1995a
Region
Primary feed production
106 Mg 106 tons Percent
Northeast 8.85 9.73 8.3
Lake States 7.69 8.46 7.2
Corn Belt 17.20 18.92 16.2
Northern Plains 6.96 7.66 6.6
Appalachian 12.00 13.20 11.3
Southeast 16.20 17.82 15.3
Delta States 11.87 13.06 11.2
Southern Plains 13.43 14.77 12.7
Mountain 4.76 5.23 4.5
Pacific 7.09 7.80 6.7
United States 106.05 116.65aSource: Reference 22.
defined as “the processing and mixing of individual feed ingredients, sometimes with the addition of a premix at a rate of less than 100 pounds per ton (lb/ton) of finished feed.” Secondary feed manufacturingis defined as “the processing and mixing of one or more ingredients with formula feed supplements.”) Information supplied by the American Feed Industry Association (AFIA) indicated that, in 1995, morethan 106.1 x 10⁶ megagrams (Mg) (116.7 x 10⁶ tons) of primary feed were manufactured by an estimated1,800 registered and 4,000 nonregistered primary feed mills; in 1995, there were 5,500 secondary orcustom mix plants.22 Table 2-5 shows estimates of the primary feed production by region of the countrydeveloped by the AFIA for 1995.
2.2 Process Description
In this section, the grain handling and processing steps in grain elevators and grain processingfacilities are described. A glossary of terms relating to grain milling is provided in Appendix A to aid thereader in understanding the processes.
2.2.1 Grain Elevators12,15,23-25
Operations at most grain elevators are similar, but elevators are generally divided into threefunctional classifications according to their size, source of grain, and destination of shipments. Countryelevators are usually smaller, receive their grain primarily from farms by truck, and transport grainprimarily by truck or rail to terminal elevators. The grain received at a country elevator comes primarilyfrom farms within a 16- to 19-kilometer (km) (10- 12-mile [mi]) radius. Country elevators generallyreceive grain by trucks ranging in size from 11 to 35 m3 (300 to 1,000 bu). Inland terminal elevatorsreceive grain primarily from country elevators and ship grain, primarily by rail, directly to processors orto a port terminal. Port terminals are generally the largest elevators. They receive grain primarily by railor barge from inland terminals and transport grain by rail, barge, or ship.

2.0 Industry Description
2-10
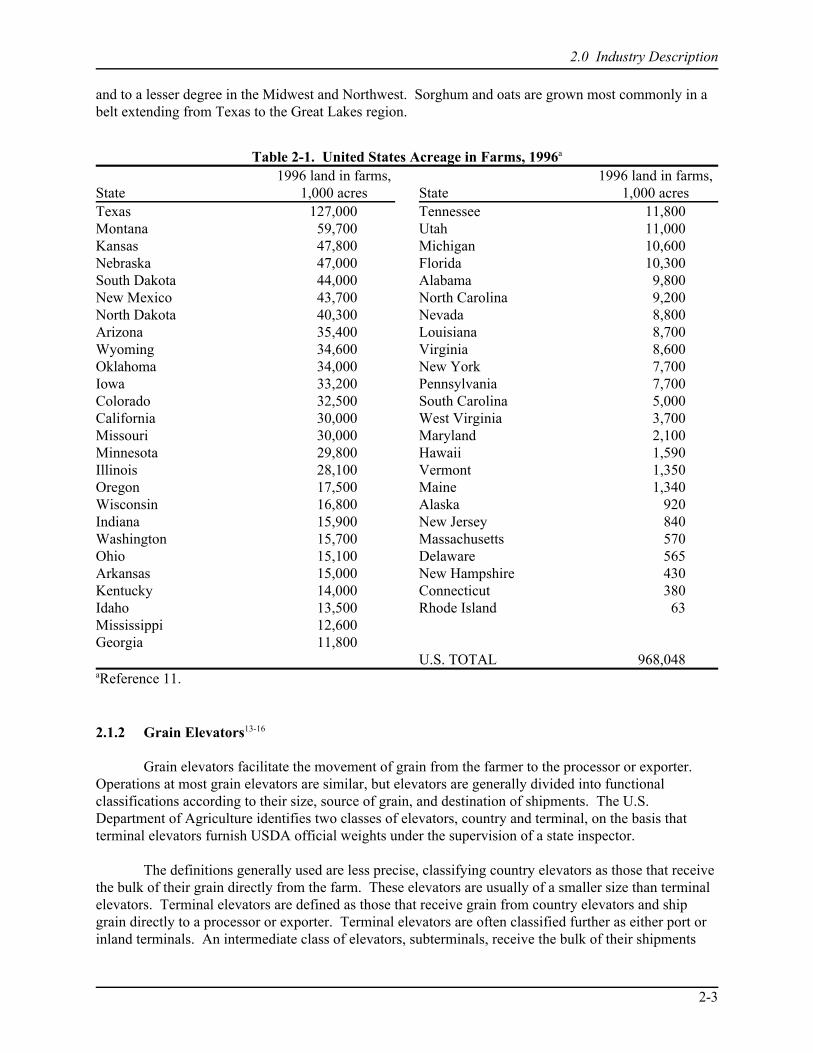
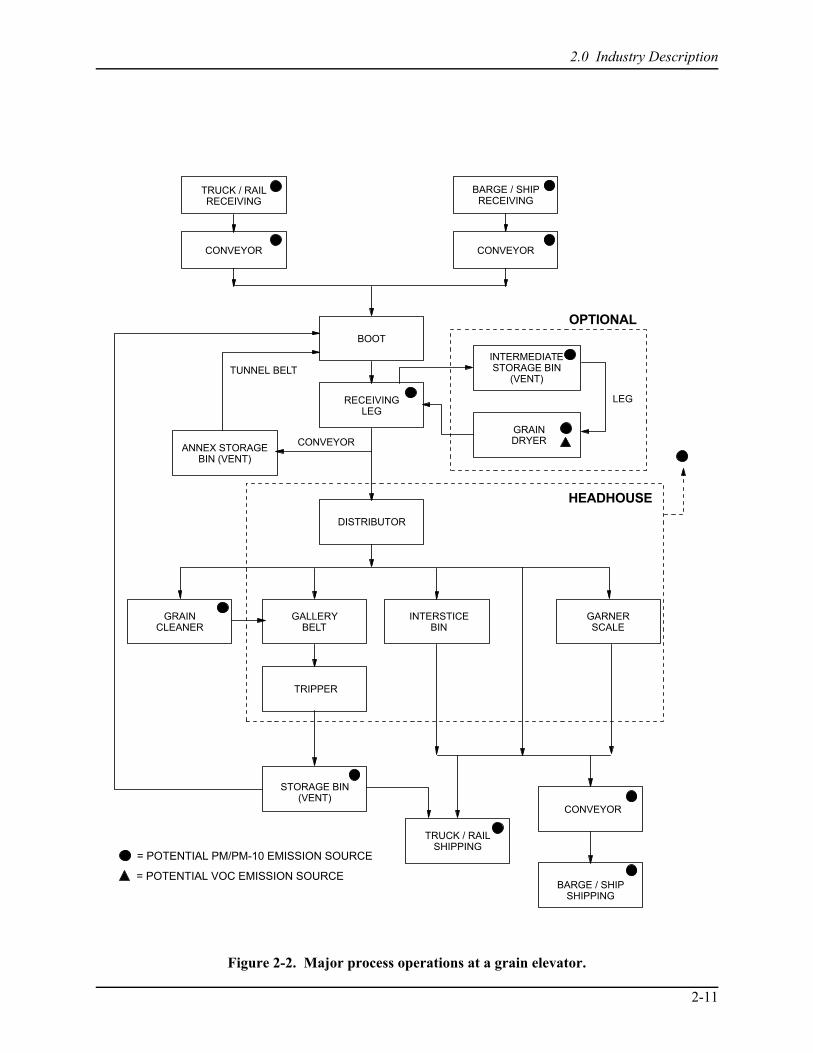
A grain elevator normally consists of a series of upright concrete or steel bins, wooden bins,and/or flat storage areas depending on the individual facility. Country elevators are usually designed tomake maximum use of gravity flow in order to simplify the operations and minimize the use ofmechanical equipment. Because of the large storage capacity and high grain-handling rates in terminalelevators, belt conveyors are generally used to move grain in these elevators. However, drag conveyors,augers, and direct spouting also may be used, particularly in newer elevators. Figure 2-2 identifies themajor process operations at a grain elevator and also identifies potential PM emission sources; however,there is great diversity in the physical configuration of different elevators including the number ofelevator legs and headhouse systems. In addition, many process vents are tied to ventilation systems andexhausted to air pollution control systems; the particular configuration of the ventilation system varieswidely. Typical grain elevator process operations are discussed in the paragraphs which follow. Thepotential emission sources are discussed in Section 2.3.1.
After weigh-in, trucks are driven into an unloading station which is often a drive-through tunnelin the center of the elevator, or a shed located alongside the elevator. An elevator may have one or moreof these stations. At country elevators, straight-bottom trucks are unloaded either by hydraulically liftingthe dump bed, by lifting the front end of the truck with an overhead system, or by lifting the truck on ahydraulic platform. Grain flows out a gate in the back of the truck and falls through a grating into thereceiving pit hopper. After unloading, trucks are reweighed to determine the quantity of grain received. Increasingly, grain received at country elevators is delivered in hopper-bottom (gondola) trucks. Thesetrucks are positioned over the receiving pit grates and are unloaded from gates in the bottom of the truck. The truck receiving pit or hopper may have a capacity of 35 to 42 m3 (1,000 to 1,200 bu), which issufficient to handle the largest trucks. At terminal elevators, hopper railcars are unloaded over grates thatare between the railroad tracks alongside the elevator. Sometimes railcar unloading areas are enclosed,but often they consist only of a roof over the unloading area. By opening the doors in the bottom of ahopper railcar, the grain flows through the grating into the receiving hopper.
In some cases, the receiving hopper system is large enough that the entire hopper truck or railcarcan be unloaded without filling the receiving hopper. In other cases, the receiving hopper iscomparatively small, quickly fills up, and blocks the bottom outlet of the hopper car. In the latterinstance, grain flows out of the car only at the rate at which the grain is carried out of the receivinghopper. This latter type of unloading is termed “choke unloading” and can considerably reduce thequantity of dust generated in comparison to an unloading system in which all of the grain free falls intothe receiving hopper.
Barges are unloaded by a bucket elevator (either a continuous barge unloader or marine leg) thatis extended down into the barge hold. Once elevated to the top of the leg, the grain is discharged ontobelt conveyors that carry the grain to the elevator proper. Barge unloading capacity at a terminal elevatorcan range from 630 to 2,600 m3/hr (18,000 to 75,000 bu/hr), with an average unloading rate of 880 to1,100 m3/hr (25,000 to 30,000 bu/hr).
The grain dumped into the receiving hopper at a country elevator usually flows by gravity to thebottom (the boot) of the bucket elevator. In terminal elevators and in some country elevators, the grain istransported from the receiving hopper to the boot by means of belt, drag, or screw conveyors. From theboot, the grain is elevated by a leg (in this case the receiving leg) to the top of the elevator. Countryelevators typically have only one or two receiving legs with a capacity ranging from 176 to 530 m3/hr(5,000 to 15,000 bu/hr). Terminal elevator legs have an average capacity of 1,233 m3/hr (35,000 bu/hr)or more, and a large elevator may have four or more legs.
At the top of the leg, the distributor, or some system of movable spouts, directs the grain eitheronto a gallery belt, into a scale garner for weighing and loadout, or into cleaning equipment. The section
2.0 Industry Description
2-11
BOOT
RECEIVING LEG
CONVEYORCONVEYOR
DISTRIBUTOR
ANNEX STORAGEBIN (VENT)
GRAIN CLEANER
GARNER SCALE
GALLERY BELT
TRIPPER
STORAGE BIN(VENT)
INTERSTICE BIN
TRUCK / RAILSHIPPING
CONVEYOR
BARGE / SHIPSHIPPING
GRAIN DRYER
LEG
OPTIONAL
TUNNEL BELT
CONVEYOR
HEADHOUSE
TRUCK / RAILRECEIVING
BARGE / SHIPRECEIVING
INTERMEDIATESTORAGE BIN
(VENT)
= POTENTIAL PM/PM-10 EMISSION SOURCE
= POTENTIAL VOC EMISSION SOURCE
Figure 2-2. Major process operations at a grain elevator.
2.0 Industry Description
2-12
of the elevator that performs these functions is referred to as the “headhouse.” Grain directed onto agallery belt is conveyed across the top of the bins (gallery area) to a “tripper,” which discharges the graininto the proper storage bin.
Grain received from the farm may contain various types of foreign material. Depending onmarket conditions, equipment availability, and local crop conditions, elevators may sometimes cleangrain prior to sending the grain to storage bins. Various types of screens and aspiration systems (air“vacuuming” of lightweight foreign material) can be used to clean the grain. The two basic types ofcleaners are vibrating cleaners and enclosed stationary cleaners. Vibrating cleaners employ one or moreinclined moving screens and are normally located within the elevator. In stationary cleaners, grain passesthrough a series of stationary screens of varying screen size; these units may be located either inside oroutside the elevator.
Moving grain from the storage bins for loadout usually involves gravity flow back to the elevatorboot, reelevation, and discharge through the distributor to the outloading point. The grain may bewithdrawn from one or several storage bins via slide valves at the bottom of the bins. The grain falls bygravity from the storage bins into a tunnel belt leading back to the legs. The leg elevates the grain to thedistributor head where it may be directed in one of three ways.
1. The grain may be directed to a scale hopper or garner, batch weighed in the scale, and thenreleased through a loadout spout to a waiting truck or railroad car.
2. The grain may be directed to the truck loadout (or interstice) bin located directly above thedrive-through tunnel or shed, where a waiting truck may be loaded at the same position where unloadingtakes place.
3. The grain may enter the distributor and fall directly through the loadout spout to a waitingtruck or railcar.
An alternate method of loading is direct loading from individual bins by means of spouts thatprotrude from the bin walls. In this case, grain is distributed directly to either trucks or railcars or to theinterstice bins above the drive-through tunnel for trucks. Loading of trucks at terminal elevators issimilar to that at country elevators, except that grain is loaded at a faster rate. The loadout area is oftenpartially enclosed, with openings at each end for truck arrival and departure. Hopper railcar loading isaccomplished in a similar manner.
Barge- or ship-loading spouts associated with terminal elevators are generally located at barge orship piers some distance from the elevator itself. In these cases, when the grain is released from thestorage bins it may bypass the leg and fall onto the first of a series of conveyors that transport it to thebarge- or ship-loading spouts.
Many elevators also include an annex storage facility. This annex may consist of severaladditional bins or a “flat-storage” tank or building for extra storage. Annex storage requires a gallerybelt and “tripper” or some other form of conveyor to convey the grain from the discharge of the receivingleg to the annex storage bins, and a “tunnel belt,” auger, or drag conveyor beneath the bins to convey thegrain back to the boot of the elevator.
If the grain received at an elevator has a moisture content higher than that at which grain can besafely stored, it must be dried within a few days after receipt. Although many grains may require drying,corn usually necessitates the use of dryers. When the corn is received, it may contain 20 percentmoisture or more, and must be dried to 13 percent to 14 percent moisture to be suitable for storage. Mostcountry elevators are equipped with grain drying equipment. The four types of off-farm continuous-flow
2.0 Industry Description
2-13
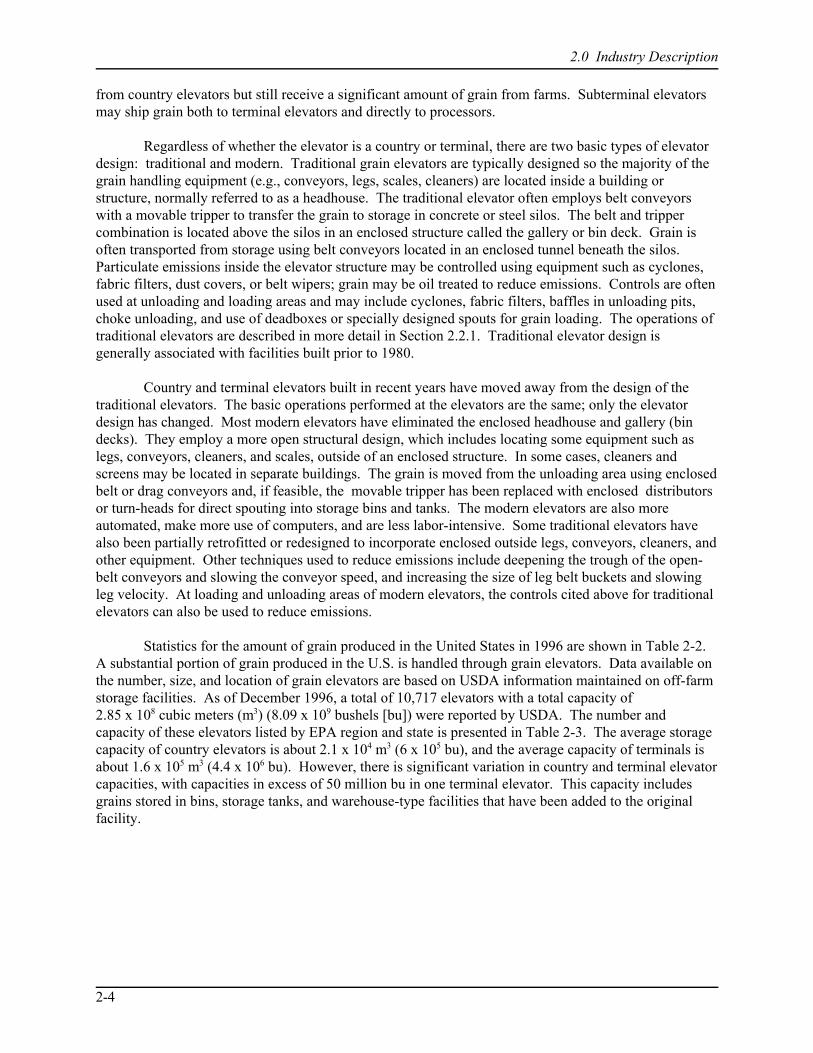
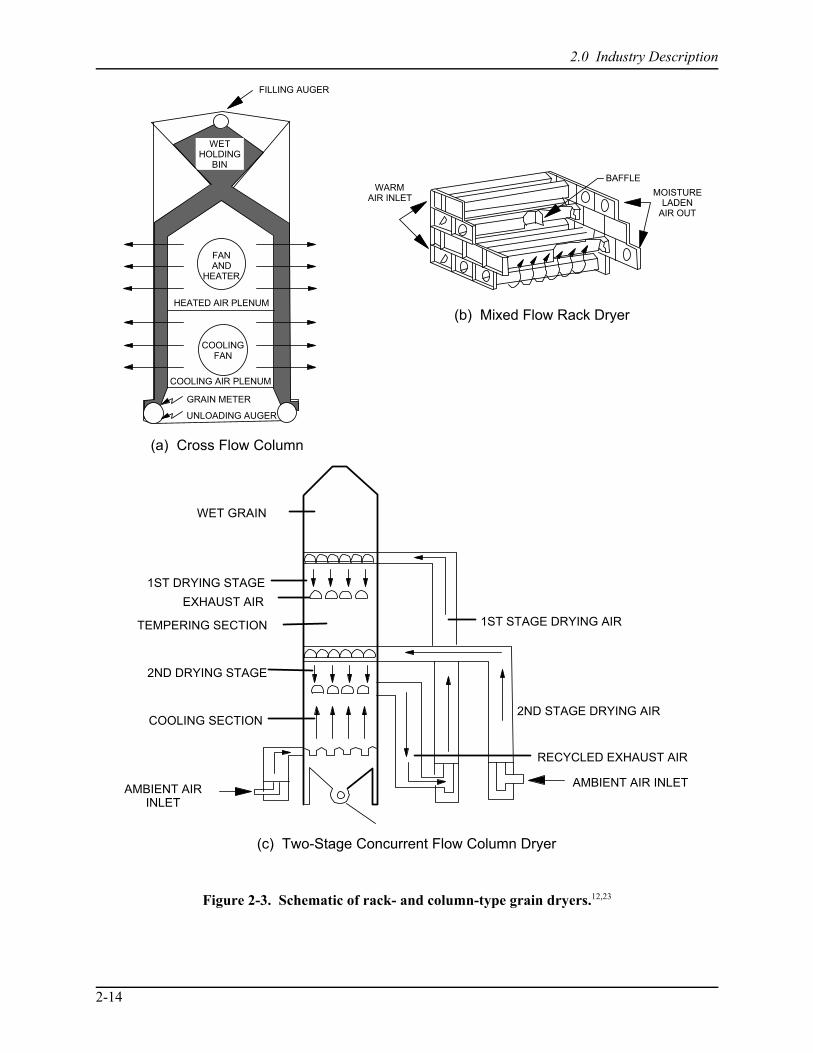
dryers currently used are cross-flow, concurrent flow, counterflow, and mixed-flow. Historically, cross-flow column-type dryers and mixed flow rack-type dryers have been used to dry grain at elevators. Figure 2-3 presents schematic diagrams for three types of units—a conventional cross-flow column dryer,a mixed-flow rack dryer, and a two-stage concurrent flow dryer. In the fourth type of unit—counterflow—the warm drying air is introduced at the bottom of the column and flows upward as the grain passesdown the column.12 The EPA’s New Source Performance Standards (NSPS) for grain elevatorsestablished visible emission limits for grain dryers by requiring 0 percent opacity for emissions fromcolumn dryers with column plate perforations not to exceed 2.4 mm diameter (0.094 in.) or rack dryerswith a screen filter not to exceed 50 mesh openings. Grain dryers generally require an additional leg toelevate wet grain from intermediate storage bins to the top of the dryer, and a means of conveying thedried grain from the dryer back to the primary leg for elevation to final storage. Grain dryers areavailable in a wide range of capacities, and the size installed is dependent upon the quantity of wet grainthat is expected to be processed. A typical country elevator installation would likely have one dryer witha capacity of 17.6 to 35.0 m3/hr (500 to 1,000 bu/hr).
Large elevators may need to cool stored grain periodically to preserve its quality. One historicalmethod for accomplishing this cooling is by “turning” the grain during cold weather -- essentiallyelevating it to a height and allowing it to fall through cold ambient air. However, most modern terminalelevators employ in-bin aeration systems to control grain temperature and moisture content. With suchsystems cooling is accomplished by aerating the grain with cool air, which is either blown into or pulledthrough the grain mass by a system of ducts and fans tied to the storage bins.25
2.2.2 Grain Milling and Processing
The grain milling and processing industry comprises a large number of geographically dispersedfacilities that have diverse feedstocks and produce a wide variety of products, such as flours, meals, oils,starches, syrups, and animal feeds. Because of the diversity of the industry, its scope is not well-defined. This discussion will be limited to those facilities that use grain as the primary raw material to produceeither final products for human or animal consumption or intermediate products that are subsequentlysubjected to further processing. Although even this segment of the industry is quite diverse, it can bedivided into five general segments based on similarity of processes and end products: (1) wheat andrelated dry grain milling, (2) oat milling, (3) rice milling, (4) corn dry milling, and (5) animal feedmanufacturing. The processes used in each of these five segments are described in the subsectionsbelow.
2.2.2.1 Wheat and Related Dry Grain Milling.23,24 Wheat, durum wheat, and rye, areprocessed through a sequence of dry milling operations to produce flour, bran, middlings, and meal.23 Although these processes do differ as a function of grain and end product, they have many similarities. Wheat flour milling is by far the predominant dry milling process and is described first, followed bydiscussions of durum wheat and rye milling processes.
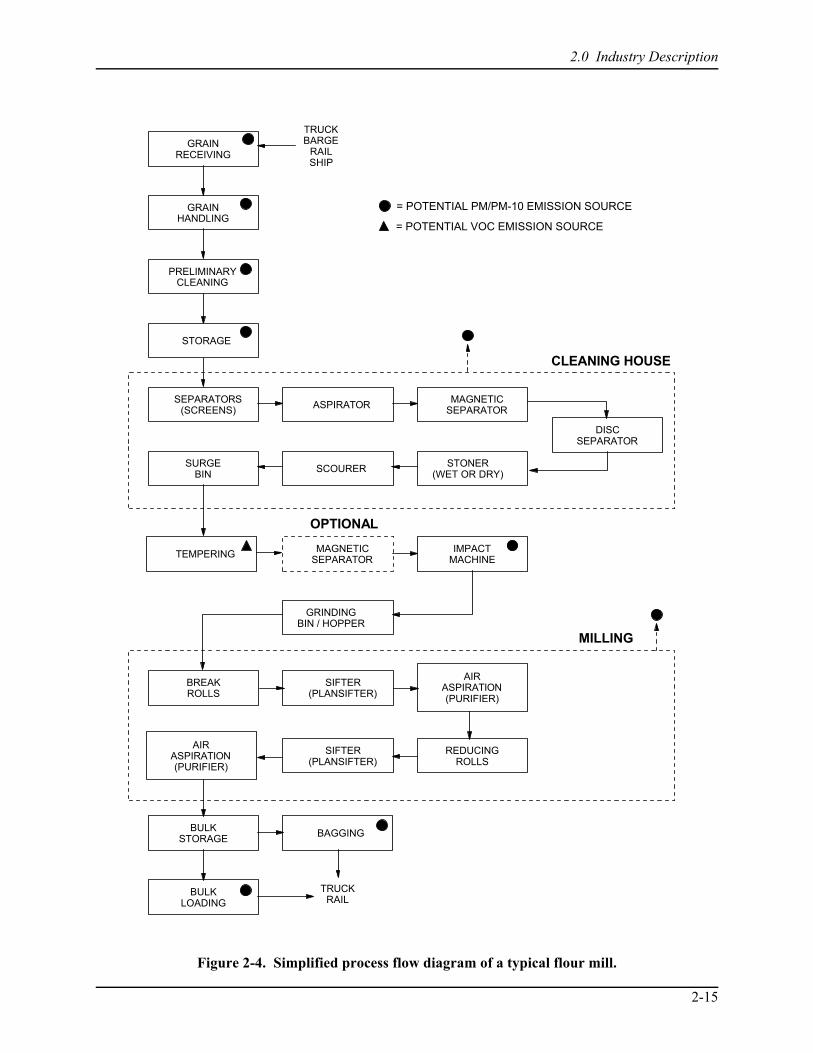
The wheat flour milling process consists of five main steps:
1. Grain reception, preliminary cleaning, and storage.2. Grain cleaning.3. Tempering or conditioning.4. Milling the grain into flour and its byproducts.5. Storage and/or shipment of finished product.
Figure 2-4 presents a simplified diagram of a typical flour mill. Operations performed in each of theseareas are discussed in the following paragraphs.
2.0 Industry Description
2-14
(b) Mixed Flow Rack Dryer
BAFFLE
MOISTURELADEN
AIR OUT
WARMAIR INLET
(a) Cross Flow Column
FILLING AUGER
FANAND
HEATER
COOLINGFAN
WETHOLDING
BIN
UNLOADING AUGER
GRAIN METER
COOLING AIR PLENUM
HEATED AIR PLENUM
(c) Two-Stage Concurrent Flow Column Dryer
COOLING SECTION
AMBIENT AIRINLET
WET GRAIN
1ST DRYING STAGE
EXHAUST AIR
TEMPERING SECTION
2ND DRYING STAGE
1ST STAGE DRYING AIR
2ND STAGE DRYING AIR
RECYCLED EXHAUST AIR
AMBIENT AIR INLET
Figure 2-3. Schematic of rack- and column-type grain dryers.12,23
2.0 Industry Description
2-15
GRAIN HANDLING
GRAIN RECEIVING
PRELIMINARYCLEANING
SEPARATORS(SCREENS) ASPIRATOR MAGNETIC
SEPARATOR
SURGE BIN SCOURER STONER
(WET OR DRY)
DISC SEPARATOR
TEMPERING MAGNETICSEPARATOR
IMPACT MACHINE
BREAK ROLLS
SIFTER(PLANSIFTER)
AIR ASPIRATION(PURIFIER)
SIFTER(PLANSIFTER)
REDUCING ROLLS
BULK STORAGE BAGGING
BULKLOADING
TRUCKRAIL
GRINDINGBIN / HOPPER
OPTIONAL
TRUCKBARGE
RAILSHIP
AIR ASPIRATION(PURIFIER)
CLEANING HOUSE
MILLING
STORAGE
= POTENTIAL PM/PM-10 EMISSION SOURCE
= POTENTIAL VOC EMISSION SOURCE
Figure 2-4. Simplified process flow diagram of a typical flour mill.
2.0 Industry Description
2-16
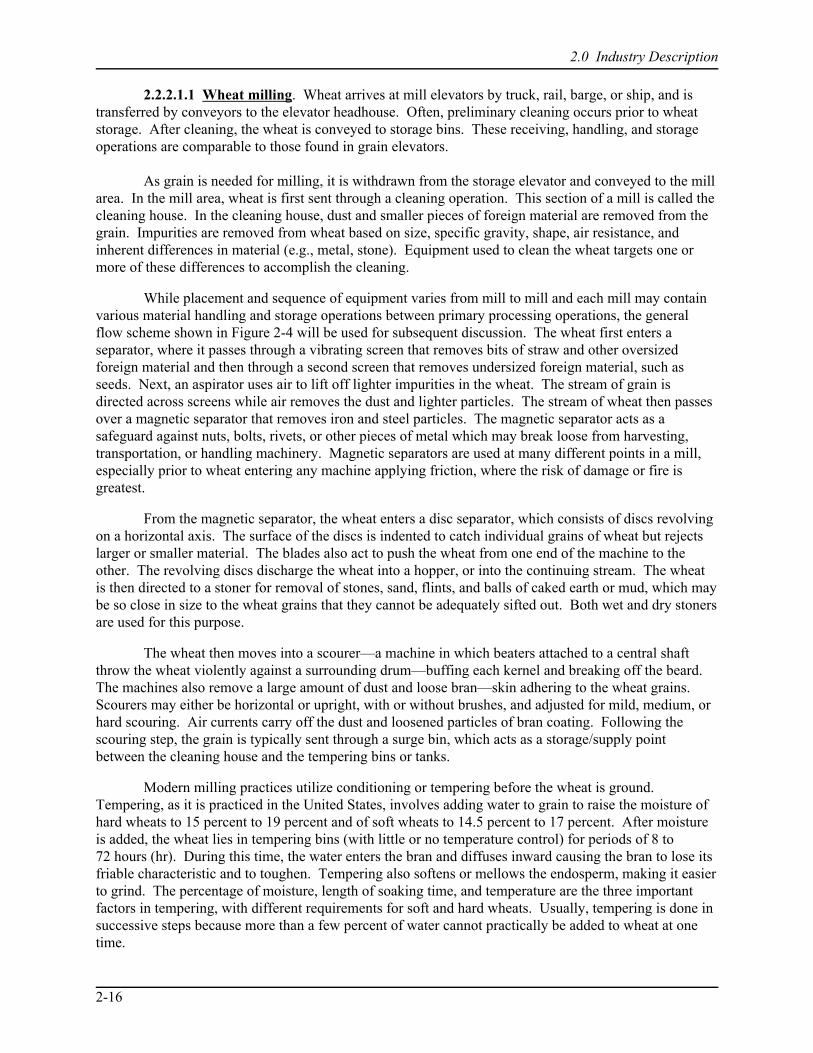
2.2.2.1.1 Wheat milling. Wheat arrives at mill elevators by truck, rail, barge, or ship, and istransferred by conveyors to the elevator headhouse. Often, preliminary cleaning occurs prior to wheatstorage. After cleaning, the wheat is conveyed to storage bins. These receiving, handling, and storageoperations are comparable to those found in grain elevators.
As grain is needed for milling, it is withdrawn from the storage elevator and conveyed to the millarea. In the mill area, wheat is first sent through a cleaning operation. This section of a mill is called thecleaning house. In the cleaning house, dust and smaller pieces of foreign material are removed from thegrain. Impurities are removed from wheat based on size, specific gravity, shape, air resistance, andinherent differences in material (e.g., metal, stone). Equipment used to clean the wheat targets one ormore of these differences to accomplish the cleaning.
While placement and sequence of equipment varies from mill to mill and each mill may containvarious material handling and storage operations between primary processing operations, the generalflow scheme shown in Figure 2-4 will be used for subsequent discussion. The wheat first enters aseparator, where it passes through a vibrating screen that removes bits of straw and other oversizedforeign material and then through a second screen that removes undersized foreign material, such asseeds. Next, an aspirator uses air to lift off lighter impurities in the wheat. The stream of grain isdirected across screens while air removes the dust and lighter particles. The stream of wheat then passesover a magnetic separator that removes iron and steel particles. The magnetic separator acts as asafeguard against nuts, bolts, rivets, or other pieces of metal which may break loose from harvesting,transportation, or handling machinery. Magnetic separators are used at many different points in a mill,especially prior to wheat entering any machine applying friction, where the risk of damage or fire isgreatest.
From the magnetic separator, the wheat enters a disc separator, which consists of discs revolvingon a horizontal axis. The surface of the discs is indented to catch individual grains of wheat but rejectslarger or smaller material. The blades also act to push the wheat from one end of the machine to theother. The revolving discs discharge the wheat into a hopper, or into the continuing stream. The wheatis then directed to a stoner for removal of stones, sand, flints, and balls of caked earth or mud, which maybe so close in size to the wheat grains that they cannot be adequately sifted out. Both wet and dry stonersare used for this purpose.
The wheat then moves into a scourer—a machine in which beaters attached to a central shaftthrow the wheat violently against a surrounding drum—buffing each kernel and breaking off the beard. The machines also remove a large amount of dust and loose bran—skin adhering to the wheat grains. Scourers may either be horizontal or upright, with or without brushes, and adjusted for mild, medium, orhard scouring. Air currents carry off the dust and loosened particles of bran coating. Following thescouring step, the grain is typically sent through a surge bin, which acts as a storage/supply pointbetween the cleaning house and the tempering bins or tanks.
Modern milling practices utilize conditioning or tempering before the wheat is ground. Tempering, as it is practiced in the United States, involves adding water to grain to raise the moisture ofhard wheats to 15 percent to 19 percent and of soft wheats to 14.5 percent to 17 percent. After moistureis added, the wheat lies in tempering bins (with little or no temperature control) for periods of 8 to72 hours (hr). During this time, the water enters the bran and diffuses inward causing the bran to lose itsfriable characteristic and to toughen. Tempering also softens or mellows the endosperm, making it easierto grind. The percentage of moisture, length of soaking time, and temperature are the three importantfactors in tempering, with different requirements for soft and hard wheats. Usually, tempering is done insuccessive steps because more than a few percent of water cannot practically be added to wheat at onetime.

2.0 Industry Description
2-17
When the moisture is properly dispersed in the wheat for efficient milling, the grain is passedthrough an impact machine as a final step in cleaning, possibly after passing through an additionalmagnetic separation step. Discs revolving at high speed in the impact machine hurl the wheat againstfingerlike pins. The impact cracks any unsound kernels, which are subsequently rejected. From theimpact machines, the wheat flows to a grinding bin or hopper from which it is fed in a continuousmetered stream into the mill itself.
The milling of bread wheat to flour is done with a series of roller mills, pairs of rolls which rotatein opposite directions at different rates of speed and exert relatively gentle shearing rather than crunchingforces. The roller milling area is divided into two sections, the break system and the reduction system. In the break system, the kernel is broken open and the endosperm is separated from the bran and germ. The break system quite often involves four or more sets of corrugated rolls, each taking feed stock fromthe preceding one. After each break, the mixture of free bran, free endosperm, free germ, and brancontaining adhering endosperm is sifted. The bran having endosperm still attached goes to the next breakroll, and the process is repeated until as much endosperm has been separated from the bran as is possible.
The sifting system is a combination of sieving operation (plansifters) and air aspiration(purifiers). The plansifter has flat sieves piled in tiers, one above the other. The action of the sifter isrotary in a plane parallel with the floor. As the sifter moves in about a 89-mm (3.5-in) diameter circle,the small-sized particles spill through the sieve below while the oversized particles travel across the sieveto a collecting trough and are removed. As many as 12 sieves can be stacked one on top of the other, andthere are four separate compartments in one plansifter. The flour and endosperm chunks (middlings)from the plansifter still contain minute bran particles, which are removed by sending the product througha purifier where air currents carry the bran away. A purifier is essentially a long oscillating sieve,inclined downwards becoming coarser from head to tail. The currents pass upward through the sievecausing the flour to stratify into endosperm chunks of different size. Aspirated materials are used formillfeed, which consists of brans and shorts.
The reduction system comprises two parts, roll mills and sifting machines. In roll mills, surfacesof the rolls are smooth, rather than grooved, and are set to reduce endosperm middling to flour-sizeparticles and facilitate the removal of the last remaining particles of bran and germ. Plansifters are alsoused behind the reduction rolls, and their purpose is to divide the stock into coarse middlings, finemiddlings, and flour. The coarse middlings are returned to the coarse (or sizing) rolls, and the finemiddlings are returned to the fine roll, while the flour is removed from the milling system. Purifiers areoften used behind the coarse reduction rolls for size grading rather than purification. Purifiers aresometimes superior to plansifters for these separation requirements.
Flour stock is transported from machine to machine by gravity or air conveying. Older millsdepend upon gravity, with the wheat and flour being moved to the top of the mill by bucket elevatorsfrom which the flour flows by spouts to the rolls and to the sifters. Bucket elevators have two seriousdisadvantages: they are dusty and they can harbor insects. Consequently, newer flour mills haveconverted to the air conveying of flour and are abandoning bucket elevators and gravity spouts.
Transfer of the finished product to storage, bagging, or bulk loading is generally done bypneumatic conveying systems. Bulk storage capacity varies widely, but most mills have bulk flourstorage from 2 to 4 days of production. Special railroad cars and trucks are generally used to transportbulk flour.
2.2.2.1.2 Durum wheat milling. Durum wheat has harder kernels than bread wheat and is usedprimarily to make pasta. In the milling of durum, middlings rather than flour are the desired product. Consequently, the break system, in which middlings are formed, is emphasized, and the part of thereduction system in which flour is formed is de-emphasized. Generally, durum processing comprises the
2.0 Industry Description
2-18
same 5 steps as those used for flour milling. Steps 1, 2, and 5 are essentially identical for durum andflour milling. The tempering in Step 3 varies only slightly between the two processes. Only Step 4differs significantly from the comparable flour milling step, and it will be the main focus of thediscussion below.
The tempering of durum uses the same equipment as wheat, but the holding times are shorterbecause of the desire for middlings without flour production. Excessive tempering times soften theendosperm resulting in undesired flour production. Short tempering times maintain the hard structure ofendosperm, which enhances the production of endosperm chunks.
The break system in a durum mill generally has at least five breaks and provides for the verygradual reduction of the stock necessary for good middlings production while still avoiding largeamounts of break flour.
The rolls in the reduction system are used for sizing only. None are used to produce flour. Theyfunction the same as the sizing rolls in a wheat flour mill reducing the coarse middling to a uniformparticle size. In a wheat flour mill, the sizing is done to produce a uniform product for further grindingon the reduction rolls. In a durum mill, however, sizing is done to make a uniform product for sale.
The sifting system of a durum mill differs from that in a wheat flour mill by the heavy relianceon purifiers. In place of plansifters, conventional sieves are much more common and are used to makerough separations ahead of the purifiers.
2.2.2.1.3 Rye milling. Rye and wheat flour milling are quite similar processes. In bothinstances, the purpose is to make flour that is substantially free of bran and germ. The basic type ofmachinery and same 5-step process is employed. The following paragraphs describe basic differencesbetween the rye and wheat flour milling processes.
The flow through the cleaning and tempering portions of a rye mill is essentially the same as theflow used in a wheat flour mill. However, because rye is more difficult to clean than wheat, this cleaningoperation must be more carefully controlled. Rye is graded for size as well as other properties, andbecause of the size differences, gravity tables may be used in the cleaning house to separate sizesaccording to weight differences. Pocket sizes in the disc machinery are also slightly different because theaverage rye kernel is thinner and slightly longer than the average wheat kernel.
After the rye mix has been cleaned, tempering water is added, and the rye is allowed to rest in thetemper bins the desired length of time prior to milling. In contrast to wheat milling, which is a process ofgradual reduction with purification and classification, rye milling does not employ gradual reduction. Both the break and reduction roller mills in a rye mill are corrugated. Following grinding, the screeningsystems employ plansifters like those used in a wheat flour mill. There is little evidence of purifier use inrye mills, although they are commonly used in wheat flour mills.
The wheat and rye flour milling processes are very similar because flour is the intended productof the break rolling system. In durum wheat flour milling, the intent is to produce as much middlings andas little flour as possible on the break rolls. As in wheat flour milling, the intent in rye milling is to makeas much rye flour and as little middlings as possible on the break rolls. Both the greater pressure on therolls and the corrugated surface contribute to greater flour production. As a consequence, there are morebreak rolls in proportion to reduction rolls in a rye mill than in a durum wheat flour mill.
2.2.2.2 Oat Milling.8,23 Oats are used predominantly for livestock feed, with a relatively smallpart used for human consumption in breakfast and hot cereals and baked products. The predominant useof the oats used for human consumption is for hot cereals, which accounts for about 10 percent of thetotal grain harvested each year. Oats are milled into two primary hot cereal products: regular oats and
2.0 Industry Description
2-19
quick oats. The longer oats are separated from shorter oats in the process and are used to produce regularoats. The shorter oats are further reduced in size in a cutting plant and are used to produce quick oats. Inaddition, processed oats have been used increasingly in cold breakfast cereals, and oat flours are used inbaby foods and bakery products.
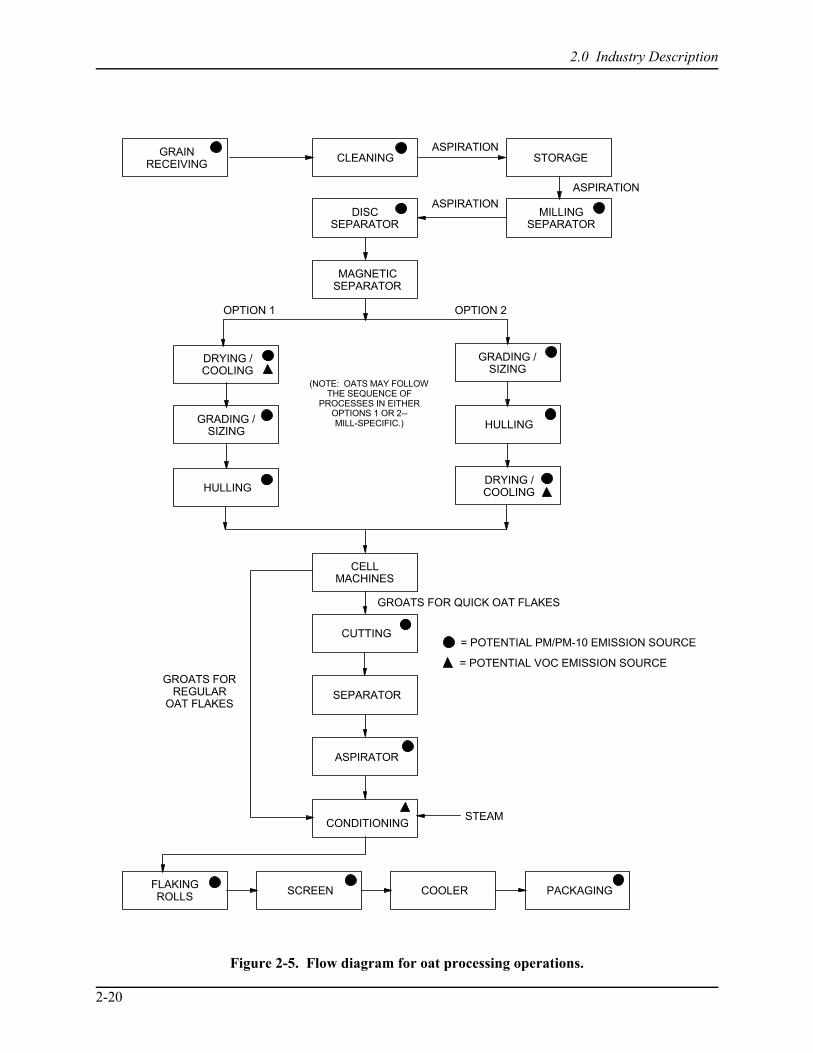
The milling process for oats consists of the following seven steps as illustrated in Figure 2-5.
1. Reception, preliminary cleaning, and storage.2. Cleaning.3. Drying and cooling.4. Grading and hulling.5. Cutting.6. Steaming.7. Flaking.
The receiving and storage operations are comparable to those described for grain elevators and for thewheat flour milling process. They are not discussed further. The remaining operations are describedbelow.
Initial cleaning removes coarse field trash and objects that could damage conveying equipmentand removes dust, loose chaff, and other light impurities before storage. A receiving separatorincorporating one of two methods is used for this initial cleaning step to remove the coarse and lightimpurities. The first method uses slightly inclined wire mesh or perforated sheet metal screens that aregiven a reciprocating or rotary motion. The perforation openings are selected to let the oats fall throughwhile the coarse impurities are overtailed. The second method uses horizontal, slowly rotating, coarsewire-mesh reels or cylinders. The oats are either fed into the inside of the reel, where the oats fallthrough while the coarse objects are overtailed, or the oats are fed onto the outside of the rotating reeland pass through while the coarse objects are carried over and evacuated from the machine. Mostreceiving separators, regardless of model type, incorporate an aspiration channel to remove lightimpurities from the oats before they leave the machine. Intake rates of the field oats arriving at the plantvary widely depending on the size and production output level of the plant; these can range from a low of35 m3/hr (1,000 bu/hr) at small mills to over 350 m3/hr (10,000 bu/hr) at large facilities. Afterpreliminary cleaning, the oats are stored until needed for processing.
After the oats are removed from storage, they are processed through a more rigorous oat cleaningsystem. The foreign materials removed during cleaning are corn, seeds, sticks, soybeans, barley, wheat,loose hulls, stones, and dust. The contaminants usually become mixed with the oats in the field andduring handling in various grain elevators. Oats that are not suitable for milling and that are removedinclude the following:
1. Double oats (bosom). The hull of the primary kernel envelops the second grain. Normally,groats in both kernels are poorly developed, resulting in a high percentage of hull.
2. Pin oats. These are usually very thin and short and very poor yielding, with little or no groatinside.
3. Light oats. Although generally equal in size to normal oats, light oats contain small groats incomparison to the hull; they are separated by aspiration.
4. Other types of oats. These consist of twins and discolored, green, and hulless kernels, whichmay or may not be removed in the cleaning plant depending on their size.8
2.0 Industry Description
2-20
DRYING /COOLING
HULLING
GRADING /SIZING
HULLING
DRYING /COOLING
FLAKING ROLLS SCREEN COOLER PACKAGING
GRAINRECEIVING STORAGECLEANING
MAGNETICSEPARATOR
DISC SEPARATOR
MILLINGSEPARATOR
ASPIRATION
CELL MACHINES
CUTTING
SEPARATOR
ASPIRATOR
CONDITIONING
ASPIRATION
ASPIRATION
GROATS FOR QUICK OAT FLAKES
STEAM
GROATS FORREGULAR
OAT FLAKES
GRADING /SIZING
= POTENTIAL PM/PM-10 EMISSION SOURCE
= POTENTIAL VOC EMISSION SOURCE
OPTION 1 OPTION 2
(NOTE: OATS MAY FOLLOWTHE SEQUENCE OF
PROCESSES IN EITHEROPTIONS 1 OR 2--MILL-SPECIFIC.)
Figure 2-5. Flow diagram for oat processing operations.
2.0 Industry Description
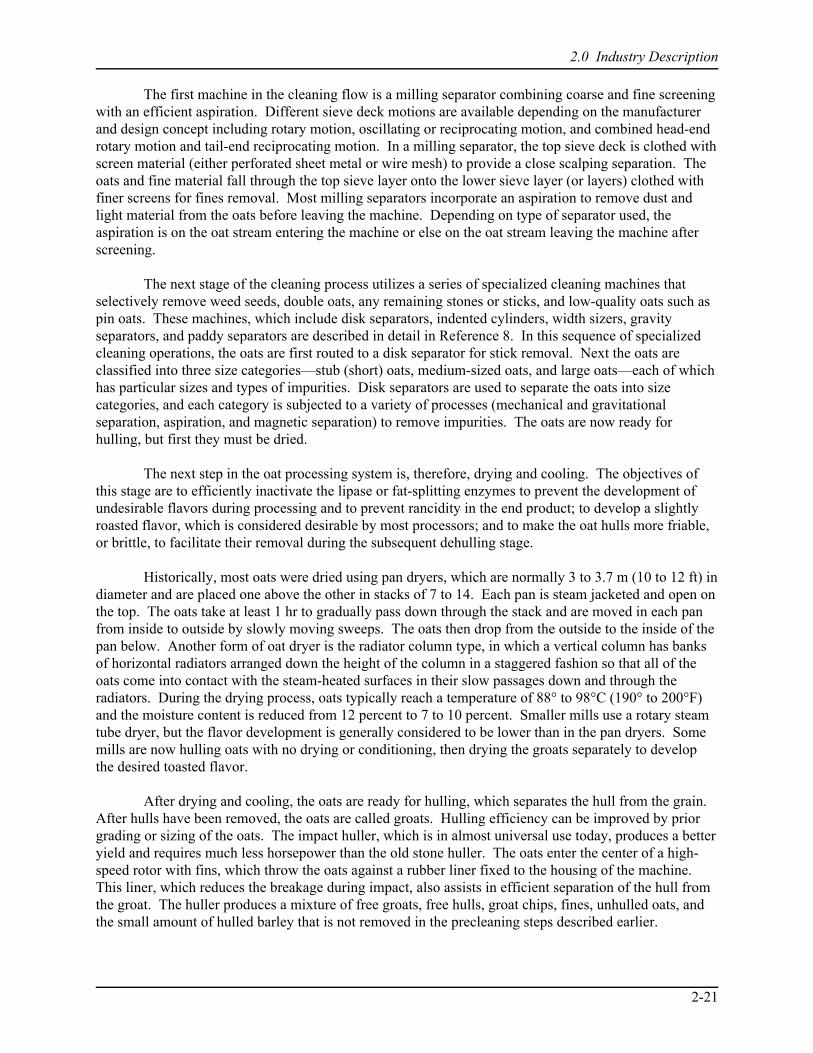
2-21
The first machine in the cleaning flow is a milling separator combining coarse and fine screeningwith an efficient aspiration. Different sieve deck motions are available depending on the manufacturerand design concept including rotary motion, oscillating or reciprocating motion, and combined head-endrotary motion and tail-end reciprocating motion. In a milling separator, the top sieve deck is clothed withscreen material (either perforated sheet metal or wire mesh) to provide a close scalping separation. Theoats and fine material fall through the top sieve layer onto the lower sieve layer (or layers) clothed withfiner screens for fines removal. Most milling separators incorporate an aspiration to remove dust andlight material from the oats before leaving the machine. Depending on type of separator used, theaspiration is on the oat stream entering the machine or else on the oat stream leaving the machine afterscreening.
The next stage of the cleaning process utilizes a series of specialized cleaning machines thatselectively remove weed seeds, double oats, any remaining stones or sticks, and low-quality oats such aspin oats. These machines, which include disk separators, indented cylinders, width sizers, gravityseparators, and paddy separators are described in detail in Reference 8. In this sequence of specializedcleaning operations, the oats are first routed to a disk separator for stick removal. Next the oats areclassified into three size categories—stub (short) oats, medium-sized oats, and large oats—each of whichhas particular sizes and types of impurities. Disk separators are used to separate the oats into sizecategories, and each category is subjected to a variety of processes (mechanical and gravitationalseparation, aspiration, and magnetic separation) to remove impurities. The oats are now ready forhulling, but first they must be dried.
The next step in the oat processing system is, therefore, drying and cooling. The objectives ofthis stage are to efficiently inactivate the lipase or fat-splitting enzymes to prevent the development ofundesirable flavors during processing and to prevent rancidity in the end product; to develop a slightlyroasted flavor, which is considered desirable by most processors; and to make the oat hulls more friable,or brittle, to facilitate their removal during the subsequent dehulling stage.
Historically, most oats were dried using pan dryers, which are normally 3 to 3.7 m (10 to 12 ft) indiameter and are placed one above the other in stacks of 7 to 14. Each pan is steam jacketed and open onthe top. The oats take at least 1 hr to gradually pass down through the stack and are moved in each panfrom inside to outside by slowly moving sweeps. The oats then drop from the outside to the inside of thepan below. Another form of oat dryer is the radiator column type, in which a vertical column has banksof horizontal radiators arranged down the height of the column in a staggered fashion so that all of theoats come into contact with the steam-heated surfaces in their slow passages down and through theradiators. During the drying process, oats typically reach a temperature of 88° to 98°C (190° to 200°F)and the moisture content is reduced from 12 percent to 7 to 10 percent. Smaller mills use a rotary steamtube dryer, but the flavor development is generally considered to be lower than in the pan dryers. Somemills are now hulling oats with no drying or conditioning, then drying the groats separately to developthe desired toasted flavor.
After drying and cooling, the oats are ready for hulling, which separates the hull from the grain. After hulls have been removed, the oats are called groats. Hulling efficiency can be improved by priorgrading or sizing of the oats. The impact huller, which is in almost universal use today, produces a betteryield and requires much less horsepower than the old stone huller. The oats enter the center of a high-speed rotor with fins, which throw the oats against a rubber liner fixed to the housing of the machine. This liner, which reduces the breakage during impact, also assists in efficient separation of the hull fromthe groat. The huller produces a mixture of free groats, free hulls, groat chips, fines, unhulled oats, andthe small amount of hulled barley that is not removed in the precleaning steps described earlier.
2.0 Industry Description
2-22
Again, large and short hulled oats are processed separately until the last stages of milling, whichincludes removal of the hulls and the final grading steps to extract unhulled kernels, wheat, and barley. The free hulls are “light” enough that aspirators remove them quite effectively. Small groats and chips,however, can be lost with the hulls so the air used in the aspirators must be carefully adjusted,particularly in the short oat system.
Grain sizing prior to hulling also assists the oat and groat separation after hulling. The groats aresufficiently shorter than oats so that a practical separation can be made by length using disc machines. However, this separation is made less effective by some oats whose groats are as long as the oat and bythe huller damaging the tips of many oats that are not hulled on the first pass. The oat stream separatedin this step for return hulling typically contains some groats.
Generally, the final step in the large oat system is the separation of groats totally free of wholeoats that have not had the hulls removed. These groats, used the regular oat flakes, are separated by cellmachines and will bypass the cutting operation. The cell machine consists of rectangular plates withindents similar to a disc machine moving up a 30-degree incline. The groats drop onto the moving platesnear the center of the machine. The clean groats are carried over the top and directed to storage prior toflaking. The rejects of the cell machine, which will contain a few unhulled oats, are sent to the cuttingplant for processing into quick cooking oat flakes (1 min). Cell machines for groat finishing aregradually being replaced by the more efficient gravity tables.
Those groats that are to be used in the cutting plant for quick cooking oat flakes are usually notprocessed to separate them completely free of whole oats and oat hulls. The cutting plant is designed toremove these contaminants. The purpose of cutting is to convert the groats into uniform pieces, two tofour per groat, with a minimum of fine granules or flour. Cutting is accomplished with rotarygranulators. These consist of rotating perforated drums, through which the groats align themselvesendwise and fall against stationary knives that are arranged around the bottom and outside surface of thedrum. The cutting fines (oat middlings) are then removed by a shaker equipped with a 22-mesh (800 :m)thin mill screen, though various meshes are used in different plants. The cutting flour is generally usedas a high quality animal feed. The cut groats are separated from the uncut groats, oats, and long hulls bya cylinder separator or disc machine. The pickups of the disc are aspirated by a closed circuit ormultilouver type machine that removes loose hulls or slivers that may be present in the cut groats.
The cut material is now ready for the flaking plant. Conditioning the groats for flaking isaccomplished by live steaming at atmospheric pressure just prior to flaking. The steaming softens thegroats and permits flaking with a minimum of breakage. Also, enzyme systems, which could causerancidity and undesirable flavors in oatmeal, are inactivated. The steamed groats pass directly into theflaking rolls from the steamer. The cut groats are rolled into relatively thick flakes for quick cookingoatmeal. The uncut groats are flaked about 50 percent thicker. The rolls are adjusted to produce flakesof uniform quality, which are determined by a thickness or density measurement. The shakers under therolls remove fines produced in the flaking process. Also, overcooked pieces, which are generallyagglomerates of several flakes, are scalped off. The flakes also generally pass through a multilouver orterminal velocity-type cooler. Hull slivers are removed with the cooling air. The moisture content andtemperature are quickly reduced to ensure acceptable shelf life.
The cooled flakes are then conveyed to the packaging system. Because quick flakes are easilybroken, the flaking system is often located above and near the packaging equipment. Conveyingequipment, which causes a minimum of abrasion, is used. Because of a wide density variation in theflakes, packaging must include weighing the contents of each container. The poor flowing characteristicsmake the package filling somewhat difficult. Generally a plunger is used to gently compress the flakesinto each package.
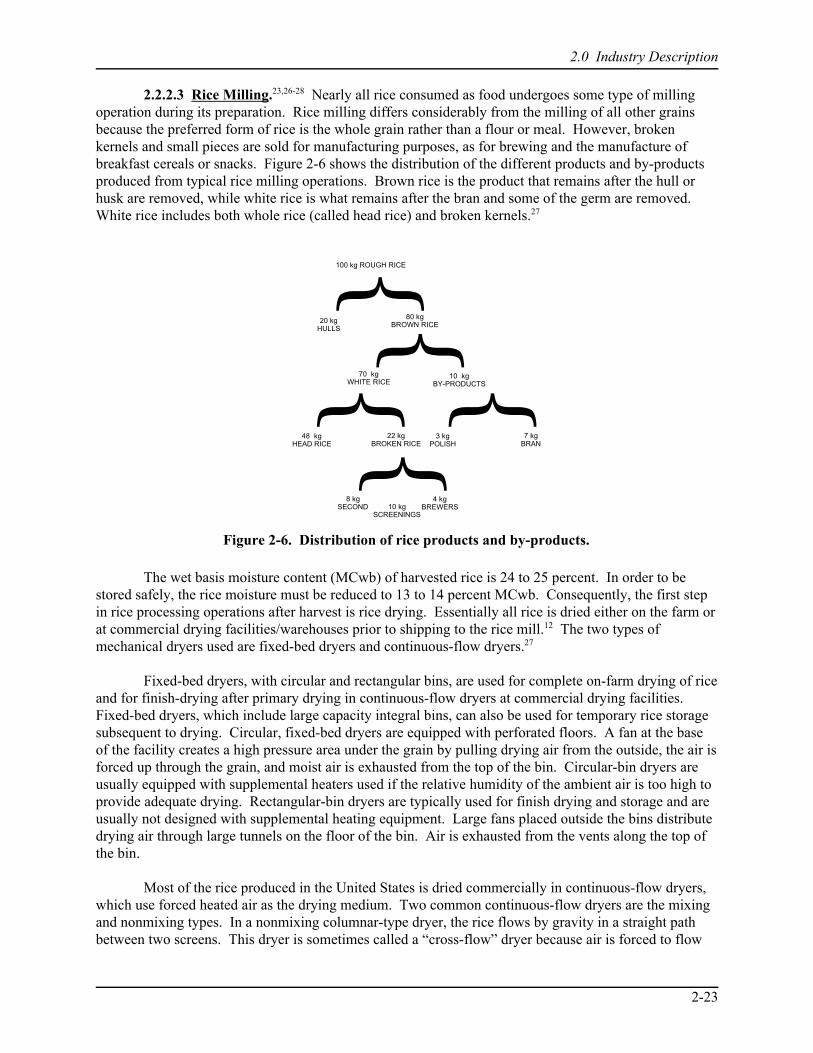
2.0 Industry Description
2-23
{
100 kg ROUGH RICE
80 kgBROWN RICE
20 kgHULLS
70 kgWHITE RICE
10 kgBY-PRODUCTS
48 kgHEAD RICE
22 kgBROKEN RICE
3 kgPOLISH
7 kgBRAN
8 kgSECOND 10 kg
SCREENINGS
4 kgBREWERS
{ { {{
Figure 2-6. Distribution of rice products and by-products.
2.2.2.3 Rice Milling.23,26-28 Nearly all rice consumed as food undergoes some type of millingoperation during its preparation. Rice milling differs considerably from the milling of all other grainsbecause the preferred form of rice is the whole grain rather than a flour or meal. However, brokenkernels and small pieces are sold for manufacturing purposes, as for brewing and the manufacture ofbreakfast cereals or snacks. Figure 2-6 shows the distribution of the different products and by-productsproduced from typical rice milling operations. Brown rice is the product that remains after the hull orhusk are removed, while white rice is what remains after the bran and some of the germ are removed. White rice includes both whole rice (called head rice) and broken kernels.27
The wet basis moisture content (MCwb) of harvested rice is 24 to 25 percent. In order to bestored safely, the rice moisture must be reduced to 13 to 14 percent MCwb. Consequently, the first stepin rice processing operations after harvest is rice drying. Essentially all rice is dried either on the farm orat commercial drying facilities/warehouses prior to shipping to the rice mill.12 The two types ofmechanical dryers used are fixed-bed dryers and continuous-flow dryers.27
Fixed-bed dryers, with circular and rectangular bins, are used for complete on-farm drying of riceand for finish-drying after primary drying in continuous-flow dryers at commercial drying facilities. Fixed-bed dryers, which include large capacity integral bins, can also be used for temporary rice storagesubsequent to drying. Circular, fixed-bed dryers are equipped with perforated floors. A fan at the baseof the facility creates a high pressure area under the grain by pulling drying air from the outside, the air isforced up through the grain, and moist air is exhausted from the top of the bin. Circular-bin dryers areusually equipped with supplemental heaters used if the relative humidity of the ambient air is too high toprovide adequate drying. Rectangular-bin dryers are typically used for finish drying and storage and areusually not designed with supplemental heating equipment. Large fans placed outside the bins distributedrying air through large tunnels on the floor of the bin. Air is exhausted from the vents along the top ofthe bin.
Most of the rice produced in the United States is dried commercially in continuous-flow dryers,which use forced heated air as the drying medium. Two common continuous-flow dryers are the mixingand nonmixing types. In a nonmixing columnar-type dryer, the rice flows by gravity in a straight pathbetween two screens. This dryer is sometimes called a “cross-flow” dryer because air is forced to flow
2.0 Industry Description
2-24
across a moving bed of rice. The nonmixing column-type dryer is probably the most commoncommercial rice dryer in use today.
One type of mixing-type columnar dryer can use baffles to promote mixing. In another type, riceflows downward over inverted V-shaped air channels. Air flows in and out alternate rows of channels,and mixing is accomplished because the inlet and outlet air ducts are offset from one another. In terms ofgrain quality, the mixing-type dryers promote more uniform drying of rice.
Continuous-flow rice dryers are usually operated on a multipass basis. The moisture content ofrice may be reduced 2 to 4 percent (dry basis) each time it passes through the dryer. Between passes, riceis held for a short period to allow the kernel moisture gradients developed during drying time to bereduced. This holding period, which may be as long as 24 hr, is referred to as tempering. In multipassdrying, the number of dryer passes and the quantity of moisture to be removed during each pass is usuallydetermined by the individual dryer operator. Many factors, such as dryer capacity, quantity of rice to bedried, and moisture to be removed, are considered in making this decision.
After the rice is dried, it is stored and subsequently shipped to rice mills for further processing. Both conventional and parboil rice mills are used in the United States, with the former accounting forabout 85 percent of the national rice crop. (Parboiled rice is obtained by partially boiling the rice usingpressurized steam before it is milled.) There are three distinct stages in each of these mills: (1) roughrice receiving, cleaning, drying, and storage; (2) milling; and (3) milled rice and byproduct bagging,packaging and shipping. Figure 2-7 shows the process flow for conventional and parboil rice mills.
Grain is received primarily by truck and rail at rice mills. Rough rice is delivered to the millcontaining various kinds of foreign material, such as straw, loose hulls, bran, weed seeds, pebbles, andgranules of dirt. Before cleaning, this rough rice is weighed in an automatic hopper scale to determinethe weight of the uncleaned grain. The rough rice is then cleaned using combinations of scalpers,screens, and aspiration.
The precleaner system has aspiration for light impurities, an oscillating double sieve for heavyimpurities, and a magnet to trap any iron particles. Light small impurities, mainly dust, are blown insidea cyclone for separation and discharge. All other impurities are discharged into sacks or containers. Because this type of precleaning machine cannot generally separate the small stones of about the samesize as the rice grains, the rice grain passes a stoner or gravity separator that separates the stones from thegrain by using the differences in density of stones and rough rice. The grain then passes a secondautomatic hopper scale that weighs clean rough rice that will actually be processed in the rice mill todetermine the degree of purity of the rough rice.
The milling of rough rice to produce white rice is the major milling operation conducted at U.S.rice mills. Cleaned rice is first transported to a disk huller where the rice is dehulled. Stone and rubbershellers are used for this operation. The hulls that are produced are relatively light and are readilyremoved from the shelled grains when the mixture is aspirated. Before the material is aspirated, it firstpasses through a double sieve which separates the coarse bran and small brokens (brown rice) that havebeen generated in the disk huller. The hulls are collected by passing the aspiration air through a productrecovery device, usually a cyclone.
The product stream in the shelling process contains a mixture of unshelled rice grains and brownrice, which must be separated. This operation is performed in a device known as a paddy separator,which consists of flat cars divided into three tiers of irregular compartments. The cars are tilted in such away that when they are rapidly shuttled, the lighter, bulkier, rough rice (commonly called paddy) isconcentrated at the raised side, while the heavier brown rice migrates to the lower opposite side. The

2.0 Industry Description
2-25
TRUMBEL
TRIEURS(CLASSIFIERS)
WEIGHSTORAGE PACKING /SHIPPING
TALC GLUCOSE
POLISHED UNCOATED RICE
PADDYSEPARATOR
DISK HULLER SIEVE ASPIRATION
SIEVE WHITENINGCONES
POLISHINGCONE SIEVE
WEIGHING
MILL HOUSE
= POTENTIAL PM/PM-10 EMISSION SOURCE
= POTENTIAL VOC EMISSION SOURCE
GRAIN RECEIVING
MAGNETICSEPARATOR
ASPIRATION SIEVE
WEIGHING STONER
CLEANING HOUSE
SOAKING
DRYING STEAMING
PARBOILING
TRUCK RAIL
RICE DRYER
OPTIONAL
Figure 2-7. Flow diagram for conventional and parboil rice mills.
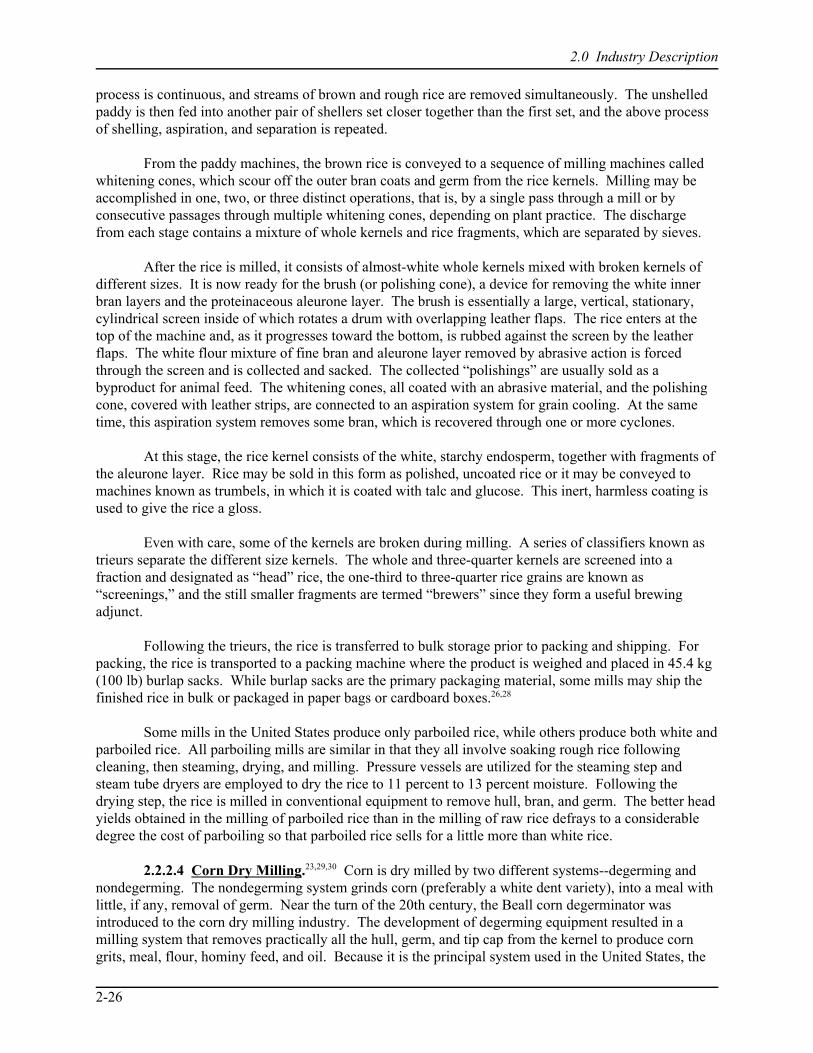
2.0 Industry Description
2-26
process is continuous, and streams of brown and rough rice are removed simultaneously. The unshelledpaddy is then fed into another pair of shellers set closer together than the first set, and the above processof shelling, aspiration, and separation is repeated.
From the paddy machines, the brown rice is conveyed to a sequence of milling machines calledwhitening cones, which scour off the outer bran coats and germ from the rice kernels. Milling may beaccomplished in one, two, or three distinct operations, that is, by a single pass through a mill or byconsecutive passages through multiple whitening cones, depending on plant practice. The dischargefrom each stage contains a mixture of whole kernels and rice fragments, which are separated by sieves.
After the rice is milled, it consists of almost-white whole kernels mixed with broken kernels ofdifferent sizes. It is now ready for the brush (or polishing cone), a device for removing the white innerbran layers and the proteinaceous aleurone layer. The brush is essentially a large, vertical, stationary,cylindrical screen inside of which rotates a drum with overlapping leather flaps. The rice enters at thetop of the machine and, as it progresses toward the bottom, is rubbed against the screen by the leatherflaps. The white flour mixture of fine bran and aleurone layer removed by abrasive action is forcedthrough the screen and is collected and sacked. The collected “polishings” are usually sold as abyproduct for animal feed. The whitening cones, all coated with an abrasive material, and the polishingcone, covered with leather strips, are connected to an aspiration system for grain cooling. At the sametime, this aspiration system removes some bran, which is recovered through one or more cyclones.
At this stage, the rice kernel consists of the white, starchy endosperm, together with fragments ofthe aleurone layer. Rice may be sold in this form as polished, uncoated rice or it may be conveyed tomachines known as trumbels, in which it is coated with talc and glucose. This inert, harmless coating isused to give the rice a gloss.
Even with care, some of the kernels are broken during milling. A series of classifiers known astrieurs separate the different size kernels. The whole and three-quarter kernels are screened into afraction and designated as “head” rice, the one-third to three-quarter rice grains are known as“screenings,” and the still smaller fragments are termed “brewers” since they form a useful brewingadjunct.
Following the trieurs, the rice is transferred to bulk storage prior to packing and shipping. Forpacking, the rice is transported to a packing machine where the product is weighed and placed in 45.4 kg(100 lb) burlap sacks. While burlap sacks are the primary packaging material, some mills may ship thefinished rice in bulk or packaged in paper bags or cardboard boxes.26,28
Some mills in the United States produce only parboiled rice, while others produce both white andparboiled rice. All parboiling mills are similar in that they all involve soaking rough rice followingcleaning, then steaming, drying, and milling. Pressure vessels are utilized for the steaming step andsteam tube dryers are employed to dry the rice to 11 percent to 13 percent moisture. Following thedrying step, the rice is milled in conventional equipment to remove hull, bran, and germ. The better headyields obtained in the milling of parboiled rice than in the milling of raw rice defrays to a considerabledegree the cost of parboiling so that parboiled rice sells for a little more than white rice.
2.2.2.4 Corn Dry Milling.23,29,30 Corn is dry milled by two different systems--degerming andnondegerming. The nondegerming system grinds corn (preferably a white dent variety), into a meal withlittle, if any, removal of germ. Near the turn of the 20th century, the Beall corn degerminator wasintroduced to the corn dry milling industry. The development of degerming equipment resulted in amilling system that removes practically all the hull, germ, and tip cap from the kernel to produce corngrits, meal, flour, hominy feed, and oil. Because it is the principal system used in the United States, the
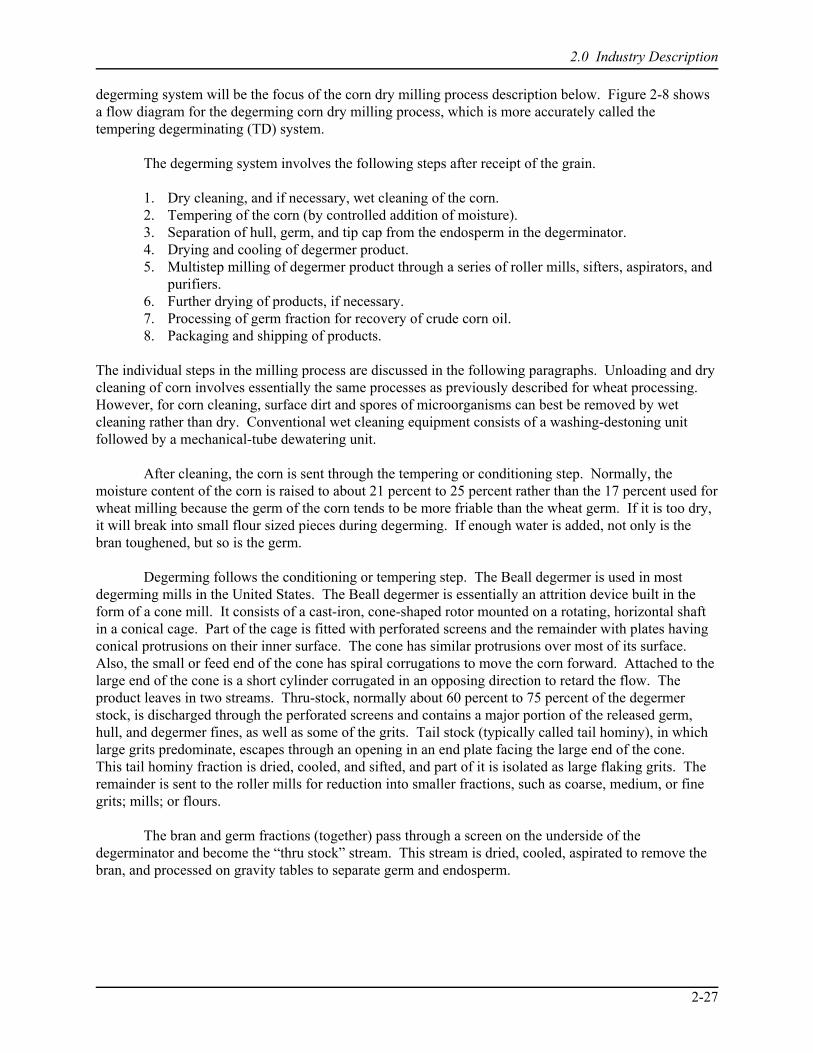
2.0 Industry Description
2-27
degerming system will be the focus of the corn dry milling process description below. Figure 2-8 showsa flow diagram for the degerming corn dry milling process, which is more accurately called thetempering degerminating (TD) system.
The degerming system involves the following steps after receipt of the grain.
1. Dry cleaning, and if necessary, wet cleaning of the corn.2. Tempering of the corn (by controlled addition of moisture).3. Separation of hull, germ, and tip cap from the endosperm in the degerminator.4. Drying and cooling of degermer product.5. Multistep milling of degermer product through a series of roller mills, sifters, aspirators, and
purifiers.6. Further drying of products, if necessary.7. Processing of germ fraction for recovery of crude corn oil.8. Packaging and shipping of products.
The individual steps in the milling process are discussed in the following paragraphs. Unloading and drycleaning of corn involves essentially the same processes as previously described for wheat processing. However, for corn cleaning, surface dirt and spores of microorganisms can best be removed by wetcleaning rather than dry. Conventional wet cleaning equipment consists of a washing-destoning unitfollowed by a mechanical-tube dewatering unit.
After cleaning, the corn is sent through the tempering or conditioning step. Normally, themoisture content of the corn is raised to about 21 percent to 25 percent rather than the 17 percent used forwheat milling because the germ of the corn tends to be more friable than the wheat germ. If it is too dry,it will break into small flour sized pieces during degerming. If enough water is added, not only is thebran toughened, but so is the germ.
Degerming follows the conditioning or tempering step. The Beall degermer is used in mostdegerming mills in the United States. The Beall degermer is essentially an attrition device built in theform of a cone mill. It consists of a cast-iron, cone-shaped rotor mounted on a rotating, horizontal shaftin a conical cage. Part of the cage is fitted with perforated screens and the remainder with plates havingconical protrusions on their inner surface. The cone has similar protrusions over most of its surface. Also, the small or feed end of the cone has spiral corrugations to move the corn forward. Attached to thelarge end of the cone is a short cylinder corrugated in an opposing direction to retard the flow. Theproduct leaves in two streams. Thru-stock, normally about 60 percent to 75 percent of the degermerstock, is discharged through the perforated screens and contains a major portion of the released germ,hull, and degermer fines, as well as some of the grits. Tail stock (typically called tail hominy), in whichlarge grits predominate, escapes through an opening in an end plate facing the large end of the cone. This tail hominy fraction is dried, cooled, and sifted, and part of it is isolated as large flaking grits. Theremainder is sent to the roller mills for reduction into smaller fractions, such as coarse, medium, or finegrits; mills; or flours.
The bran and germ fractions (together) pass through a screen on the underside of thedegerminator and become the “thru stock” stream. This stream is dried, cooled, aspirated to remove thebran, and processed on gravity tables to separate germ and endosperm.
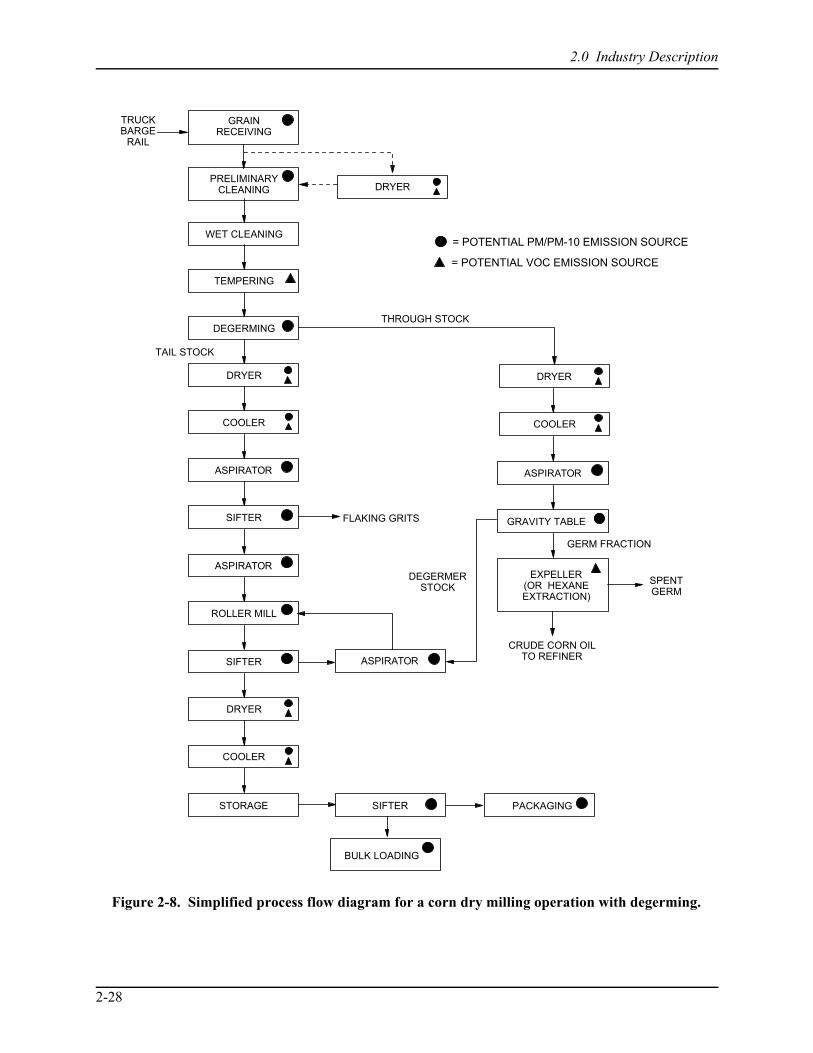
2.0 Industry Description
2-28
GRAINRECEIVING
PRELIMINARYCLEANING
WET CLEANING
TEMPERING
DEGERMING
COOLER
ASPIRATOR
SIFTER
ASPIRATOR
ROLLER MILL
SIFTER
DRYER
COOLER
STORAGE SIFTER
BULK LOADING
ASPIRATOR
PACKAGING
TRUCKBARGE
RAIL
ASPIRATOR
GRAVITY TABLE
THROUGH STOCK
FLAKING GRITS
TAIL STOCK
GERM FRACTION
EXPELLER(OR HEXANEEXTRACTION)
SPENTGERM
CRUDE CORN OILTO REFINER
DEGERMERSTOCK
= POTENTIAL PM/PM-10 EMISSION SOURCE
= POTENTIAL VOC EMISSION SOURCE
DRYER
COOLER
DRYER
DRYER
Figure 2-8. Simplified process flow diagram for a corn dry milling operation with degerming.
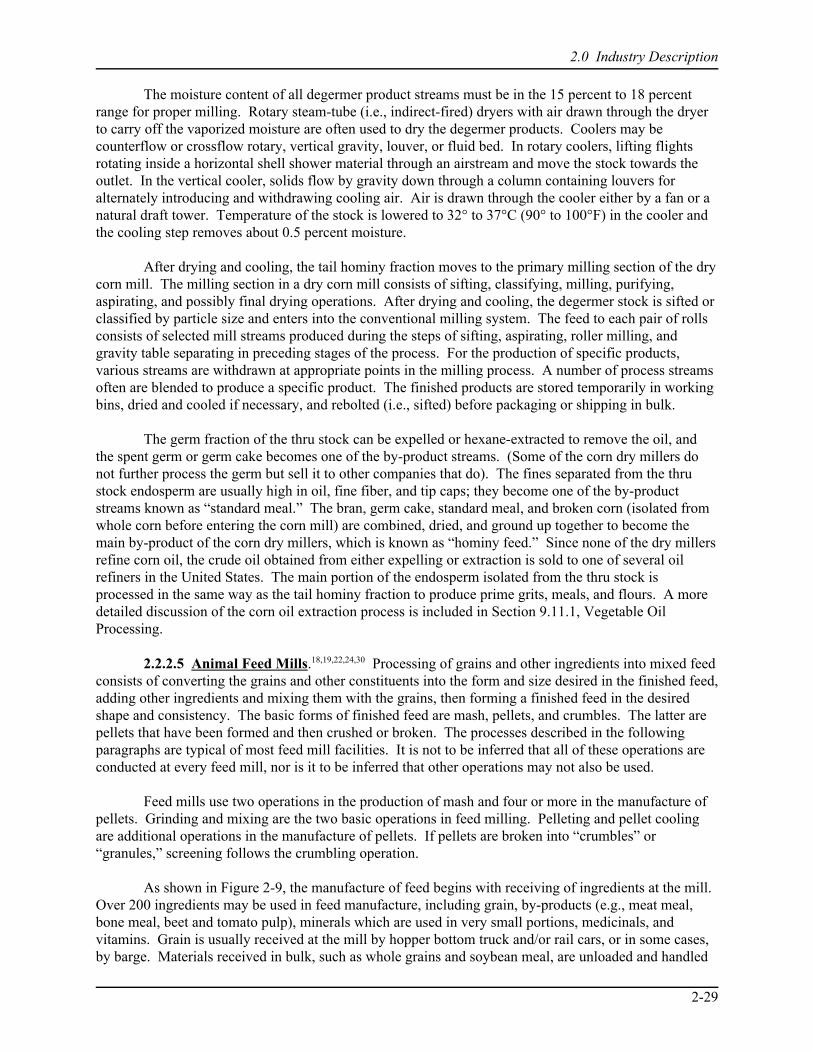
2.0 Industry Description
2-29
The moisture content of all degermer product streams must be in the 15 percent to 18 percentrange for proper milling. Rotary steam-tube (i.e., indirect-fired) dryers with air drawn through the dryerto carry off the vaporized moisture are often used to dry the degermer products. Coolers may becounterflow or crossflow rotary, vertical gravity, louver, or fluid bed. In rotary coolers, lifting flightsrotating inside a horizontal shell shower material through an airstream and move the stock towards theoutlet. In the vertical cooler, solids flow by gravity down through a column containing louvers foralternately introducing and withdrawing cooling air. Air is drawn through the cooler either by a fan or anatural draft tower. Temperature of the stock is lowered to 32° to 37°C (90° to 100°F) in the cooler andthe cooling step removes about 0.5 percent moisture.
After drying and cooling, the tail hominy fraction moves to the primary milling section of the drycorn mill. The milling section in a dry corn mill consists of sifting, classifying, milling, purifying,aspirating, and possibly final drying operations. After drying and cooling, the degermer stock is sifted orclassified by particle size and enters into the conventional milling system. The feed to each pair of rollsconsists of selected mill streams produced during the steps of sifting, aspirating, roller milling, andgravity table separating in preceding stages of the process. For the production of specific products,various streams are withdrawn at appropriate points in the milling process. A number of process streamsoften are blended to produce a specific product. The finished products are stored temporarily in workingbins, dried and cooled if necessary, and rebolted (i.e., sifted) before packaging or shipping in bulk.
The germ fraction of the thru stock can be expelled or hexane-extracted to remove the oil, andthe spent germ or germ cake becomes one of the by-product streams. (Some of the corn dry millers donot further process the germ but sell it to other companies that do). The fines separated from the thrustock endosperm are usually high in oil, fine fiber, and tip caps; they become one of the by-productstreams known as “standard meal.” The bran, germ cake, standard meal, and broken corn (isolated fromwhole corn before entering the corn mill) are combined, dried, and ground up together to become themain by-product of the corn dry millers, which is known as “hominy feed.” Since none of the dry millersrefine corn oil, the crude oil obtained from either expelling or extraction is sold to one of several oilrefiners in the United States. The main portion of the endosperm isolated from the thru stock isprocessed in the same way as the tail hominy fraction to produce prime grits, meals, and flours. A moredetailed discussion of the corn oil extraction process is included in Section 9.11.1, Vegetable OilProcessing.
2.2.2.5 Animal Feed Mills.18,19,22,24,30 Processing of grains and other ingredients into mixed feedconsists of converting the grains and other constituents into the form and size desired in the finished feed,adding other ingredients and mixing them with the grains, then forming a finished feed in the desiredshape and consistency. The basic forms of finished feed are mash, pellets, and crumbles. The latter arepellets that have been formed and then crushed or broken. The processes described in the followingparagraphs are typical of most feed mill facilities. It is not to be inferred that all of these operations areconducted at every feed mill, nor is it to be inferred that other operations may not also be used.
Feed mills use two operations in the production of mash and four or more in the manufacture ofpellets. Grinding and mixing are the two basic operations in feed milling. Pelleting and pellet coolingare additional operations in the manufacture of pellets. If pellets are broken into “crumbles” or“granules,” screening follows the crumbling operation.
As shown in Figure 2-9, the manufacture of feed begins with receiving of ingredients at the mill. Over 200 ingredients may be used in feed manufacture, including grain, by-products (e.g., meat meal,bone meal, beet and tomato pulp), minerals which are used in very small portions, medicinals, andvitamins. Grain is usually received at the mill by hopper bottom truck and/or rail cars, or in some cases,by barge. Materials received in bulk, such as whole grains and soybean meal, are unloaded and handled
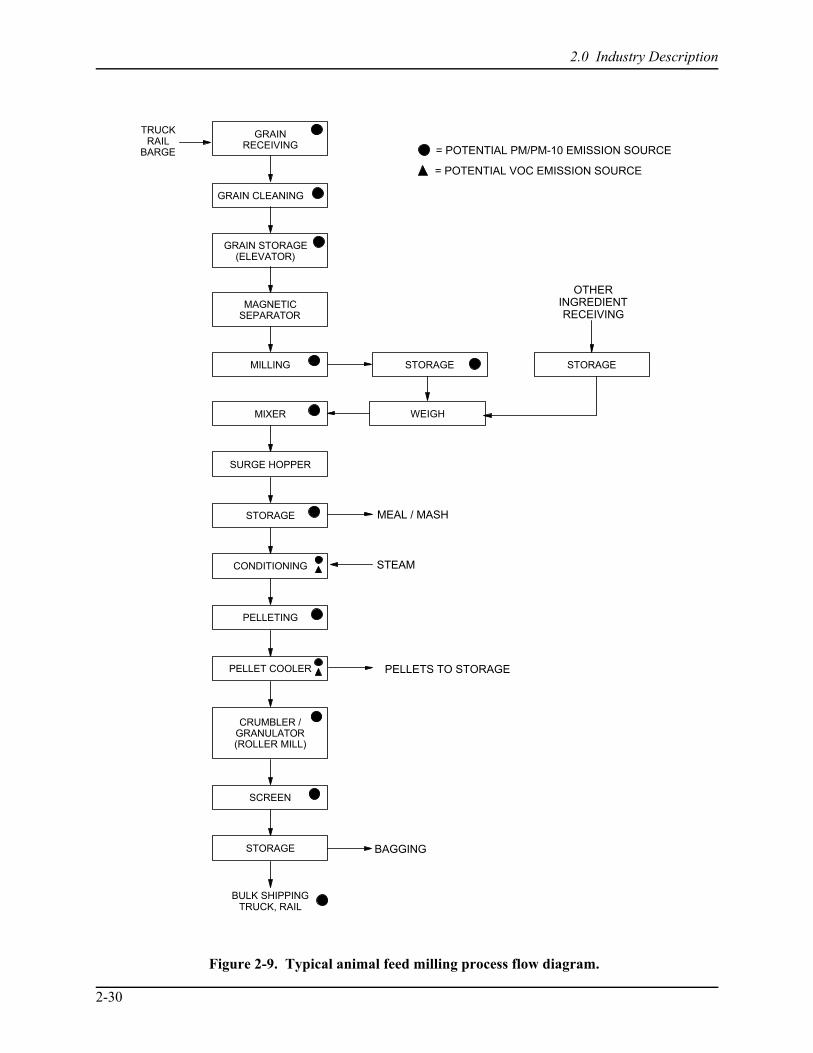
2.0 Industry Description
2-30
TRUCKRAIL
BARGE
GRAINRECEIVING
GRAIN STORAGE(ELEVATOR)
GRAIN CLEANING
MILLING
MIXER
SURGE HOPPER
STORAGE
CONDITIONING
PELLETING
PELLET COOLER
SCREEN
STORAGE
MAGNETIC SEPARATOR
CRUMBLER / GRANULATOR(ROLLER MILL)
BULK SHIPPINGTRUCK, RAIL
STORAGE
WEIGH
STORAGE
OTHERINGREDIENTRECEIVING
MEAL / MASH
STEAM
PELLETS TO STORAGE
BAGGING
= POTENTIAL PM/PM-10 EMISSION SOURCE
= POTENTIAL VOC EMISSION SOURCE
Figure 2-9. Typical animal feed milling process flow diagram.
2.0 Industry Description
2-31
in much the same way as grain elevators, but on a smaller scale. Because the grain receiving pits andlegs at feed mills have smaller capacities than those at grain elevators, it is likely that receiving pits atfeed mills achieve choke flow during unloading quicker, and more often, than at grain elevators. For thisreason, the dust emission rate for grain receiving operations at a feed mill will likely be lower than thoseat grain elevators.
The actual movement of ingredients within the mill usually is done by gravity. First, however,the grain must be lifted via bucket elevators above the highest processing machine before the gravityprocess can begin. For horizontal movement or slight elevation, a screw-type conveyor (made of mild orstainless steel), a drag conveyor (in which single or double chains haul grain along a stainless steelchute), a continuous belt (with a V-trough in its center), or an air system (in which grain is carried alongin a jet-like stream of compressed air) may be used. In modern feed mills, this transport equipment isconnected with closed spouting and turnheads, covered drag and screw conveyors, and tightly sealedtransitions between adjoining equipment to reduce internal dust loss and consequent housekeeping costs. Also many older facilities have upgraded to these closed systems.
Most mills direct feed ingredients, especially grains, through cleaning equipment prior to storage. Cleaning equipment includes scalpers to remove coarse materials from the feed ingredients before theyreach the mixer. Separators, which perform a similar function, often consist of reciprocating sieves thatseparate grains of different sizes and textures. Some mills employ these units to rough grade grain as toquality and weight.
Magnets are installed ahead of the grinders and at other critical locations in the mill system toremove tramp iron, bits of wire, and other foreign metallic matter, which could harm machinery andcontaminate the finished feed. Both permanent and electric magnets are used. Chute and rotary magnetsare also commonly used. From the cleaning operation, the ingredients are directed to storage. Bulkingredients are stored in concrete silos, steel tanks, or wooden bins. Wooden bins are generally foundonly in older feed mills.
After grain is removed from storage, it is transferred to the grinding area where whole grains,primarily corn, are ground prior to mixing with other feed components. The hammermill is the mostwidely used grinding device. The grinding chamber consists of rows of loosely mounted “swing”hammers or plates of hardened metal. These hammers pulverize the grain by striking it as they swing. The pulverized material is forced out of the mill chamber when it is ground finely enough to pass throughthe perforations in the mill screen. Several sizes of screen openings are used, depending on the finenessof the desired end product.
Mixing is the most important process in feed milling and is normally a batch process. Ingredients are weighed before mixing. Micro-ingredients, such as trace minerals and drugs, are weighedon bench or floor scales. Whole or ground grain and other materials added in comparatively largeamounts, such as wheat middlings and soybean meal, are weighed in a hopper scale with capacitycorresponding to the capacity of the mixer (0.91 to 2.7 Mg or 1 to 3 tons). In large mills (180 Mg/day[200 tons/day] and larger), ingredients are moved by conveyor from bins to the scale. In smaller mills(27 Mg/day [30 tons/day]), a “weigh buggy,” which is a hopper and scales on wheels, is generally used. A weigh buggy has a capacity of about 450 kg (1,000 lb) and is wheeled under the bins from whichingredients are to be drawn for a given mix. After the ingredients are weighed in the buggy, it is wheeledto the mixer where it is unloaded. Liquids, such as vitamin feeding oils, fish solubles, molasses, and fat,are included in the ingredients fed to the mixer. Mixers may be either a vertical or horizontal type. Vertical mixers utilize a screw to raise the ingredients from the bottom to the top of a mixing tankthrough an axial pipe from which the ingredients flow out, into, and back to the bottom of the tank. Horizontal mixers move the ingredients in a horizontal direction with right- and left-hand, narrow helical
2.0 Industry Description
2-32
ribbons or paddles attached to a shaft. The paddle-type mixer is more suitable when the molasses contentof the formula is high (30 percent to 40 percent) or for continuous instead of batch mixing. Horizontalmixers have a higher mixing rate than vertical mixers and are used in large feed mills. Horizontal mixersare provided with a surge hopper underneath the mixing chamber so that the mixing process is notinterrupted by conveying the mixed feed to storage. A mixer and its scale are sized to providesimultaneous weighing of the ingredients in the scale hopper, mixing the ingredients in the mixingchamber, and conveying the mixed feed from the surge hopper to storage. The material produced as anend product from the mixer is meal, or mash, and may be marketed in this form. If pellets are to bemade, the meal is conditioned with steam prior to being made into pellets.
Pelleting is a process in which conditioned meal is forced through dies. Pellets are usually 3.2 to19 mm (1/8 to 3/4 in.) in diameter and of similar length. After pelleting, pellets are cooled and dried inpellet coolers through which ambient air is drawn. Pellet cooler exhaust is usually passed throughcyclone dust collectors. Pellet coolers are of either horizontal or vertical types. Vertical coolers are lessexpensive with regard to both purchase and maintenance cost. Horizontal coolers may be used wherespace is not available for vertical coolers, and are more satisfactory for feeds with high molasses content. Feeds with high molasses content are often dusted with bentonite or cottonseed meal to prevent caking.
If pellets are to be reduced in size, which is necessary for such use as baby-chick feed, they arepassed through a crumbler, or granulator. This machine is a roller mill with corrugated rolls. Crumblingis a more economical method of producing small pellets than using dies with the requisite-size holesbecause the use of small dies seriously restricts production. The roller mill is usually located directlybelow the cooler and is provided with a bypass for use when pellets are sent to storage withoutcrumbling. Crumbles must be screened to remove fines and oversized materials, which are recycled tothe pellet process.
The product is sent to storage bins via closed elevator legs and gravity feed. Finished feed isbagged by automatic bagging machines, which are equipped with scales, or is shipped in bulk in trucksand railroad cars.
2.2.2.6 Malted Barley Production.37-39 Barley is shipped by railcar or truck to maltingfacilities. A screw conveyor or bucket elevator typically transports barley to storage silos or to thecleaning and sizing operations. The barley is cleaned and separated by size (using screens) and is thentransferred to a malthouse where it is rinsed in steeping tanks (steeped) and is allowed to germinate. Following steeping and germination, “green” malt is dried, typically in an indirect-, natural gas-fired maltkiln. Malt kilns typically include multiple levels, called beds or layers. For a two-level kiln, green malt,with a moisture content of about 45 percent, enters the upper deck of the kiln and is dried, over a 24-hourperiod, to between 15 and 20 percent. The barley is then transferred to the lower deck of the kiln, whereit is dried to about 4 percent over a second 24-hour period. Some facilities burn sulfur in a sulfur stoveand exhaust the stove into the kiln at selected times during the kiln cycle. The sulfur dioxide serves as afungicide, bactericide, and preservative. Malted barley is then transferred by screw conveyor to a storageelevator until it is shipped.
2.3 Emissions
The main pollutant of concern in grain storage, handling, and processing facilities is particulatematter (PM). Organic emissions (e.g., hexane) from certain operations at corn oil extraction facilitiesmay also be significant. These organic emissions (and related emissions from soybean and other oilseedprocessing) are discussed in AP-42 Section 9.11.1. Also, direct fired grain drying operations and productdryers in grain processing plants may emit small quantities of VOC’s and other combustion products. The following sections focus primarily on PM sources at grain elevators and grain milling/processing
2.0 Industry Description
2-33
facilities. However, potential sources of VOC are also identified even though no data are currentlyavailable to quantify the emission of these pollutants.
2.3.1 Grain Elevators12,23,24,32,33
Except for barge and ship unloading and loading activities, the same basic operations take placeat country elevators as at terminal elevators, only on a smaller scale and with a slower rate of grainmovement. Because PM emissions at both types of elevators are similar, they will be discussed togetherin this subsection.
In trying to characterize emissions and evaluate control alternatives, potential PM emissionsources can be classified into three groups. The first group includes external emission sources (grainreceiving and grain shipping), which are characterized by direct release of PM from the operations to theatmosphere. These operations are typically conducted outside elevator enclosures or within partialenclosures, and emissions are quickly dispersed by wind currents around the elevator. The second groupof sources are process emission sources that may or may not be vented to the atmosphere and includegrain cleaning and headhouse and internal handling operations (e.g., garner and scale bins, elevator legs,and transfer points such as the distributor and gallery and tunnel belts). These operations are typicallylocated inside the elevator structure. Dust may be released directly from these operations to the internalelevator environment, or aspiration systems may be used to collect dust generated from these operationsto improve internal housekeeping. If aspiration systems are used, dust is typically collected in a cycloneor fabric filter before the air stream is discharged to the atmosphere. Dust emitted to the internalenvironment may settle on internal elevator surfaces, but some of the finer particles may be emitted to theenvironment through doors and windows. For operations not equipped with aspiration systems, thequantity of PM emitted to the atmosphere depends on the tightness of the enclosures around the operationand internal elevator housekeeping practices. The third group of sources includes those processes thatemit PM to the atmosphere in a well-defined exhaust stream (grain drying and storage bin vents). Eachof these operations is discussed in the paragraphs below.
The amount of dust emitted during the various grain-handling operations may depend upon thetype of grain being handled, the quality or grade of the grain, the moisture content of the grain, the speedof the belt conveyors used to transport the grain, and the extent and efficiency of dust containmentsystems (i.e., hoods, sheds, etc.) in use at an elevator. Part of the dust liberated during the handling ofgrain at elevators gets into the grain during the harvesting operation.31 However, most of these factorshave not been studied in sufficient detail to permit the delineation of their relative importance to dustgeneration rates.
Grain dust emitted from grain elevator handling operations comprises about 70 percent organicmaterial. The dust may include particles of grain kernels, small amounts of spores of smuts and molds,insect debris, pollens, and field dust. Data recently collected on worker exposure to grain dust indicatethat the characteristics of the dust released from processing operations to the internal elevatorenvironment vary widely.33 Because these dusts have a high organic content and a substantialsuspendible fraction, concentrations above the minimum explosive concentration (MEC) pose anexplosion hazard. Housekeeping practices instituted by the industry have reduced explosing hazards sothis situation is rarely encountered in work areas.
Recent research on dust emissions from grain handling operations indicate that the fraction ofdust particles equal to or less than 10 micrometers (:m) in aerodynamic diameter (PM-10) averagesapproximately 25 percent of total PM, and the fraction of dust particles less than 2.5 :m in aerodynamicdiameter (PM-2.5) averages about 17 percent of PM-10.
2.0 Industry Description
2-34
Elevators in the United States receive grain by truck, railroad hopper car, and barge. The twoprincipal factors that contribute to dust generation during bulk unloading are wind currents and dustgenerated when a falling stream of grain strikes the receiving pit. Falling or moving streams of graininitiate a column of air moving in the same direction. Grain unloading is an intermittent source of dustoccurring only when a truck or car is unloaded. For country elevators, it is a significant source during theharvest season and declines sharply or is nonexistent during other parts of the year. At terminalelevators, however, unloading is a year-round operation.
Trucks, except for the hopper (gondola) type, are generally unloaded by the use of some type oftruck dumping platform. Hopper trucks discharge through the bottom of the trailer. Elevators are oftendesigned with the truck unloading dump located in a drive-through tunnel. These drive-through areas aresometimes equipped with a roll-down door on one end, although, more commonly they are open at bothends so that the trucks can enter and leave as rapidly as possible. The drive-through access can act as a“wind-tunnel” in that the air may blow through the unloading area at speeds greater than the wind in theopen areas away from the elevator. However, the orientation of the facility to the prevailing winddirection can moderate this effect. Many facilities have installed either roll-down or bi-fold doors toeliminate this effect. The use of these doors can greatly reduce the “wind tunnel” effect and enhance theability to contain and capture the dust.
The unloading pit at a grain elevator usually consists of a heavy grate approximately3.05 m x 3.05 m (10 ft x 10 ft) through which the grain passes as it falls into the receiving pit. This pitwill often be partially filled with grain as the truck unloads because the conveyor beneath the pit does notcarry off the grain as fast as it enters. The dust-laden air emitted by the truck unloading operation resultsfrom displacement of air out of the pit plus the aspiration of air caused by the falling stream of grain. The dust itself is composed of field dirt and grain particles. Unloading grain from hopper trucks withchoke flow-practices can provide a substantial reduction in dust emissions.
Similarly, a hopper railcar can be unloaded with minimal dust generation if the material isallowed to form a cone around the receiving grate (i.e., choke feed to the receiving pit). This situationwill occur when either the receiving pit or the conveying system serving the pit are undersized incomparison to the rate at which material can be unloaded from the hopper car. In such cases, dust isgenerated primarily during the initial stage of unloading, prior to establishment of the choked-feedconditions. Dust generated by wind currents can be minimized by the use of a shed enclosed on twosides with a manual or motorized door on one end or a shroud around the hopper discharge.
In most cases, barges are unloaded by means of a retractable bucket type elevator that is loweredinto the hold of the barge. There is some generation of dust in the hold as the grain is removed and alsoat the top of the leg where the grain is discharged onto the transfer belt. This latter source is moreappropriately designated a transfer point.
The loadout of grain from elevators into railcar, truck, barge, or ship is another important sourceof PM emissions and is difficult to control. Gravity is usually used to load grain from bins above theloading station or from the scale in the headhouse. The main causes of dust emissions when loading bulkgrain by gravity into trucks or railcars is the wind blowing through the loading sheds and dust generatedwhen the falling stream of grain strikes the truck or railcar hopper. The grain leaving the loading spout isoften traveling at relatively high velocity, and dead boxes, aspiration, socks, or other means are oftenused to reduce dust emissions. Dust emitted during loading of barges and ships is comparable to levelsgenerated during loading of trucks or railcars. The openings for the holds in ocean-going vessels mayalso be covered with tarps if needed to meet air quality standards.
2.0 Industry Description
2-35
Grain dryers present a difficult problem for air pollution control because of the large volumes ofair exhausted from the dryer, the large cross-sectional area of the exhaust, the low specific gravity of theemitted dust, and the high moisture content of the exhaust stream. The rate of emission of PM from graindryers is primarily dependent upon the type of grain, the dustiness of the grain, and the dryerconfiguration (rack or column type). The particles emitted from the dryers, although relatively large,may be very light and difficult to collect. However, during corn drying the characteristic “bees wing” isemitted along with normal grain dust. “Bees wing,” a light flaky material that breaks off from the cornkernel during drying and handling, is a troublesome PM emission. Essentially, all bees wing emissionsare over 50 :m in diameter, and the mass mean diameter is probably in the region of 150 :m. In additionto the bees wings, the dust discharged from grain dryers consists of hulls, cracked grain, weed seeds, andfield dust. Effluent from a corn dryer may consist of 25 percent bees wing, which has a specific gravityof about 0.70 to 1.2. Approximately 95 percent of the grain dust is larger than 50 :m.23
Cross-flow column dryers have a lower emission rate than rack dryers because some of the dustis trapped by the column of grain. In some cases, an enclosure may be built around the dryer that can actas a relatively effective settling chamber because of its moist environment. New grain dryers being soldtoday do not require the use of enclosures. In rack dryers drying corn, the emission rate for larger PMcan be higher because the turning motion of the grain liberates more so-called “bees wings” from thekernal, and the design facilitates dust escape. Some rack dryers are exhausted only from one or twopoints and are thus better suited for control device installation. The EPA’s New Source PerformanceStandards (NSPS) for grain elevators established visible emission limits for grain dryers by requiring0 percent opacity for emissions from column dryers and rack dryers. The NSPS zero opacity standarddoes not apply to column dryers with column plate perforations less than or equal to 2.4 mm in diameter(0.094 in.) or to rack dryers with a screen filter that has openings that are less than or equal to 50 mesh.
Equipment used to clean grain varies from simple screening devices to aspiration-type cleaners. Both types of systems potentially generate substantial quantities of PM depending on the design andextent of enclosure.
Both country and terminal elevators are usually equipped with garner and scale bins for weighingof grain. A country elevator may have only one garner bin and scale bin. However, a terminal elevatorhas multiple scale and garner bin systems, each with a capacity ranging from 42.3 to 88.1 m3 (1,200 to2,500 bu) to process 1,233 to 2,643 m3/hr (35,000 to 75,000 bu/hr). Dust may be emitted from both thescale and garner bin whenever grain is admitted. The incoming stream of grain displaces air from thebin, and the displaced air entrains dust. The potential for emissions depends on the design of the system. For example, some facilities employ a relief duct that connects the two pieces of equipment to provide apath for displaced air. Also, in some cases, the bins are completely open at the top while some systemsare completely enclosed.
The leg may be aspirated to remove dust created by the motion of the buckets and the grain flow. A variety of techniques are used to aspirate elevator legs. For example, some are aspirated at both thetop and bottom; others are fitted with ducting from the top to the bottom in order to equalize the pressure,sometimes including a small blower to serve this purpose. The collected dust is discharged to a cycloneor filter. Leg vents may emit small amounts of dust under some operating conditions. However, thesevents are often capped or sealed to prevent dust emissions. The sealing or capping of the vent isdesigned to act as an explosion relief vent after a certain internal pressure is reached to prevent damageto the equipment.
When grain is handled, the kernels scrape and strike against each other and the conveyingmedium. This action tends to rub off small particles of chaff and to fragment some kernels. Dust iscontinuously generated, and the grain is never absolutely clean. Belt conveyors have less rubbing
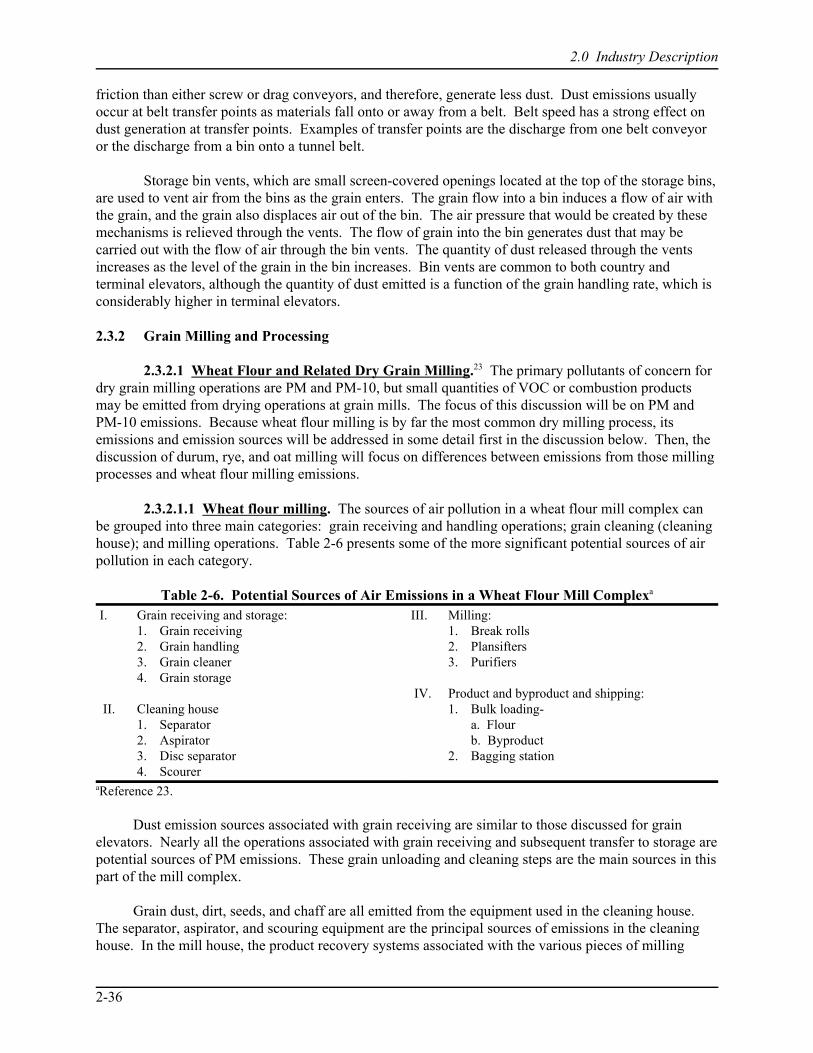
2.0 Industry Description
2-36
friction than either screw or drag conveyors, and therefore, generate less dust. Dust emissions usuallyoccur at belt transfer points as materials fall onto or away from a belt. Belt speed has a strong effect ondust generation at transfer points. Examples of transfer points are the discharge from one belt conveyoror the discharge from a bin onto a tunnel belt.
Storage bin vents, which are small screen-covered openings located at the top of the storage bins,are used to vent air from the bins as the grain enters. The grain flow into a bin induces a flow of air withthe grain, and the grain also displaces air out of the bin. The air pressure that would be created by thesemechanisms is relieved through the vents. The flow of grain into the bin generates dust that may becarried out with the flow of air through the bin vents. The quantity of dust released through the ventsincreases as the level of the grain in the bin increases. Bin vents are common to both country andterminal elevators, although the quantity of dust emitted is a function of the grain handling rate, which isconsiderably higher in terminal elevators.
2.3.2 Grain Milling and Processing
2.3.2.1 Wheat Flour and Related Dry Grain Milling.23 The primary pollutants of concern fordry grain milling operations are PM and PM-10, but small quantities of VOC or combustion productsmay be emitted from drying operations at grain mills. The focus of this discussion will be on PM andPM-10 emissions. Because wheat flour milling is by far the most common dry milling process, itsemissions and emission sources will be addressed in some detail first in the discussion below. Then, thediscussion of durum, rye, and oat milling will focus on differences between emissions from those millingprocesses and wheat flour milling emissions.
2.3.2.1.1 Wheat flour milling. The sources of air pollution in a wheat flour mill complex canbe grouped into three main categories: grain receiving and handling operations; grain cleaning (cleaninghouse); and milling operations. Table 2-6 presents some of the more significant potential sources of airpollution in each category.
Table 2-6. Potential Sources of Air Emissions in a Wheat Flour Mill Complexa
I. Grain receiving and storage:1. Grain receiving2. Grain handling3. Grain cleaner4. Grain storage
II. Cleaning house1. Separator2. Aspirator3. Disc separator4. Scourer
III. Milling:1. Break rolls2. Plansifters3. Purifiers
IV. Product and byproduct and shipping:1. Bulk loading-
a. Flourb. Byproduct
2. Bagging station
aReference 23.
Dust emission sources associated with grain receiving are similar to those discussed for grainelevators. Nearly all the operations associated with grain receiving and subsequent transfer to storage arepotential sources of PM emissions. These grain unloading and cleaning steps are the main sources in thispart of the mill complex.
Grain dust, dirt, seeds, and chaff are all emitted from the equipment used in the cleaning house. The separator, aspirator, and scouring equipment are the principal sources of emissions in the cleaninghouse. In the mill house, the product recovery systems associated with the various pieces of milling
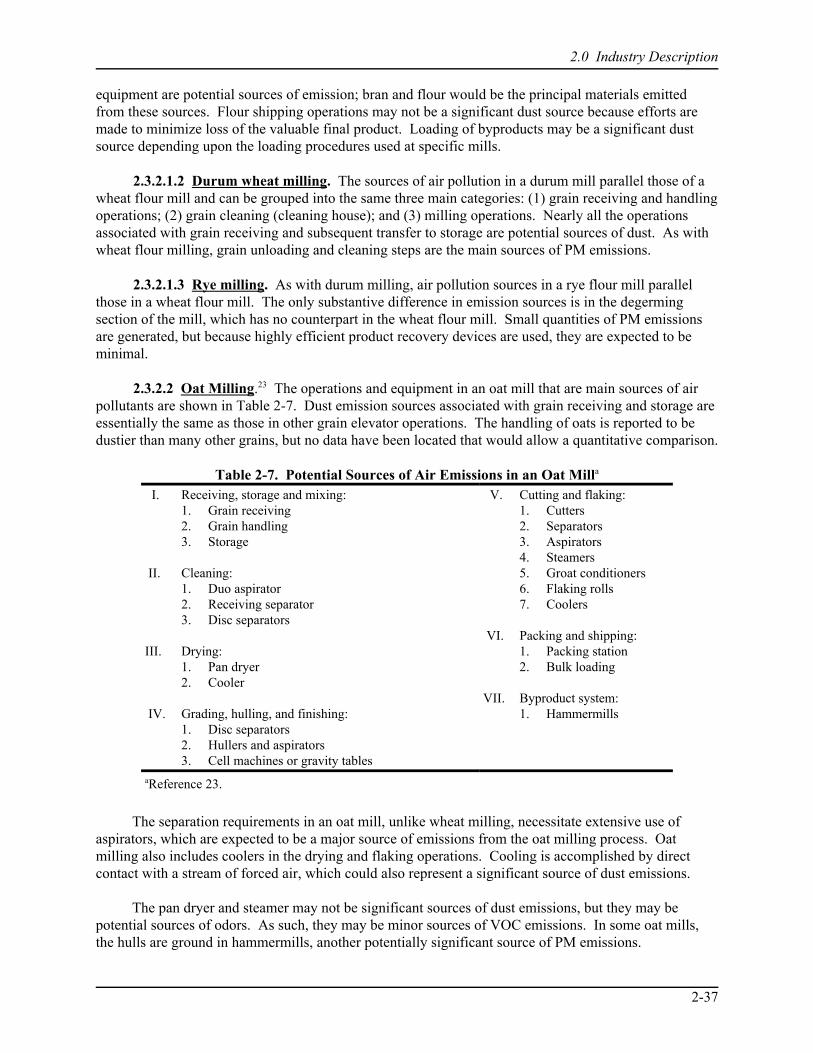
2.0 Industry Description
2-37
equipment are potential sources of emission; bran and flour would be the principal materials emittedfrom these sources. Flour shipping operations may not be a significant dust source because efforts aremade to minimize loss of the valuable final product. Loading of byproducts may be a significant dustsource depending upon the loading procedures used at specific mills.
2.3.2.1.2 Durum wheat milling. The sources of air pollution in a durum mill parallel those of awheat flour mill and can be grouped into the same three main categories: (1) grain receiving and handlingoperations; (2) grain cleaning (cleaning house); and (3) milling operations. Nearly all the operationsassociated with grain receiving and subsequent transfer to storage are potential sources of dust. As withwheat flour milling, grain unloading and cleaning steps are the main sources of PM emissions.
2.3.2.1.3 Rye milling. As with durum milling, air pollution sources in a rye flour mill parallelthose in a wheat flour mill. The only substantive difference in emission sources is in the degermingsection of the mill, which has no counterpart in the wheat flour mill. Small quantities of PM emissionsare generated, but because highly efficient product recovery devices are used, they are expected to beminimal.
2.3.2.2 Oat Milling.23 The operations and equipment in an oat mill that are main sources of airpollutants are shown in Table 2-7. Dust emission sources associated with grain receiving and storage areessentially the same as those in other grain elevator operations. The handling of oats is reported to bedustier than many other grains, but no data have been located that would allow a quantitative comparison.
Table 2-7. Potential Sources of Air Emissions in an Oat Milla
I. Receiving, storage and mixing:1. Grain receiving2. Grain handling3. Storage
II. Cleaning: 1. Duo aspirator2. Receiving separator3. Disc separators
III. Drying:1. Pan dryer2. Cooler
IV. Grading, hulling, and finishing:1. Disc separators2. Hullers and aspirators3. Cell machines or gravity tables
V. Cutting and flaking:1. Cutters2. Separators3. Aspirators4. Steamers5. Groat conditioners6. Flaking rolls7. Coolers
VI. Packing and shipping:1. Packing station2. Bulk loading
VII. Byproduct system:1. Hammermills
aReference 23.
The separation requirements in an oat mill, unlike wheat milling, necessitate extensive use ofaspirators, which are expected to be a major source of emissions from the oat milling process. Oatmilling also includes coolers in the drying and flaking operations. Cooling is accomplished by directcontact with a stream of forced air, which could also represent a significant source of dust emissions.
The pan dryer and steamer may not be significant sources of dust emissions, but they may bepotential sources of odors. As such, they may be minor sources of VOC emissions. In some oat mills,the hulls are ground in hammermills, another potentially significant source of PM emissions.

2.0 Industry Description
2-38
Because nearly all the grain dust and byproducts collected in an oat mill are used in animal feedand other products, control devices are generally considered integral parts of the process equipment. Therefore, the control devices are typically referred to as the emission points.
2.3.2.3 Rice Milling.23 In rice mills, air pollutants result primarily from: (1) grain receiving,cleaning, and storage operations; and (2) rice milling equipment and byproduct processing/loadingoperations. Table 2-8 presents some of the more significant potential sources of air pollution in ricemills.
Table 2-8. Potential Sources of Air Emissions in Rice Millsa
I. Grain receiving and storage:1. Grain receiving2. Rice handling3. Grain dryerb
II. Cleaning house:1. Aspirators2. Separators3. Stoners
III. Mill house and loadout1. Disk huller2. Husks aspirator3. Paddy separator4. Brushes (whitening cones)
IV. Packing and shipping
aReference 23.bIncludes on-farm drying upstream from mills.
Emission sources associated with the grain receiving, cleaning, and storage operations are similar tothose involved with all grain processing. For those mills that dry rice, the rice dryers present a verytroublesome source of emissions. Combine-harvested rice is cut at a relatively high moisture content andmust be dried before it can be stored. Since rice is marketed as a whole grain product, it is important thatgrains not be fractured or otherwise damaged before or during the drying process. Large column-type,continuous-flow dryers are widely used for rice drying. It usually requires two or more passes throughthe dryers to reduce the moisture content to 12.0 percent to 13.5 percent, which is usually consideredsatisfactory for safe storage. Air volumes of 0.96 m3/m3 (120 ft3/bu) of rice are commonly used. Ricedrying is reported to generate a considerable amount of dust.
Preliminary cleaning of rice is sometimes done prior to drying. This preliminary cleaning canproduce a significant reduction in dust emissions during the drying step.
Finished rice, marketed as U.S. No. 1 grade, must be dust-free. To achieve this grade, aspiration isused extensively in rice mills to remove dust as it is generated in the various milling steps (i.e., dust is notconveyed from one machine to another). As a result, all machinery in a rice mill is a source of someamount of dust. The most significant sources of dust are the scalpers, screens, sieves, disc separators,and shellers involved in the cleaning and handling of rough rice. The milling machines, pearlers, andbrushes create bran dust. However, this dust is collected carefully because of its value as a byproduct.
2.3.2.4 Corn Dry Milling.23 Table 2-9 presents some of the more significant potential sources ofair pollution in a corn dry mill. In most corn mills, the dust, small corn particles, spillage, etc., arecollected as part of the processing operation and are saved for animal feed. Control devices for theseprocesses are considered integral parts of the process equipment, and, strictly speaking, the controlsystems rather than the milling equipment are the emission points. Typically, several individual dustsources in both the receiving and processing areas are associated with a common control device.
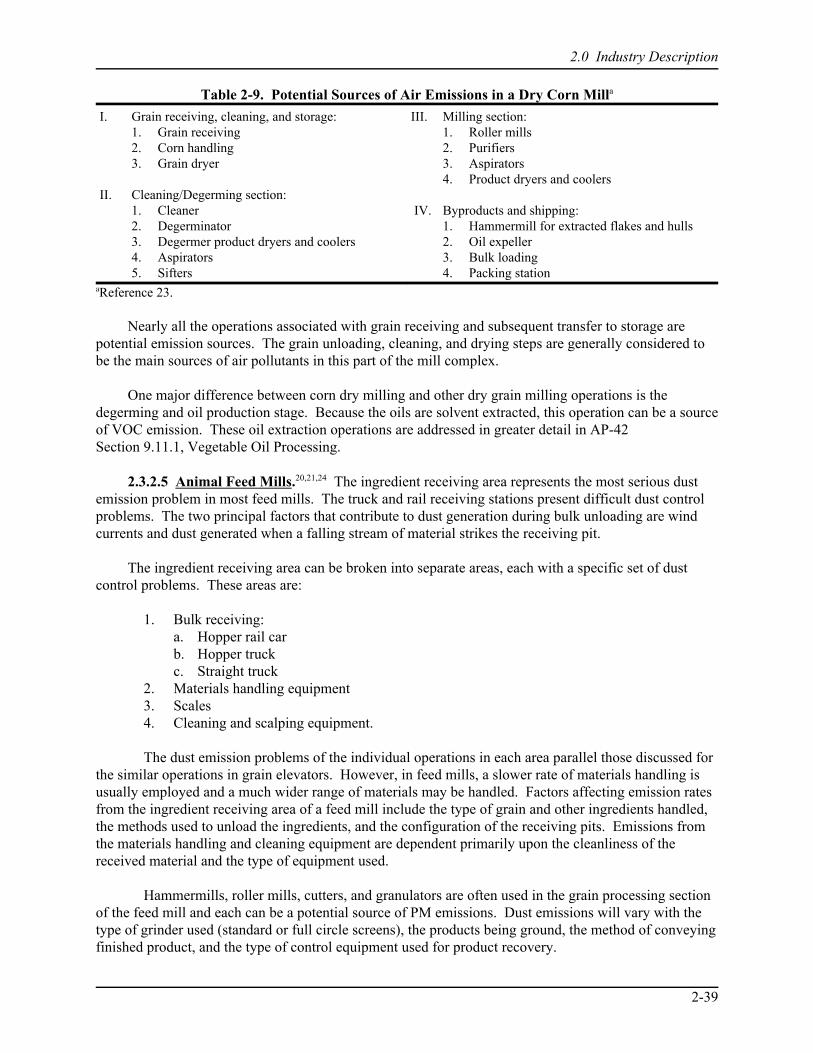
2.0 Industry Description
2-39
Table 2-9. Potential Sources of Air Emissions in a Dry Corn Milla
I. Grain receiving, cleaning, and storage:1. Grain receiving2. Corn handling3. Grain dryer
II. Cleaning/Degerming section:1. Cleaner2. Degerminator3. Degermer product dryers and coolers4. Aspirators5. Sifters
III. Milling section:1. Roller mills2. Purifiers3. Aspirators4. Product dryers and coolers
IV. Byproducts and shipping:1. Hammermill for extracted flakes and hulls2. Oil expeller3. Bulk loading4. Packing station
aReference 23.
Nearly all the operations associated with grain receiving and subsequent transfer to storage arepotential emission sources. The grain unloading, cleaning, and drying steps are generally considered tobe the main sources of air pollutants in this part of the mill complex.
One major difference between corn dry milling and other dry grain milling operations is thedegerming and oil production stage. Because the oils are solvent extracted, this operation can be a sourceof VOC emission. These oil extraction operations are addressed in greater detail in AP-42Section 9.11.1, Vegetable Oil Processing.
2.3.2.5 Animal Feed Mills.20,21,24 The ingredient receiving area represents the most serious dustemission problem in most feed mills. The truck and rail receiving stations present difficult dust controlproblems. The two principal factors that contribute to dust generation during bulk unloading are windcurrents and dust generated when a falling stream of material strikes the receiving pit.
The ingredient receiving area can be broken into separate areas, each with a specific set of dustcontrol problems. These areas are:
1. Bulk receiving:a. Hopper rail carb. Hopper truckc. Straight truck
2. Materials handling equipment3. Scales4. Cleaning and scalping equipment.
The dust emission problems of the individual operations in each area parallel those discussed forthe similar operations in grain elevators. However, in feed mills, a slower rate of materials handling isusually employed and a much wider range of materials may be handled. Factors affecting emission ratesfrom the ingredient receiving area of a feed mill include the type of grain and other ingredients handled,the methods used to unload the ingredients, and the configuration of the receiving pits. Emissions fromthe materials handling and cleaning equipment are dependent primarily upon the cleanliness of thereceived material and the type of equipment used.
Hammermills, roller mills, cutters, and granulators are often used in the grain processing sectionof the feed mill and each can be a potential source of PM emissions. Dust emissions will vary with thetype of grinder used (standard or full circle screens), the products being ground, the method of conveyingfinished product, and the type of control equipment used for product recovery.
2.0 Industry Description
2-40
Standard type hammermills utilizing 180-degree screens will normally require a minimum airflow through the screens in the range of 14 to 28 m3/min (500 to 1,000 ft3/min) per hammermill tomaintain proper grinding action, eliminate back pressures in the mill, and remove heat. The full circle, or360-degree screen, hammermill may or may not require air for proper grinding action. Normally, oncoarse grinding, no air will be required. However, on fine grinding applications, air may be required tocontrol internal temperatures even if dust emissions are not a problem. Both heat and dust can becontrolled by adding more moisture during the grinding process.
Most grains being ground coarsely for mash-type feeds do not generate substantial quantities ofdust. However, fine-grinding of grains, such as barley, wheat, and sorghum for pelleted-type feeds, cancreate dust problems.
The method of conveying the finished hammermill product has a major influence on dustemissions. Products from hammermills can be handled by:
1. Gravity systems (direct flow to bin);2. Mechanical systems (conveyors and elevators);3. Positive pressure pneumatic systems (high pressure);4. Negative pressure pneumatic systems;5. Fans attached to mill shaft (negative- and low-positive pressure); and6. Separate fans located at the mill (negative- and low-positive pressure).
The gravity system will produce the least amount of dust emissions while the separate fan system willnormally be the most “dusty” system.
Pellet mills are not a significant source of dust emissions. However, the pellet coolers are asource of dust, and they present control problems because of the moisture content of the airstreamleaving the coolers. In a pellet cooler, the moisture content of the material is reduced fromapproximately 17 percent to 11 percent. The air flow rate in older mills ranges from 170 to 396 m3/min(6,000 to 14,000 ft3/min) in the coolers while in newer plants, air flow rates of 425 to 849 m3/min (15,000to 30,000 ft3/min) are common.23 A rule-of-thumb for estimating air flow rates through these units is31 m3/min/Mg (1,000 ft3/min/ton) of pellets per hour.
While the bulk loadout of finished feed does not usually involve inherently dusty materials,loadout operations may still present a major source of PM emissions at feed mills. Bulk loading of trucksand railcars is done in a number of ways, all of which fall into two basic categories:
1. Gravity filling—material is moved by pneumatic or mechanical conveyor systems ordischarged from overhead bins or scale hopper dropping directly into railcar or truck by gravity through asuitable connection.
2. Pneumatic filling—material is conveyed by air (positive pressure) directly to truck or railcarwithout use of a collector to separate air and material.
The main causes of dust emissions when loading bulk feed by gravity into trucks or railcars is thewind blowing through the loading sheds and dust generated when the falling stream of feed strikes thetruck or railcar hopper. The wind velocity through loadout sheds and between bins is normally greaterthan that of the average wind velocity in open areas near the mill. Loading of bulk feed into railcars andtrucks with a positive pressure system (pneumatic) requires a tightly closed system. Because the systemmust be tightly closed, the wind in the area has no effect on dust control.
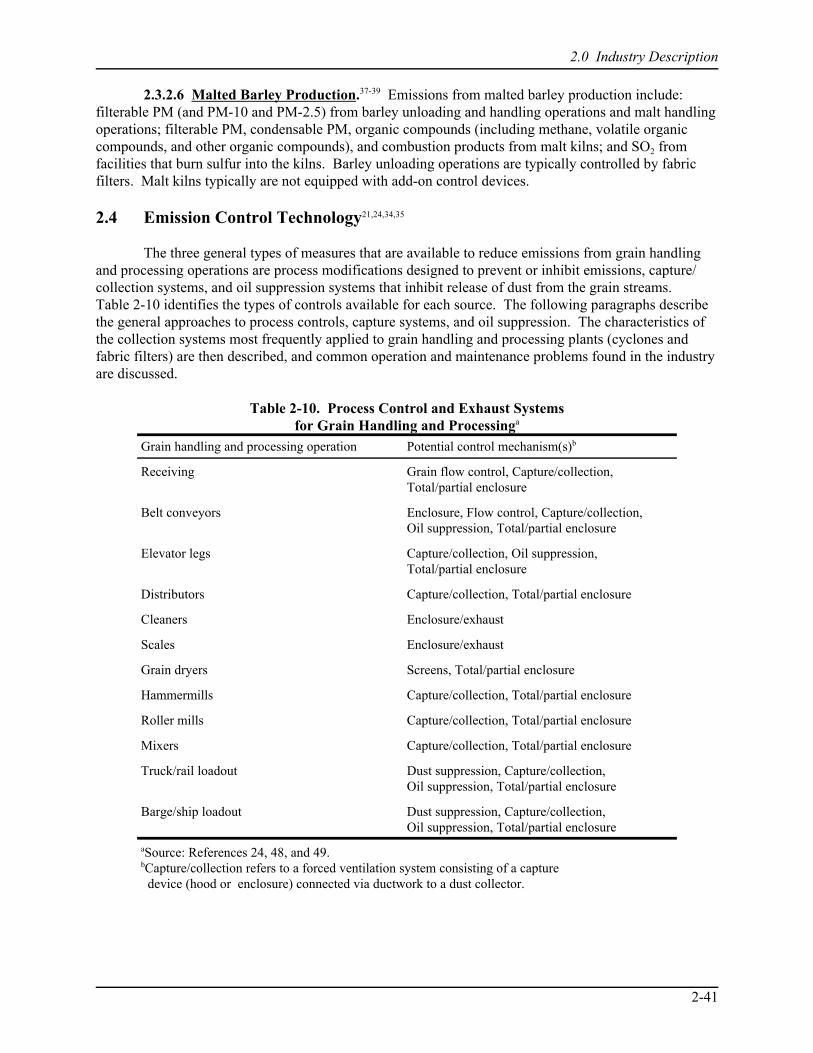
2.0 Industry Description
2-41
2.3.2.6 Malted Barley Production.37-39 Emissions from malted barley production include: filterable PM (and PM-10 and PM-2.5) from barley unloading and handling operations and malt handlingoperations; filterable PM, condensable PM, organic compounds (including methane, volatile organiccompounds, and other organic compounds), and combustion products from malt kilns; and SO2 fromfacilities that burn sulfur into the kilns. Barley unloading operations are typically controlled by fabricfilters. Malt kilns typically are not equipped with add-on control devices.
2.4 Emission Control Technology21,24,34,35
The three general types of measures that are available to reduce emissions from grain handlingand processing operations are process modifications designed to prevent or inhibit emissions, capture/collection systems, and oil suppression systems that inhibit release of dust from the grain streams. Table 2-10 identifies the types of controls available for each source. The following paragraphs describethe general approaches to process controls, capture systems, and oil suppression. The characteristics ofthe collection systems most frequently applied to grain handling and processing plants (cyclones andfabric filters) are then described, and common operation and maintenance problems found in the industryare discussed.
Table 2-10. Process Control and Exhaust Systemsfor Grain Handling and Processinga
Grain handling and processing operation Potential control mechanism(s)b
Receiving Grain flow control, Capture/collection,Total/partial enclosure
Belt conveyors Enclosure, Flow control, Capture/collection, Oil suppression, Total/partial enclosure
Elevator legs Capture/collection, Oil suppression,Total/partial enclosure
Distributors Capture/collection, Total/partial enclosure
Cleaners Enclosure/exhaust
Scales Enclosure/exhaust
Grain dryers Screens, Total/partial enclosure
Hammermills Capture/collection, Total/partial enclosure
Roller mills Capture/collection, Total/partial enclosure
Mixers Capture/collection, Total/partial enclosure
Truck/rail loadout Dust suppression, Capture/collection,Oil suppression, Total/partial enclosure
Barge/ship loadout Dust suppression, Capture/collection,Oil suppression, Total/partial enclosure
aSource: References 24, 48, and 49.bCapture/collection refers to a forced ventilation system consisting of a capture device (hood or enclosure) connected via ductwork to a dust collector.
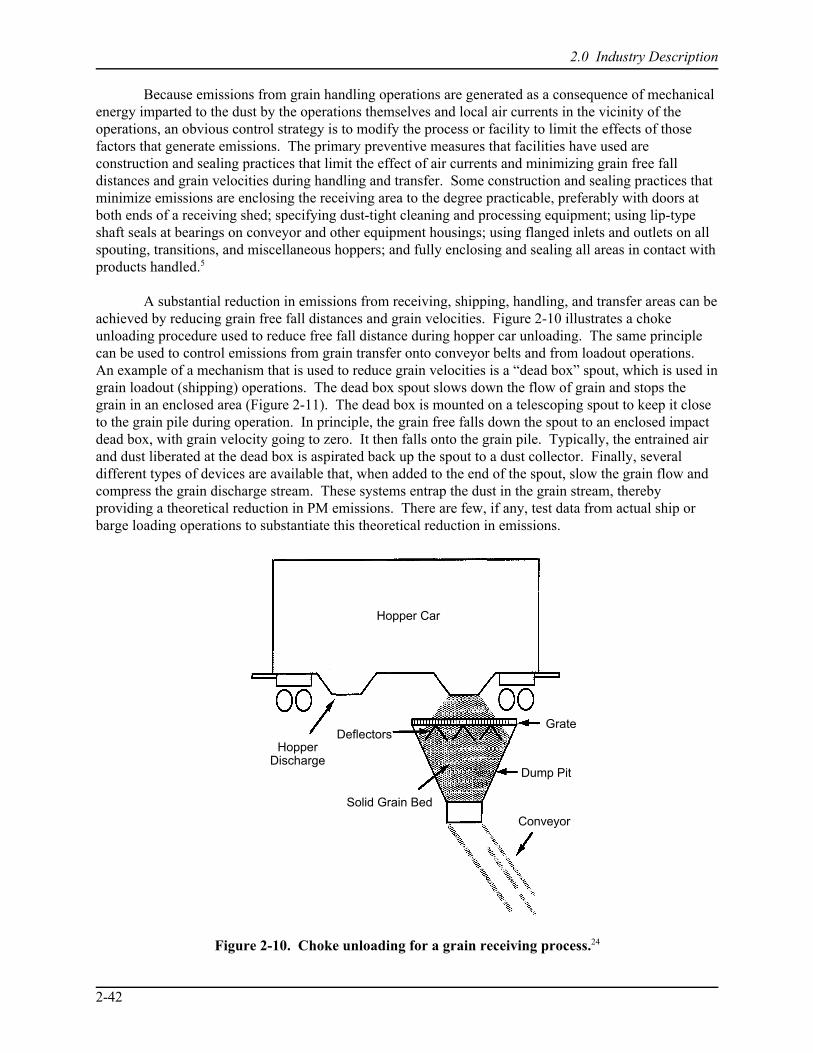
2.0 Industry Description
2-42
Hopper Car
Grate
Dump Pit
Conveyor
Solid Grain Bed
DeflectorsHopper
Discharge
Figure 2-10. Choke unloading for a grain receiving process.24
Because emissions from grain handling operations are generated as a consequence of mechanicalenergy imparted to the dust by the operations themselves and local air currents in the vicinity of theoperations, an obvious control strategy is to modify the process or facility to limit the effects of thosefactors that generate emissions. The primary preventive measures that facilities have used areconstruction and sealing practices that limit the effect of air currents and minimizing grain free falldistances and grain velocities during handling and transfer. Some construction and sealing practices thatminimize emissions are enclosing the receiving area to the degree practicable, preferably with doors atboth ends of a receiving shed; specifying dust-tight cleaning and processing equipment; using lip-typeshaft seals at bearings on conveyor and other equipment housings; using flanged inlets and outlets on allspouting, transitions, and miscellaneous hoppers; and fully enclosing and sealing all areas in contact withproducts handled.5
A substantial reduction in emissions from receiving, shipping, handling, and transfer areas can beachieved by reducing grain free fall distances and grain velocities. Figure 2-10 illustrates a chokeunloading procedure used to reduce free fall distance during hopper car unloading. The same principlecan be used to control emissions from grain transfer onto conveyor belts and from loadout operations. An example of a mechanism that is used to reduce grain velocities is a “dead box” spout, which is used ingrain loadout (shipping) operations. The dead box spout slows down the flow of grain and stops thegrain in an enclosed area (Figure 2-11). The dead box is mounted on a telescoping spout to keep it closeto the grain pile during operation. In principle, the grain free falls down the spout to an enclosed impactdead box, with grain velocity going to zero. It then falls onto the grain pile. Typically, the entrained airand dust liberated at the dead box is aspirated back up the spout to a dust collector. Finally, severaldifferent types of devices are available that, when added to the end of the spout, slow the grain flow andcompress the grain discharge stream. These systems entrap the dust in the grain stream, therebyproviding a theoretical reduction in PM emissions. There are few, if any, test data from actual ship orbarge loading operations to substantiate this theoretical reduction in emissions.
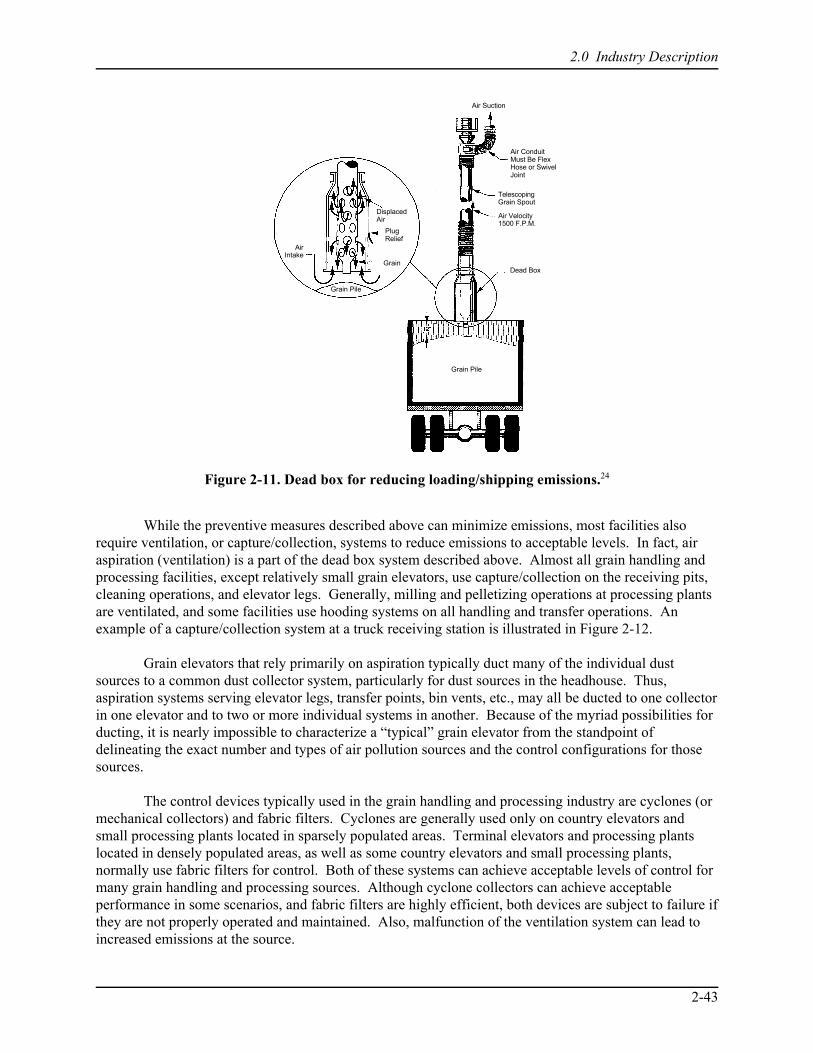
2.0 Industry Description
2-43
Air Suction
Air ConduitMust Be FlexHose or SwivelJoint
TelescopingGrain Spout
Air Velocity1500 F.P.M.
DisplacedAir
PlugRelief
Grain
Grain Pile
AirIntake
Dead Box
Grain Pile
Figure 2-11. Dead box for reducing loading/shipping emissions.24
While the preventive measures described above can minimize emissions, most facilities alsorequire ventilation, or capture/collection, systems to reduce emissions to acceptable levels. In fact, airaspiration (ventilation) is a part of the dead box system described above. Almost all grain handling andprocessing facilities, except relatively small grain elevators, use capture/collection on the receiving pits,cleaning operations, and elevator legs. Generally, milling and pelletizing operations at processing plantsare ventilated, and some facilities use hooding systems on all handling and transfer operations. Anexample of a capture/collection system at a truck receiving station is illustrated in Figure 2-12.
Grain elevators that rely primarily on aspiration typically duct many of the individual dustsources to a common dust collector system, particularly for dust sources in the headhouse. Thus,aspiration systems serving elevator legs, transfer points, bin vents, etc., may all be ducted to one collectorin one elevator and to two or more individual systems in another. Because of the myriad possibilities forducting, it is nearly impossible to characterize a “typical” grain elevator from the standpoint ofdelineating the exact number and types of air pollution sources and the control configurations for thosesources.
The control devices typically used in the grain handling and processing industry are cyclones (ormechanical collectors) and fabric filters. Cyclones are generally used only on country elevators andsmall processing plants located in sparsely populated areas. Terminal elevators and processing plantslocated in densely populated areas, as well as some country elevators and small processing plants,normally use fabric filters for control. Both of these systems can achieve acceptable levels of control formany grain handling and processing sources. Although cyclone collectors can achieve acceptableperformance in some scenarios, and fabric filters are highly efficient, both devices are subject to failure ifthey are not properly operated and maintained. Also, malfunction of the ventilation system can lead toincreased emissions at the source.
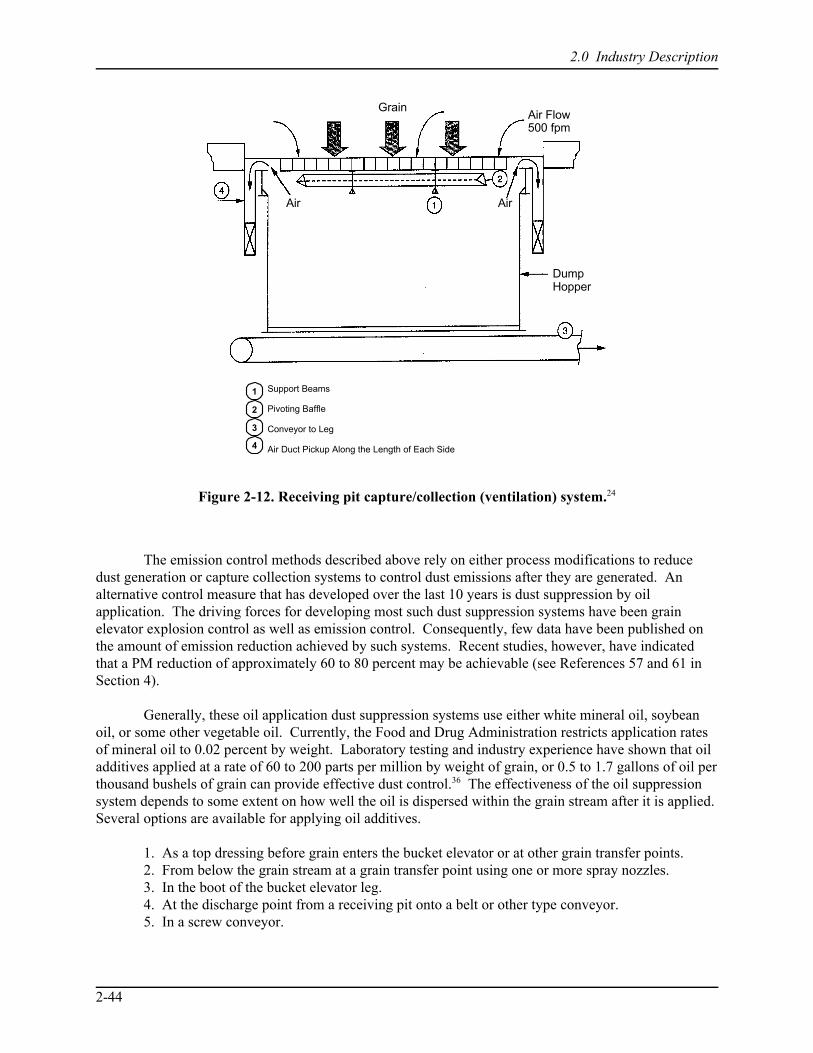
2.0 Industry Description
2-44
GrainAir Flow500 fpm
Air Air
DumpHopper
Support Beams
Pivoting Baffle
Conveyor to Leg
Air Duct Pickup Along the Length of Each Side
1
2
3
4
Figure 2-12. Receiving pit capture/collection (ventilation) system.24
The emission control methods described above rely on either process modifications to reducedust generation or capture collection systems to control dust emissions after they are generated. Analternative control measure that has developed over the last 10 years is dust suppression by oilapplication. The driving forces for developing most such dust suppression systems have been grainelevator explosion control as well as emission control. Consequently, few data have been published onthe amount of emission reduction achieved by such systems. Recent studies, however, have indicatedthat a PM reduction of approximately 60 to 80 percent may be achievable (see References 57 and 61 inSection 4).
Generally, these oil application dust suppression systems use either white mineral oil, soybeanoil, or some other vegetable oil. Currently, the Food and Drug Administration restricts application ratesof mineral oil to 0.02 percent by weight. Laboratory testing and industry experience have shown that oiladditives applied at a rate of 60 to 200 parts per million by weight of grain, or 0.5 to 1.7 gallons of oil perthousand bushels of grain can provide effective dust control.36 The effectiveness of the oil suppressionsystem depends to some extent on how well the oil is dispersed within the grain stream after it is applied. Several options are available for applying oil additives.
1. As a top dressing before grain enters the bucket elevator or at other grain transfer points.2. From below the grain stream at a grain transfer point using one or more spray nozzles.3. In the boot of the bucket elevator leg.4. At the discharge point from a receiving pit onto a belt or other type conveyor.5. In a screw conveyor.
2.0 Industry Description
2-45
2.5 References for Section 2
1. Mark S. Carleton, The Small Grains, The MacMillan Company, NY, 1923. 2. Donald C. Rasmusson (ed), Barley, American Society of Agronomy, Crop Science Society of
America, Soil Society of America, Madison, WI, 1985.
3. R. F. Peterson, Wheat, Interscience Publishers, Inc., NY, 1965.
4. S. K. De Datta, Principles and Practices of Rice Production, John Wiley and Sons, NY, 1981.
5. A. V. Myasnihora, Y. S. Rall, L. A. Trisvyatskii, and I.S. Shatilor, Handbook of Food Products--Grain and Its Products, Israel Program for Scientific Translations, Jerusalem, Israel, 1969.
6. Samuel R. Aldrich, Walter O. Scott, and Robert G. Hoeft, Modern Corn Production, Third Edition,A. & L. Publications, Champaign, IL, 1986.
7. Walter Bushuk, Rye: Production, Chemistry, and Technology, American Association of CerealChemists, St. Paul, MN, 1976.
8. Francis H. Webster, Oats: Chemistry and Technology, American Association of Cereal Chemists,St. Paul, MN, 1986.
9. Samuel A. Matz, Cereal Science, Avi Publishing Co., Westport, CT, 1969.
10. The World Book Encyclopedia, Chicago, 1992.
11. Farms and Land in Farms, U.S. Department of Agriculture, Agricultural Statistics Board, NationalAgricultural Statistics Service, July, 1996.
12. D.B. Brooker, F.W. Bakker—Arkema, and C.W. Hall, Drying and Storage of Grains and OilSeeds, Van Nostrand Reinhold, New York, NY, 1992.
13. Crop Production Annual Summary, U.S. Department of Agriculture, Agricultural Statistics Board,National Agricultural Statistics Service, January, 1997.
14. Grain Stocks, U.S. Department of Agriculture, Agricultural Statistics Board, National AgriculturalStatistics Service, January, 1997.
15. V. Ramanthan and D. Wallace, Review of Compliance Monitoring Programs with Respect to GrainElevators, Final Report, EPA Contract 68-01-4139, Tasks 12 and 14, Midwest Research Institute,March 1980.
16. Transportation of U.S. Grains, A Model Share Analysis, USDA-AMS. U.S. Department ofAgriculture, July 1992.
17. Statistical Summaries, Milling Directory, Milling and Baking News, p. 9, 1992.
18. 1992 Census of Manufactures, Grain Mill Products, U.S. Department of Commerce, June 1995.
19. 1987 Census of Manufactures, Fats and Oils, U.S. Department of Commerce, December 1989.
2.0 Industry Description
2-46
20. Source Category Survey: Animal Feed Dryers, EPA-450/3-81-017, U.S. Environmental ProtectionAgency, Research Triangle Park, NC, 1981.
21. R. L. McElhiney, Feed Manufacturing Technology III, American Feed Manufacturers Association, Arlington, VA, 1985.
22. Facsimile from Brian Bursiek, American Feed Industry Association, Washington, D.C., to TomLapp, Midwest Research Institute, Cary, NC, October 6, 1997.
23. L. J. Shannon, et al., Emissions Control in the Grain and Feed Industry, Volume I: Engineeringand Cost Study, EPA-450/3-73-003a, U.S. Environmental Protection Agency, Research TrianglePark, NC, December 1973.
24. D. Wallace, Grain Handling and Processing, Part of Chapter 13, “Food and Agricultural Industry,”in Air Pollution Engineering Manual, Van Nostrand Reinhold, NY, 1992.
25. Letter from Thomas C. O’Connor, National Grain and Feed Association, to Dallas Safriet, U. S.Environmental Protection Agency, Research Triangle Park, NC. November 24, 1993.
26. Bienvenido O. Juliano. Rice Chemistry and Technology, American Association of CerealChemists. St. Paul, MN, 1985.
27. Bor S. Luk. Rice, Volume I, Production, Second Edition, Van Nostrand Reinhold, New York, NY,1991.
28. Bor S. Luk. Rice, Volume II, Utilization, Second Edition, Van Nostrand Reinhold, New York, NY,1991.
29. G. F. Spraque and J. W. Dudley, Corn and Corn Improvement, Third Edition, American Society ofAgronomy, Inc., Crop Science Society of America, Inc., and Soil Science Society of America, Inc.,Madison, WI, 1988.
30. S. A. Watson and P. E. Ramstad. Corn Chemistry and Technology, American Association ofCereal Chemists, Inc., St. Paul, MN, 1987.
31. Letter from Brian Bursiek, American Feed Industry Association, to Dallas Safriet, U. S.Environmental Protection Agency, Research Triangle Park, NC. October 27, 1993.
32. R. A. Wachter and T. R. Blackwood, Source Assessment: Harvesting of Grain, State of Art,EPA-600/2-77-107f, U.S. Environmental Protection Agency, Research Triangle Park, NC, 1977.
33. Health and Hygiene, Inc. Worker Exposure to Dust in the Grain Industry. Unpublished report forthe National Grain and Feed Association. September, 1991.
34. H. D. Wardlaw Jr., C. B. Parnell Jr., and B. J. Leschar, Dust Suppression Results with Mineral OilApplications for Corn and Milo, Transactions of the American Society of Agricultural Engineers,1989.
35. F. S. Lai, et al., Reducing Grain Dust with Oil Additives, Transactions of American Society ofAgricultural Engineers, 1981.
2.0 Industry Description
2-47
36. Letter from Thomas C. O’Connor, National Grain and Feed Association, to Dallas Safriet, U.S.Environmental Protection Agency, Research Triangle Park, NC. June 30, 1997.
37. Compliance Test Report for the Determination of Nonmethane Organic Compound Emissions fromthe No. 15 Kiln Malt Dryer Exhaust, Prepared for Ladish Malting Company, Jefferson Junction,WI, Fluid Management, Inc., Milwaukee, WI, December 1995.
38. H. J. Beaulieu, Final Report Atmospheric Emission Testing Busch Agricultural Resources, Inc. Idaho Falls Malt Plant, Industrial Hygiene Resources, Ltd., Boise, Idaho, October, 1991.
39. M. J. Huenink, Total Particulate Emissions Stack Testing of the Kiln 6 Operations at BuschAgricultural Resources, Inc., Manitowoc, Wisconsin, Environmental Technology & EngineeringCorp., Elm Grove, Wisconsin, May 8, 1996.
2.0 Industry Description
2-48
This page intentionally left blank.
3.0 General Data Review and Analysis Procedures
3-1
3.0 General Data Review and AnalysisProcedures
3.1 Literature Search and Screening
Data for this investigation were obtained from a number of sources within the Office of AirQuality Planning and Standards (OAQPS) and from outside organizations. The AP-42 background fileslocated in the Emission Factor and Inventory Group (EFIG) were reviewed for information on theindustry, processes, and emissions. The Factor Information and Retrieval (FIRE), Crosswalk/Air ToxicEmission Factor Data Base Management System (XATEF), and VOC/PM Speciation Data BaseManagement System (SPECIATE) data bases were searched by SCC code for identification of thepotential pollutants emitted and emission factors for those pollutants. A general search of the Air CHIEFCD-ROM also was conducted to supplement the information from these data bases.
Information on the industry, including number of plants, plant location, and annual productioncapacities, was obtained from the United States Department of Agriculture (USDA), the Census ofManufactures and other sources. A number of sources of information were investigated specifically foremission test reports and data. A search of the Test Method Storage and Retrieval (TSAR) data base wasconducted to identify test reports for sources within the grain elevator and grain processing industry. However, no test reports were located using the TSAR data base. The EPA library was searched foradditional test reports. Using information obtained on plant locations, individual facilities and state andRegional offices were contacted about the availability of test reports. Publications lists from the Officeof Research and Development (ORD) and Control Technology Center (CTC) were also searched forreports on emissions from the grain elevator and grain processing industry. In addition, representativetrade associations, including the National Grain and Feed Association (NGFA), and National Cattleman’sBeef Association, were contacted for assistance in obtaining information about the industry andemissions.
To screen out unusable test reports, documents, and information from which emission factorscould not be developed, the following general criteria were used:
1. Emission data must be from a primary reference:
a. Source testing must be from a referenced study that does not reiterate information fromprevious studies.
b. The document must constitute the original source of test data. For example, a technical paperwas not included if the original study was contained in the previous document. If the exact source of thedata could not be determined, the document was eliminated.
2. The referenced study should contain test results based on more than one test run. If resultsfrom only one run are presented, the emission factors must be down rated.
3.0 General Data Review and Analysis Procedures
3-2
3. The report must contain sufficient data to evaluate the testing procedures and source operatingconditions (e.g., one-page reports were generally rejected).
A final set of Reference materials was compiled after a thorough review of the pertinent reports,documents, and information according to these criteria.
3.2 Data Quality Rating System1
As part of the analysis of the emission data, the quantity and quality of the information containedin the final set of Reference documents were evaluated. The following data were excluded fromconsideration:
1. Test series averages reported in units that cannot be converted to the selected reporting units;
2. Test series representing incompatible test methods (i.e., comparison of EPA Method 5 fronthalf with EPA Method 5 front and back half);
3. Test series of controlled emissions for which the control device is not specified;
4. Test series in which the source process is not clearly identified and described; and
5. Test series in which it is not clear whether the emissions were measured before or after thecontrol device.
Test data sets that were not excluded were assigned a quality rating. The rating system used wasthat specified by EFIG for preparing AP-42 sections. The data were rated as follows:
A—Multiple test runs that were performed using sound methodology and reported in enoughdetail for adequate validation. These tests do not necessarily conform to the methodology specified inEPA Reference test methods, although these methods were used as a guide for the methodology actuallyused.
B—Tests that were performed by a generally sound methodology but lack enough detail foradequate validation.
C—Tests that were based on an unproven or new methodology or that lacked a significantamount of background information.
D—Tests that were based on a generally unacceptable method but may provide an order-of-magnitude value for the source.
The following criteria were used to evaluate source test reports for sound methodology andadequate detail:
1. Source operation. The manner in which the source was operated is well documented in thereport. The source was operating within typical parameters during the test.
2. Sampling procedures. The sampling procedures conformed to a generally acceptablemethodology. If actual procedures deviated from accepted methods, the deviations are well documented. When this occurred, an evaluation was made of the extent to which such alternative procedures couldinfluence the test results.

3.0 General Data Review and Analysis Procedures
3-3
3. Sampling and process data. Adequate sampling and process data are documented in thereport, and any variations in the sampling and process operation are noted. If a large spread between testresults cannot be explained by information contained in the test report, the data are suspect and are givena lower rating.
4. Analysis and calculations. The test reports contain original raw data sheets. Thenomenclature and equations used were compared to those (if any) specified by EPA to establishequivalency. The depth of review of the calculations was dictated by the reviewer’s confidence in theability and conscientiousness of the tester, which in turn was based on factors such as consistency ofresults and completeness of other areas of the test report.
3.3 Emission Factor Quality Rating System1
The quality of the emission factors developed from analysis of the test data was rated using thefollowing general criteria:
A—Excellent: Developed from A- and B-rated source test data taken from many randomlychosen facilities in the industry population. The source category is specific enough so that variabilitywithin the source category population may be minimized.
B—Above average: Developed only from A- or B-rated test data from a reasonable number offacilities. Although no specific bias is evident, it is not clear if the facilities tested represent a randomsample of the industries. The source category is specific enough so that variability within the sourcecategory population may be minimized.
C—Average: Developed only from A-, B- and/or C-rated test data from a reasonable number offacilities. Although no specific bias is evident, it is not clear if the facilities tested represent a randomsample of the industry. In addition, the source category is specific enough so that variability within thesource category population may be minimized.
D—Below average: The emission factor was developed only from A-, B-, and/or C-rated testdata from a small number of facilities, and there is reason to suspect that these facilities do not representa random sample of the industry. There also may be evidence of variability within the source categorypopulation. Limitations on the use of the emission factor are noted in the emission factor table.
E—Poor: The emission factor was developed from C- and D-rated test data, and there is reasonto suspect that the facilities tested do not represent a random sample of the industry. There also may beevidence of variability within the source category population. Limitations on the use of these factors arefootnoted.
The use of these criteria is somewhat subjective and depends to an extent upon the individualreviewer. Details of the rating of each candidate emission factor are provided in Section 4.
3.4 Reference for Section 3
1. Procedures for Preparing Emission Factor Documents, EPA-454/R-95-015, U. S. EnvironmentalProtection Agency, Research Triangle Park, NC, May 1997.
3.0 General Data Review and Analysis Procedures
3-4
This page intentionally left blank.
4.0 AP-42 Section Development
4-1
4.0 AP-42 Section DevelopmentThis section describes the test data and methodology used to update pollutant emission factors
for the interim AP-42 Section 9.9.1, Grain Elevators and Processes. This update was the result of areview and analysis of the data base used to formulate the current emission factors and of new dataobtained during the literature search. Excerpts from the various tests reports and calculations used toreduce the data to an appropriate format for emission factor development are contained in Appendices Bthrough EE.
4.1 Review of Specific Data Sets
During the literature search, 65 documents that contained information about grain handlingemissions were collected and reviewed. Two additional documents on analyzing particle size data werealso reviewed. These documents are listed in the references at the end of this section. The list ofreferences also indicates whether the report contains emission data that are used for emission factordevelopment.
The original group of documents were reduced to a final set of 37 primary reports using thecriteria outlined in Section 3.1. For those documents not used, Table 4-1 summarizes the basis for theirrejection. The data contained in each of these 37 primary references by number are described below. Allraw test data (and subsequent calculations, if required) are presented in the units in which they wereoriginally published.
Table 4-1. Documents Not Included in Emission Factor Development
Ref. No. Cause(s) for rejection
1 Background document for 1988 revision to Section 6.4—that contained no original data; however,primary references from Reference 1 were reviewed as a part of this study.
2 Unsubstantiated emission factors submitted in response to Section 6.4 revisions in 1987 with no originaltest data. Because the origin of the data could not be determined and quality ratings could not beassigned, they were not considered in the emission factor development.
3 Undocumented test data; neither source characteristics nor test procedures were adequately documentedto rate data.
5 Not original source of test data; used to develop process description.
7 Emissions for corn wet milling; not applicable to this section, but report excerpts retained in AppendixD for reference.
8 Not original source of test data; used to develop emission control technology descriptions.
9 Not original source of test data; used to characterize industry and develop process descriptions andcontrol technology discussion.
13 Secondary data from other sources with no original data and no information specific to grain handlingand processing; not used in this study.
14 Contains no emission data; dated information on grain fumigants only; not used for this study.
15 Emissions data for coal-fired boiler; not applicable to this section.
16 Emissions for grain harvesting not grain processing; not applicable to this section.
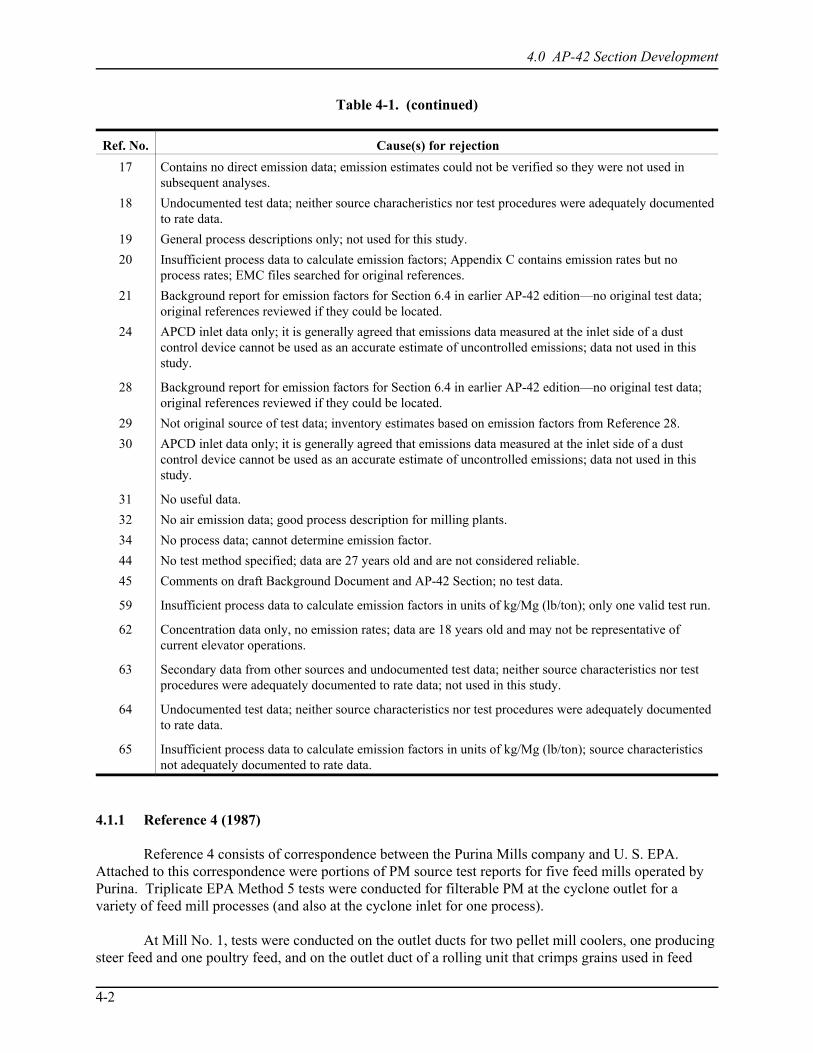
Table 4-1. (continued)
4.0 AP-42 Section Development
Ref. No. Cause(s) for rejection
4-2
17 Contains no direct emission data; emission estimates could not be verified so they were not used insubsequent analyses.
18 Undocumented test data; neither source characheristics nor test procedures were adequately documentedto rate data.
19 General process descriptions only; not used for this study.
20 Insufficient process data to calculate emission factors; Appendix C contains emission rates but noprocess rates; EMC files searched for original references.
21 Background report for emission factors for Section 6.4 in earlier AP-42 edition—no original test data;original references reviewed if they could be located.
24 APCD inlet data only; it is generally agreed that emissions data measured at the inlet side of a dustcontrol device cannot be used as an accurate estimate of uncontrolled emissions; data not used in thisstudy.
28 Background report for emission factors for Section 6.4 in earlier AP-42 edition—no original test data;original references reviewed if they could be located.
29 Not original source of test data; inventory estimates based on emission factors from Reference 28.
30 APCD inlet data only; it is generally agreed that emissions data measured at the inlet side of a dustcontrol device cannot be used as an accurate estimate of uncontrolled emissions; data not used in thisstudy.
31 No useful data.
32 No air emission data; good process description for milling plants.
34 No process data; cannot determine emission factor.
44 No test method specified; data are 27 years old and are not considered reliable.
45 Comments on draft Background Document and AP-42 Section; no test data.
59 Insufficient process data to calculate emission factors in units of kg/Mg (lb/ton); only one valid test run.
62 Concentration data only, no emission rates; data are 18 years old and may not be representative ofcurrent elevator operations.
63 Secondary data from other sources and undocumented test data; neither source characteristics nor testprocedures were adequately documented to rate data; not used in this study.
64 Undocumented test data; neither source characteristics nor test procedures were adequately documentedto rate data.
65 Insufficient process data to calculate emission factors in units of kg/Mg (lb/ton); source characteristicsnot adequately documented to rate data.
4.1.1 Reference 4 (1987)
Reference 4 consists of correspondence between the Purina Mills company and U. S. EPA. Attached to this correspondence were portions of PM source test reports for five feed mills operated byPurina. Triplicate EPA Method 5 tests were conducted for filterable PM at the cyclone outlet for avariety of feed mill processes (and also at the cyclone inlet for one process).
At Mill No. 1, tests were conducted on the outlet ducts for two pellet mill coolers, one producingsteer feed and one poultry feed, and on the outlet duct of a rolling unit that crimps grains used in feed
4.0 AP-42 Section Development
4-3
mix. The rolling unit was processing corn and barley during the test. The steer pellet unit was controlledby a Longhorn cyclone in parallel with two Carter-Day cyclones in series, the poultry pellet unit wascontrolled with two cyclones in parallel, and the rolling unit was controlled by a single cyclone.
At Mill No. 2, tests were conducted on a pellet cooler producing mixed feed and on a corncracker. The excerpts from the test report contained no information about the process, but a summarytable attached to the letter from Purina did indicate that both operations were controlled with cyclones. However, the type of cyclone is unknown, and some of the data in the test report excerpts cannot beclearly tied to a specific process.
At Mill No. 3, results were reported for four pellet coolers, two producing steer feed and twoproducing poultry feed. Again, the test report excerpts contained no information about the processes orcontrol systems, but the summary table did indicate that emissions from each unit were controlled with acyclone system. The test report excerpts indicated that tests were also conducted on the railcar unloadingoperations and that emissions were problematic. However, no data were included in the informationsupplied by Purina. Information from Purina supplied by telephone indicated that only concentrationswere measured at the railcar unloading stations so emission rates could not be determined.
The test results reported for Mill No. 4 are those from Reference 38, which is the original testreport. Consequently, they are not included here.
At Mill No. 5, tests were conducted at the exhaust stack of a pellet cooler operation that wasprocessing hog chow and horse feed. Emissions were controlled by three cyclones operating in series.
Although the information contained in Reference 4 was not fully documented, the data wereconsidered in the development of candidate emission factors. A summary of the test results forMills No. 1, 2, 3, and 5 is shown in Table 4-2. The data for Mill No. 4 is included with the discussion ofReference 38.
Appropriate methods appear to have been used to collect the data presented in Reference 4, andthe data generally appear to be of adequate quality for emission factor development. However, the lackof documentation of some of the process information and the testing methodology affected data qualityratings. For Mill No. 1, process information was reasonably complete and test methods were adequatelydescribed. However, because field and laboratory data were not documented, the data could not be ratedA. For the steer feed cooler and the rolling unit, the data are rated B. The data for the poultry feedcooler are rated C because only one of the two exhaust stacks was tested. For Mill No. 2, process dataare quite limited, and no documentation of the field and laboratory data is provided. Furthermore, stackflow problems that may be indicative of cyclonic flow were noted for both operations. Consequently, thedata are rated C. Because no process information is supplied for Mill No. 3, these data are also rated C. The data for Mill 5 are rated B. Applicable report excerpts and calculations are provided in Appendix B.
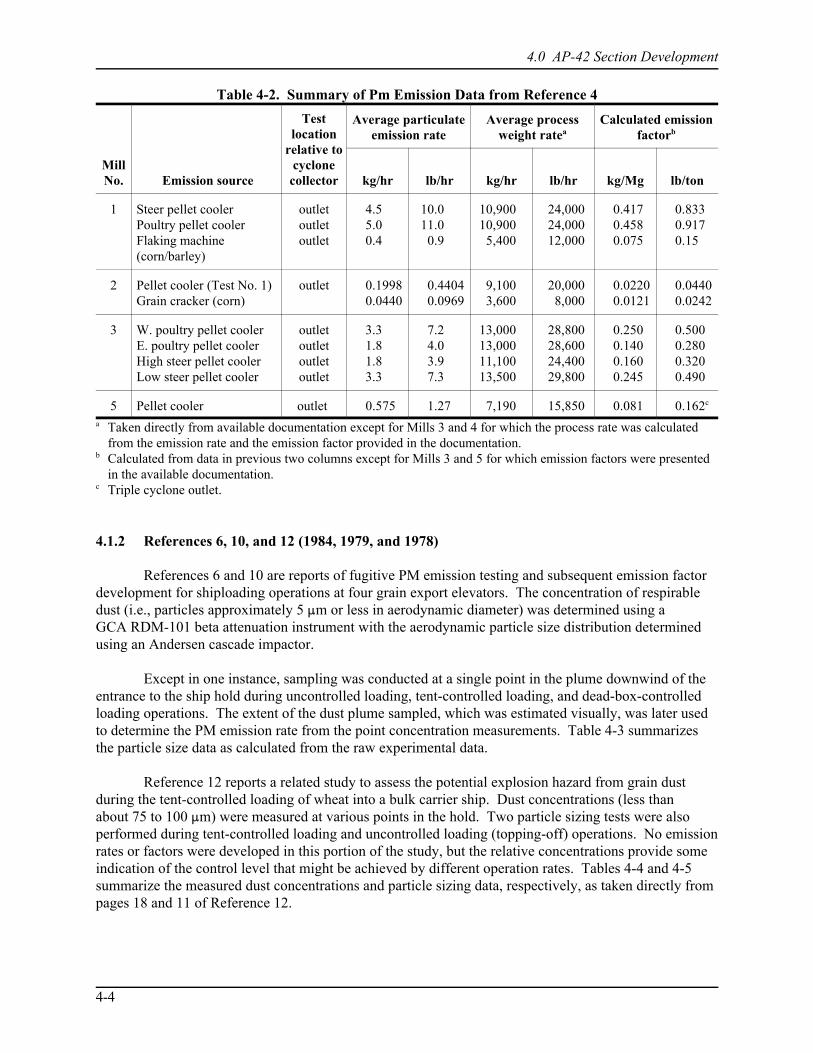
4.0 AP-42 Section Development
4-4
Table 4-2. Summary of Pm Emission Data from Reference 4
MillNo. Emission source
Testlocation
relative tocyclone
collector
Average particulateemission rate
Average processweight ratea
Calculated emissionfactorb
kg/hr lb/hr kg/hr lb/hr kg/Mg lb/ton
1 Steer pellet coolerPoultry pellet coolerFlaking machine(corn/barley)
outletoutletoutlet
4.55.00.4
10.011.0
0.9
10,90010,900
5,400
24,00024,00012,000
0.4170.4580.075
0.8330.9170.15
2 Pellet cooler (Test No. 1)Grain cracker (corn)
outlet 0.19980.0440
0.44040.0969
9,1003,600
20,0008,000
0.02200.0121
0.04400.0242
3 W. poultry pellet coolerE. poultry pellet coolerHigh steer pellet coolerLow steer pellet cooler
outletoutletoutletoutlet
3.31.81.83.3
7.24.03.97.3
13,00013,00011,10013,500
28,80028,60024,40029,800
0.2500.1400.1600.245
0.5000.2800.3200.490
5 Pellet cooler outlet 0.575 1.27 7,190 15,850 0.081 0.162c
a Taken directly from available documentation except for Mills 3 and 4 for which the process rate was calculatedfrom the emission rate and the emission factor provided in the documentation.
b Calculated from data in previous two columns except for Mills 3 and 5 for which emission factors were presentedin the available documentation.
c Triple cyclone outlet.
4.1.2 References 6, 10, and 12 (1984, 1979, and 1978)
References 6 and 10 are reports of fugitive PM emission testing and subsequent emission factordevelopment for shiploading operations at four grain export elevators. The concentration of respirabledust (i.e., particles approximately 5 :m or less in aerodynamic diameter) was determined using a GCA RDM-101 beta attenuation instrument with the aerodynamic particle size distribution determinedusing an Andersen cascade impactor.
Except in one instance, sampling was conducted at a single point in the plume downwind of theentrance to the ship hold during uncontrolled loading, tent-controlled loading, and dead-box-controlledloading operations. The extent of the dust plume sampled, which was estimated visually, was later usedto determine the PM emission rate from the point concentration measurements. Table 4-3 summarizesthe particle size data as calculated from the raw experimental data.
Reference 12 reports a related study to assess the potential explosion hazard from grain dustduring the tent-controlled loading of wheat into a bulk carrier ship. Dust concentrations (less thanabout 75 to 100 :m) were measured at various points in the hold. Two particle sizing tests were alsoperformed during tent-controlled loading and uncontrolled loading (topping-off) operations. No emissionrates or factors were developed in this portion of the study, but the relative concentrations provide someindication of the control level that might be achieved by different operation rates. Tables 4-4 and 4-5summarize the measured dust concentrations and particle sizing data, respectively, as taken directly frompages 18 and 11 of Reference 12.
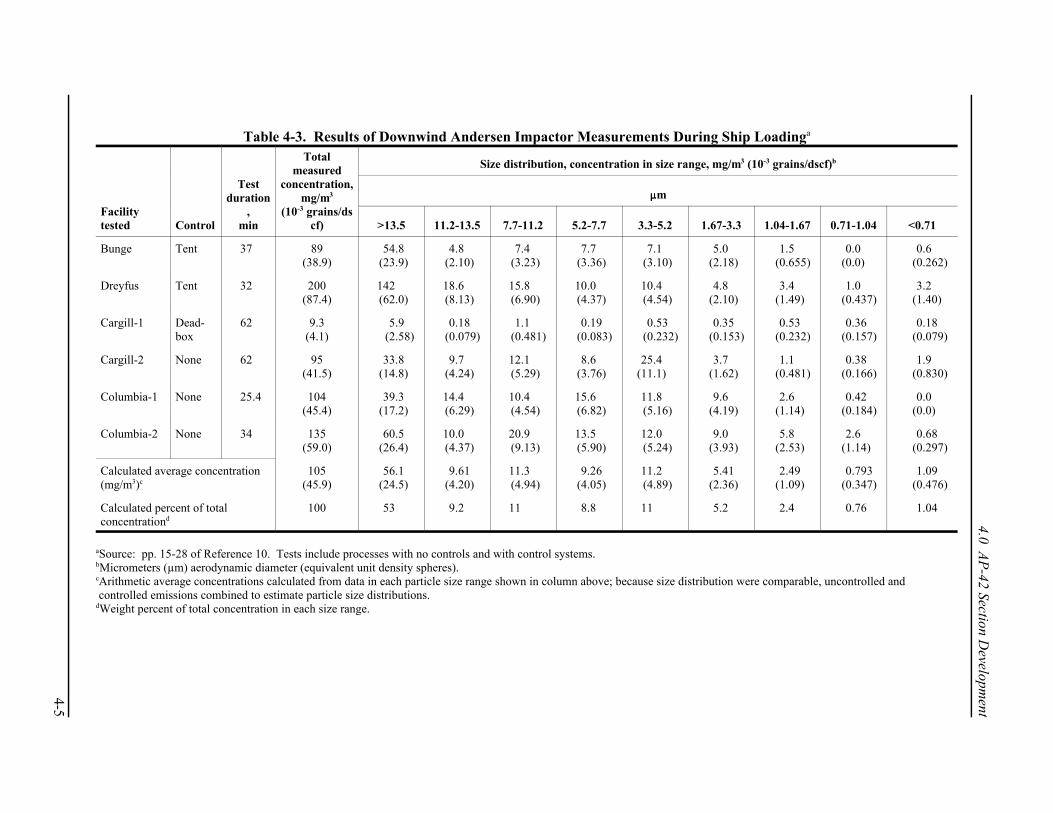
4-5
4.0 AP
-42 Section Developm
ent
Table 4-3. Results of Downwind Andersen Impactor Measurements During Ship Loadinga
Facilitytested Control
Testduration
,min
Totalmeasured
concentration,mg/m3
(10-3 grains/dscf)
Size distribution, concentration in size range, mg/m3 (10-3 grains/dscf)b
::m
>13.5 11.2-13.5 7.7-11.2 5.2-7.7 3.3-5.2 1.67-3.3 1.04-1.67 0.71-1.04 <0.71
Bunge Tent 37 89(38.9)
54.8(23.9)
4.8(2.10)
7.4(3.23)
7.7(3.36)
7.1(3.10)
5.0(2.18)
1.5(0.655)
0.0(0.0)
0.6(0.262)
Dreyfus Tent 32 200(87.4)
142(62.0)
18.6(8.13)
15.8(6.90)
10.0(4.37)
10.4(4.54)
4.8(2.10)
3.4(1.49)
1.0(0.437)
3.2(1.40)
Cargill-1 Dead-box
62 9.3(4.1)
5.9(2.58)
0.18(0.079)
1.1(0.481)
0.19(0.083)
0.53(0.232)
0.35(0.153)
0.53(0.232)
0.36(0.157)
0.18(0.079)
Cargill-2 None 62 95(41.5)
33.8(14.8)
9.7(4.24)
12.1(5.29)
8.6(3.76)
25.4(11.1)
3.7(1.62)
1.1(0.481)
0.38(0.166)
1.9(0.830)
Columbia-1 None 25.4 104(45.4)
39.3(17.2)
14.4(6.29)
10.4(4.54)
15.6(6.82)
11.8(5.16)
9.6(4.19)
2.6(1.14)
0.42(0.184)
0.0(0.0)
Columbia-2 None 34 135(59.0)
60.5(26.4)
10.0(4.37)
20.9(9.13)
13.5(5.90)
12.0(5.24)
9.0(3.93)
5.8(2.53)
2.6(1.14)
0.68(0.297)
Calculated average concentration(mg/m3)c
105(45.9)
56.1(24.5)
9.61(4.20)
11.3(4.94)
9.26(4.05)
11.2(4.89)
5.41(2.36)
2.49(1.09)
0.793(0.347)
1.09(0.476)
Calculated percent of totalconcentrationd
100 53 9.2 11 8.8 11 5.2 2.4 0.76 1.04
aSource: pp. 15-28 of Reference 10. Tests include processes with no controls and with control systems.bMicrometers (µm) aerodynamic diameter (equivalent unit density spheres).cArithmetic average concentrations calculated from data in each particle size range shown in column above; because size distribution were comparable, uncontrolled and controlled emissions combined to estimate particle size distributions.dWeight percent of total concentration in each size range.
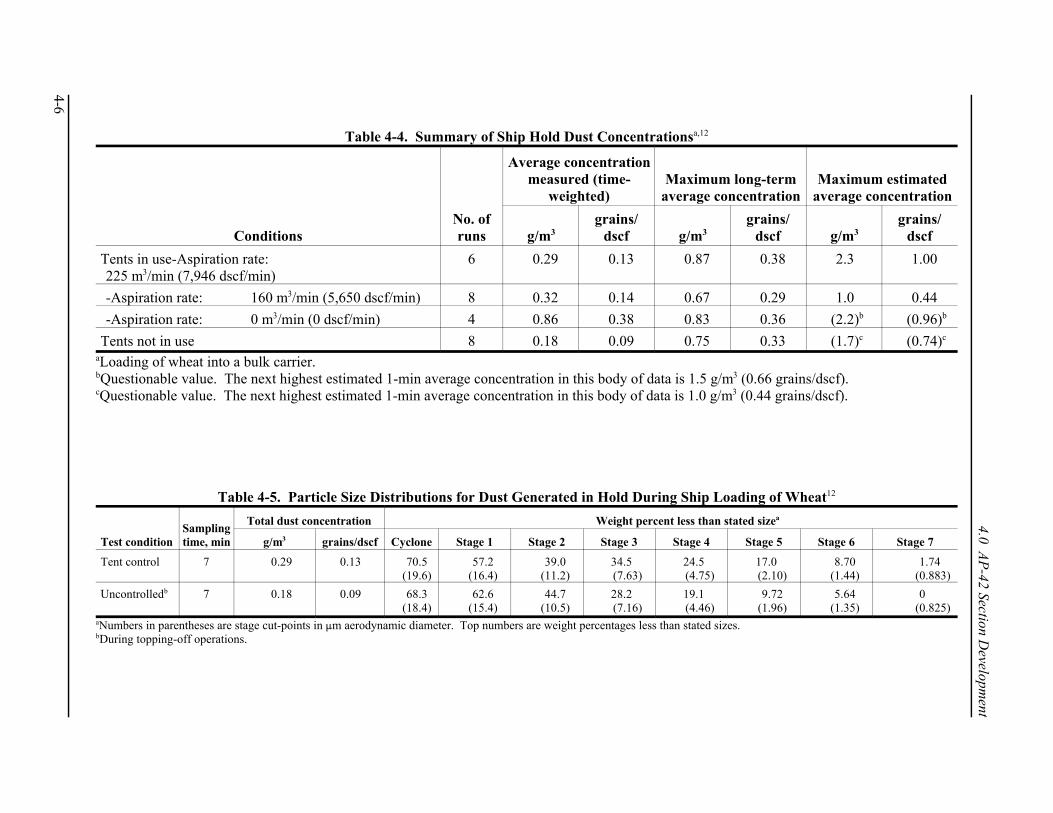
4-6
4.0 AP
-42 Section Developm
ent
Table 4-4. Summary of Ship Hold Dust Concentrationsa,12
ConditionsNo. ofruns
Average concentrationmeasured (time-
weighted)Maximum long-term
average concentrationMaximum estimated
average concentration
g/m3grains/
dscf g/m3grains/
dscf g/m3grains/
dscf
Tents in use-Aspiration rate:225 m3/min (7,946 dscf/min)
6 0.29 0.13 0.87 0.38 2.3 1.00
-Aspiration rate: 160 m3/min (5,650 dscf/min) 8 0.32 0.14 0.67 0.29 1.0 0.44
-Aspiration rate: 0 m3/min (0 dscf/min) 4 0.86 0.38 0.83 0.36 (2.2)b (0.96)b
Tents not in use 8 0.18 0.09 0.75 0.33 (1.7)c (0.74)c
aLoading of wheat into a bulk carrier.bQuestionable value. The next highest estimated 1-min average concentration in this body of data is 1.5 g/m3 (0.66 grains/dscf).cQuestionable value. The next highest estimated 1-min average concentration in this body of data is 1.0 g/m3 (0.44 grains/dscf).
Table 4-5. Particle Size Distributions for Dust Generated in Hold During Ship Loading of Wheat12
Test conditionSamplingtime, min
Total dust concentration Weight percent less than stated sizea
g/m3 grains/dscf Cyclone Stage 1 Stage 2 Stage 3 Stage 4 Stage 5 Stage 6 Stage 7
Tent control 7 0.29 0.13 70.5(19.6)
57.2(16.4)
39.0(11.2)
34.5(7.63)
24.5(4.75)
17.0(2.10)
8.70(1.44)
1.74(0.883)
Uncontrolledb 7 0.18 0.09 68.3(18.4)
62.6(15.4)
44.7(10.5)
28.2(7.16)
19.1(4.46)
9.72(1.96)
5.64(1.35)
0(0.825)
aNumbers in parentheses are stage cut-points in :m aerodynamic diameter. Top numbers are weight percentages less than stated sizes.bDuring topping-off operations.
4.0 AP-42 Section Development
4-7
The data contained in References 6, 10, and 12 were only minimally documented with noinformation provided on instrument calibration, gravimetric analysis of impactor catches, raw field data,etc. Also, in the case of the downwind fugitive measurements, single point sampling was generallyconducted to characterize the entire dust plume from the source. Because these data were collected usinga test methodology which no longer meets EPA acceptance, these data were not incorporated into theAP-42 section and are not discussed further in this report. Selected pages from all three reports areprovided in Appendix C.
4.1.3 Reference 11 (1979)
Reference 11 is a study of the fine particle emissions from a variety of source categories in theSouth Coast Air Basin (Los Angeles) sponsored by the California Air Resources Board (CARB). Two ofthe tests conducted in this study were of the uncontrolled emissions from a rice dryer and a carob roasterusing one or more types of series cyclone sampling trains that were designed for particle sizing (Joy trainand/or Source Assessment Sampling System or SASS). For each test, only one run using each train wasconducted in conjunction with these tests. Data on both particle size distribution and chemicalcomposition of the collected PM were obtained. Information obtained as a part of this AP-42 revisionindicates that rice properties have changed substantially over the past 20 years, and that these changeshave had a significant impact on the emission potential of rice dryers.50 Consequently, the rice dryer datain Reference 11 are considered unratable for purposes of AP-42 emission factor development, and are notused in the development of rice dryer emission factors. Selected pages from the report are retained inAppendix D for reference.
4.1.4 Reference 22 (1976)
Reference 22 is the report of PM compliance tests conducted at a country grain elevator in NorthDakota. Triplicate EPA Method 5 measured the emissions from cyclone dust collectors serving theheadhouse (internal grain handling) and two grain cleaners during the processing of wheat (assumedbased on the grain density of 770 kg/m3 [60-lb/bu]) provided in the report). The exact emission pointsincluded in the headhouse dust control system were not specified in the report, but analysis of the processdescription suggested that dust pick-up points were located at the truck dump, the legs, various belt transfer points, and the weigh scale system. Note that some systems of this type include the truck dumpand some do not. In older elevators, the capture/collection system for truck unloading was added laterand thus, is vented through a separate dust collector. A summary of the test results for the controlledemissions from the cyclones are shown below:
• Average headhouse emissions: 0.71 lb/hr = 0.0047 lb/ton150 ton/hr (0.0023 kg/Mg)
• Average Crippen cleaner emissions: 0.37 lb/hr = 0.029 lb/ton13 ton/hr (0.015 kg/Mg)
• Average Ideal cleaner emissions: 0.25 lb/hr = 0.0093 lb/ton27 ton/hr (0.0046 kg/Mg)
Reference 22 contained excellent documentation of the test protocol, results, raw data collected,and appropriate QA/QC. However, because insufficient data were available with respect to the composi-tion of the headhouse dust collection system to identify emission points with certainty, the dataheadhouse were given a B rating using the criteria specified in Section 3. The data for the cleaner testswere rated B because the grains processed were not specified. Applicable pages from the test report areprovided in Appendix F.
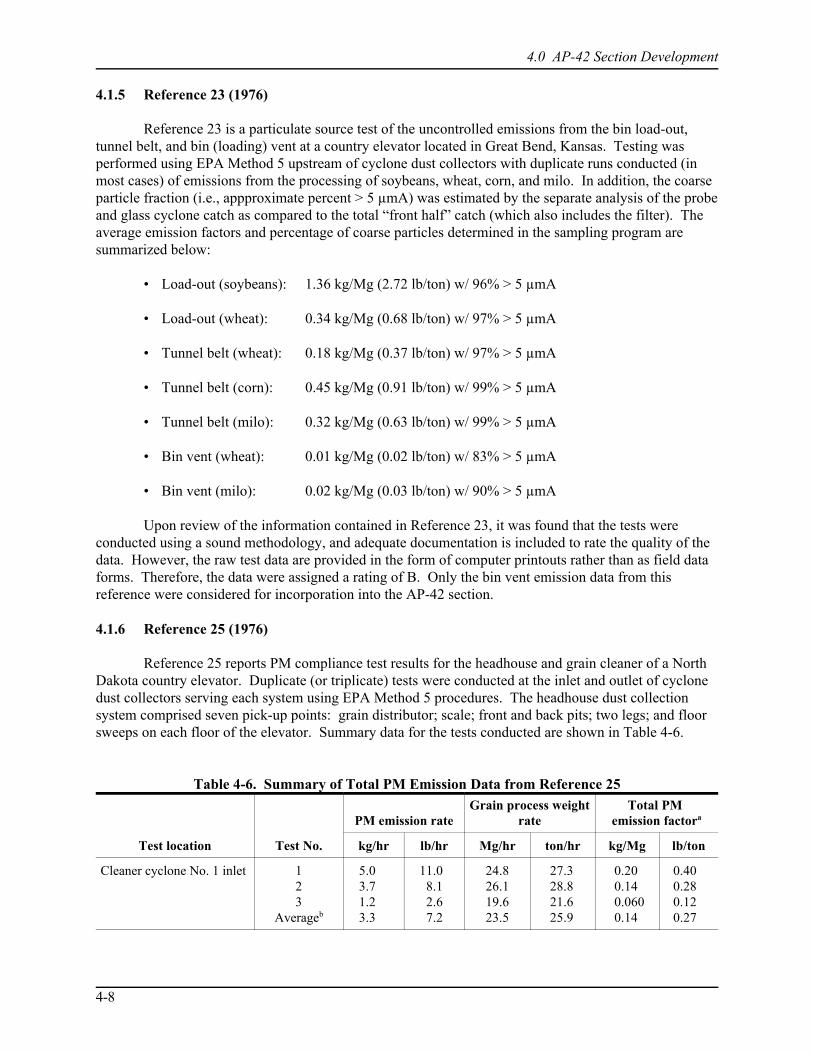
4.0 AP-42 Section Development
4-8
4.1.5 Reference 23 (1976)
Reference 23 is a particulate source test of the uncontrolled emissions from the bin load-out,tunnel belt, and bin (loading) vent at a country elevator located in Great Bend, Kansas. Testing wasperformed using EPA Method 5 upstream of cyclone dust collectors with duplicate runs conducted (inmost cases) of emissions from the processing of soybeans, wheat, corn, and milo. In addition, the coarseparticle fraction (i.e., appproximate percent > 5 µmA) was estimated by the separate analysis of the probeand glass cyclone catch as compared to the total “front half” catch (which also includes the filter). Theaverage emission factors and percentage of coarse particles determined in the sampling program aresummarized below:
• Load-out (soybeans): 1.36 kg/Mg (2.72 lb/ton) w/ 96% > 5 µmA
• Load-out (wheat): 0.34 kg/Mg (0.68 lb/ton) w/ 97% > 5 µmA
• Tunnel belt (wheat): 0.18 kg/Mg (0.37 lb/ton) w/ 97% > 5 µmA
• Tunnel belt (corn): 0.45 kg/Mg (0.91 lb/ton) w/ 99% > 5 µmA
• Tunnel belt (milo): 0.32 kg/Mg (0.63 lb/ton) w/ 99% > 5 µmA
• Bin vent (wheat): 0.01 kg/Mg (0.02 lb/ton) w/ 83% > 5 µmA
• Bin vent (milo): 0.02 kg/Mg (0.03 lb/ton) w/ 90% > 5 µmA
Upon review of the information contained in Reference 23, it was found that the tests wereconducted using a sound methodology, and adequate documentation is included to rate the quality of thedata. However, the raw test data are provided in the form of computer printouts rather than as field dataforms. Therefore, the data were assigned a rating of B. Only the bin vent emission data from thisreference were considered for incorporation into the AP-42 section.
4.1.6 Reference 25 (1976)
Reference 25 reports PM compliance test results for the headhouse and grain cleaner of a NorthDakota country elevator. Duplicate (or triplicate) tests were conducted at the inlet and outlet of cyclonedust collectors serving each system using EPA Method 5 procedures. The headhouse dust collectionsystem comprised seven pick-up points: grain distributor; scale; front and back pits; two legs; and floorsweeps on each floor of the elevator. Summary data for the tests conducted are shown in Table 4-6.
Table 4-6. Summary of Total PM Emission Data from Reference 25
Test location Test No.
PM emission rateGrain process weight
rateTotal PM
emission factora
kg/hr lb/hr Mg/hr ton/hr kg/Mg lb/ton
Cleaner cyclone No. 1 inlet 123
Averageb
5.03.71.23.3
11.08.12.67.2
24.826.119.623.5
27.328.821.625.9
0.200.140.0600.14
0.400.280.120.27
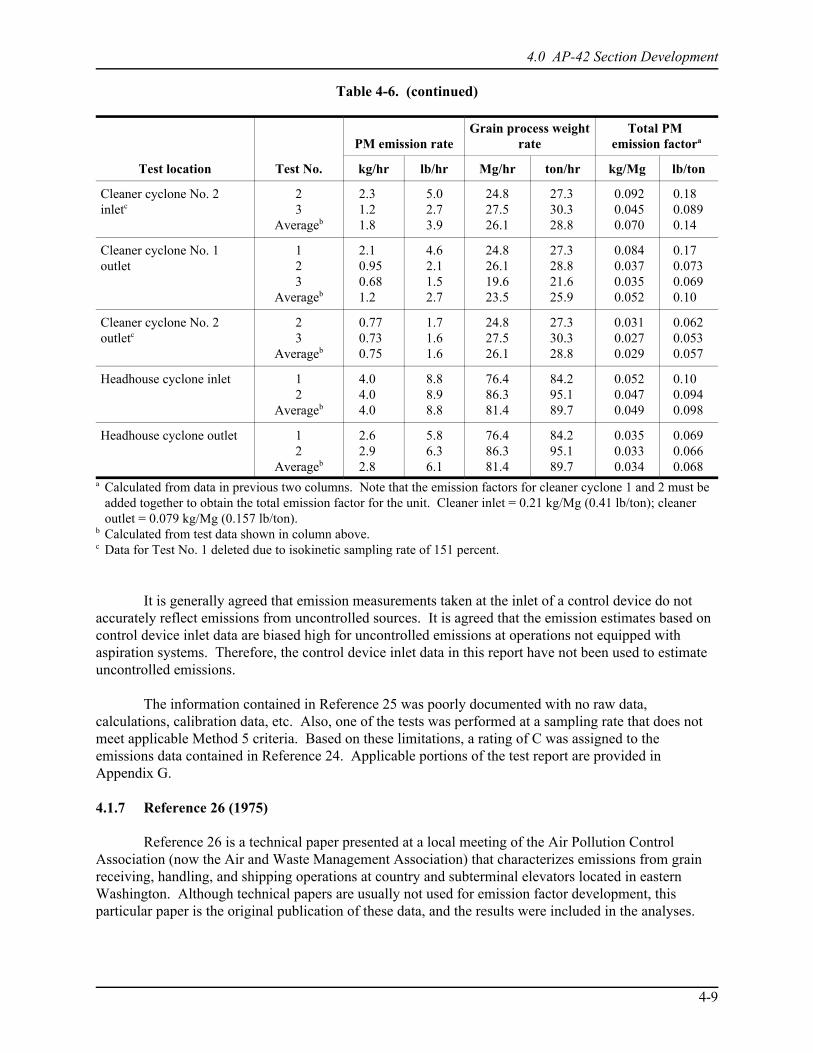
Table 4-6. (continued)
4.0 AP-42 Section Development
Test location Test No.
PM emission rateGrain process weight
rateTotal PM
emission factora
kg/hr lb/hr Mg/hr ton/hr kg/Mg lb/ton
4-9
Cleaner cyclone No. 2inletc
23
Averageb
2.31.21.8
5.02.73.9
24.827.526.1
27.330.328.8
0.0920.0450.070
0.180.0890.14
Cleaner cyclone No. 1outlet
123
Averageb
2.10.950.681.2
4.62.11.52.7
24.826.119.623.5
27.328.821.625.9
0.0840.0370.0350.052
0.170.0730.0690.10
Cleaner cyclone No. 2outletc
23
Averageb
0.770.730.75
1.71.61.6
24.827.526.1
27.330.328.8
0.0310.0270.029
0.0620.0530.057
Headhouse cyclone inlet 12
Averageb
4.04.04.0
8.88.98.8
76.486.381.4
84.295.189.7
0.0520.0470.049
0.100.0940.098
Headhouse cyclone outlet 12
Averageb
2.62.92.8
5.86.36.1
76.486.381.4
84.295.189.7
0.0350.0330.034
0.0690.0660.068
a Calculated from data in previous two columns. Note that the emission factors for cleaner cyclone 1 and 2 must beadded together to obtain the total emission factor for the unit. Cleaner inlet = 0.21 kg/Mg (0.41 lb/ton); cleaneroutlet = 0.079 kg/Mg (0.157 lb/ton).
b Calculated from test data shown in column above.c Data for Test No. 1 deleted due to isokinetic sampling rate of 151 percent.
It is generally agreed that emission measurements taken at the inlet of a control device do notaccurately reflect emissions from uncontrolled sources. It is agreed that the emission estimates based oncontrol device inlet data are biased high for uncontrolled emissions at operations not equipped withaspiration systems. Therefore, the control device inlet data in this report have not been used to estimateuncontrolled emissions.
The information contained in Reference 25 was poorly documented with no raw data,calculations, calibration data, etc. Also, one of the tests was performed at a sampling rate that does notmeet applicable Method 5 criteria. Based on these limitations, a rating of C was assigned to theemissions data contained in Reference 24. Applicable portions of the test report are provided inAppendix G.
4.1.7 Reference 26 (1975)
Reference 26 is a technical paper presented at a local meeting of the Air Pollution ControlAssociation (now the Air and Waste Management Association) that characterizes emissions from grainreceiving, handling, and shipping operations at country and subterminal elevators located in easternWashington. Although technical papers are usually not used for emission factor development, thisparticular paper is the original publication of these data, and the results were included in the analyses.
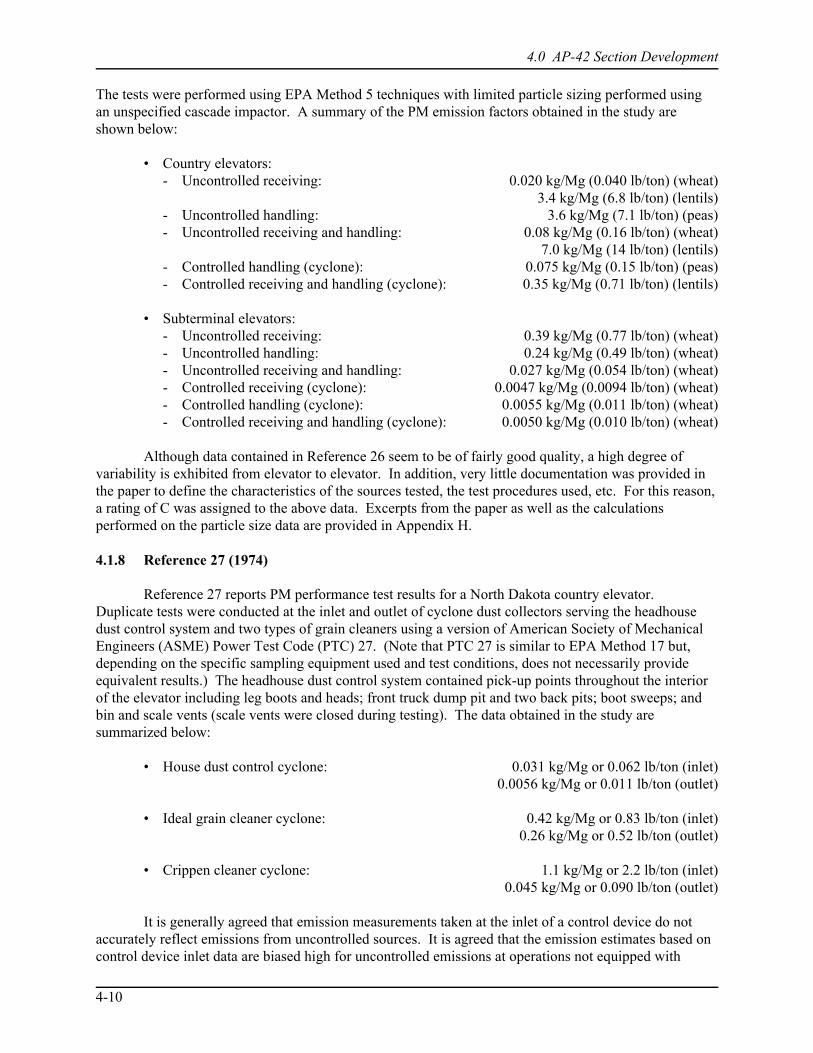
4.0 AP-42 Section Development
4-10
The tests were performed using EPA Method 5 techniques with limited particle sizing performed usingan unspecified cascade impactor. A summary of the PM emission factors obtained in the study areshown below:
• Country elevators:- Uncontrolled receiving: 0.020 kg/Mg (0.040 lb/ton) (wheat)
3.4 kg/Mg (6.8 lb/ton) (lentils)- Uncontrolled handling: 3.6 kg/Mg (7.1 lb/ton) (peas)- Uncontrolled receiving and handling: 0.08 kg/Mg (0.16 lb/ton) (wheat)
7.0 kg/Mg (14 lb/ton) (lentils)- Controlled handling (cyclone): 0.075 kg/Mg (0.15 lb/ton) (peas)- Controlled receiving and handling (cyclone): 0.35 kg/Mg (0.71 lb/ton) (lentils)
• Subterminal elevators:- Uncontrolled receiving: 0.39 kg/Mg (0.77 lb/ton) (wheat)- Uncontrolled handling: 0.24 kg/Mg (0.49 lb/ton) (wheat)- Uncontrolled receiving and handling: 0.027 kg/Mg (0.054 lb/ton) (wheat)- Controlled receiving (cyclone): 0.0047 kg/Mg (0.0094 lb/ton) (wheat)- Controlled handling (cyclone): 0.0055 kg/Mg (0.011 lb/ton) (wheat)- Controlled receiving and handling (cyclone): 0.0050 kg/Mg (0.010 lb/ton) (wheat)
Although data contained in Reference 26 seem to be of fairly good quality, a high degree ofvariability is exhibited from elevator to elevator. In addition, very little documentation was provided inthe paper to define the characteristics of the sources tested, the test procedures used, etc. For this reason,a rating of C was assigned to the above data. Excerpts from the paper as well as the calculationsperformed on the particle size data are provided in Appendix H.
4.1.8 Reference 27 (1974)
Reference 27 reports PM performance test results for a North Dakota country elevator. Duplicate tests were conducted at the inlet and outlet of cyclone dust collectors serving the headhousedust control system and two types of grain cleaners using a version of American Society of MechanicalEngineers (ASME) Power Test Code (PTC) 27. (Note that PTC 27 is similar to EPA Method 17 but,depending on the specific sampling equipment used and test conditions, does not necessarily provideequivalent results.) The headhouse dust control system contained pick-up points throughout the interiorof the elevator including leg boots and heads; front truck dump pit and two back pits; boot sweeps; andbin and scale vents (scale vents were closed during testing). The data obtained in the study aresummarized below:
• House dust control cyclone: 0.031 kg/Mg or 0.062 lb/ton (inlet)0.0056 kg/Mg or 0.011 lb/ton (outlet)
• Ideal grain cleaner cyclone: 0.42 kg/Mg or 0.83 lb/ton (inlet)0.26 kg/Mg or 0.52 lb/ton (outlet)
• Crippen cleaner cyclone: 1.1 kg/Mg or 2.2 lb/ton (inlet)0.045 kg/Mg or 0.090 lb/ton (outlet)
It is generally agreed that emission measurements taken at the inlet of a control device do notaccurately reflect emissions from uncontrolled sources. It is agreed that the emission estimates based oncontrol device inlet data are biased high for uncontrolled emissions at operations not equipped with
4.0 AP-42 Section Development
4-11
aspiration systems. Therefore, the control device inlet data in this report have not been used to estimateuncontrolled emissions.
The test results found in Reference 27 were found to be well documented and generally of goodquality. However, certain deficiencies were noted in respect to the lack of raw filter weights, instrumentcalibration records, type of grain processed, and the like. For these reasons, coupled with the fact that anonstandard test method (i.e., ASME PTC 27) was used to derive the emission rates, a rating of C wasassigned to the data in Reference 27. Applicable report excerpts and calculations are provided inAppendix I.
4.1.9 Reference 33 (1974)
Reference 33 reports source test results for an export terminal elevator in Seattle, Washington,conducted in support of New Source Performance Standards. Triplicate EPA Method 5 measurementswere conducted at the inlet and outlet of baghouse dust collectors controlling emissions from boxcarunloading and ship loading systems. Wheat was the only grain handled during testing. Single particlesizing runs were also attempted at each measurement location using a Brink five-stage cascade impactor. Because of the heavy loadings, particle sizing at the inlet of the shiploader baghouse was unsuccessful,so data are not provided for this measurement location. A summary of the particle sizing data is providedin Table 4-7.
Table 4-7. Particle Sizing Results from Reference 33a
Sampling locationImpactor cut-point, ::mAb
Cumulative weight percentless than stated cut-point
Boxcar dump baghouse inlet 2.401.420.970.510.33
20.09.32.72.72.7
Boxcar dump baghouse outlet 3.231.911.310.690.45
80.056.044.036.032.0
Ship loader baghouse outlet 3.281.941.330.710.46
10.61.0NilNilNil
a From page 11 of test report.b Cut-point is the characteristic particle diameter which represents the 50 percent
collection efficiency of each impactor stage for a constant flow rate through thesampler. Micrometers in aerodynamic diameter (equivalent unit density spheres).
It is generally agreed that emission measurements taken at the inlet of a control device do notaccurately reflect emissions from uncontrolled sources. It is agreed that the emission estimates based oncontrol device inlet data are biased high for uncontrolled emissions at operations not equipped with
4.0 AP-42 Section Development
4-12
aspiration systems. Therefore, the control device inlet data in this report have not been used to estimateuncontrolled emissions. In addition, the baghouse outlet data have not been used because the shiploadingoperations in this test are not expected to be representative of current shiploading practices.
The method used to determine particle size did not seem appropriate for control device inletemissions testing, as reflected in the generally poor sizing results. For the above reasons, a rating of Cwas assigned to the particle size data contained in Reference 33. Excerpts from the test report andapplicable calculations are shown in Appendix J.
4.1.10 Reference 35 (1974)
Reference 35 reports the results of PM source tests conducted by an EPA contractor at a largeexport terminal elevator located in Destrehan, Louisiana. Triplicate EPA Method 5 tests for bothfilterable and condensable PM were performed on the inlet and outlet of a baghouse dust collectorcontrolling emissions from a barge unloader (marine leg) during the processing of soybeans and corn. Two particle sizing runs were also performed on the baghouse outlet using a Brink Model BMS-11cascade impactor. (Note that the baghouse had a number of broken bags, which caused worst-caseemissions to be measured at this sampling location.) Only two of the Method 5 tests at the baghouseinlet were considered valid due to nonisokinetic sampling during Run No. 1.
It is generally agreed that emission measurements taken at the inlet of a control device do notaccurately reflect emissions from uncontrolled sources. It is agreed that the emission estimates based oncontrol device inlet data are biased high for uncontrolled emissions at operations not equipped withaspiration systems. Therefore, the control device inlet data in this report have not been used to estimateuncontrolled emissions. These tests were conducted using a generally sound methodology with adequatedocumentation of the test methods and results. However, the outlet data are not representative of awell-operated and maintained baghouse collector. Selected pages from the test report were retained inAppendix K for reference.
4.1.11 Reference 36 (1973)
Reference 36 is the report of an engineering and cost study for grain and feed operations. Thedocument contains survey information from a variety of public and private sources on emissions fromgrain elevators, feed mills, and grain processing plants of various types. Normally such studies are notused to develop AP-42 emission factors because no original data are provided.
For a survey-type report, the test data presented are reasonably documented with explanationsprovided in the text regarding the general source of the data, the test method(s) used, etc. However, theorigin of many data sets is not clearly identified, nor are the data publicly accessible. Therefore, theinformation was used with caution in developing candidate emission factors and only in limited cases toimprove the quality of the emission estimates developed. A rating of D was assigned to any dataobtained from Reference 36. Applicable portions of the document, as well as calculations performed onthe data, are included in Appendix L.
4.1.12 Reference 37 (1973)
Reference 37 reports results from a PM source test conducted by an EPA contractor at a grainand feed mill located in Portland, Oregon. Triplicate EPA Method 5 tests were conducted on the outletof a baghouse controlling emissions from a hammermill processing a combination of oats, barley, alfalfa,and corn. Quadruplicate runs were also conducted in the study using a high volume stack sampler
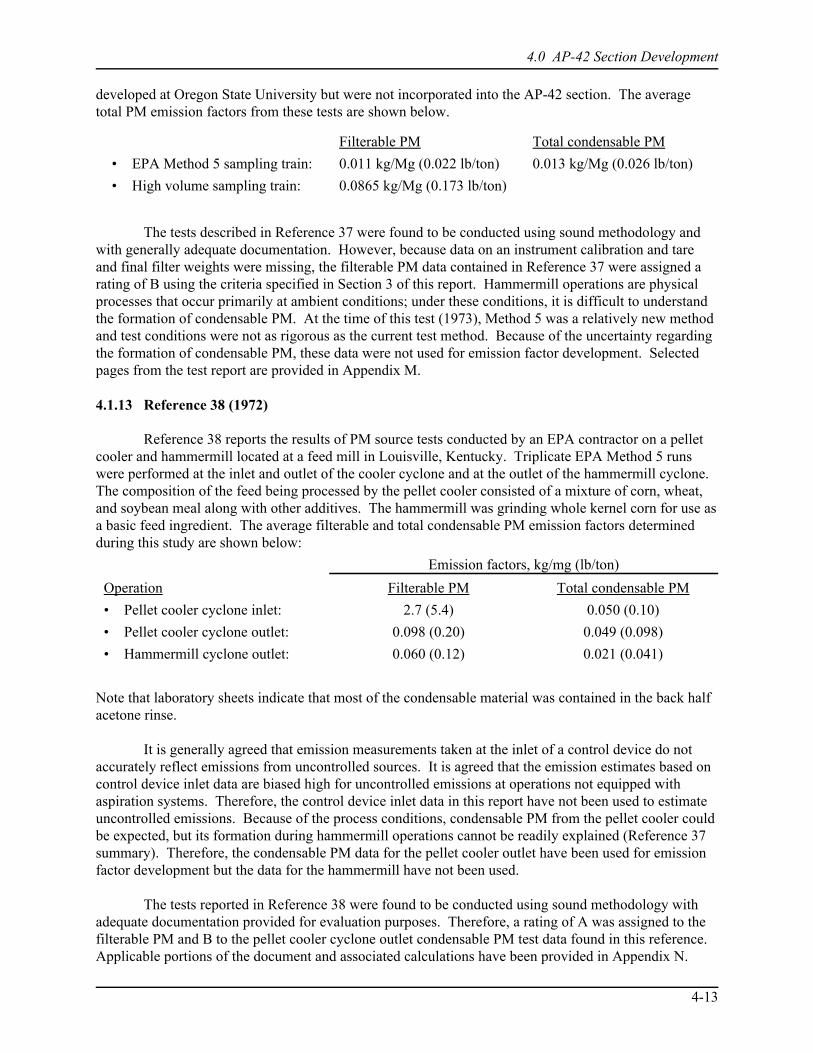
4.0 AP-42 Section Development
4-13
Filterable PM Total condensable PM
• EPA Method 5 sampling train: 0.011 kg/Mg (0.022 lb/ton) 0.013 kg/Mg (0.026 lb/ton)
• High volume sampling train: 0.0865 kg/Mg (0.173 lb/ton)
Emission factors, kg/mg (lb/ton)
Operation Filterable PM Total condensable PM
• Pellet cooler cyclone inlet: 2.7 (5.4) 0.050 (0.10)
• Pellet cooler cyclone outlet: 0.098 (0.20) 0.049 (0.098)
• Hammermill cyclone outlet: 0.060 (0.12) 0.021 (0.041)
developed at Oregon State University but were not incorporated into the AP-42 section. The averagetotal PM emission factors from these tests are shown below.
The tests described in Reference 37 were found to be conducted using sound methodology andwith generally adequate documentation. However, because data on an instrument calibration and tareand final filter weights were missing, the filterable PM data contained in Reference 37 were assigned arating of B using the criteria specified in Section 3 of this report. Hammermill operations are physicalprocesses that occur primarily at ambient conditions; under these conditions, it is difficult to understandthe formation of condensable PM. At the time of this test (1973), Method 5 was a relatively new methodand test conditions were not as rigorous as the current test method. Because of the uncertainty regardingthe formation of condensable PM, these data were not used for emission factor development. Selectedpages from the test report are provided in Appendix M.
4.1.13 Reference 38 (1972)
Reference 38 reports the results of PM source tests conducted by an EPA contractor on a pelletcooler and hammermill located at a feed mill in Louisville, Kentucky. Triplicate EPA Method 5 runswere performed at the inlet and outlet of the cooler cyclone and at the outlet of the hammermill cyclone. The composition of the feed being processed by the pellet cooler consisted of a mixture of corn, wheat,and soybean meal along with other additives. The hammermill was grinding whole kernel corn for use asa basic feed ingredient. The average filterable and total condensable PM emission factors determinedduring this study are shown below:
Note that laboratory sheets indicate that most of the condensable material was contained in the back halfacetone rinse.
It is generally agreed that emission measurements taken at the inlet of a control device do notaccurately reflect emissions from uncontrolled sources. It is agreed that the emission estimates based oncontrol device inlet data are biased high for uncontrolled emissions at operations not equipped withaspiration systems. Therefore, the control device inlet data in this report have not been used to estimateuncontrolled emissions. Because of the process conditions, condensable PM from the pellet cooler couldbe expected, but its formation during hammermill operations cannot be readily explained (Reference 37summary). Therefore, the condensable PM data for the pellet cooler outlet have been used for emissionfactor development but the data for the hammermill have not been used.
The tests reported in Reference 38 were found to be conducted using sound methodology withadequate documentation provided for evaluation purposes. Therefore, a rating of A was assigned to thefilterable PM and B to the pellet cooler cyclone outlet condensable PM test data found in this reference. Applicable portions of the document and associated calculations have been provided in Appendix N.
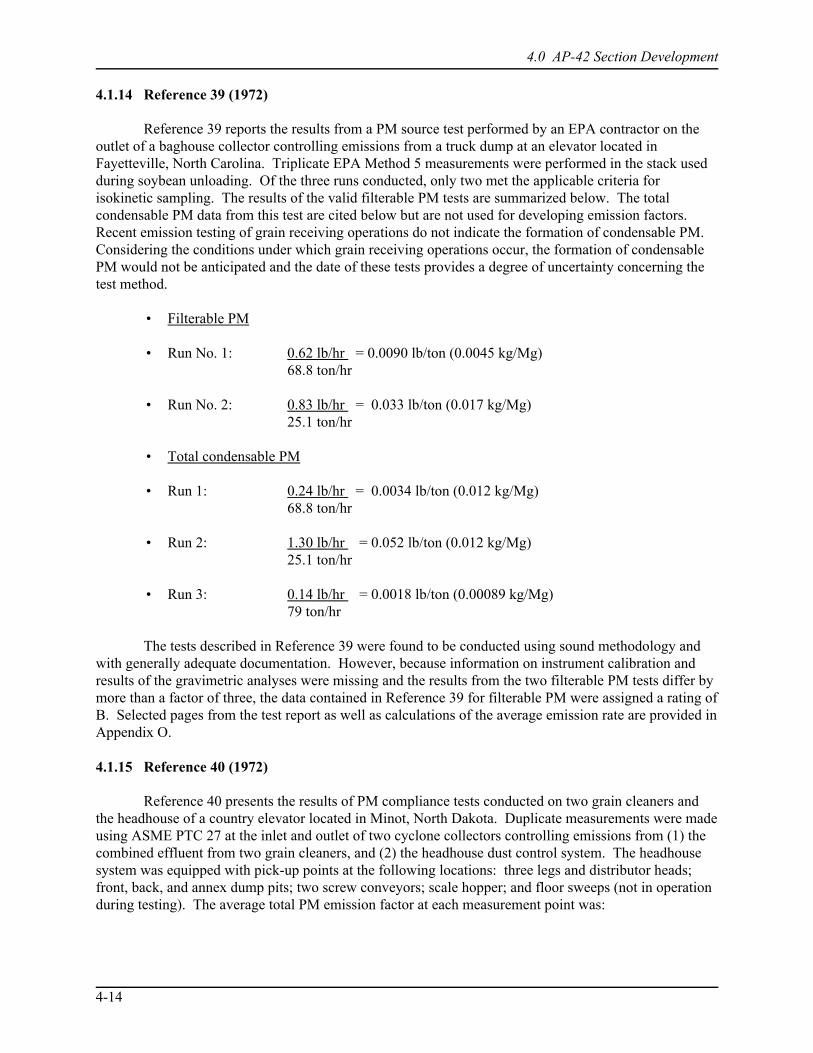
4.0 AP-42 Section Development
4-14
4.1.14 Reference 39 (1972)
Reference 39 reports the results from a PM source test performed by an EPA contractor on theoutlet of a baghouse collector controlling emissions from a truck dump at an elevator located inFayetteville, North Carolina. Triplicate EPA Method 5 measurements were performed in the stack usedduring soybean unloading. Of the three runs conducted, only two met the applicable criteria forisokinetic sampling. The results of the valid filterable PM tests are summarized below. The totalcondensable PM data from this test are cited below but are not used for developing emission factors. Recent emission testing of grain receiving operations do not indicate the formation of condensable PM. Considering the conditions under which grain receiving operations occur, the formation of condensablePM would not be anticipated and the date of these tests provides a degree of uncertainty concerning thetest method.
• Filterable PM
• Run No. 1: 0.62 lb/hr = 0.0090 lb/ton (0.0045 kg/Mg)68.8 ton/hr
• Run No. 2: 0.83 lb/hr = 0.033 lb/ton (0.017 kg/Mg)25.1 ton/hr
• Total condensable PM
• Run 1: 0.24 lb/hr = 0.0034 lb/ton (0.012 kg/Mg)68.8 ton/hr
• Run 2: 1.30 lb/hr = 0.052 lb/ton (0.012 kg/Mg)25.1 ton/hr
• Run 3: 0.14 lb/hr = 0.0018 lb/ton (0.00089 kg/Mg)79 ton/hr
The tests described in Reference 39 were found to be conducted using sound methodology andwith generally adequate documentation. However, because information on instrument calibration andresults of the gravimetric analyses were missing and the results from the two filterable PM tests differ bymore than a factor of three, the data contained in Reference 39 for filterable PM were assigned a rating ofB. Selected pages from the test report as well as calculations of the average emission rate are provided inAppendix O.
4.1.15 Reference 40 (1972)
Reference 40 presents the results of PM compliance tests conducted on two grain cleaners andthe headhouse of a country elevator located in Minot, North Dakota. Duplicate measurements were madeusing ASME PTC 27 at the inlet and outlet of two cyclone collectors controlling emissions from (1) thecombined effluent from two grain cleaners, and (2) the headhouse dust control system. The headhousesystem was equipped with pick-up points at the following locations: three legs and distributor heads;front, back, and annex dump pits; two screw conveyors; scale hopper; and floor sweeps (not in operationduring testing). The average total PM emission factor at each measurement point was:
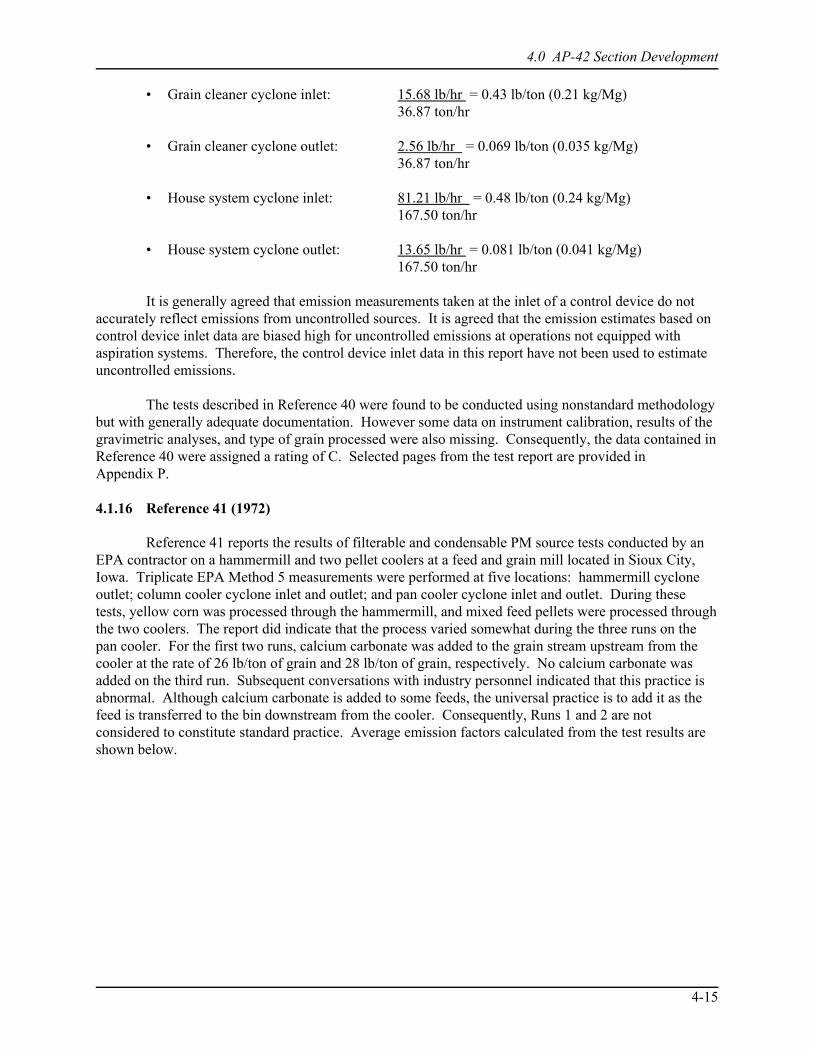
4.0 AP-42 Section Development
4-15
• Grain cleaner cyclone inlet: 15.68 lb/hr = 0.43 lb/ton (0.21 kg/Mg)36.87 ton/hr
• Grain cleaner cyclone outlet: 2.56 lb/hr = 0.069 lb/ton (0.035 kg/Mg)36.87 ton/hr
• House system cyclone inlet: 81.21 lb/hr = 0.48 lb/ton (0.24 kg/Mg) 167.50 ton/hr
• House system cyclone outlet: 13.65 lb/hr = 0.081 lb/ton (0.041 kg/Mg)167.50 ton/hr
It is generally agreed that emission measurements taken at the inlet of a control device do notaccurately reflect emissions from uncontrolled sources. It is agreed that the emission estimates based oncontrol device inlet data are biased high for uncontrolled emissions at operations not equipped withaspiration systems. Therefore, the control device inlet data in this report have not been used to estimateuncontrolled emissions.
The tests described in Reference 40 were found to be conducted using nonstandard methodologybut with generally adequate documentation. However some data on instrument calibration, results of thegravimetric analyses, and type of grain processed were also missing. Consequently, the data contained inReference 40 were assigned a rating of C. Selected pages from the test report are provided inAppendix P.
4.1.16 Reference 41 (1972)
Reference 41 reports the results of filterable and condensable PM source tests conducted by anEPA contractor on a hammermill and two pellet coolers at a feed and grain mill located in Sioux City,Iowa. Triplicate EPA Method 5 measurements were performed at five locations: hammermill cycloneoutlet; column cooler cyclone inlet and outlet; and pan cooler cyclone inlet and outlet. During thesetests, yellow corn was processed through the hammermill, and mixed feed pellets were processed throughthe two coolers. The report did indicate that the process varied somewhat during the three runs on thepan cooler. For the first two runs, calcium carbonate was added to the grain stream upstream from thecooler at the rate of 26 lb/ton of grain and 28 lb/ton of grain, respectively. No calcium carbonate wasadded on the third run. Subsequent conversations with industry personnel indicated that this practice isabnormal. Although calcium carbonate is added to some feeds, the universal practice is to add it as thefeed is transferred to the bin downstream from the cooler. Consequently, Runs 1 and 2 are notconsidered to constitute standard practice. Average emission factors calculated from the test results areshown below.
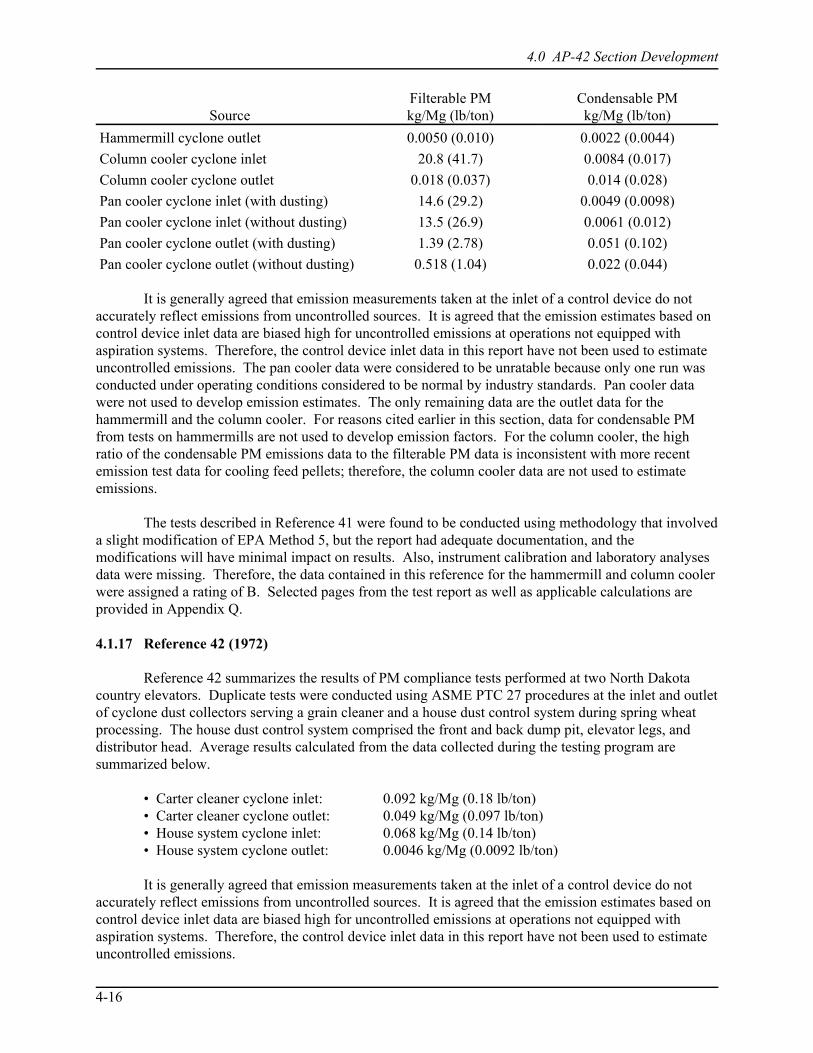
4.0 AP-42 Section Development
4-16
SourceFilterable PMkg/Mg (lb/ton)
Condensable PMkg/Mg (lb/ton)
Hammermill cyclone outlet 0.0050 (0.010) 0.0022 (0.0044)
Column cooler cyclone inlet 20.8 (41.7) 0.0084 (0.017)
Column cooler cyclone outlet 0.018 (0.037) 0.014 (0.028)
Pan cooler cyclone inlet (with dusting) 14.6 (29.2) 0.0049 (0.0098)
Pan cooler cyclone inlet (without dusting) 13.5 (26.9) 0.0061 (0.012)
Pan cooler cyclone outlet (with dusting) 1.39 (2.78) 0.051 (0.102)
Pan cooler cyclone outlet (without dusting) 0.518 (1.04) 0.022 (0.044)
It is generally agreed that emission measurements taken at the inlet of a control device do notaccurately reflect emissions from uncontrolled sources. It is agreed that the emission estimates based oncontrol device inlet data are biased high for uncontrolled emissions at operations not equipped withaspiration systems. Therefore, the control device inlet data in this report have not been used to estimateuncontrolled emissions. The pan cooler data were considered to be unratable because only one run wasconducted under operating conditions considered to be normal by industry standards. Pan cooler datawere not used to develop emission estimates. The only remaining data are the outlet data for thehammermill and the column cooler. For reasons cited earlier in this section, data for condensable PMfrom tests on hammermills are not used to develop emission factors. For the column cooler, the highratio of the condensable PM emissions data to the filterable PM data is inconsistent with more recentemission test data for cooling feed pellets; therefore, the column cooler data are not used to estimateemissions.
The tests described in Reference 41 were found to be conducted using methodology that involveda slight modification of EPA Method 5, but the report had adequate documentation, and themodifications will have minimal impact on results. Also, instrument calibration and laboratory analysesdata were missing. Therefore, the data contained in this reference for the hammermill and column coolerwere assigned a rating of B. Selected pages from the test report as well as applicable calculations areprovided in Appendix Q.
4.1.17 Reference 42 (1972)
Reference 42 summarizes the results of PM compliance tests performed at two North Dakotacountry elevators. Duplicate tests were conducted using ASME PTC 27 procedures at the inlet and outletof cyclone dust collectors serving a grain cleaner and a house dust control system during spring wheatprocessing. The house dust control system comprised the front and back dump pit, elevator legs, anddistributor head. Average results calculated from the data collected during the testing program aresummarized below.
• Carter cleaner cyclone inlet: 0.092 kg/Mg (0.18 lb/ton)• Carter cleaner cyclone outlet: 0.049 kg/Mg (0.097 lb/ton)• House system cyclone inlet: 0.068 kg/Mg (0.14 lb/ton)• House system cyclone outlet: 0.0046 kg/Mg (0.0092 lb/ton)
It is generally agreed that emission measurements taken at the inlet of a control device do notaccurately reflect emissions from uncontrolled sources. It is agreed that the emission estimates based oncontrol device inlet data are biased high for uncontrolled emissions at operations not equipped withaspiration systems. Therefore, the control device inlet data in this report have not been used to estimateuncontrolled emissions.
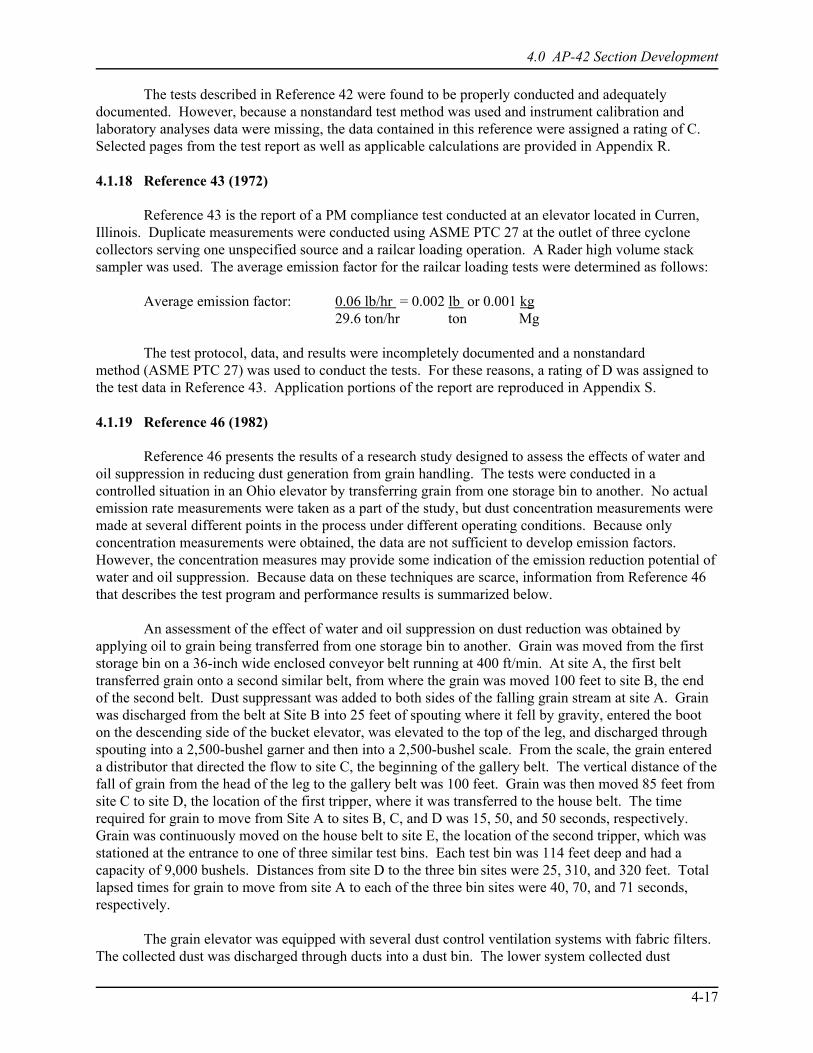
4.0 AP-42 Section Development
4-17
The tests described in Reference 42 were found to be properly conducted and adequatelydocumented. However, because a nonstandard test method was used and instrument calibration andlaboratory analyses data were missing, the data contained in this reference were assigned a rating of C. Selected pages from the test report as well as applicable calculations are provided in Appendix R.
4.1.18 Reference 43 (1972)
Reference 43 is the report of a PM compliance test conducted at an elevator located in Curren,Illinois. Duplicate measurements were conducted using ASME PTC 27 at the outlet of three cyclonecollectors serving one unspecified source and a railcar loading operation. A Rader high volume stacksampler was used. The average emission factor for the railcar loading tests were determined as follows:
Average emission factor: 0.06 lb/hr = 0.002 lb or 0.001 kg29.6 ton/hr ton Mg
The test protocol, data, and results were incompletely documented and a nonstandardmethod (ASME PTC 27) was used to conduct the tests. For these reasons, a rating of D was assigned tothe test data in Reference 43. Application portions of the report are reproduced in Appendix S.
4.1.19 Reference 46 (1982)
Reference 46 presents the results of a research study designed to assess the effects of water andoil suppression in reducing dust generation from grain handling. The tests were conducted in acontrolled situation in an Ohio elevator by transferring grain from one storage bin to another. No actualemission rate measurements were taken as a part of the study, but dust concentration measurements weremade at several different points in the process under different operating conditions. Because onlyconcentration measurements were obtained, the data are not sufficient to develop emission factors. However, the concentration measures may provide some indication of the emission reduction potential ofwater and oil suppression. Because data on these techniques are scarce, information from Reference 46that describes the test program and performance results is summarized below.
An assessment of the effect of water and oil suppression on dust reduction was obtained byapplying oil to grain being transferred from one storage bin to another. Grain was moved from the firststorage bin on a 36-inch wide enclosed conveyor belt running at 400 ft/min. At site A, the first belttransferred grain onto a second similar belt, from where the grain was moved 100 feet to site B, the endof the second belt. Dust suppressant was added to both sides of the falling grain stream at site A. Grainwas discharged from the belt at Site B into 25 feet of spouting where it fell by gravity, entered the booton the descending side of the bucket elevator, was elevated to the top of the leg, and discharged throughspouting into a 2,500-bushel garner and then into a 2,500-bushel scale. From the scale, the grain entereda distributor that directed the flow to site C, the beginning of the gallery belt. The vertical distance of thefall of grain from the head of the leg to the gallery belt was 100 feet. Grain was then moved 85 feet fromsite C to site D, the location of the first tripper, where it was transferred to the house belt. The timerequired for grain to move from Site A to sites B, C, and D was 15, 50, and 50 seconds, respectively. Grain was continuously moved on the house belt to site E, the location of the second tripper, which wasstationed at the entrance to one of three similar test bins. Each test bin was 114 feet deep and had acapacity of 9,000 bushels. Distances from site D to the three bin sites were 25, 310, and 320 feet. Totallapsed times for grain to move from site A to each of the three bin sites were 40, 70, and 71 seconds,respectively.
The grain elevator was equipped with several dust control ventilation systems with fabric filters. The collected dust was discharged through ducts into a dust bin. The lower system collected dust
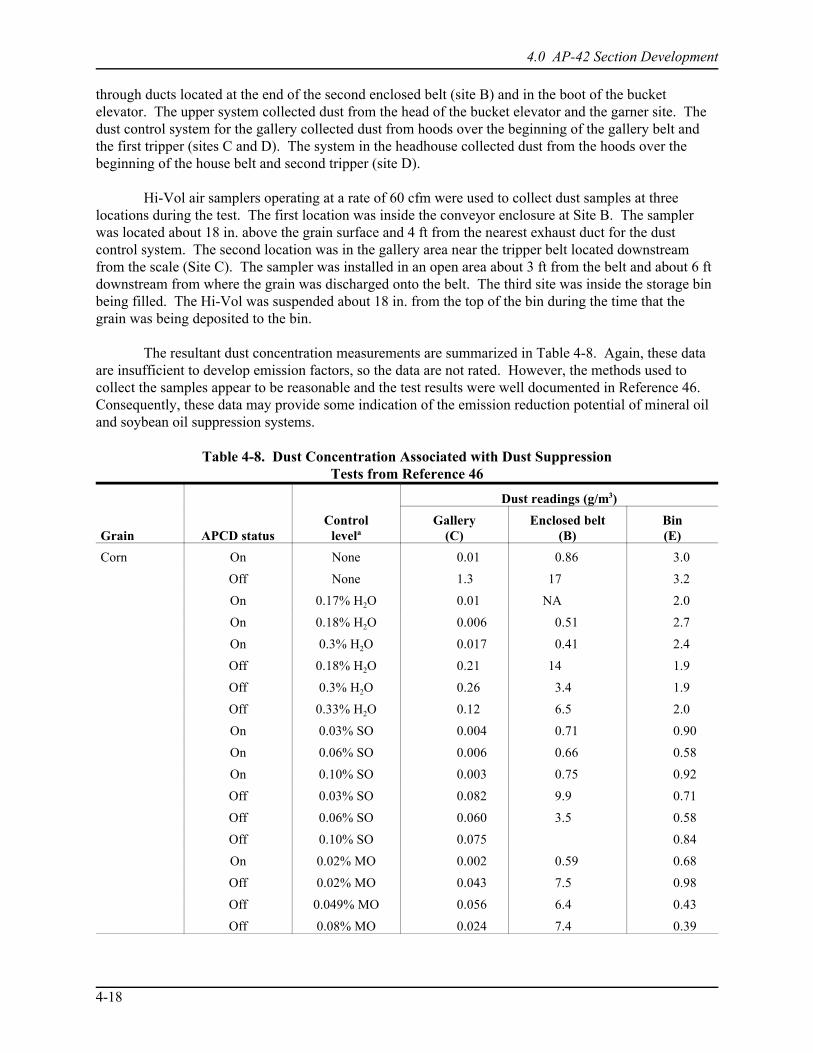
4.0 AP-42 Section Development
4-18
through ducts located at the end of the second enclosed belt (site B) and in the boot of the bucketelevator. The upper system collected dust from the head of the bucket elevator and the garner site. Thedust control system for the gallery collected dust from hoods over the beginning of the gallery belt andthe first tripper (sites C and D). The system in the headhouse collected dust from the hoods over thebeginning of the house belt and second tripper (site D).
Hi-Vol air samplers operating at a rate of 60 cfm were used to collect dust samples at threelocations during the test. The first location was inside the conveyor enclosure at Site B. The samplerwas located about 18 in. above the grain surface and 4 ft from the nearest exhaust duct for the dustcontrol system. The second location was in the gallery area near the tripper belt located downstreamfrom the scale (Site C). The sampler was installed in an open area about 3 ft from the belt and about 6 ftdownstream from where the grain was discharged onto the belt. The third site was inside the storage binbeing filled. The Hi-Vol was suspended about 18 in. from the top of the bin during the time that thegrain was being deposited to the bin.
The resultant dust concentration measurements are summarized in Table 4-8. Again, these dataare insufficient to develop emission factors, so the data are not rated. However, the methods used tocollect the samples appear to be reasonable and the test results were well documented in Reference 46. Consequently, these data may provide some indication of the emission reduction potential of mineral oiland soybean oil suppression systems.
Table 4-8. Dust Concentration Associated with Dust SuppressionTests from Reference 46
Grain APCD statusControl
levela
Dust readings (g/m3)
Gallery(C)
Enclosed belt(B)
Bin(E)
Corn On None 0.01 0.86 3.0
Off None 1.3 17 3.2
On 0.17% H2O 0.01 NA 2.0
On 0.18% H2O 0.006 0.51 2.7
On 0.3% H2O 0.017 0.41 2.4
Off 0.18% H2O 0.21 14 1.9
Off 0.3% H2O 0.26 3.4 1.9
Off 0.33% H2O 0.12 6.5 2.0
On 0.03% SO 0.004 0.71 0.90
On 0.06% SO 0.006 0.66 0.58
On 0.10% SO 0.003 0.75 0.92
Off 0.03% SO 0.082 9.9 0.71
Off 0.06% SO 0.060 3.5 0.58
Off 0.10% SO 0.075 0.84
On 0.02% MO 0.002 0.59 0.68
Off 0.02% MO 0.043 7.5 0.98
Off 0.049% MO 0.056 6.4 0.43
Off 0.08% MO 0.024 7.4 0.39
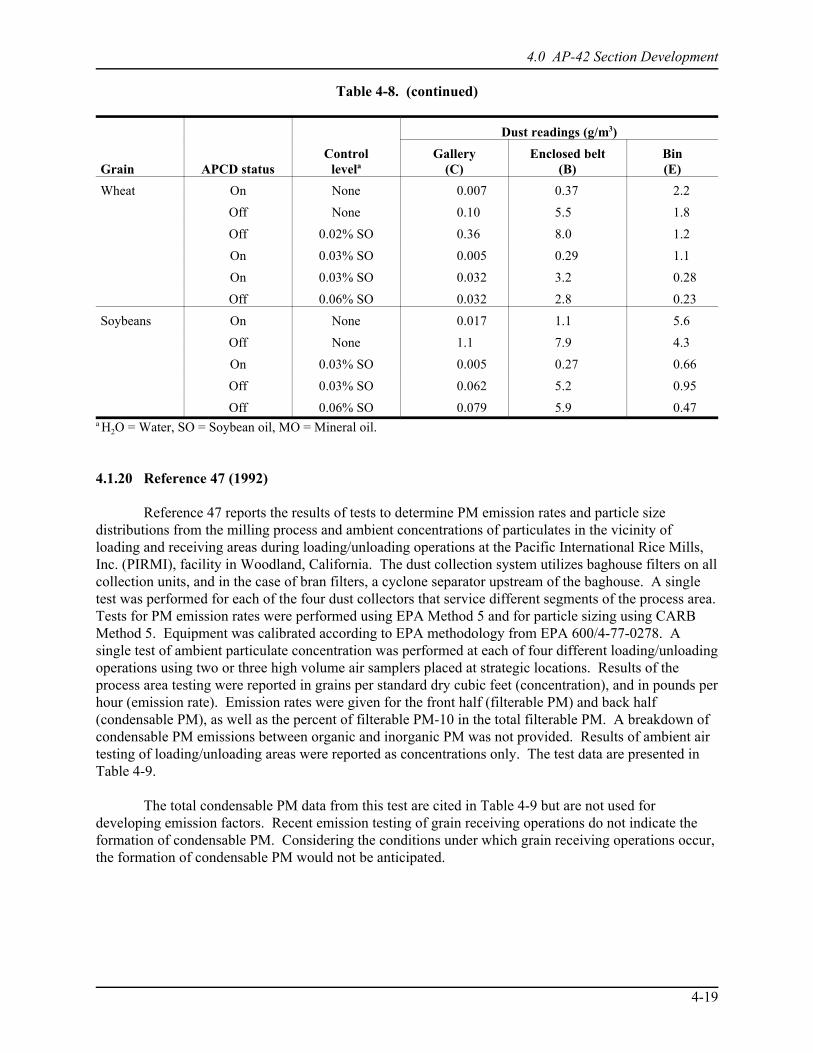
Table 4-8. (continued)
4.0 AP-42 Section Development
Grain APCD statusControl
levela
Dust readings (g/m3)
Gallery(C)
Enclosed belt(B)
Bin(E)
4-19
Wheat On None 0.007 0.37 2.2
Off None 0.10 5.5 1.8
Off 0.02% SO 0.36 8.0 1.2
On 0.03% SO 0.005 0.29 1.1
On 0.03% SO 0.032 3.2 0.28
Off 0.06% SO 0.032 2.8 0.23
Soybeans On None 0.017 1.1 5.6
Off None 1.1 7.9 4.3
On 0.03% SO 0.005 0.27 0.66
Off 0.03% SO 0.062 5.2 0.95
Off 0.06% SO 0.079 5.9 0.47a H2O = Water, SO = Soybean oil, MO = Mineral oil.
4.1.20 Reference 47 (1992)
Reference 47 reports the results of tests to determine PM emission rates and particle sizedistributions from the milling process and ambient concentrations of particulates in the vicinity ofloading and receiving areas during loading/unloading operations at the Pacific International Rice Mills,Inc. (PIRMI), facility in Woodland, California. The dust collection system utilizes baghouse filters on allcollection units, and in the case of bran filters, a cyclone separator upstream of the baghouse. A singletest was performed for each of the four dust collectors that service different segments of the process area. Tests for PM emission rates were performed using EPA Method 5 and for particle sizing using CARBMethod 5. Equipment was calibrated according to EPA methodology from EPA 600/4-77-0278. Asingle test of ambient particulate concentration was performed at each of four different loading/unloadingoperations using two or three high volume air samplers placed at strategic locations. Results of theprocess area testing were reported in grains per standard dry cubic feet (concentration), and in pounds perhour (emission rate). Emission rates were given for the front half (filterable PM) and back half(condensable PM), as well as the percent of filterable PM-10 in the total filterable PM. A breakdown ofcondensable PM emissions between organic and inorganic PM was not provided. Results of ambient airtesting of loading/unloading areas were reported as concentrations only. The test data are presented inTable 4-9.
The total condensable PM data from this test are cited in Table 4-9 but are not used fordeveloping emission factors. Recent emission testing of grain receiving operations do not indicate theformation of condensable PM. Considering the conditions under which grain receiving operations occur,the formation of condensable PM would not be anticipated.
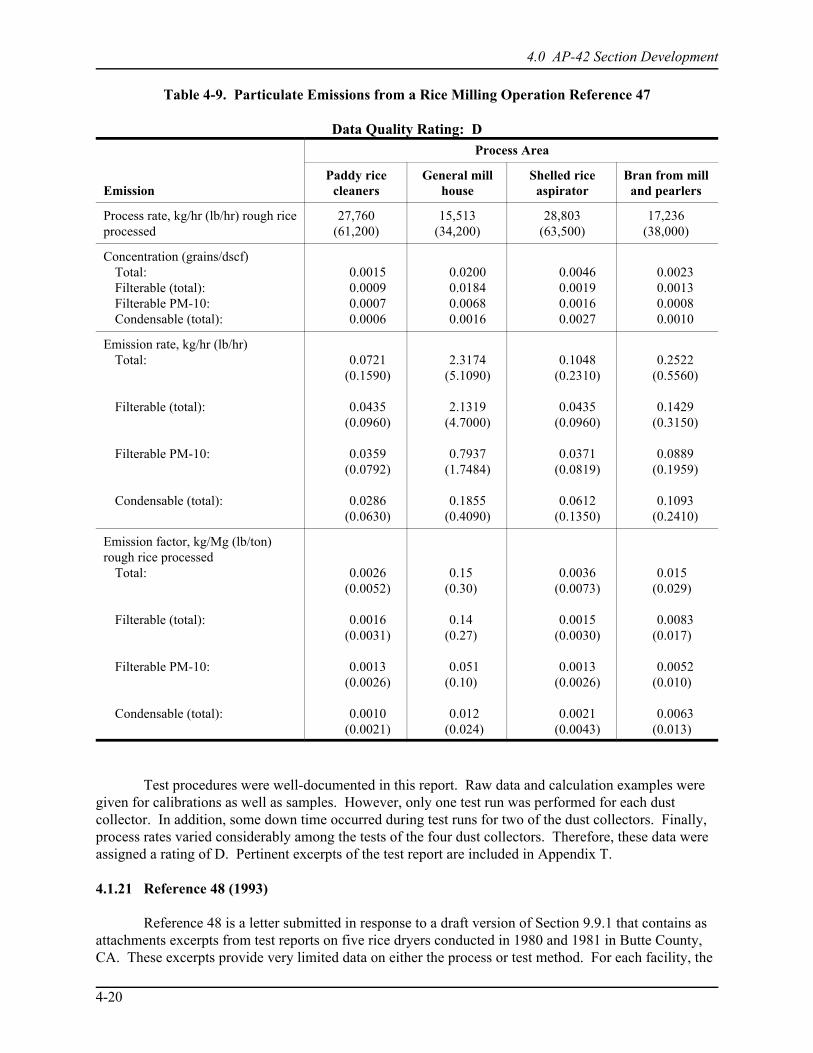
4.0 AP-42 Section Development
4-20
Table 4-9. Particulate Emissions from a Rice Milling Operation Reference 47
Data Quality Rating: D
Emission
Process Area
Paddy ricecleaners
General millhouse
Shelled riceaspirator
Bran from milland pearlers
Process rate, kg/hr (lb/hr) rough riceprocessed
27,760(61,200)
15,513(34,200)
28,803(63,500)
17,236(38,000)
Concentration (grains/dscf)Total:Filterable (total):Filterable PM-10:Condensable (total):
0.00150.00090.00070.0006
0.02000.01840.00680.0016
0.00460.00190.00160.0027
0.00230.00130.00080.0010
Emission rate, kg/hr (lb/hr)Total:
Filterable (total):
Filterable PM-10:
Condensable (total):
0.0721(0.1590)
0.0435(0.0960)
0.0359(0.0792)
0.0286(0.0630)
2.3174(5.1090)
2.1319(4.7000)
0.7937(1.7484)
0.1855(0.4090)
0.1048(0.2310)
0.0435(0.0960)
0.0371(0.0819)
0.0612(0.1350)
0.2522(0.5560)
0.1429(0.3150)
0.0889(0.1959)
0.1093(0.2410)
Emission factor, kg/Mg (lb/ton)rough rice processed
Total:
Filterable (total):
Filterable PM-10:
Condensable (total):
0.0026(0.0052)
0.0016(0.0031)
0.0013(0.0026)
0.0010(0.0021)
0.15(0.30)
0.14(0.27)
0.051(0.10)
0.012(0.024)
0.0036(0.0073)
0.0015(0.0030)
0.0013(0.0026)
0.0021(0.0043)
0.015(0.029)
0.0083(0.017)
0.0052(0.010)
0.0063(0.013)
Test procedures were well-documented in this report. Raw data and calculation examples weregiven for calibrations as well as samples. However, only one test run was performed for each dustcollector. In addition, some down time occurred during test runs for two of the dust collectors. Finally,process rates varied considerably among the tests of the four dust collectors. Therefore, these data wereassigned a rating of D. Pertinent excerpts of the test report are included in Appendix T.
4.1.21 Reference 48 (1993)
Reference 48 is a letter submitted in response to a draft version of Section 9.9.1 that contains asattachments excerpts from test reports on five rice dryers conducted in 1980 and 1981 in Butte County,CA. These excerpts provide very limited data on either the process or test method. For each facility, the

4.0 AP-42 Section Development
4-21
type of dryer is identified, the process rate is given in a summary table, and a schematic of the test train isprovided; no other information on process operations or test methods is presented. Based on thestructure of the test train, the two-run tests appear to have been conducted using a Hi Vol method, butdocumentation is lacking. However, full traverses do not appear to have been conducted on all tests, andthe methods used to determine volumetric flows cannot be determined.
Typically data with such sparse documentation would not be used to develop AP-42 emissionfactors. However, because no other reliable data are available for rice drying operations, these data wereretained and rated D. The data from these tests are summarized in Table 4-10, and the test reportexcerpts are presented in Appendix U.
Table 4-10. Summary of Rice Dryer Emission Factors from Reference 48
Location Dryer type
Filterable PM emission factor
kg/Mg lb/ton
BCRG-Richrale Gas-fired screen 0.034 0.068
BCRG-Richale Screen-baffle 0.082 0.16
BCRG-Riceton Gas-fired screen 0.027 0.054
Red top Gas-fired screen 0.057 0.11
RGA Vertical screen 0.082 0.16
4.1.22 Reference 49 (1974)
Reference 49 summarizes a study of rice dryer emissions conducted by the California AirResources Board in the Sacramento Basin in 1972 and 1973. Tests were conducted on 15 screen dryers,9 baffle dryers, and 1 LSU aeration dryer. Two runs were conducted on each dryer using a Hi-Volsampler; the report did not specify the location of the tests, whether the exhaust stream was traversed,whether isokinetic sampling was used, and how volumetric flows were determined. Limited particle sizedata also were obtained with an eight-stage Andersen cascade impactor, but the method appears to havebeen nonstandard. The report contained no process information for any of the dryers tested.
Information obtained as a part of this AP-42 revision indicates that rice properties have changedsubstantially over the past 20 years, and that these changes have had a significant impact on the emissionpotential of rice dryers.50 Consequently, the data in Reference 49 are considered unratable for purposesof AP-42 emission factor development. However, because the data do provide some indication of therelative emissions from different types of dryers and controls, they are summarized in Table 4-11. Excerpts from the report that contain data summaries for both the filterable PM results and the particlesize results are included in Appendix V.
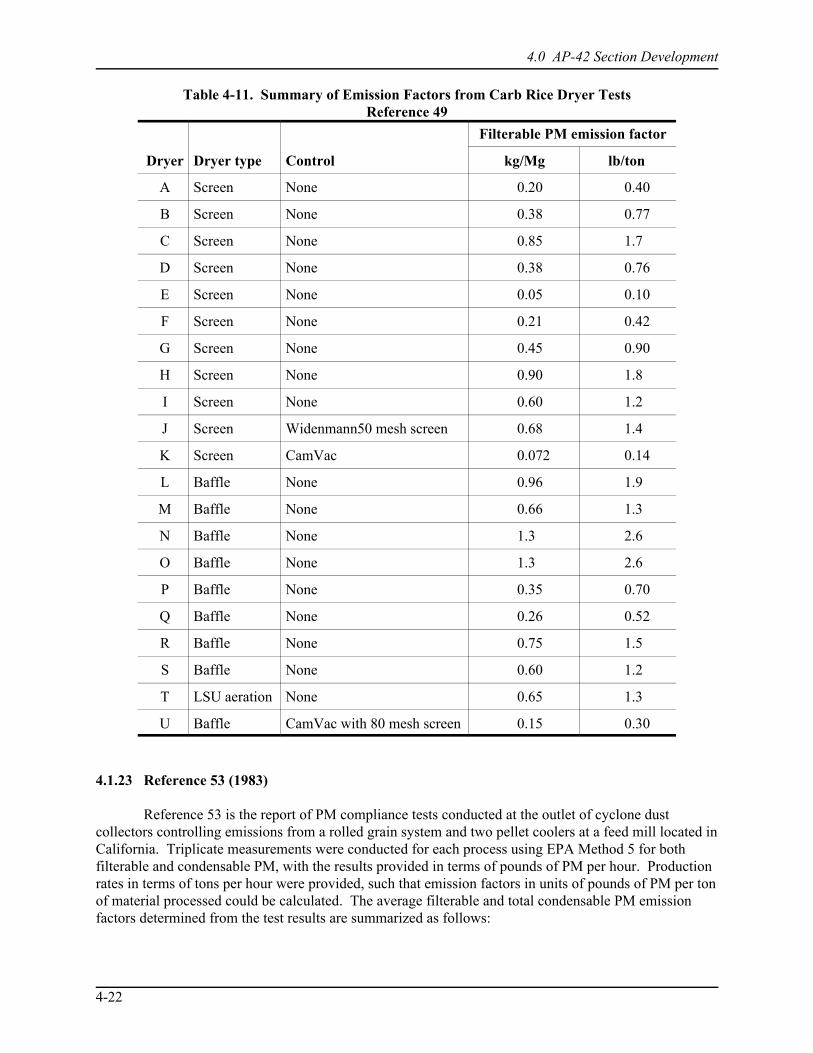
4.0 AP-42 Section Development
4-22
Table 4-11. Summary of Emission Factors from Carb Rice Dryer TestsReference 49
Dryer Dryer type Control
Filterable PM emission factor
kg/Mg lb/ton
A Screen None 0.20 0.40
B Screen None 0.38 0.77
C Screen None 0.85 1.7
D Screen None 0.38 0.76
E Screen None 0.05 0.10
F Screen None 0.21 0.42
G Screen None 0.45 0.90
H Screen None 0.90 1.8
I Screen None 0.60 1.2
J Screen Widenmann50 mesh screen 0.68 1.4
K Screen CamVac 0.072 0.14
L Baffle None 0.96 1.9
M Baffle None 0.66 1.3
N Baffle None 1.3 2.6
O Baffle None 1.3 2.6
P Baffle None 0.35 0.70
Q Baffle None 0.26 0.52
R Baffle None 0.75 1.5
S Baffle None 0.60 1.2
T LSU aeration None 0.65 1.3
U Baffle CamVac with 80 mesh screen 0.15 0.30
4.1.23 Reference 53 (1983)
Reference 53 is the report of PM compliance tests conducted at the outlet of cyclone dustcollectors controlling emissions from a rolled grain system and two pellet coolers at a feed mill located inCalifornia. Triplicate measurements were conducted for each process using EPA Method 5 for bothfilterable and condensable PM, with the results provided in terms of pounds of PM per hour. Productionrates in terms of tons per hour were provided, such that emission factors in units of pounds of PM per tonof material processed could be calculated. The average filterable and total condensable PM emissionfactors determined from the test results are summarized as follows:
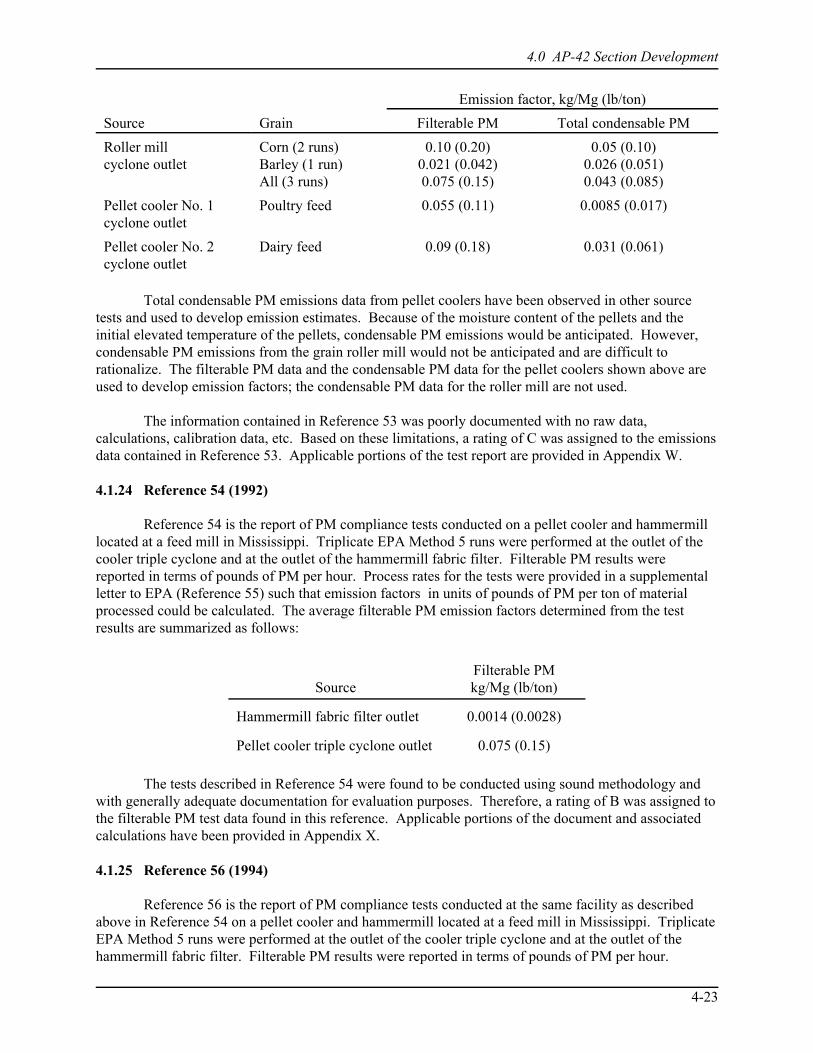
4.0 AP-42 Section Development
4-23
Emission factor, kg/Mg (lb/ton)
Source Grain Filterable PM Total condensable PM
Roller millcyclone outlet
Corn (2 runs)Barley (1 run)All (3 runs)
0.10 (0.20)0.021 (0.042)0.075 (0.15)
0.05 (0.10)0.026 (0.051)0.043 (0.085)
Pellet cooler No. 1cyclone outlet
Poultry feed 0.055 (0.11) 0.0085 (0.017)
Pellet cooler No. 2cyclone outlet
Dairy feed 0.09 (0.18) 0.031 (0.061)
Total condensable PM emissions data from pellet coolers have been observed in other sourcetests and used to develop emission estimates. Because of the moisture content of the pellets and theinitial elevated temperature of the pellets, condensable PM emissions would be anticipated. However,condensable PM emissions from the grain roller mill would not be anticipated and are difficult torationalize. The filterable PM data and the condensable PM data for the pellet coolers shown above areused to develop emission factors; the condensable PM data for the roller mill are not used.
The information contained in Reference 53 was poorly documented with no raw data,calculations, calibration data, etc. Based on these limitations, a rating of C was assigned to the emissionsdata contained in Reference 53. Applicable portions of the test report are provided in Appendix W.
4.1.24 Reference 54 (1992)
Reference 54 is the report of PM compliance tests conducted on a pellet cooler and hammermilllocated at a feed mill in Mississippi. Triplicate EPA Method 5 runs were performed at the outlet of thecooler triple cyclone and at the outlet of the hammermill fabric filter. Filterable PM results werereported in terms of pounds of PM per hour. Process rates for the tests were provided in a supplementalletter to EPA (Reference 55) such that emission factors in units of pounds of PM per ton of materialprocessed could be calculated. The average filterable PM emission factors determined from the testresults are summarized as follows:
SourceFilterable PMkg/Mg (lb/ton)
Hammermill fabric filter outlet 0.0014 (0.0028)
Pellet cooler triple cyclone outlet 0.075 (0.15)
The tests described in Reference 54 were found to be conducted using sound methodology andwith generally adequate documentation for evaluation purposes. Therefore, a rating of B was assigned tothe filterable PM test data found in this reference. Applicable portions of the document and associatedcalculations have been provided in Appendix X.
4.1.25 Reference 56 (1994)
Reference 56 is the report of PM compliance tests conducted at the same facility as describedabove in Reference 54 on a pellet cooler and hammermill located at a feed mill in Mississippi. TriplicateEPA Method 5 runs were performed at the outlet of the cooler triple cyclone and at the outlet of thehammermill fabric filter. Filterable PM results were reported in terms of pounds of PM per hour.
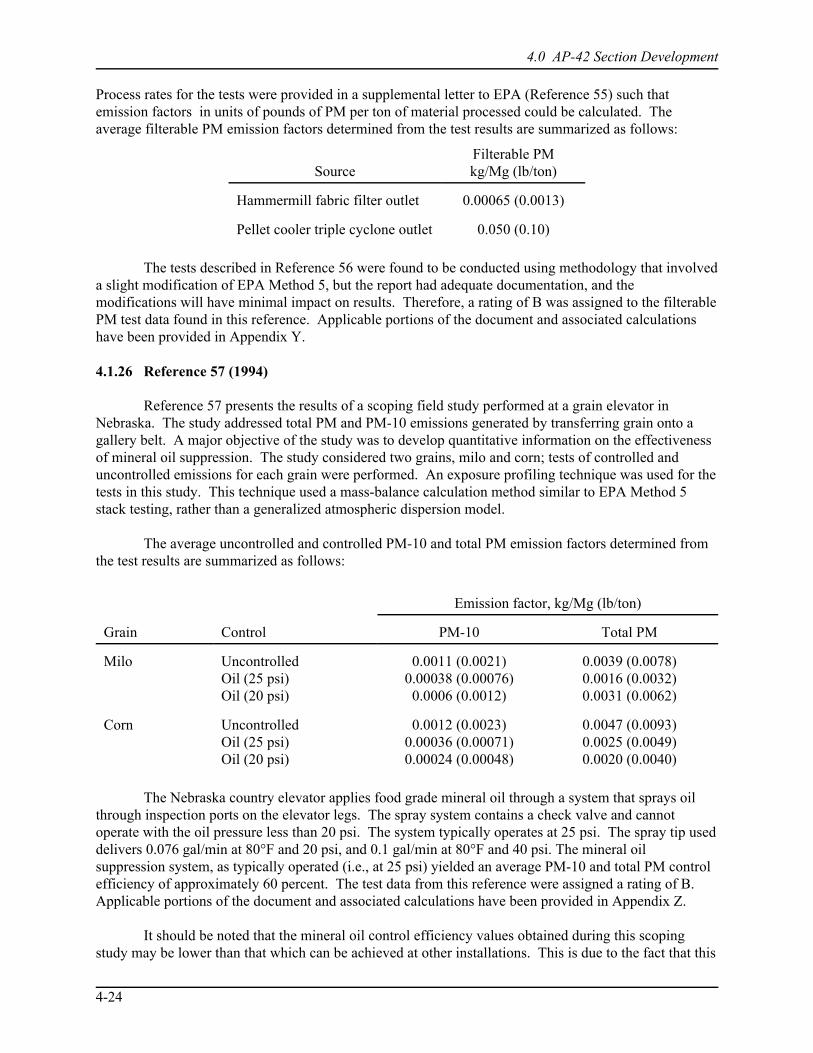
4.0 AP-42 Section Development
4-24
Process rates for the tests were provided in a supplemental letter to EPA (Reference 55) such thatemission factors in units of pounds of PM per ton of material processed could be calculated. Theaverage filterable PM emission factors determined from the test results are summarized as follows:
SourceFilterable PMkg/Mg (lb/ton)
Hammermill fabric filter outlet 0.00065 (0.0013)
Pellet cooler triple cyclone outlet 0.050 (0.10)
The tests described in Reference 56 were found to be conducted using methodology that involveda slight modification of EPA Method 5, but the report had adequate documentation, and themodifications will have minimal impact on results. Therefore, a rating of B was assigned to the filterablePM test data found in this reference. Applicable portions of the document and associated calculationshave been provided in Appendix Y.
4.1.26 Reference 57 (1994)
Reference 57 presents the results of a scoping field study performed at a grain elevator inNebraska. The study addressed total PM and PM-10 emissions generated by transferring grain onto agallery belt. A major objective of the study was to develop quantitative information on the effectivenessof mineral oil suppression. The study considered two grains, milo and corn; tests of controlled anduncontrolled emissions for each grain were performed. An exposure profiling technique was used for thetests in this study. This technique used a mass-balance calculation method similar to EPA Method 5stack testing, rather than a generalized atmospheric dispersion model.
The average uncontrolled and controlled PM-10 and total PM emission factors determined fromthe test results are summarized as follows:
Emission factor, kg/Mg (lb/ton)
Grain Control PM-10 Total PM
Milo UncontrolledOil (25 psi)Oil (20 psi)
0.0011 (0.0021)0.00038 (0.00076)0.0006 (0.0012)
0.0039 (0.0078)0.0016 (0.0032)0.0031 (0.0062)
Corn UncontrolledOil (25 psi)Oil (20 psi)
0.0012 (0.0023)0.00036 (0.00071)0.00024 (0.00048)
0.0047 (0.0093)0.0025 (0.0049)0.0020 (0.0040)
The Nebraska country elevator applies food grade mineral oil through a system that sprays oilthrough inspection ports on the elevator legs. The spray system contains a check valve and cannotoperate with the oil pressure less than 20 psi. The system typically operates at 25 psi. The spray tip useddelivers 0.076 gal/min at 80°F and 20 psi, and 0.1 gal/min at 80°F and 40 psi. The mineral oilsuppression system, as typically operated (i.e., at 25 psi) yielded an average PM-10 and total PM controlefficiency of approximately 60 percent. The test data from this reference were assigned a rating of B. Applicable portions of the document and associated calculations have been provided in Appendix Z.
It should be noted that the mineral oil control efficiency values obtained during this scopingstudy may be lower than that which can be achieved at other installations. This is due to the fact that this

4.0 AP-42 Section Development
4-25
elevator applies the oil to grain in the leg. As a result, not all of the oil adheres to the grain and only alimited amount of mixing can occur before the grain hits the gallery belt. Other installations designed tospray oil during active grain tumbling are expected to exhibit higher control efficiency.
4.1.27 Reference 58 (1994)
Reference 58 presents the results of a grain elevator dust emission study conducted inSeptember 1994 by Oklahoma State University in conjunction with Oklahoma DEQ and the OklahomaGrain and Feed Association Task Force. The objectives of the study were to develop PM emissionfactors for grain receiving and shipping, and to measure the effects of dump pit baffles and truck type onreceiving emissions. Hard red winter wheat was the only grain considered in the study. Receivingemissions were measured for straight trucks and hopper bottom trucks. The baffle efficiency testsincluded only straight trucks.
The basic design of the emission tests was to perform typical receiving and loading operations ina totally enclosed dump shed and to evacuate all of the air in the shed through filter bags, capturing theairborne dust particles. The suction system used to capture grain dust was engineered to capture emittedgrain dust while not artificially separating fine particles from the grain. Two high-volume propeller fanswere used to keep all airborne dust in suspension until it could be evacuated through the filter bags.
After each test, the dust which settled to the dump shed floor was swept up and weighed. Oneopen door test during unloading of a straight truck was conducted to determine the amount of floor dustwhich would be expected during normal operations. To compensate for testing with the shed doorsclosed (instead of open as is typical), the difference between the two floor dust weights was added to theemission measurements as an adjustment to the airborne dust emissions.
The baffle efficiency tests showed the control efficiency for the baffles at this facility to beapproximately 21 percent. The dump pit baffle design used in this test was installed around 1990.
The average uncontrolled total PM emission factors determined from the test results aresummarized below.
Total PM
Process Range, kg/Mg (lb/ton) Average, kg/Mg (lb/ton)
Grain receiving, straight truck 0.028-0.041(0.0553-0.081)
0.034 (0.067)
Grain receiving, hopper truck 0.018-0.021(0.0363-0.041)
0.019 (0.038)
Grain shipping, truck 0.0037-0.0073(0.0074-0.0145)
0.0055 (0.011)
The tests described in Reference 58 were found to be properly conducted and adequatelydocumented. The data contained in this reference were assigned a rating of B. Selected pages from thetest report as well as applicable calculations are provided in Appendix AA.
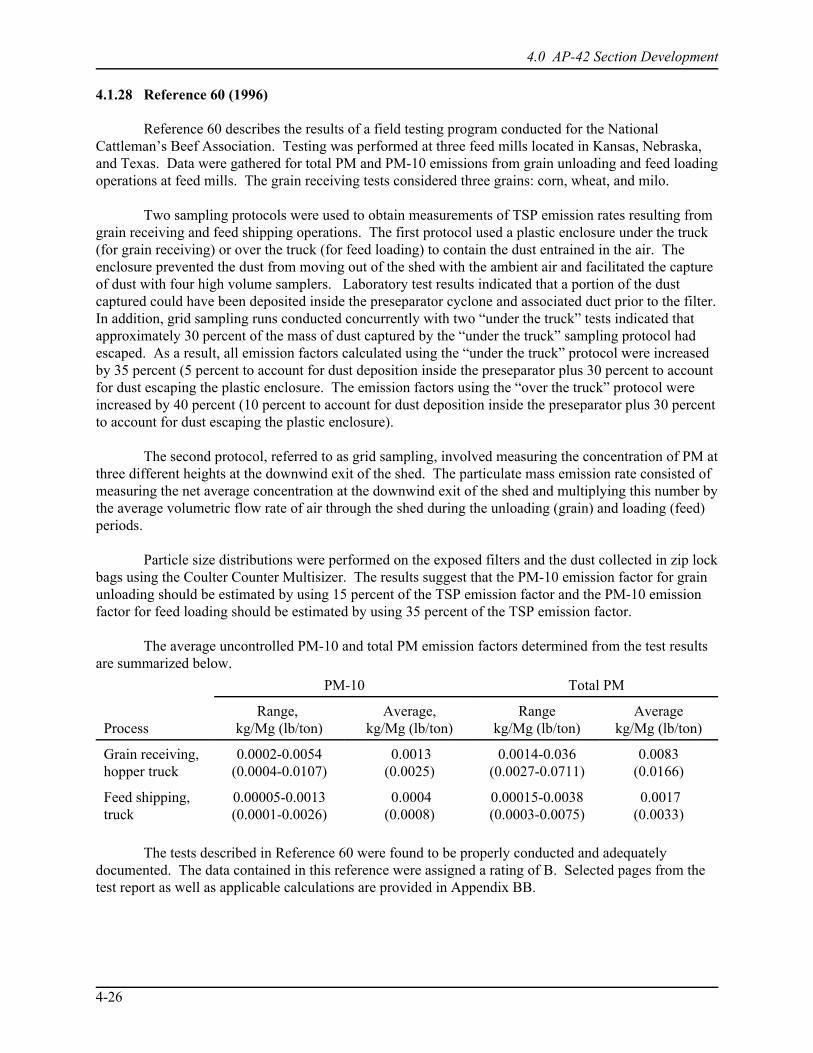
4.0 AP-42 Section Development
4-26
4.1.28 Reference 60 (1996)
Reference 60 describes the results of a field testing program conducted for the NationalCattleman’s Beef Association. Testing was performed at three feed mills located in Kansas, Nebraska,and Texas. Data were gathered for total PM and PM-10 emissions from grain unloading and feed loadingoperations at feed mills. The grain receiving tests considered three grains: corn, wheat, and milo.
Two sampling protocols were used to obtain measurements of TSP emission rates resulting fromgrain receiving and feed shipping operations. The first protocol used a plastic enclosure under the truck(for grain receiving) or over the truck (for feed loading) to contain the dust entrained in the air. Theenclosure prevented the dust from moving out of the shed with the ambient air and facilitated the captureof dust with four high volume samplers. Laboratory test results indicated that a portion of the dustcaptured could have been deposited inside the preseparator cyclone and associated duct prior to the filter. In addition, grid sampling runs conducted concurrently with two “under the truck” tests indicated thatapproximately 30 percent of the mass of dust captured by the “under the truck” sampling protocol hadescaped. As a result, all emission factors calculated using the “under the truck” protocol were increasedby 35 percent (5 percent to account for dust deposition inside the preseparator plus 30 percent to accountfor dust escaping the plastic enclosure. The emission factors using the “over the truck” protocol wereincreased by 40 percent (10 percent to account for dust deposition inside the preseparator plus 30 percentto account for dust escaping the plastic enclosure).
The second protocol, referred to as grid sampling, involved measuring the concentration of PM atthree different heights at the downwind exit of the shed. The particulate mass emission rate consisted ofmeasuring the net average concentration at the downwind exit of the shed and multiplying this number bythe average volumetric flow rate of air through the shed during the unloading (grain) and loading (feed)periods.
Particle size distributions were performed on the exposed filters and the dust collected in zip lockbags using the Coulter Counter Multisizer. The results suggest that the PM-10 emission factor for grainunloading should be estimated by using 15 percent of the TSP emission factor and the PM-10 emissionfactor for feed loading should be estimated by using 35 percent of the TSP emission factor.
The average uncontrolled PM-10 and total PM emission factors determined from the test resultsare summarized below.
PM-10 Total PM
ProcessRange,
kg/Mg (lb/ton)Average,
kg/Mg (lb/ton)Range
kg/Mg (lb/ton)Average
kg/Mg (lb/ton)
Grain receiving,hopper truck
0.0002-0.0054(0.0004-0.0107)
0.0013(0.0025)
0.0014-0.036(0.0027-0.0711)
0.0083(0.0166)
Feed shipping,truck
0.00005-0.0013(0.0001-0.0026)
0.0004(0.0008)
0.00015-0.0038(0.0003-0.0075)
0.0017(0.0033)
The tests described in Reference 60 were found to be properly conducted and adequatelydocumented. The data contained in this reference were assigned a rating of B. Selected pages from thetest report as well as applicable calculations are provided in Appendix BB.
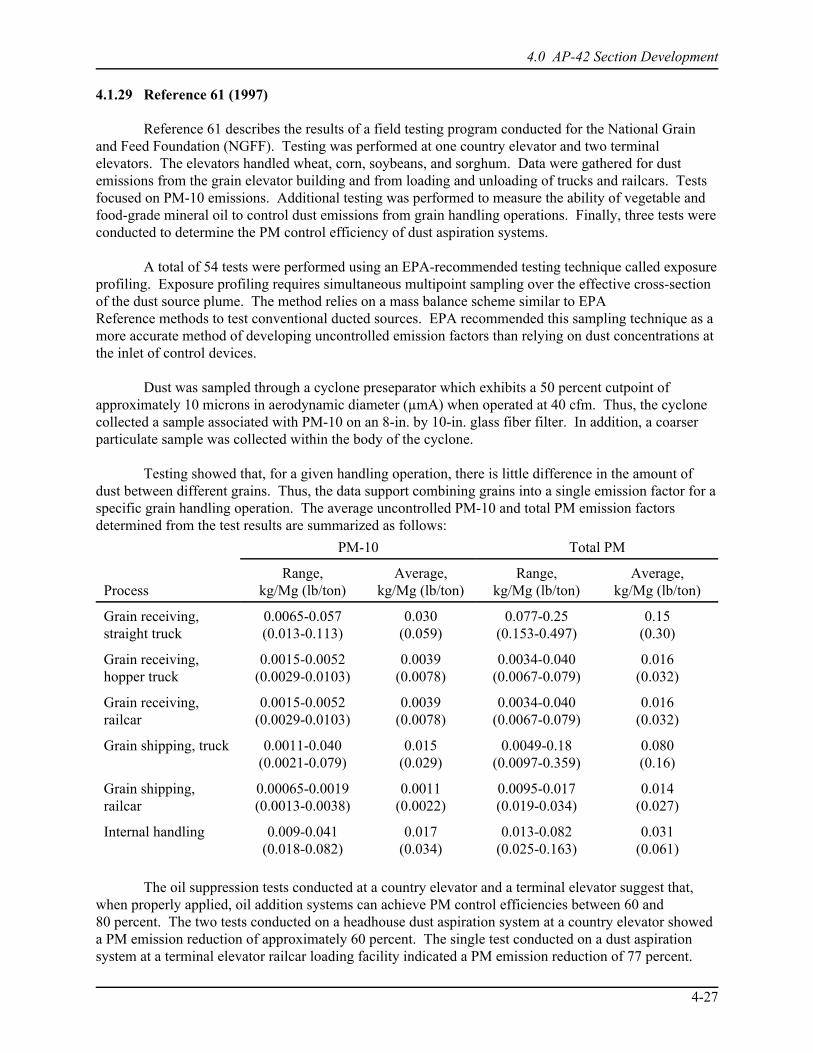
4.0 AP-42 Section Development
4-27
4.1.29 Reference 61 (1997)
Reference 61 describes the results of a field testing program conducted for the National Grainand Feed Foundation (NGFF). Testing was performed at one country elevator and two terminalelevators. The elevators handled wheat, corn, soybeans, and sorghum. Data were gathered for dustemissions from the grain elevator building and from loading and unloading of trucks and railcars. Testsfocused on PM-10 emissions. Additional testing was performed to measure the ability of vegetable andfood-grade mineral oil to control dust emissions from grain handling operations. Finally, three tests wereconducted to determine the PM control efficiency of dust aspiration systems.
A total of 54 tests were performed using an EPA-recommended testing technique called exposureprofiling. Exposure profiling requires simultaneous multipoint sampling over the effective cross-sectionof the dust source plume. The method relies on a mass balance scheme similar to EPAReference methods to test conventional ducted sources. EPA recommended this sampling technique as amore accurate method of developing uncontrolled emission factors than relying on dust concentrations atthe inlet of control devices.
Dust was sampled through a cyclone preseparator which exhibits a 50 percent cutpoint ofapproximately 10 microns in aerodynamic diameter (µmA) when operated at 40 cfm. Thus, the cyclonecollected a sample associated with PM-10 on an 8-in. by 10-in. glass fiber filter. In addition, a coarserparticulate sample was collected within the body of the cyclone.
Testing showed that, for a given handling operation, there is little difference in the amount ofdust between different grains. Thus, the data support combining grains into a single emission factor for aspecific grain handling operation. The average uncontrolled PM-10 and total PM emission factorsdetermined from the test results are summarized as follows:
PM-10 Total PM
ProcessRange,
kg/Mg (lb/ton)Average,
kg/Mg (lb/ton)Range,
kg/Mg (lb/ton)Average,
kg/Mg (lb/ton)
Grain receiving,straight truck
0.0065-0.057(0.013-0.113)
0.030(0.059)
0.077-0.25(0.153-0.497)
0.15(0.30)
Grain receiving,hopper truck
0.0015-0.0052(0.0029-0.0103)
0.0039(0.0078)
0.0034-0.040(0.0067-0.079)
0.016(0.032)
Grain receiving,railcar
0.0015-0.0052(0.0029-0.0103)
0.0039(0.0078)
0.0034-0.040(0.0067-0.079)
0.016(0.032)
Grain shipping, truck 0.0011-0.040(0.0021-0.079)
0.015(0.029)
0.0049-0.18(0.0097-0.359)
0.080(0.16)
Grain shipping,railcar
0.00065-0.0019(0.0013-0.0038)
0.0011(0.0022)
0.0095-0.017(0.019-0.034)
0.014(0.027)
Internal handling 0.009-0.041(0.018-0.082)
0.017(0.034)
0.013-0.082(0.025-0.163)
0.031(0.061)
The oil suppression tests conducted at a country elevator and a terminal elevator suggest that,when properly applied, oil addition systems can achieve PM control efficiencies between 60 and80 percent. The two tests conducted on a headhouse dust aspiration system at a country elevator showeda PM emission reduction of approximately 60 percent. The single test conducted on a dust aspirationsystem at a terminal elevator railcar loading facility indicated a PM emission reduction of 77 percent.
4.0 AP-42 Section Development
4-28
The tests described in Reference 61 were found to be properly conducted and adequatelydocumented. The data contained in this reference were assigned a rating of B. Selected pages from thetest report as well as applicable calculations are provided in Appendix CC.
4.1.30 Reference 67 (1995)
This test report documents an emission test conducted at Ladish Malting Company in JeffersonJunction, WI, on November 14, 1995. The test included six EPA Method 18 test runs (on each of fiveseparate kiln stacks) to quantify methane and nonmethane organic compounds (NMOC) from the No. 15Malt Kiln. A malt production rate was provided for the kiln cycle.
The No. 15 Kiln is an indirect-, natural gas-fired kiln. Heat is provided by propylene glycol-filled coils that are heated with natural gas. Barley, with about a 45 percent moisture content, enters theupper deck of the kiln and is dried, over a 24-hour period, to between 15 and 20 percent. The barley isthen transferred to the lower deck of the kiln, where it is dried to about 4 percent over a second 24-hourperiod. At times during the cycle, sulfur is burned into the kiln. To convert from bushels produced to lbof malt produced, a factor of 40 lb/bushel was provided in a memo attached to the report. The memo, aMarch 27, 1996 memo to the file from J. Crawford, is a review of the test report performed by the Stateof Wisconsin Department of Natural Resources.
Several problems were found with the emission rate calculations in the report and the attachedmemo. To calculate emission rates, the flow rates (dscfm) from each of the five stacks were summed, theconcentrations (ppm) from each of the five stacks were summed, and the sums were used to calculate themethane and NMOC emission rates for each test run. To correctly calculate these emission rates, theaverage concentration should have been used instead of the sum of the concentrations. The emissionrates presented in both the report and the attached memorandum appear to be five times too high. Also,the report indicates that NMOC were not detected during any test run. The detection limit was used as anupper limit for NMOC emissions. This type of data typically is not presented in AP-42.
The attached memo provides a brief review of the report, a description of the process, adiscussion of results, and a methodology for calculating emission factors from the data. The emissionfactor methodology provides the following information:
1. Four of the test runs (Runs 1, 2, 3, and 6) were conducted during “holding heat” conditions,which are present for 17 hours of a 24 hour kiln cycle;
2. The other 2 test runs (Runs 4 and 5) were conducted during “high heat” conditions, which arepresent for 5 hours of a 24 hour kiln cycle; and
3. 14,000 bushels of malt are produced during a 24 hour kiln cycle.
Item number (3) above appears to be incorrect. In Appendix E, the test report states that 7,000 bushelswere on each level of the kiln during testing, but that the barley remains on each of the 2 levels for24 hours. Therefore, for use in AP-42, a process rate of 7,000 bushels per 24 hours was used. Also, itwas assumed that the kiln is not heated for two hours of the cycle, and that there are no emissions duringthe periods when the kiln is not heated.
Using the data from this report, an emission factor of 1.41 lb/1,000 bushels was developed formethane emissions from malt kilns. The methane data are assigned an A rating. The barley density(40 lb/bu) can be used to convert the emission factor to 0.071 lb/ton. The test methodology was sound,no problems were reported, and sufficient details about the testing and the process are provided in the
4.0 AP-42 Section Development
4-29
report. The NMOC data are not rated for use in emission factor development because NMOC was notdetected during any test run.
4.1.31 Reference 68 (1991)
This test report documents emission tests conducted at Busch Agricultural Resources, Inc. inIdaho Falls, Idaho on October 1, 2, and 3-6, 1991. The tests included three EPA Method 1-5 andMethod 9 runs on each of two Dust Collectors (denoted 100 and 200) that control PM emissions frombarley unloading operations. Also, three EPA Method 1-5 test runs and one Method 9 test run wereconducted on Malt Kiln # 2. These tests were performed in order to evaluate the total particulate andvisual emissions to satisfy permitting requirements for new construction. Production rates and testresults were provided in the report. Raw data were not included in the report for the Method 1-5 test runsand the tabulated stack test data are incomplete.
The facility receives barley by railcar or truck. A screw conveyor transports barley to the storagesilos where PM emissions from the unloading operations are controlled by dust collection systems thatinclude reverse jet baghouses. During the tests on dust collection systems 100 and 200, an average of7,085 and 5,777 bushels/hour of barley was unloaded, respectively. Upon cleaning and grading, grain isfed to a malt kiln to be dried. No air cleaning system is employed by Malt Kiln # 2. Malt Kiln No. 2 is anindirect-, natural gas-fired heater that processes an average of 9,400 bushels/day. Malt Kiln No. 2 wastested while processing approximately 9,400 bushels/day. Exhaust from the heaters and the dryingprocess enters a common plenum and then exits the building through the kiln exhaust stack.
Using the data from this report, emission factors, in units of lb/ton of malted barley produced,were developed for filterable particulate emissions from fabric filter-controlled barley unloading and amalt kiln. The data are assigned a C rating. The test methodology appeared to be sound, however thetest data presented in the report are incomplete. Sample Number R-8 ( Malt Kiln No. 2) did not satisfythe Method 5 isokinetic requirements (88.4 percent). Selected pages from the test report as well asapplicable calculations are provided in Appendix DD.
4.1.32 Reference 69 (1996)
This test report documents an emission test conducted at Busch Agricultural Resources, Inc. inManitowoc, Wisconsin on May 8, 1996. Filterable PM, condensable inorganic PM, condensableorganic PM, and CO2 emissions from Malt Kiln No. 6 were measured using EPA Methods 5 (front- andback- half analyses) and 3 (with Orsat analyzer). In addition, a particle size analysis was performedduring each test run using an Anderson Mark III cascade impactor. The particle size data were used toestimate filterable PM-10 and PM-2.5 emissions. Three test runs were performed in order to determinethe total particulate air emissions from the kiln at various steps of the kiln cycle. Raw data are includedin the report. The tests were performed during three hours of production selected by the WisconsinDepartment of Natural Resources: (1) latter part of low temperature drying, (2) medium temperaturedrying and start of high temperature drying, and (3) latter part of high temperature drying, cooling, lowermalt bed dumping, and post-dumping ventilation. The CO2 measurements were close to ambient levelsand the CO2 data were therefore not used for emission factor development.
The facility produces barley malt for the brewing industry. The final step in that processincludes the drying of barley malt to a desired moisture content using a “double-deck” (a lower and anupper deck) gas-fired drying kiln. Approximately 9,300 bushels of “wet” malt are loaded onto the upperdeck for partial drying during the first stage. Upon completion of the first stage, the partially dried maltis dumped to the lower deck and then “wet” malt is loaded onto the upper deck. The complete dryingcycle is approximately 24 hours and includes the following steps: (1) loading and leveling of malt on
4.0 AP-42 Section Development
4-30
deck; (2) low temperature drying; (3) medium temperature drying; (4) high temperature drying;(5) cooling; and (6) product dumping. The report states that the flow rate measured during Run 3 waslikely an overestimate of actual conditions. The Run 3 flow rate appears to be reasonable compared tothe other runs.
Using the data from this report, emission factors, in units of lb/ton of malted barley produced, were developed for filterable PM, PM-10, PM-2.5, condensable inorganic PM, and condensable organicPM emissions from malt kilns. The data were down-rated to B because of the uncertainty associated withthe flow rate during Run 3. The test methodology appeared to be sound and the data were complete. Selected pages from the test report as well as applicable calculations are provided in Appendix EE.
4.1.33 Reference 70 (2001)
Reference 70 presents the results of a series of tests to quantify emissions from barge loading,barge unloading, and ship loading operations. A total of 60 tests were performed during November andDecember 2000 using exposure profiling to quantify emissions of PM-10 and PM-2.5 from these sources. Emissions data on uncontrolled operations were gathered at two barge loading facilities and three exportfacilities that unloaded barges and loaded ocean-going vessels. The facilities handled corn, soybeans,and wheat. The testing program focused on the equipment and operating conditions typically found atbarge and vessel loading and unloading facilities. The emission factors for PM-10 and PM-2.5 developedfrom the data are presented below. The data also indicated an overall PM-2.5/PM-10 emission ratio of0.17 based on the weighted average value for 37 different test cases.
Operation
PM-10Emission factor
(lb/ton)
PM-2.5Emission factor
(lb/ton)
Barge Loading 0.0040 0.00055
Barge Unloading 1. Continuous Barge Unloader 2. Marine Leg
0.00730.038
0.00190.0050
Vessel Loading 0.012 0.0022
The test methodology was sound and the data were complete. However, because the methodused (exposure profiling) is not a reference method, the data are assigned a rating of B.
4.2 Review of Existing Emission Factors
In the interim AP-42 Section 9.9.1, Table 9.9.1-2 presented emission factors for total PM andPM-10 for grain elevators and processing plants. The factors for grain elevators were presented using a“dustiness ratio” concept in which different grain types were assigned a dustiness factor, which wasbased on the experience of grain industry personnel. Wheat was arbitrarily assigned a factor of 1.0. Testdata for different grains were “normalized” to wheat using the dustiness ratio. The source test data usedto develop the emission factors were primarily obtained during the 1970s and early 1980s; with fewexceptions, more recent emissions data were not available. New source test data have become availablefor country elevators, terminal elevators, animal feed mills, and malted barley kilns. The new emissionfactors for grain elevators and processing plants have utilized these new data to the extent possible. Thenew factors do not incorporate the dustiness ratio concept; a single emission factor is presented for allgrain types. Recent source tests using multiple grain types have largely shown that there is no clear
4.0 AP-42 Section Development
4-31
distinction in the results based on grain type so that, at this time, separate emission factors based on graintype have not been presented. However, as additional source test data using different grain types at thesame site become available, development of emission factors for separate grain types may be possible.
In the development of the new emission factors, the older data have largely been deleted, exceptin those instances where no more recent data are available. The older data are not considered to berepresentative of current operations at grain elevators or grain processing plants. In addition, all oldersource tests were deleted if the “uncontrolled” emission data were based on measurements at the inlet tocontrol devices.
In the Interim section, emission factors for PM-10 were based on the assumption that 25 percentof the total PM was PM-10. The new emission factors for PM-10 are based on source test data andparticle sizing data.
For grain receiving operations in the Interim section, a single emission factor was presented forall types of trucks, i.e., emission data for straight trucks and hopper trucks were combined and anemission factor calculated. The new PM emission factors for grain receiving present different factors forstraight trucks and hopper trucks. At the present time, emissions from straight trucks unloading with andwithout “choke flow” have been combined because insufficient data are available to establish separatefactors; if additional source test become available, it may be possible to develop these factors.
In Table 9.9.1-3 of the Interim section, emission factors for grain receiving, grain handling, andfeed shipping at animal feed mills were not available and users were referred to the grain elevator factors. Grain receiving and feed shipping emissions data are available from recent tests conducted at animal feedmills. Emission factors for feed mills were developed from these data and are presented in Section 4-3.
For this revised AP-42 Section 9.9.1, all of the source emission test reports and other informationsources used in the existing Interim section were reviewed, data from new source tests were integrated,older emissions data were deleted as appropriate, and new emission factors developed. The analysis ofthe data and development of the proposed new emission factors are discussed in Section 4.3.
4.3 Development of Candidate Emission Factors
The following subsections outline the data analysis methodology used to develop candidatefilterable PM, condensable PM, and PM-10 (particles # 10 :m in aerodynamic diameter) emissionfactors for grain elevators and processing facilities. The derivation of emission factors for each pollutantis discussed separately.
4.3.1 Data Analysis for Total Particulate Matter
Useful test data for filterable PM emissions were found in References 22, 23, 25, 27, 36, 40, 42,58, 61, and 70 for grain elevators and References 4, 11, 36, 37, 38, 41, 47, 48, 53, 54, 56, 60, 68, and 69for grain processing facilities. Although a few of these data sets were rated A or B, most were assigned arating of C or D, indicating generally questionable or inadequate data quality. Available data aretabulated in Tables 4-12, 4-13 and 4-14.

4.0 AP-42 Section Development
4-32
Table 4-12. Data Used to Develop Filterable PM, PM-10, and PM-2.5 EmissionFactors for Grain Elevatorsa
Emission sourceType ofcontrol
Type ofgrain
Averagemeasured
filterable PMemission
factor, lb/tonb
Averagemeasured
PM-10emission
factor, lb/tonc
AveragemeasuredPM-2.5emission
factor, lb/ton
Dataqualityrating
Ref No.d
Grain receiving (straighttruck)
None Mixed 0.067 -- -- B 58
Mixed 0.30 0.059 -- B 61
Grain receiving (hoppertruck)
None Mixed 0.038 -- -- B 58
Mixed 0.032 0.0078 -- B 61
Grain receiving (railcar) None Mixed 0.032 0.0078 -- B 61
Grain receiving (barge)
– Continuous barge unloader None Mixed -- 0.0073 0.0019 B 70
– Marine leg None Mixed -- 0.038 0.0050 B 70
Grain shipping (truck) None Mixed 0.011 -- -- B 58
Mixed 0.16 0.029 -- B 61
Grain shipping (railcar) None Mixed 0.027 0.0022 -- 61
Grain shipping (barge) None Mixed -- 0.0040 0.00055 B 70
Grain shipping (ship) None Mixed -- 0.012 0.0022 B 70
Headhouse and internalhandling operations (legs,distributor, belts, scales,enclosed cleaners, etc.)e
None Mixed 0.061 0.034 -- B 61
Bin loading (vent) None Wheat,sorghum
0.025 NA -- B 23
Grain cleaners
– Internal vibrating Cyclone WheatWheat
NANANA
Wheat
0.0290.00930.1570.08970.06940.0973
NA ------------
AACCCC
222225274042
Grain dryers– Column dryers None Corn
Corn0.210.23
NANA
----
DD
3636
– Rack dryers None CornCorn
3.752.3
NANA
----
DD
3636
Self-cleaningscreens(50 meshor smaller)
CornCorn
0.1030.84
NANA
----
DD
3636
a NA = not available.b Weight of total particulate matter per unit-weight of grain processed. Number of significant figures presented vary depending on raw test data.c Weight of PM-10 per unit-weight of grain processed. Number of significant figures presented vary depending on raw test data.d See list of references.e Exact number of handling operations varies from facility to facility. Newer headhouse systems include grain receiving (truck dump).
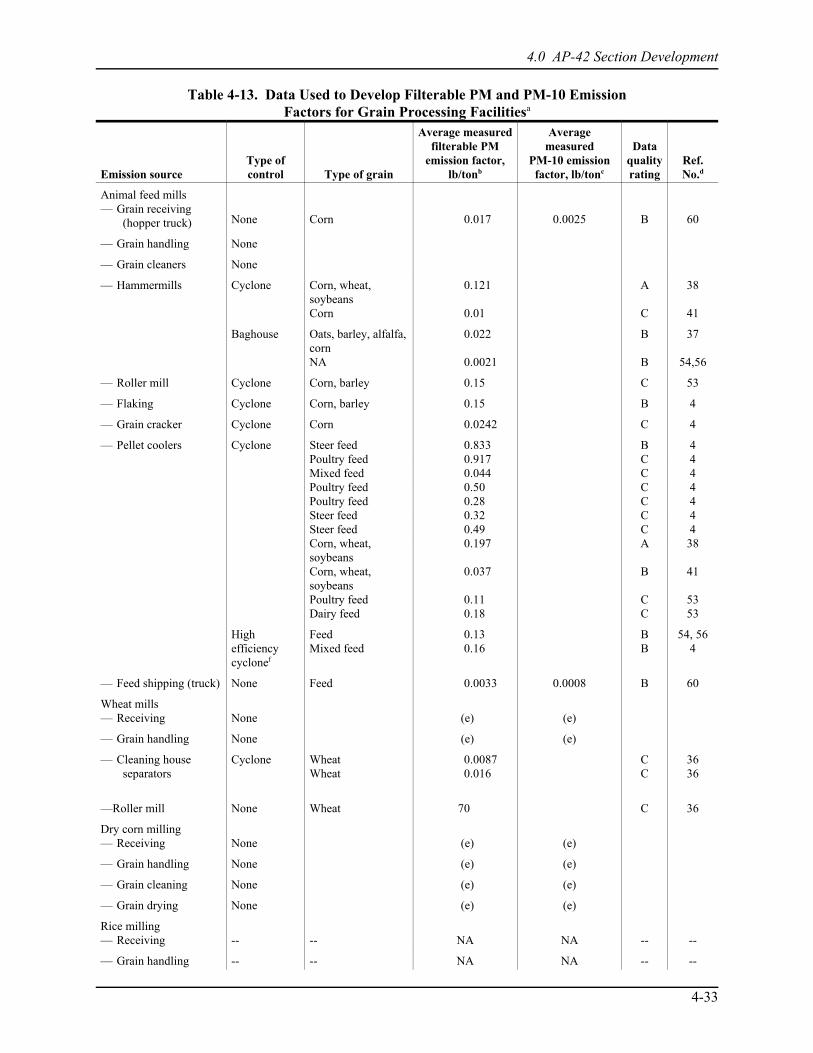
4.0 AP-42 Section Development
4-33
Table 4-13. Data Used to Develop Filterable PM and PM-10 EmissionFactors for Grain Processing Facilitiesa
Emission sourceType ofcontrol Type of grain
Average measuredfilterable PM
emission factor,lb/tonb
Averagemeasured
PM-10 emissionfactor, lb/tonc
Dataqualityrating
Ref.No.d
Animal feed mills— Grain receiving
(hopper truck) None Corn 0.017 0.0025 B 60
— Grain handling None
— Grain cleaners None
— Hammermills Cyclone Corn, wheat,soybeansCorn
0.121
0.01
A
C
38
41
Baghouse Oats, barley, alfalfa,cornNA
0.022
0.0021
B
B
37
54,56
— Roller mill Cyclone Corn, barley 0.15 C 53
— Flaking Cyclone Corn, barley 0.15 B 4
— Grain cracker Cyclone Corn 0.0242 C 4
— Pellet coolers Cyclone Steer feedPoultry feedMixed feedPoultry feedPoultry feedSteer feedSteer feedCorn, wheat,soybeansCorn, wheat,soybeansPoultry feedDairy feed
0.8330.9170.0440.500.280.320.490.197
0.037
0.110.18
BCCCCCCA
B
CC
4444444
38
41
5353
Highefficiencycyclonef
FeedMixed feed
0.130.16
BB
54, 564
— Feed shipping (truck) None Feed 0.0033 0.0008 B 60
Wheat mills— Receiving None (e) (e)
— Grain handling None (e) (e)
— Cleaning house separators
Cyclone WheatWheat
0.00870.016
CC
3636
—Roller mill None Wheat 70 C 36
Dry corn milling— Receiving None (e) (e)
— Grain handling None (e) (e)
— Grain cleaning None (e) (e)
— Grain drying None (e) (e)
Rice milling— Receiving -- -- NA NA -- --
— Grain handling -- -- NA NA -- --
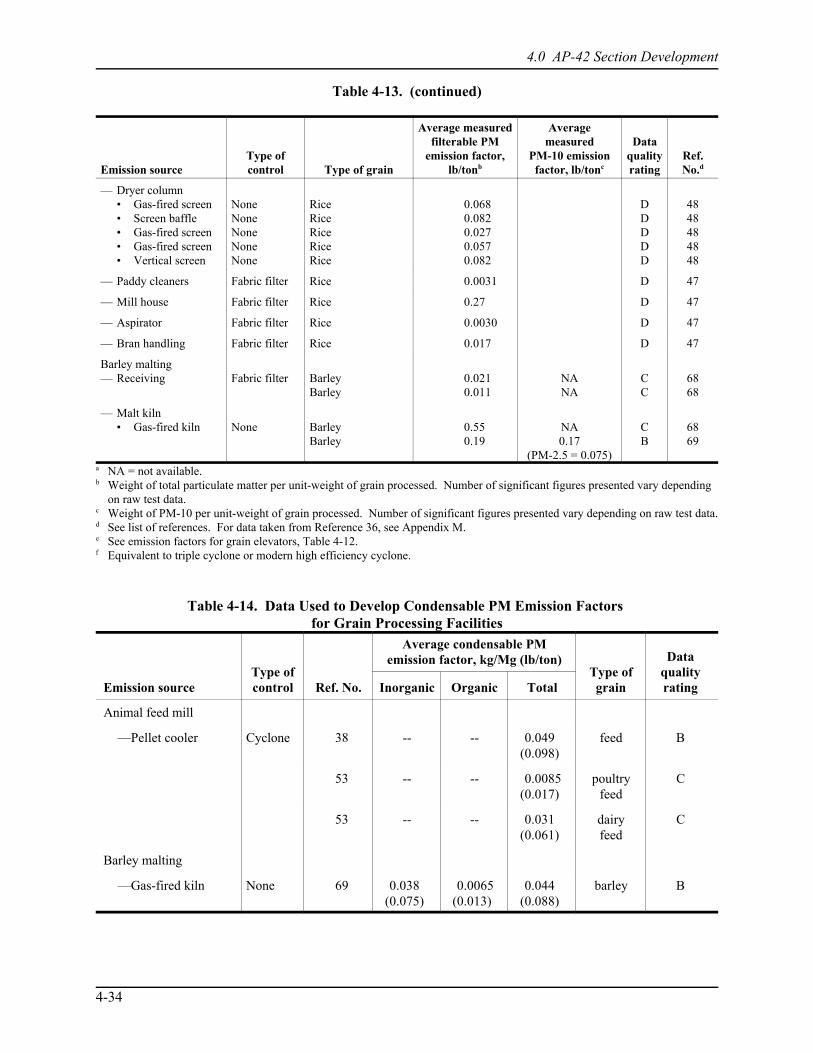
Table 4-13. (continued)
4.0 AP-42 Section Development
Emission sourceType ofcontrol Type of grain
Average measuredfilterable PM
emission factor,lb/tonb
Averagemeasured
PM-10 emissionfactor, lb/tonc
Dataqualityrating
Ref.No.d
4-34
— Dryer column• Gas-fired screen• Screen baffle• Gas-fired screen• Gas-fired screen• Vertical screen
NoneNoneNoneNoneNone
RiceRiceRiceRiceRice
0.0680.0820.0270.0570.082
DDDDD
4848484848
— Paddy cleaners Fabric filter Rice 0.0031 D 47
— Mill house Fabric filter Rice 0.27 D 47
— Aspirator Fabric filter Rice 0.0030 D 47
— Bran handling Fabric filter Rice 0.017 D 47
Barley malting— Receiving Fabric filter Barley
Barley0.0210.011
NANA
CC
6868
— Malt kiln • Gas-fired kiln None Barley
Barley0.550.19
NA0.17
(PM-2.5 = 0.075)
CB
6869
a NA = not available.b Weight of total particulate matter per unit-weight of grain processed. Number of significant figures presented vary depending
on raw test data.c Weight of PM-10 per unit-weight of grain processed. Number of significant figures presented vary depending on raw test data.d See list of references. For data taken from Reference 36, see Appendix M.e See emission factors for grain elevators, Table 4-12.f Equivalent to triple cyclone or modern high efficiency cyclone.
Table 4-14. Data Used to Develop Condensable PM Emission Factors for Grain Processing Facilities
Emission sourceType ofcontrol Ref. No.
Average condensable PMemission factor, kg/Mg (lb/ton)
Type ofgrain
DataqualityratingInorganic Organic Total
Animal feed mill
—Pellet cooler Cyclone 38 -- -- 0.049(0.098)
feed B
53 -- -- 0.0085(0.017)
poultryfeed
C
53 -- -- 0.031(0.061)
dairyfeed
C
Barley malting
—Gas-fired kiln None 69 0.038(0.075)
0.0065(0.013)
0.044(0.088)
barley B
4.0 AP-42 Section Development
4-35
According to the OAQPS guidelines, A- and B-rated data should not be combined with C- orD-rated data to develop emission factors for a particular source. However, in the case of several sourcecategories, we concluded that combining very limited quantities of A- and B-rated data with substantiallygreater quantities of C- and D-rated data would improve the overall quality of the emission factor. Forsuch cases, inclusion of the C and D data significantly enhances the overall applicability of the emissionfactor to a greater number of facilities and grain types. However, the rating of average emission factorsobtained in this manner was typically D or E.
To derive the candidate filterable and condensable PM emission factors for the above sources,average emission factors were obtained for each test series either directly from the text of the report or byhand calculation from the experimental data (see Appendices B to EE). The individual factors obtainedfrom the reference documents were then tabulated according to type of facility, emission source, andcontrol equipment and the arithmetic mean calculated for each source/control combination.
The data used to develop candidate emission factors developed by the above method areprovided in Tables 4-12 and 4-13 for grain elevators and grain processing facilities, respectively. Thecandidate filterable and condensable PM emission factors ultimately were obtained either by averagingall data sets for a particular source/grain/control combination regardless of quality or by averaging onlyA- and B-rated data. The decision as to what information should be used to derive the emission factor fora particular combination was based on the quantity and quality of the available information. Details onhow the data in Table 4-12 and 4-13 were combined to obtain final filterable PM emission factors andhow the data from Table 4-14 were used to obtain condensable PM emission factors are presented inSection 4.4.3.
As shown by Tables 4-12 and 4-13, the emission data used to derive the candidate emissionfactors are highly variable and typically range over one or more orders of magnitude within a singlesource/control category. Also, the quantity of available data is usually limited and generally ofquestionable quality, which is reflected in the low rating assigned to most filterable PM emission factors. Appropriate footnotes are provided explaining the applicability of each emission factor determined in theanalysis.
4.3.2 Particle Size Data Analysis51,52
Particle size data were provided in References 10, 11, 12, 23, 24, 26, 33, and 35 for a limitednumber of sources in grain elevators and processing facilities. Because all of the available particle sizeinformation was obtained by some type of inertial sizing device (impactor or cyclone), all data wereprovided in terms of aerodynamic diameter (equivalent unit density spheres) suitable for direct analysis.The procedure used to develop candidate size-specific emission factors for selected source/controlcategories is described below.
The raw particle size data contained in the various reference documents were reduced to acommon format using a family of computer programs developed especially for this purpose (Table 4-15). These programs are BASIC translations of the FORTRAN program SPLIN2, originally developed bySouthern Research Institute. The translated version is one that Midwest Research Institute (MRI)modified to operate utilizing as few as three data points. The program provides a numerical procedurefor obtaining a “best-fit” curve for particle-size test data obtained from varied methods (impactors orsizing cyclones) that may have different cut sizes.
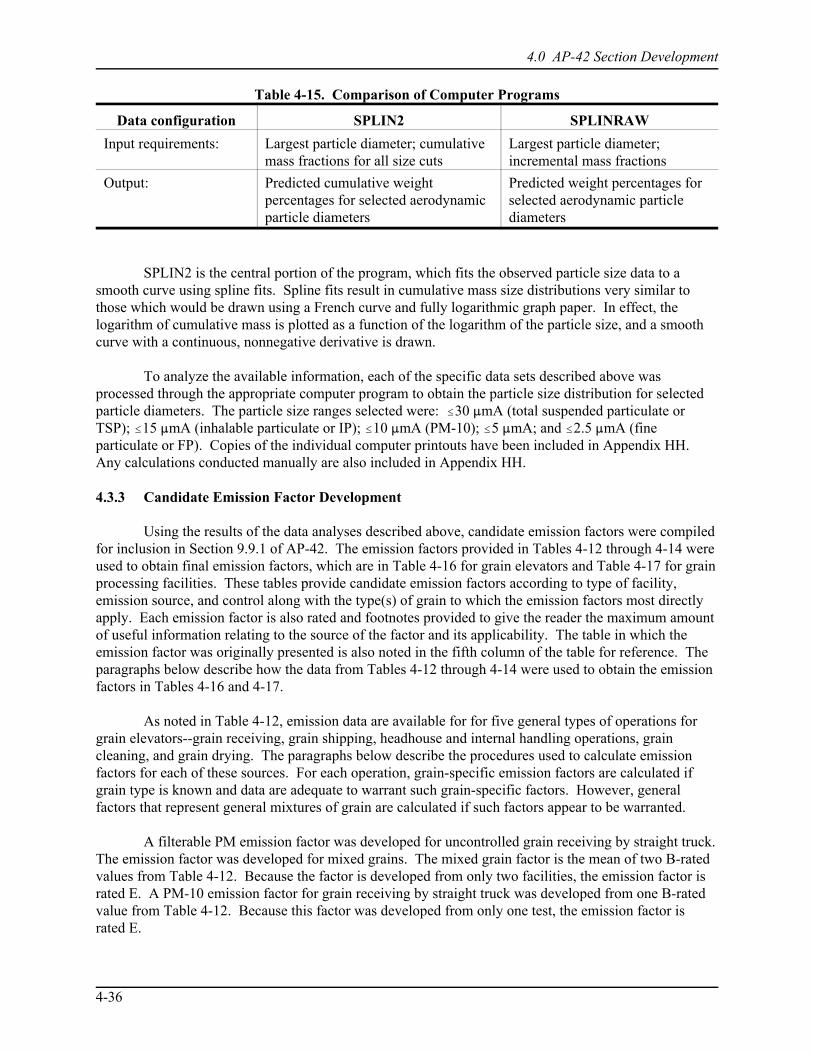
4.0 AP-42 Section Development
4-36
Table 4-15. Comparison of Computer Programs
Data configuration SPLIN2 SPLINRAW
Input requirements: Largest particle diameter; cumulativemass fractions for all size cuts
Largest particle diameter;incremental mass fractions
Output: Predicted cumulative weightpercentages for selected aerodynamicparticle diameters
Predicted weight percentages forselected aerodynamic particlediameters
SPLIN2 is the central portion of the program, which fits the observed particle size data to asmooth curve using spline fits. Spline fits result in cumulative mass size distributions very similar tothose which would be drawn using a French curve and fully logarithmic graph paper. In effect, thelogarithm of cumulative mass is plotted as a function of the logarithm of the particle size, and a smoothcurve with a continuous, nonnegative derivative is drawn.
To analyze the available information, each of the specific data sets described above wasprocessed through the appropriate computer program to obtain the particle size distribution for selectedparticle diameters. The particle size ranges selected were: #30 :mA (total suspended particulate orTSP); #15 :mA (inhalable particulate or IP); #10 :mA (PM-10); #5 :mA; and #2.5 :mA (fineparticulate or FP). Copies of the individual computer printouts have been included in Appendix HH. Any calculations conducted manually are also included in Appendix HH.
4.3.3 Candidate Emission Factor Development
Using the results of the data analyses described above, candidate emission factors were compiledfor inclusion in Section 9.9.1 of AP-42. The emission factors provided in Tables 4-12 through 4-14 wereused to obtain final emission factors, which are in Table 4-16 for grain elevators and Table 4-17 for grainprocessing facilities. These tables provide candidate emission factors according to type of facility,emission source, and control along with the type(s) of grain to which the emission factors most directlyapply. Each emission factor is also rated and footnotes provided to give the reader the maximum amountof useful information relating to the source of the factor and its applicability. The table in which theemission factor was originally presented is also noted in the fifth column of the table for reference. Theparagraphs below describe how the data from Tables 4-12 through 4-14 were used to obtain the emissionfactors in Tables 4-16 and 4-17.
As noted in Table 4-12, emission data are available for for five general types of operations forgrain elevators--grain receiving, grain shipping, headhouse and internal handling operations, graincleaning, and grain drying. The paragraphs below describe the procedures used to calculate emissionfactors for each of these sources. For each operation, grain-specific emission factors are calculated ifgrain type is known and data are adequate to warrant such grain-specific factors. However, generalfactors that represent general mixtures of grain are calculated if such factors appear to be warranted.
A filterable PM emission factor was developed for uncontrolled grain receiving by straight truck. The emission factor was developed for mixed grains. The mixed grain factor is the mean of two B-ratedvalues from Table 4-12. Because the factor is developed from only two facilities, the emission factor israted E. A PM-10 emission factor for grain receiving by straight truck was developed from one B-ratedvalue from Table 4-12. Because this factor was developed from only one test, the emission factor israted E.
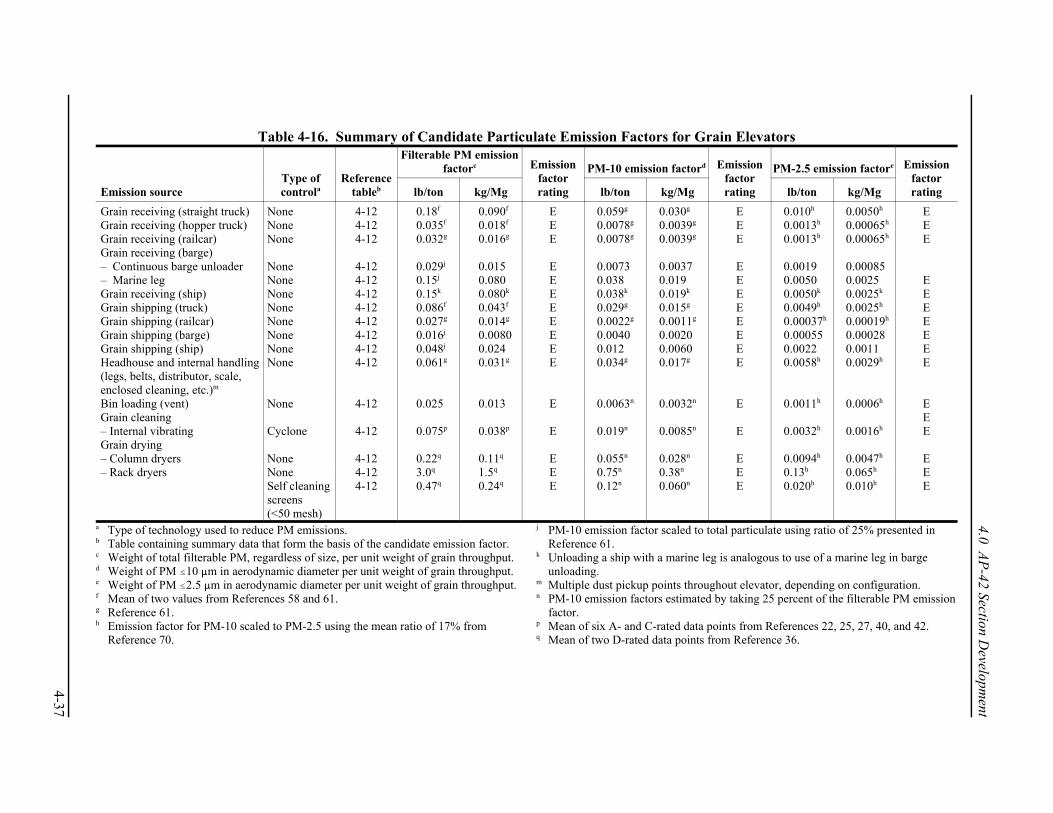
4-37
4.0 AP
-42 Section Developm
ent
Table 4-16. Summary of Candidate Particulate Emission Factors for Grain Elevators
Emission sourceType ofcontrola
Referencetableb
Filterable PM emissionfactorc Emission
factorrating
PM-10 emission factord Emissionfactorrating
PM-2.5 emission factore Emissionfactorratinglb/ton kg/Mg lb/ton kg/Mg lb/ton kg/Mg
Grain receiving (straight truck) None 4-12 0.18f 0.090f E 0.059g 0.030g E 0.010h 0.0050h EGrain receiving (hopper truck) None 4-12 0.035f 0.018f E 0.0078g 0.0039g E 0.0013h 0.00065h EGrain receiving (railcar) None 4-12 0.032g 0.016g E 0.0078g 0.0039g E 0.0013h 0.00065h EGrain receiving (barge)– Continuous barge unloader– Marine leg
NoneNone
4-124-12
0.029j
0.15j0.0150.080
EE
0.00730.038
0.00370.019
EE
0.00190.0050
0.000850.0025 E
Grain receiving (ship) None 4-12 0.15k 0.080k E 0.038k 0.019k E 0.0050k 0.0025k EGrain shipping (truck) None 4-12 0.086f 0.043f E 0.029g 0.015g E 0.0049h 0.0025h EGrain shipping (railcar) None 4-12 0.027g 0.014g E 0.0022g 0.0011g E 0.00037h 0.00019h EGrain shipping (barge) None 4-12 0.016j 0.0080 E 0.0040 0.0020 E 0.00055 0.00028 EGrain shipping (ship) None 4-12 0.048j 0.024 E 0.012 0.0060 E 0.0022 0.0011 EHeadhouse and internal handling(legs, belts, distributor, scale,enclosed cleaning, etc.)m
None 4-12 0.061g 0.031g E 0.034g 0.017g E 0.0058h 0.0029h E
Bin loading (vent) None 4-12 0.025 0.013 E 0.0063n 0.0032n E 0.0011h 0.0006h EGrain cleaning E– Internal vibrating Cyclone 4-12 0.075p 0.038p E 0.019n 0.0085n E 0.0032h 0.0016h EGrain drying– Column dryers None 4-12 0.22q 0.11q E 0.055n 0.028n E 0.0094h 0.0047h E– Rack dryers None 4-12 3.0q 1.5q E 0.75n 0.38n E 0.13h 0.065h E
Self cleaningscreens(<50 mesh)
4-12 0.47q 0.24q E 0.12n 0.060n E 0.020h 0.010h E
a Type of technology used to reduce PM emissions. b Table containing summary data that form the basis of the candidate emission factor.c Weight of total filterable PM, regardless of size, per unit weight of grain throughput.d Weight of PM #10 :m in aerodynamic diameter per unit weight of grain throughput.e Weight of PM #2.5 :m in aerodynamic diameter per unit weight of grain throughput.f Mean of two values from References 58 and 61.g Reference 61.h Emission factor for PM-10 scaled to PM-2.5 using the mean ratio of 17% from
Reference 70.
j PM-10 emission factor scaled to total particulate using ratio of 25% presented inReference 61.
k Unloading a ship with a marine leg is analogous to use of a marine leg in bargeunloading.
m Multiple dust pickup points throughout elevator, depending on configuration.n PM-10 emission factors estimated by taking 25 percent of the filterable PM emission
factor.p Mean of six A- and C-rated data points from References 22, 25, 27, 40, and 42.q Mean of two D-rated data points from Reference 36.
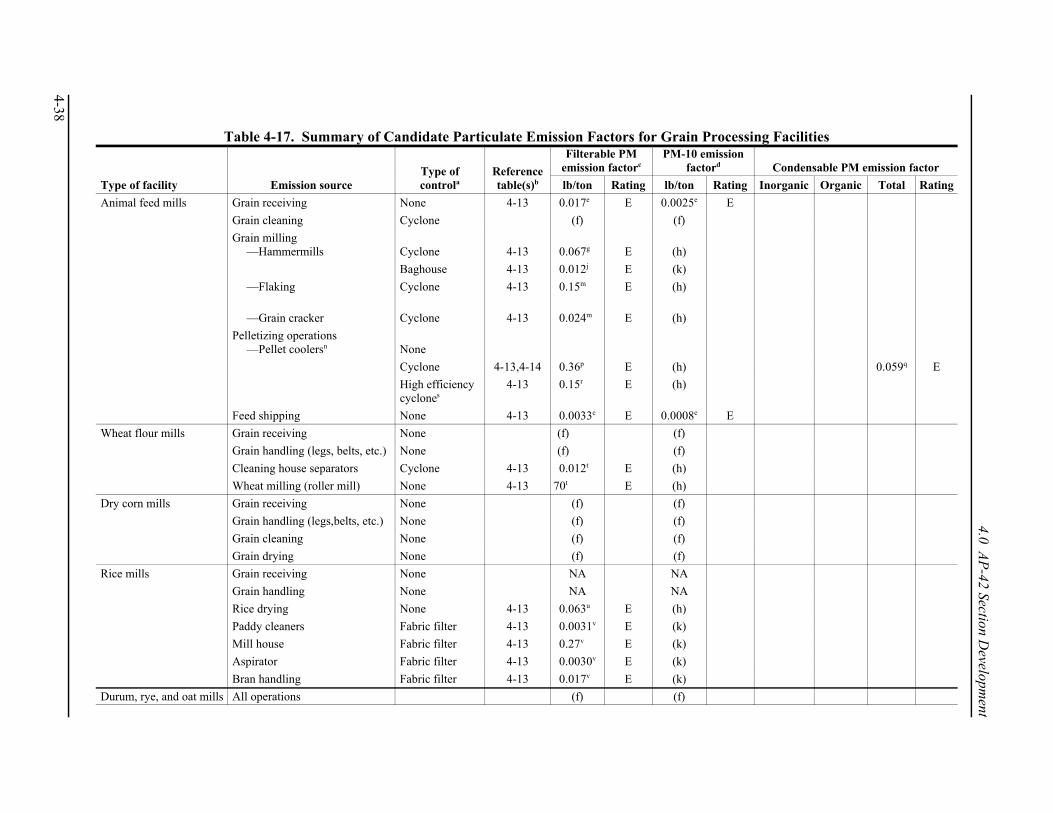
4-38
4.0 AP
-42 Section Developm
ent
Table 4-17. Summary of Candidate Particulate Emission Factors for Grain Processing Facilities
Type of facility Emission sourceType ofcontrola
Referencetable(s)b
Filterable PMemission factorc
PM-10 emissionfactord Condensable PM emission factor
lb/ton Rating lb/ton Rating Inorganic Organic Total Rating
Animal feed mills Grain receiving None 4-13 0.017e E 0.0025e E
Grain cleaning Cyclone (f) (f)
Grain milling—Hammermills Cyclone 4-13 0.067g E (h)
Baghouse 4-13 0.012j E (k)
—Flaking Cyclone 4-13 0.15m E (h)
—Grain cracker Cyclone 4-13 0.024m E (h)
Pelletizing operations—Pellet coolersn None
Cyclone 4-13,4-14 0.36p E (h) 0.059q E
High efficiencycyclones
4-13 0.15r E (h)
Feed shipping None 4-13 0.0033e E 0.0008e E
Wheat flour mills Grain receiving None (f) (f)
Grain handling (legs, belts, etc.) None (f) (f)
Cleaning house separators Cyclone 4-13 0.012t E (h)
Wheat milling (roller mill) None 4-13 70t E (h)
Dry corn mills Grain receiving None (f) (f)
Grain handling (legs,belts, etc.) None (f) (f)
Grain cleaning None (f) (f)
Grain drying None (f) (f)
Rice mills Grain receiving None NA NA
Grain handling None NA NA
Rice drying None 4-13 0.063u E (h)
Paddy cleaners Fabric filter 4-13 0.0031v E (k)
Mill house Fabric filter 4-13 0.27v E (k)
Aspirator Fabric filter 4-13 0.0030v E (k)
Bran handling Fabric filter 4-13 0.017v E (k)
Durum, rye, and oat mills All operations (f) (f)
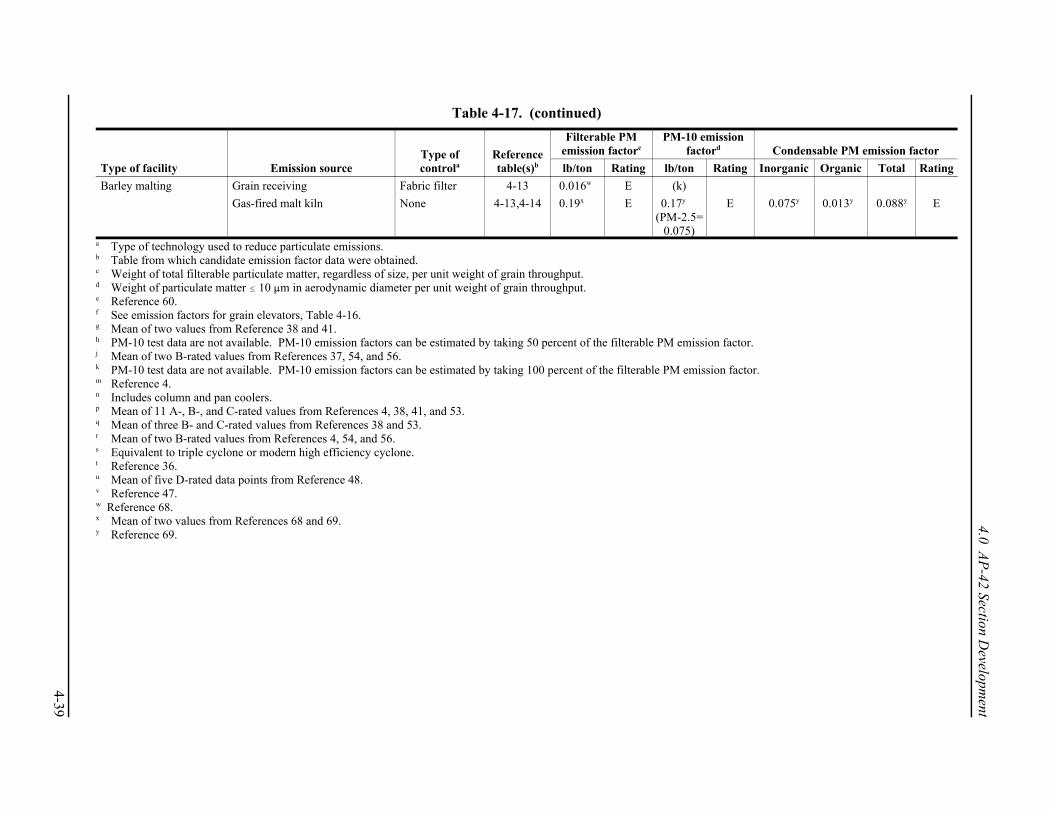
4-39
4.0 AP
-42 Section Developm
ent
Type of facility Emission sourceType ofcontrola
Referencetable(s)b
Filterable PMemission factorc
PM-10 emissionfactord Condensable PM emission factor
lb/ton Rating lb/ton Rating Inorganic Organic Total Rating
Table 4-17. (continued)
Barley malting Grain receiving Fabric filter 4-13 0.016w E (k)
Gas-fired malt kiln None 4-13,4-14 0.19x E 0.17y
(PM-2.5=0.075)
E 0.075y 0.013y 0.088y E
a Type of technology used to reduce particulate emissions. b Table from which candidate emission factor data were obtained. c Weight of total filterable particulate matter, regardless of size, per unit weight of grain throughput.d Weight of particulate matter # 10 :m in aerodynamic diameter per unit weight of grain throughput.e Reference 60.f See emission factors for grain elevators, Table 4-16.g Mean of two values from Reference 38 and 41.h PM-10 test data are not available. PM-10 emission factors can be estimated by taking 50 percent of the filterable PM emission factor.j Mean of two B-rated values from References 37, 54, and 56.k PM-10 test data are not available. PM-10 emission factors can be estimated by taking 100 percent of the filterable PM emission factor.m Reference 4.n Includes column and pan coolers.p Mean of 11 A-, B-, and C-rated values from References 4, 38, 41, and 53.q Mean of three B- and C-rated values from References 38 and 53.r Mean of two B-rated values from References 4, 54, and 56. s Equivalent to triple cyclone or modern high efficiency cyclone.t Reference 36.u Mean of five D-rated data points from Reference 48.v Reference 47.w Reference 68.x Mean of two values from References 68 and 69.y Reference 69.
4.0 AP-42 Section Development
4-40
A filterable PM emission factor was developed for uncontrolled grain receiving by hopper truck. The emission factor was developed for mixed grains. The mixed grain factor is the mean of two B-ratedvalues from Table 4-12. Because the factor is developed from a limited number of facilities, theemission factor is rated E. A PM-10 emission factor for grain receiving by hopper truck was developedfrom one B-rated value from Table 4-12. Because this factor was developed from one test problem atgrain elevators, the emission factor is rated E.
A filterable PM emission factor was developed for uncontrolled grain receiving by hopper-bottom railcar. The emission factor was developed for mixed grains. The mixed grain factor isdeveloped from a single B-rated value from Table 4-12. Because the factor is developed from one value,the emission factor is rated E. A PM-10 emission factor for grain receiving by hopper-bottom railcar wasdeveloped from one B-rated value from Table 4-12. Because this factor was also developed from onevalue, the emission factor is rated E.
Filterable PM, PM-10, and PM-2.5 emission factors were developed for uncontrolled grainreceiving by barges using continuous barge unloaders and marine legs. The emission factors for PM-10and PM-2.5 were developed for mixed grains, each from a single B-rated value from Table 4-12. Because these factors are developed from one value, the emission factors are rated E. The filterable PMemission factors were developed from the PM-10 emission factors, by scaling up the PM-10 emissionfactors using a ratio of 25 percent. Because grain receiving by ship is analogous to barge receiving bymarine leg, the same emission factors developed for barge receiving by marine leg can be used forreceiving by ship.
A filterable PM emission factor was developed for uncontrolled grain shipping by truck. Theemission factor was developed for mixed grains. The mixed grain factor is the mean of two B-ratedvalues from Table 4-12. Because the factor is developed from only two values, the emission factor israted E. A PM-10 emission factor for grain shipping by truck was also developed from one B-rated valuefrom Table 4-12. Because this factor was developed from a single source test program, the emissionfactor is rated E.
A filterable PM emission factor was developed for uncontrolled grain shipping by railcar. Theemission factor was developed for mixed grains. The mixed grain factor is developed from a singleB-rated value from Table 4-12. The emission factor is rated E. A PM-10 emission factor for grainshipping by railcar was also developed from one B-rated value from Table 4-12; the emission factor israted E.
Filterable PM, PM-10, and PM-2.5 emission factors were developed for uncontrolled grainshipping by barges and ships. The emission factors for PM-10 and PM-2.5 were developed for mixedgrains, each from a single B-rated value from Table 4-12. Because these factors are developed from onevalue, the emission factors are rated E. The filterable PM emission factors were developed from the PM-10 emission factors, by scaling up the PM-10 emission factors using a ratio of 25 percent.
A filterable PM emission factor was developed for uncontrolled grain internal handlingoperations. The emission factor was developed for mixed grains. The mixed grain factor is developedfrom a single B-rated value from Table 4-12; the emission factor is rated E. A PM-10 emission factor forgrain internal handling operations was also developed from one B-rated value from Table 4-12; theemission factor is rated E.
A filterable PM emission factor for uncontrolled bin vent emissions from bin loading wasdeveloped. The emission factor was developed from data on wheat and sorghum loading and is based onone B-rated value from Table 4-12. The emission factor is rate E.

4.0 AP-42 Section Development
4-41
A filterable PM emission factor was developed for cyclone-controlled grain cleaning operations. An emission factor was developed for mixed grains. Two A-rated data points and four C-rated datapoints from Table 4-12 were combined. The emission factor is rated E because it is not representative ofall facilities.
A filterable PM emission factor was developed for uncontrolled grain column dryers for corn. The emission factor is the average of two D-rated data points from Table 4-12. Because the emissionfactor was generated from D-rated data, the emission factor is rated E.
Two filterable PM emission factors were developed for rack dryers, one for emissions from corndrying with no control and one for emissions from corn drying with self-cleaning screens. Each emissionfactor is the average of two D-rated data points from Table 4-12. Because all data used to develop thesefactors are rated D, the emission factors are rated E.
In general, the emission factors for grain processing facilities were obtained by extracting asingle value or by averaging two or three values from Table 4-13 or Table 4-14. These emission factorsare generally rated E. The primary exceptions are animal feed pellet coolers and rice dryers. Thedevelopment of these emission factors is discussed below.
A filterable PM emission factor was developed for cyclone-controlled animal feed pellet coolers. The emission factor is the average of eleven A-, B-, and C-rated data points from Table 4-13. Becausemost of the data are C-rated and because emissions from individual facilities vary by a factor of 25, theemission factor is rated E.
A single filterable PM emission factor was developed for screen-type rice dryers using thearithmetic average of five data points from Table 4-13. Because all five data points were D-rated, theemission factor is rated E.
The data from References 67, 68, and 69 were used to develop emission factors for malted barleyproduction. The data are summarized in Table 4-13 and these candidate emission factors for inclusion inAP-42 are presented in Table 4-17. All of the emission factors are assigned E ratings because they weredeveloped using data from only one or two tests. The development of the individual emission factors isdiscussed below.
An emission factor was developed for filterable PM from fabric filter-controlled barleyunloading operations. This factor is based on two C-rated tests conducted at the same facility. Emissionfactors were developed for filterable PM, condensable inorganic and organic PM, PM-10, and PM-2.5from indirect-, natural gas-fired malt kilns using B-rated data from Reference 69. One additional C-ratedtest (Reference 68) was conducted for filterable PM from malt kilns, but the data were not used becausethey are inconsistent with the Reference 69 test.
Although every attempt was made to provide an emission factor for every source addressed in thecurrent version of AP-42 Section 9.9.1, data were sometimes insufficient to allow calculation of anemission factor. Also, a number of the uncontrolled factors have been changed and/or rated differentlyfrom the current version of AP-42. Noteworthy variations from the existing AP-42 section are describedin the paragraphs below.
In the revised AP-42 section, emission factors for PM-10 and PM-2.5 are based on source testdata, where the data are available. For uncontrolled and cyclone-controlled filterable PM sources, whereno PM-10 or PM-2.5 data are available, emissions can be estimated using the following factors. Basedon the data provided in Reference 66, emission factors for PM-10 from grain processing sources can be
4.0 AP-42 Section Development
4-42
estimated as 50 percent of the corresponding PM emission factor. Based on the data presented inReference 61, PM-10 emission factors for grain elevators can be estimated as 25 percent of thecorresponding PM emission factor. Finally, emission factors for PM-2.5 emissions from grain elevatorscan be estimated as 17 percent of the corresponding PM-10 emission factor, based on the data providedin Reference 70. For fabric filter-controlled sources of filterable PM where no PM-10 emission data areavailable, PM-10 emission factors are assumed to be 100 percent of the filterable PM emission factors forgrain processing sources. These assumed values will be replaced as additional PM-10 and particle sizingdata become available.
Some of the current uncontrolled factors were actually based on a back-calculation from cyclone-controlled emissions using an assumed control efficiency for the collector. This approach was not usedhere. As mentioned in the individual report reviews, it is generally agreed that emission measurementstaken at the inlet of a control device do not accurately reflect emissions from uncontrolled sources. It isagreed that the emission estimates based on control device inlet data are biased high for uncontrolledemissions at operations not equipped with aspiration systems. Therefore, control device inlet data havenot been used in this report to estimate uncontrolled emissions. The controlled values are presented,however, and rated according to the criteria specified in Section 3 of this report.
Tables 4-16 and 4-17 have been incorporated in the revised AP-42 section shown in Section 5 ofthis report as Tables 9.4-1 and 9.4-2, respectively. Appropriate modifications have also been made in thetext to reflect these revisions.
4.4 References for Section 4
1. G. LaFlam, Documentation for AP-42 Emission Factors: Section 6.4, Grain Elevators andProcessing Plants, Final Report, EPA Contract No. 68-02-3887, Work Assignment No. 54, PacificEnvironmental Service Inc., Durham, North Carolina.
2. Letter from David Bossman, American Feed Industry Association to Frank Noonan, U.S.Environmental Protection Agency, Research Triangle Park, North Carolina, July 24, 1987.
3. Letter from Paul Luther, Purina Mills, Inc. to Frank Noonan, U.S. Environmental ProtectionAgency, Research Triangle Park, North Carolina, July 8, 1987.
*4. Letters (plus attachments) from Paul Luther, Purina Mills, Inc. to Greg LaFlam, PacificEnvironmental Service Inc., Durham, North Carolina, March 11 and August 28, 1987.
5. R. F. Ambler et al., Feed Manufacturing Technology III, American Feed Industry Association,Arlington, Virginia, 1985.
6. GCA/Technology Division, Emission Factor Development for Ship and Barge Loading of Grain,Revised Draft Final Report, EPA Contract No. 68-02-3510, Work Assignment No. 46, U.S.Environmental Protection Agency, Research Triangle Park, North Carolina, October 1984.
7. Source Category Survey: Animal Feed Dryers, EPA-450/3-81-017, U.S. EnvironmentalProtection Agency, Research Triangle Park, North Carolina, December 1981.
8. J. M. Appold, “Dust Control for Grain Dryers.” Chapter 11 in Dust Control for Grain Elevators,National Feed and Grain Association, Washington, DC, May 7-8, 1981.
4.0 AP-42 Section Development
4-43
9. V. Ramanathan and D. Wallace, Review of Compliance Monitoring Programs with Respect toGrain Elevators, Final Report, EPA Contract No. 68-01-4139, Tasks 12 and 14, U.S.Environmental Protection Agency, Research Triangle Park, North Carolina, March 1980.
10. W. Battye and R. R. Hall, Particulate Emission Factors and Feasibility of Emission Controls forShiploading Operations at Portland, Oregon Grain Terminals, Volume I, Final Report, EPAContract No. 68-01-4143, Task Order Nos. 24 and 47, U.S. Environmental Protection Agency,Research Triangle Park, North Carolina, June 1979.
*11. H. J. Taback et al., Fine Particle Emissions from Stationary and Miscellaneous Sources in theSouth Coast Air Basin. Final Report, PB-293 923, California Air Resources Board, Sacramento,California, February 1979.
12. W. Battye et al., Grain Dust Levels Caused by Tent Control of Ship Loading Emissions Comparedto Minimum Explosive Levels, Draft Final Report, EPA Contract No. 68-01-4143, Task Order 47,U.S. Environmental Protection Agency, Washington, DC, December 1978.
13. J. Zoller et al., Assessment of Fugitive Particulate Emission Factors for Industrial Processes,EPA-450/3-78-107, U.S. Environmental Protection Agency, Research Triangle Park, NorthCarolina, September 1978.
14. D. R. Goodwin, Standards Support and Environmental Impact Statement, Volume 2: PromulgatedStandards of Performance for Grain Elevator Industry, EPA-450/2-77-001b, U.S. EnvironmentalProtection Agency, Research Triangle Park, North Carolina, April 1978.
15. R. Johnson et al., Emission Tests at Adolph Coors Company No. 4 Coal-Fired Steam Generator,Report No. 77-SPP-17, U. S. Environmental Protection Agency, Research Triangle Park, NorthCarolina, July 26, 1977.
16. R. A. Wachter and T. R. Blackwood, Source Assessment: Harvesting of Grain, State of the Art, EPA-600/2-77-107f, U.S. Environmental Protection Agency, Research Triangle Park, NorthCarolina, July 1977.
17. Research Corporation of New England, Determining Input Variables for Calculation of Impact ofNew Source Performance Standards: Worksheets for Food and Agricultural Industries, EPA-450/3-76-018c, U.S. Environmental Protection Agency, Research Triangle Park, NorthCarolina, April 1977.
*18. P. Lonnes, Results of Particulate Emission Compliance Testing at the Peavey Company in ValleyCity, North Dakota, Conducted March 16-18, 1977, Interpoll Inc., St. Paul, Minnesota, April 15,1977.
19. Technical Guidance for Control of Industrial Process Fugitive Particulate Emissions, EPA-450/3-77-010, U. S. Environmental Protection Agency, Research Triangle Park, NorthCarolina, March 1977.
20. Standards Support and Environmental Impact Statement, Volume 1: Proposed Standards ofPerformance for Grain Elevator Industry, EPA-450/2-77-001a, U.S. Environmental ProtectionAgency, Research Triangle Park, North Carolina, January 1977.
4.0 AP-42 Section Development
4-44
21. M. P. Schrag et al., Source Test Evaluation for Feed and Grain Industry, EPA-450/3-76-043,U.S. Environmental Protection Agency, Research Triangle Park, North Carolina, December 1976.
*22. F. J. Belgea, Dust Control Systems Performance Test, Pollution Curbs, Inc., St. Paul, Minnesota,July 15, 1976.
*23. W. H. Maxwell, Stationary Source Testing of a Country Grain Elevator at the Great BendCooperative Association Elevator B, Great Bend, Kansas, Final Report, Contract No. 68-02-1403,Task 19, Midwest Research Institute, Kansas City, Missouri, April 29, 1976.
24. W. H. Maxwell, Stationary Source Testing of a Country Elevator-Overbrook, Kansas, FinalReport, EPA Contract No. 68-02-1403, Tasks 15 and 18, Midwest Research Institute, Kansas City,Missouri, February 19, 1976.
*25. A. L. Trowbridge, Particulate Emissions Testing, ERC Report No. 4-7683, EnvironmentalResearch Corporation, St. Paul, Minnesota, January 16, 1976.
26. J. M. Willenberg et al., Air Pollution Emissions from Eastern Washington Grain Elevators,Annual Meeting of the Pacific Northwest International Section of the Air Pollution ControlAssociation, November 19-21, 1975.
*27. C. S. Hulburt, Particulate Emissions Evaluation and Performance Test of the Dust ControlSystems at Farmers Coop Elevator in Enderlin, North Dakota, Pollution Curbs Inc., St. Paul,Minnesota, October 23, 1974.
28. Emission Factor Development for the Feed and Grain Industry, EPA-450/3-75-054, U.S.Environmental Protection Agency, Research Triangle Park, North Carolina, October 1974.
29. Emissions Control in the Grain and Feed Industry: Volume II. Emissions Inventory, EPA-450/3-73-003b, U.S. Environmental Protection Agency, Research Triangle Park, North Carolina,September 1974.
30. P. G. Gorman, Potential Dust Emissions from a Grain Elevator in Kansas City, Missouri, FinalReport, EPA Contract No. 68-02-0228, Task No. 24, Midwest Research Institute, Kansas City,Missouri, May 1974.
31. Storage and Handling of Grain. Final Report, Contract No. 68-02-1355, Task Order No. 7,PEDCo-Environmental Specialists Inc., March 1974.
32. Development Document for Effluent Guidelines and New Performance Standards for the GrainProcessing Segment of the Grain Mills Point Source Category, EPA-440/1-74-028a, U.S.Environmental Protection Agency, Washington, DC, March 1974.
33. Valentine, Fisher, and Tomlinson, Air Pollution Emission Test, Cargill, Inc., Seattle, Washington, EMB Test No. 73-GRN-8, U.S. Environmental Protection Agency, Research Triangle Park, NorthCarolina, January 1974.
34. F. J. Belgea, Dust Collector Emission and Efficiency Evaluation at the Marquette Elevator,Pollution Curbs Inc., St. Paul, Minnesota, January 29, 1974.
4.0 AP-42 Section Development
4-45
35. Battelle Memorial Institute, Air Pollution Emission Test, Bunge Corporation, Destrehan,Louisiana, EMB Test No. 74-GRN-7, U.S. Environmental Protection Agency, Research TrianglePark, North Carolina, January 1974.
*36. L. J. Shannon et al., Emissions Control in the Grain and Feed Industry, Volume I: Engineeringand Cost Study, EPA-450/3-73-003a, U.S. Environmental Protection Agency, Research TrianglePark, North Carolina, December 1973.
*37. W. D. Snowden, Atmospheric Emission Evaluation, Mayflower Farms Grain and Feed MillingPlant, Portland, Oregon, Test No. 72-CI-34(GRN), U.S. Environmental Protection Agency,Research Triangle Park, North Carolina, February 8, 1973.
*38. R. W. Gerstle and R. S. Amick, Test Number 73-GRN-1, Ralston Purina Company, Louisville,Kentucky, Final Report, EPA Contract No. 68-02-0237, Task 17, U.S. Environmental ProtectionAgency, Research Triangle Park, North Carolina, 1972.
39. Environmental Engineering Inc., Source Test Report on Measurement of Emissions from Cargill,Inc., Fayetteville, North Carolina, Test No. 72-CI-33(GRN), U.S. Environmental ProtectionAgency, Research Triangle Park, North Carolina, 1972.
*40. F. J. Belgea, Grain Handling Dust Collection Systems Evaluation for Farmer’s Elevator Company,Minot, North Dakota, Pollution Curbs Inc., St. Paul, Minnesota, August 28, 1972.
*41. Environmental Engineering Inc., Source Test Report on Measurement of Emissions from Cargill,Inc., Sioux City, Iowa, Test No. 72-CI-28(GRN), U. S. Environmental Protection Agency,Research Triangle Park, North Carolina, 1972.
*42. F. J. Belgea, Cyclone Emissions and Efficiency Evaluation, Pollution Curbs Inc., St. Paul,Minnesota, March 10, 1972.
43. M. F. Fuller, Particulate Emission Tests on Cyclone Exhaust at Pillsbury Operated GrainElevator in Curren, Illinois, Report No. 26-6-171, Industrial Testing Laboratories Inc., St. Louis,Missouri, June 1972.
44. W. E. Clark, Sampling of Grain Elevators in Kansas City to Determine Particulate Emissions tothe Atmosphere, Final Report, Midwest Research Institute, Kansas City, Missouri, October 20,1966.
45. Letter from Thomas C. O’Connor, National Grain and Feed Association, to Dallas Safriet, U. S.Environmental Protection Agency, Research Triangle Park, North Carolina, November 24, 1993.
46. F. S. Lai, C. R. Martin, and B. S. Miller, Examining the Use of Additives to Control Grain Dust. Final Report to National Grain and Feed Association. U. S. Department of Agriculture,Manhattan, Kansas, June 1982.
*47. Thomas Rooney. Emission Performance Testing of a Rice Mill, Western Environmental Services,Redondo Beach, CA, March 1992.
*48. Letter from W. James Wagoner, Butte County Air Pollution Control Agency to Dallas Safriet, U.S. Environmental Protection Agency, Research Triangle Park, NC. October 11, 1993.
4.0 AP-42 Section Development
4-46
49. Report on Emissions from Rice Dryers in the Sacramento Valley Air Basin, CARB ReportNo. 74-8-8. California Air Resources Board, Sacramento, CA, April 1974.
50. Letter from D. Marlin Brandon, California Cooperative Rice Research Foundation, Inc. to R. M.Sandrock, Farmers Rice Cooperative, Sacramento, CA, October 22, 1993.
51. J. W. Johnson et al., A Computer-Based Cascade Impactor Data Reduction System,EPA-600/7-78-042, U. S. Environmental Protection Agency, Research Triangle Park, NorthCarolina, March 1978.
52. J. S. Kinsey, Lime and Cement Industry Particulate Emissions: Source Category Report,Volume II, Cement Industry, EPA-600/7-87-007, U. S. Environmental Protection Agency,Research Triangle Park, North Carolina, February 1987.
*53. Report Of Particulate Emissions Tests For Stockton Hay And Grain Company, EnvironmentalResearch Group, Inc., Emeryville, CA, September 1983.
*54. Particulate Emission Testing For Wayne Farms Sandersville, Mississippi, Air Systems Testing,Inc., Marietta, GA, September 1-2, 1992.
55. Letter from Brian L. Bursiek, American Feed Industry Association to Dallas Safriet, U.S.Environmental Protection Agency, Research Triangle Park, North Carolina, October 23, 1995.
*56. Report Of Particulate Emissions Tests For Wayne Farms Laurel Feed Mill, Laurel, Mississippi,Environmental Monitoring Laboratories, Ridgeland, MS, August 29 and September 20, 1994.
57. Tests of Oil Suppression Of PM-10 At Grain Elevators, Test Report, Midwest Research Institute,Kansas City, MO, November 1994.
*58. P. Kenkel and R. Noyes, “Grain Elevator Dust Emission Study”, Oklahoma State University,Stillwater, OK, October 21, 1994 and “Clarifying Response To MRI Report On OSU DustEmission Study”, Oklahoma State University, Stillwater, OK, February 13, 1995.
59. Bay Area Air Quality Management District, Summary of Source Test Results, Willowbrook Feeds,Petaluma, California, October 26, 1995.
*60. Emission Factors for Grain Receiving and Feed Loading Operations at Feed Mills, for NationalCattleman’s Beef Association, Texas A&M University, College Station, Texas, September 17,1996.
*61. Emission Factors for Grain Elevators, Final Report to National Grain and Feed Foundation,Midwest Research Institute, Kansas City, Missouri, January, 1997.
62. F. J. Wade, et al., “Investigation To Determine Dust Concentration And Characteristics InsideEnclosed Work Areas And Equipment At Large Grain Terminals”, U. S. Department OfAgriculture, Federal Grain Inspection Service, Kansas City, MO, 1979.
63. G. Ryan and G. Flibbert, “Grain Particulate Study for Eastern Washington Grain HandlingFacilities”, Washington State Department of Ecology, 1994.
4.0 AP-42 Section Development
4-47
64. California Warehouse Association, Pooled Source Test Data, Farmer’s Rice Cooperative, DosPalos, California, July 27, 1989.
65. Southwestern Laboratories, Inc., Compliance Emissions Testing of Center Ship Loading DustCollector Galena Park Facility, Woodhouse Corporation, Galena Park, Texas, ProjectNo. 54-9010-419, January 15, 1991.
66. Letter from Brian L. Bursiek, American Feed Industry Association to Dallas Safriet, U. S.Environmental Protection Agency, Research Triangle Park, North Carolina, November 1, 1995.
67. Compliance Test Report for the Determination of Nowmethane Organic Compound Emissionsfrom the No. 15 Kiln Malt Dryer Exhaust, Prepared for Ladish Malting Company, JeffersonJunction, WI, Fluid Management, Inc., Milwaukee, Wisconsin, December 1995.
*68. H. J. Beaulieu, Final Report Atmospheric Emission Testing Busch Agricultural Resources, Inc.,Idaho Falls Malt Plant, Industrial Hygiene Resources, Ltd., Boise, Idaho, October, 1991.
*69. M. J. Huenink, Total Particulate Emissions Stack Testing of the Kiln 6 Operations at BuschAgricultural Resources, Inc., Manitowoc, Wisconsin, Environmental Technology and EngineeringCorp., Elm Grove, Wisconsin, May 8, 1996.
*70. Emission Factors for Barges and Marine Vessels, Final Test Report to the National Grain and FeedAssociation, Washington, DC, October 2001. (Available as“http:\\www.epa.gov/ttn/chief/ap42/ch09/related/rel_c09s0901.pdf”)
*Contains emission data used in developing emission factors.
4.0 AP-42 Section Development
4-48
This page intentionally left blank.
5.0 Proposed AP-42 Section 9.9.1
5-1
5.0 Proposed AP-42 Section 9.9.1The proposed AP-42 Section 9.9.1, Grain Elevators and Processing Plants, is presented on the
following pages as it would appear in the document.