
Back to the Future Part II - The Greater Cumberland...
41
By: Anirban Basu Sage Policy Group, Inc. September 4 th , 2014 Back to the Future Part II On Behalf of The Greater Cumberland Committee
Transcript of Back to the Future Part II - The Greater Cumberland...

By: Anirban Basu Sage Policy Group, Inc.
September 4th, 2014
Back to the Future Part II
On Behalf of
The Greater Cumberland Committee

Raging Bull (1980)

Estimated Growth in Output by Select Global Areas 2014 Projected*
2.4% 1.3%
2.0% 3.1%
5.4% 7.4%
6.4% 0.2%
2.8% 5.4%
4.7% 1.7%
2.2% 3.2%
1.6% 1.2%
0.3% 1.9%
0.7% 1.1%
1.8%
0.0% 1.0% 2.0% 3.0% 4.0% 5.0% 6.0% 7.0% 8.0%
Mexico Brazil
Latin America and Caribbean Middle East, North Africa, Afghanistan, & Pakistan
India** China
Developing Asia Russia
Central/eastern Europe Sub-Saharan Africa
Emerging/developing countries United States
Canada United Kingdom
Japan Spain
Italy Germany
France Euro area
Advanced economies
Annual % Change
Source: International Monetary Fund, July 2014 WEO Update
*The IMF’s global and regional growth figures for 2014 are based on new purchasing power parity (PPP)
weights derived from the recently released 2011 International Comparison Program survey (see box) and are not
comparable to the 2013 figures reported in the April 2014 WEO
**For India, data and forecasts are presented on a fiscal year basis and output growth is based on GDP at
market prices. Corresponding growth forecasts for GDP at factor cost are 5.4 percent for 2014.

Debt by Selected Country 2013 Estimates*
0.0 50.0 100.0 150.0 200.0 250.0
Saudi Arabia
Russia
China
Indonesia
South Africa
Mexico
Argentina
Brazil
India
Germany
Canada
United Kingdom
France
Spain
United States
Italy
Japan
General Government Gross Debt in Percent of GDP
*IMF Staff Estimates
Source: International Monetary Fund, April 2014 WEO

Rank Exchange Index % Change
4 Tokyo SE Nikkei 225 56.7%
2 Nasdaq NASDAQ Composite 38.3%
1 NYSE Group DJI A 26.5%
6 Frankfurt SE DAX 25.5%
8 Bolsa De Madrid Madrid General 21.4%
12 Swiss Exchange Swiss Market 20.2%
5 Euronext CAC 40 18.0%
10 BorsaItaliana FTSE MIB 16.6%
3 London SE FTSE 100 12.0%
9 TSX Group S&P TSX Composite 9.6%
11 Hong Kong Exchanges Hang Seng Index 2.9%
7 Shanghai SE Shanghai Composite -6.8%
Top 12 Stock Exchanges 2013 Growth*
Source: Yahoo! Finance
*Change from the 2012 close to the 2013 close.

S&P Select Sector Performance 12-Month Percent Change as of August 22, 2014
Source: Standard & Poor’s
0% 5% 10% 15% 20% 25% 30%
Telecommunication Services
Consumer Staples
Utilities
Financials
Consumer Discretionary
Energy
Industrials
Materials
Health Care
Information Technology
5.4%
12.2%
13.7%
15.3%
17.3%
19.0%
19.6%
22.9%
26.7%
29.2%
12-month percent change

Federal Reserve Balance Sheet v. S&P 500 Index May 2008 – August 2014*
Source: Federal Reserve Bank; Yahoo Finance
S&P 500 index depicted in orange
500
700
900
1100
1300
1500
1700
1900
2100
0.8
1.3
1.8
2.3
2.8
3.3
3.8
4.3
4.8
May
-08
Ju
l-0
8
Sep
-08
N
ov-
08
Ja
n-0
9
Mar
-09
M
ay-0
9
Jul-
09
S
ep-0
9
No
v-0
9
Jan
-10
M
ar-1
0
May
-10
Ju
l-10
S
ep-1
0
No
v-10
Ja
n-1
1 M
ar-1
1 M
ay-1
1 Ju
l-11
S
ep-1
1 N
ov-
11
Jan
-12
Mar
-12
May
-12
Jul-
12
Sep
-12
No
v-12
Ja
n-1
3 M
ar-1
3 M
ay-1
3 Ju
l-13
S
ep-1
3 N
ov-
13
Jan
-14
M
ar-1
4
May
-14
Ju
l-14
S&P 500 FRB Credit Reserve $Trillions
*Through 8/27/2014
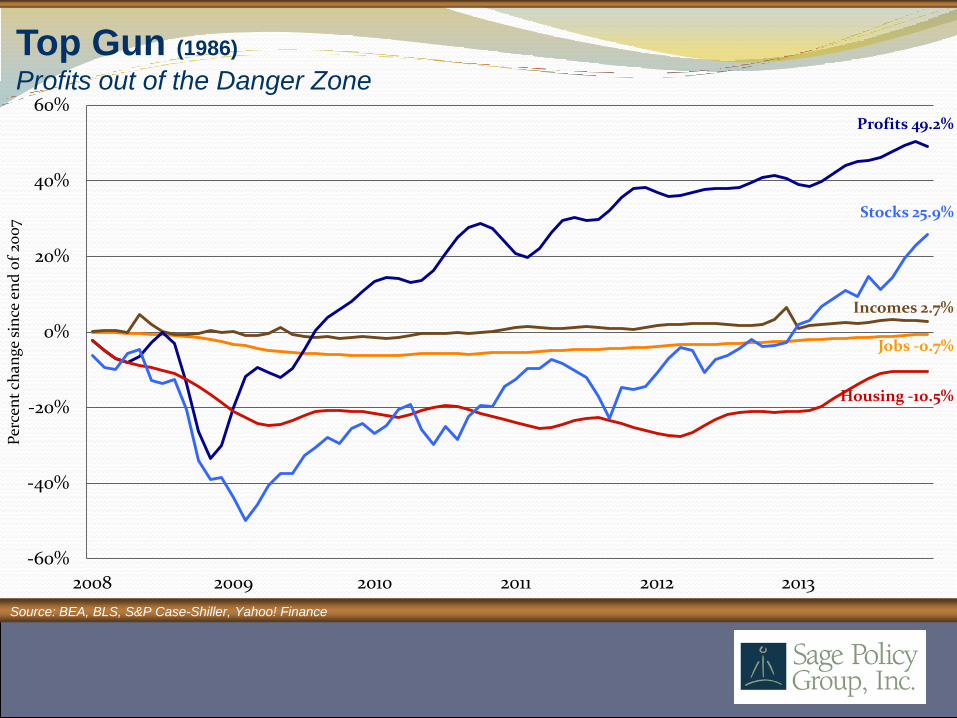
Jobs -0.7%
Incomes 2.7%
Profits 49.2%
Housing -10.5%
Stocks 25.9%
-60%
-40%
-20%
0%
20%
40%
60%
2008 2009 2010 2011 2012 2013
Per
cen
t ch
ange
sin
ce e
nd
of
200
7
Top Gun (1986)
Profits out of the Danger Zone
Source: BEA, BLS, S&P Case-Shiller, Yahoo! Finance
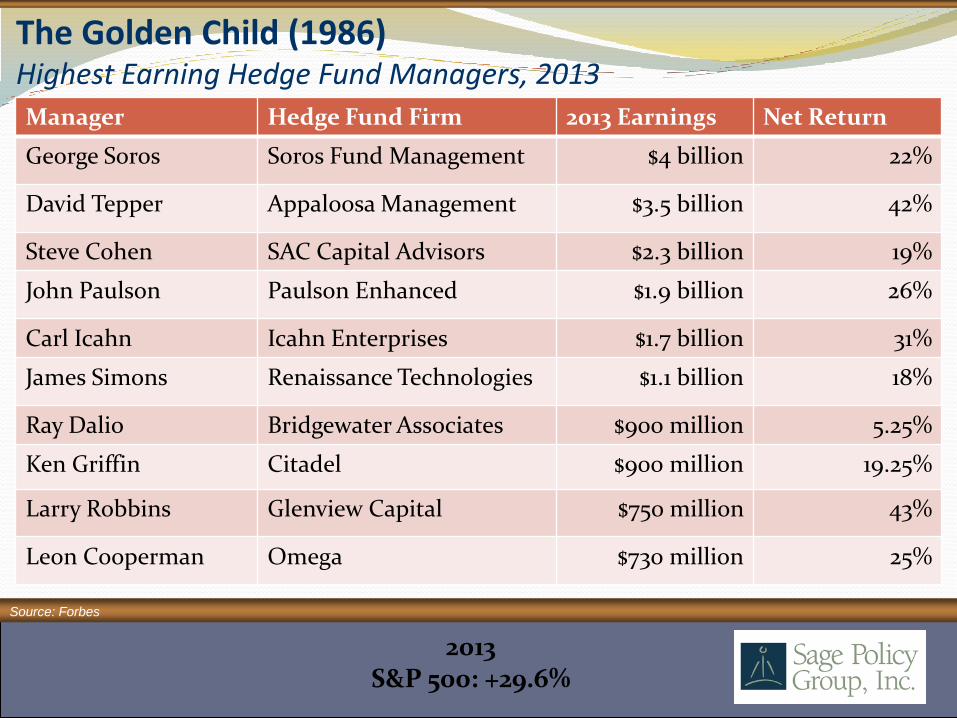
The Golden Child (1986) Highest Earning Hedge Fund Managers, 2013
Source: Forbes
Manager Hedge Fund Firm 2013 Earnings Net Return
George Soros Soros Fund Management $4 billion 22%
David Tepper Appaloosa Management $3.5 billion 42%
Steve Cohen SAC Capital Advisors $2.3 billion 19%
John Paulson Paulson Enhanced $1.9 billion 26%
Carl Icahn Icahn Enterprises $1.7 billion 31%
James Simons Renaissance Technologies $1.1 billion 18%
Ray Dalio Bridgewater Associates $900 million 5.25%
Ken Griffin Citadel $900 million 19.25%
Larry Robbins Glenview Capital $750 million 43%
Leon Cooperman Omega $730 million 25%
2013 S&P 500: +29.6%

Airplane! (1980) David Tepper’s Move against the Market
Source: Forbes, Bloomberg
2013 Appaloosa Management: +$3.5 billion (29.6%)
“Our big play versus the market is airlines. That’s a big play. We’re the biggest holder of all these different airlines. No hedge fund owned as many airlines as we did and not too many people did. Delta, UAL, LCC, US Air, AMR. We owned big percentages in all those stocks. And you know what, they did pretty good… pretty freaking good.” -David Tepper

Source: U.S. Bureau of Labor Statistics
Median Weekly Earnings, Full-Time U.S. Workers* 2000Q2 through 2014Q2
*SA, Constant 1982-1984 dollars (adjusted to CPI-U) Wage and salary workers ages 16+
$320
$325
$330
$335
$340
$345
$350
200
0Q
2
200
0Q
4
200
1Q2
200
1Q4
200
2Q2
200
2Q4
200
3Q2
200
3Q4
200
4Q
2
200
4Q
4
200
5Q2
200
5Q4
200
6Q
2
200
6Q
4
200
7Q2
200
7Q4
200
8Q
2
200
8Q
4
200
9Q
2
200
9Q
4
2010
Q2
2010
Q4
2011
Q2
2011
Q4
2012
Q2
2012
Q4
2013
Q2
2013
Q4
2014
Q2

Source: Moody’s Economy
Recession Watch as of May 2014

Industrial Production January 2001 through July 2014
Source: Federal Reserve
The industrial production index measures the real output of the manufacturing, mining, and electric and gas utilities industries.
80
85
90
95
100
105
Jan
-01
Jul-
01
Jan
-02
Jul-
02
Jan
-03
Jul-
03
Jan
-04
Jul-
04
Jan
-05
Jul-
05
Jan
-06
Jul-
06
Jan
-07
Jul-
07
Jan
-08
Jul-
08
Jan
-09
Jul-
09
Jan
-10
Jul-
10
Jan
-11
Jul-
11
Jan
-12
Jul-
12
Jan
-13
Jul-
13
Jan
-14
Jul-
14
Ind
ex
(20
07
= 1
00
)
(Base year: 2007)
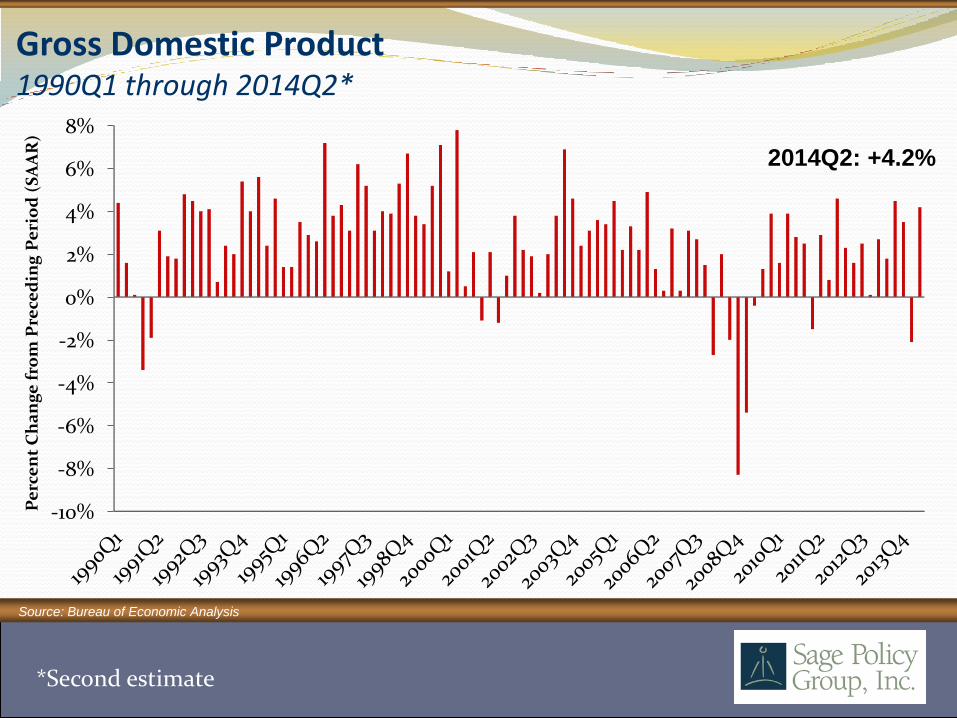
Gross Domestic Product 1990Q1 through 2014Q2*
-10%
-8%
-6%
-4%
-2%
0%
2%
4%
6%
8%
Pe
rce
nt
Ch
an
ge
fro
m P
rece
din
g P
eri
od
(S
AA
R)
2014Q2: +4.2%
Source: Bureau of Economic Analysis
*Second estimate
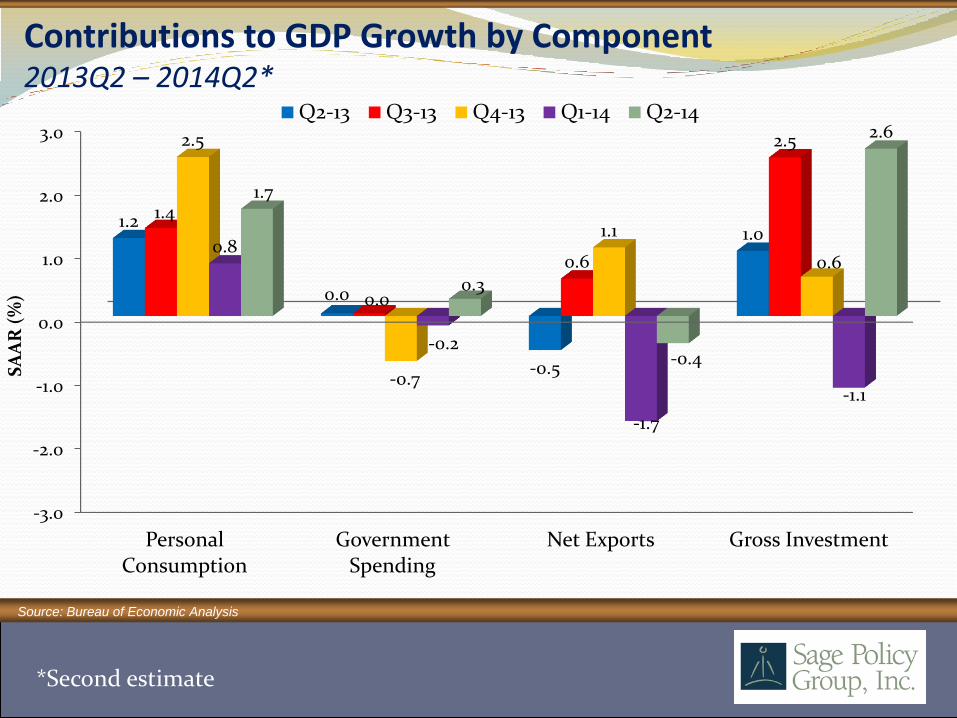
Contributions to GDP Growth by Component 2013Q2 – 2014Q2*
Source: Bureau of Economic Analysis
-3.0
-2.0
-1.0
0.0
1.0
2.0
3.0
Personal Consumption
Government Spending
Net Exports Gross Investment
1.2
0.0
-0.5
1.0 1.4
0.0
0.6
2.5 2.5
-0.7
1.1
0.6 0.8
-0.2
-1.7
-1.1
1.7
0.3
-0.4
2.6
SA
AR
(%
)
Q2-13 Q3-13 Q4-13 Q1-14 Q2-14
*Second estimate

Ordinary People (1980)

-1000
-800
-600
-400
-200
0
200
400
600 F
eb-0
2 Ju
n-0
2 O
ct-0
2 F
eb-0
3 Ju
n-0
3 O
ct-0
3 F
eb-0
4
Jun
-04
O
ct-0
4
Feb
-05
Jun
-05
Oct
-05
Feb
-06
Ju
n-0
6
Oct
-06
F
eb-0
7 Ju
n-0
7 O
ct-0
7 F
eb-0
8
Jun
-08
O
ct-0
8
Feb
-09
Ju
n-0
9
Oct
-09
F
eb-1
0
Jun
-10
O
ct-1
0
Feb
-11
Jun
-11
Oct
-11
Feb
-12
Jun
-12
Oct
-12
Feb
-13
Jun
-13
Oct
-13
Feb
-14
Ju
n-1
4
Th
ou
san
ds
Source: U.S. Bureau of Labor Statistics
July 2014: +209K
Net Change in U.S. Jobs, BLS January 2002 through July 2014

National Nonfarm Employment by Industry Sector July 2013 v. July 2014
-31
48
49
50
91
178
211
375
375
576
648
-200 0 200 400 600 800
Information
Other Services
Mining and Logging
Financial Activities
Government
Manufacturing
Construction
Education and Health Services
Leisure and Hospitality
Trade, Transportation, and Utilities
Professional and Business Services
Thousands, SA
All told 2,570K Jobs gained
Source: U.S. Bureau of Labor Statistics
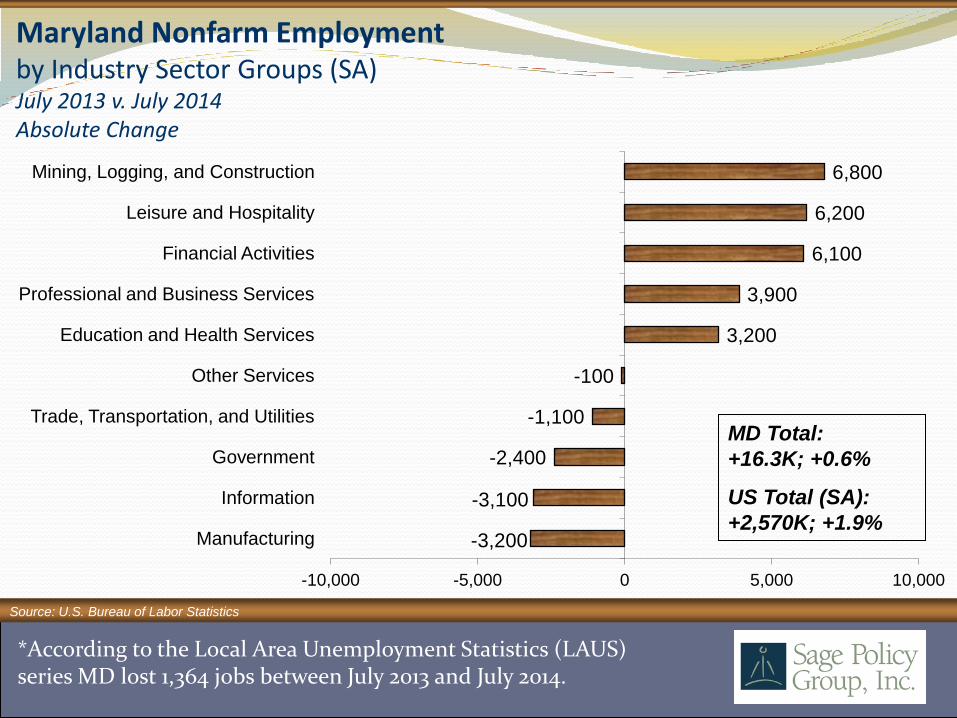
Maryland Nonfarm Employment by Industry Sector Groups (SA) July 2013 v. July 2014 Absolute Change
-3,200
-3,100
-2,400
-1,100
-100
3,200
3,900
6,100
6,200
6,800
-10,000 -5,000 0 5,000 10,000
Manufacturing
Information
Government
Trade, Transportation, and Utilities
Other Services
Education and Health Services
Professional and Business Services
Financial Activities
Leisure and Hospitality
Mining, Logging, and Construction
MD Total:
+16.3K; +0.6%
US Total (SA):
+2,570K; +1.9%
*According to the Local Area Unemployment Statistics (LAUS) series MD lost 1,364 jobs between July 2013 and July 2014.
Source: U.S. Bureau of Labor Statistics

-4,100
-3,800
-2,000
2,100
2,500
3,900
5,600
6,900
13,200
14,500
15,300
-6,000 -1,000 4,000 9,000 14,000
Manufacturing
Information
Government
Mining and Logging
Other Services
Financial Activities
Professional and Business Services
Leisure and Hospitality
Education and Health Services
Trade, Transportation, and Utilities
Construction
Pennsylvania Nonfarm Employment by Industry Sector Groups (NSA) July 2013 v. July 2014 Absolute Change
PA Total (SA):
+54.1K; +0.9%
US Total (SA):
+2,570K; +1.9%
Source: U.S. Bureau of Labor Statistics

-2,200
-2,000
-800
100
200
600
700
1,100
1,900
3,500
4,600
-4,000 -2,000 0 2,000 4,000 6,000
Government
Construction
Trade, Transportation, and Utilities
Other Services
Information
Education and Health Services
Manufacturing
Mining and Logging
Financial Activities
Leisure and Hospitality
Professional and Business Services
West Virginia Nonfarm Employment by Industry Sector Groups (NSA) July 2013 v. July 2014 Absolute Change
WV Total (SA):
+7.7K; +1.0%
US Total (SA):
+2,570K; +1.9%
Source: U.S. Bureau of Labor Statistics

U.S. Year-over-year Percent Change: 1.9%
Employment Growth, U.S. States (SA) July 2013 v. July 2014 Percent Change
RANK STATE % RANK STATE % RANK STATE %
1 NORTH DAKOTA 4.4 18 OKLAHOMA 1.8 31 SOUTH DAKOTA 1.1
2 NEVADA 3.8 19 GEORGIA 1.7 36 KANSAS 1.0
3 UTAH 3.6 19 SOUTH CAROLINA 1.7 36 WEST VIRGINIA 1.0
4 TEXAS 3.5 21 LOUISIANA 1.6 38 PENNSYLVANIA 0.9
5 COLORADO 2.7 21 MINNESOTA 1.6 39 ALABAMA 0.8
5 DELAWARE 2.7 21 WISCONSIN 1.6 39 HAWAII 0.8
5 FLORIDA 2.7 24 KENTUCKY 1.4 39 WYOMING 0.8
8 OREGON 2.6 24 MICHIGAN 1.4 42 VERMONT 0.7
9 ARIZONA 2.4 26 ARKANSAS 1.3 43 CONNECTICUT 0.6
10 WASHINGTON 2.3 26 NEW YORK 1.3 43 ILLINOIS 0.6
11 INDIANA 2.2 28 MAINE 1.2 43 MARYLAND 0.6
11 NORTH CAROLINA 2.2 28 NEW HAMPSHIRE 1.2 43 VIRGINIA 0.6
13 CALIFORNIA 2.1 28 RHODE ISLAND 1.2 47 OHIO 0.5
14 MASSACHUSETTS 2.0 31 DISTRICT OF COLUMBIA 1.1 48 NEBRASKA 0.3
14 MISSOURI 2.0 31 IDAHO 1.1 48 NEW JERSEY 0.3
14 MONTANA 2.0 31 IOWA 1.1 48 NEW MEXICO 0.3
17 TENNESSEE 1.9 31 MISSISSIPPI 1.1 51 ALASKA -0.7
Source: U.S. Bureau of Labor Statistics

U.S. Unemployment Rate: 6.2%
Unemployment Rates, U.S. States (SA) July 2014 RANK STATE % RANK STATE % RANK STATE %
1 NORTH DAKOTA 2.8 17 VIRGINIA 5.4 32 NORTH CAROLINA 6.5
2 NEBRASKA 3.6 19 MAINE 5.5 36 CONNECTICUT 6.6
2 UTAH 3.6 20 MASSACHUSETTS 5.6 36 NEW MEXICO 6.6
4 SOUTH DAKOTA 3.7 20 WASHINGTON 5.6 36 NEW YORK 6.6
4 VERMONT 3.7 22 OHIO 5.7 39 ILLINOIS 6.8
6 HAWAII 4.4 22 PENNSYLVANIA 5.7 40 OREGON 6.9
6 NEW HAMPSHIRE 4.4 22 SOUTH CAROLINA 5.7 41 ALABAMA 7.0
6 WYOMING 4.4 25 WISCONSIN 5.8 41 ARIZONA 7.0
9 IOWA 4.5 26 INDIANA 5.9 43 TENNESSEE 7.1
9 MINNESOTA 4.5 27 MARYLAND 6.1 44 CALIFORNIA 7.4
11 MONTANA 4.6 28 ARKANSAS 6.2 44 DISTRICT OF COLUMBIA 7.4
11 OKLAHOMA 4.6 28 DELAWARE 6.2 44 KENTUCKY 7.4
13 IDAHO 4.8 28 FLORIDA 6.2 47 MICHIGAN 7.7
14 KANSAS 4.9 31 WEST VIRGINIA 6.3 47 NEVADA 7.7
15 TEXAS 5.1 32 ALASKA 6.5 47 RHODE ISLAND 7.7
16 COLORADO 5.3 32 MISSOURI 6.5 50 GEORGIA 7.8
17 LOUISIANA 5.4 32 NEW JERSEY 6.5 51 MISSISSIPPI 8.0 Source: U.S. Bureau of Labor Statistics

Unemployment Rates, 20 Largest Metros (NSA) July 2014
Rank MSA UR Rank MSA UR
1 Minneapolis-St. Paul-Bloomington, MN-WI Metropolitan Statistical Area 4.2 11
Philadelphia-Camden-Wilmington, PA-NJ-DE-MD Metropolitan Statistical Area 6.7
2 Seattle-Tacoma-Bellevue, WA Metropolitan Statistical Area 5.2 12
Chicago-Joliet-Naperville, IL-IN-WI Metropolitan Statistical Area 6.8
3 Washington-Arlington-Alexandria, DC-VA-MD-WV Metropolitan Statistical Area 5.4 12
Tampa-St. Petersburg-Clearwater, FL Metropolitan Statistical Area 6.8
4 Boston-Cambridge-Quincy, MA-NH Metropolitan NECTA 5.5 14
Baltimore-Towson, MD Metropolitan Statistical Area 6.9
4 Dallas-Fort Worth-Arlington, TX Metropolitan Statistical Area 5.5 15
New York-Northern New Jersey-Long Island, NY-NJ-PA Metropolitan Statistical Area 7.0
4 Houston-Sugar Land-Baytown, TX Metropolitan Statistical Area 5.5 16
St. Louis, MO-IL Metropolitan Statistical Area 7.1
7 San Francisco-Oakland-Fremont, CA Metropolitan Statistical Area 5.7 17
Atlanta-Sandy Springs-Marietta, GA Metropolitan Statistical Area 8.0
8 Phoenix-Mesa-Glendale, AZ Metropolitan Statistical Area 6.3 17
Los Angeles-Long Beach-Santa Ana, CA Metropolitan Statistical Area 8.0
9 Miami-Fort Lauderdale-Pompano Beach, FL Metropolitan Statistical Area 6.4 19
Riverside-San Bernardino-Ontario, CA Metropolitan Statistical Area 9.2
10 San Diego-Carlsbad-San Marcos, CA Metropolitan Statistical Area 6.6 20
Detroit-Warren-Livonia, MI Metropolitan Statistical Area 9.8
Source: U.S. Bureau of Labor Statistics

MD County Unemployment Rates July 2014
Rank Jurisdiction UR Rank Jurisdiction UR
1 Montgomery County 5.1 11 Kent County 6.5
2 Howard County 5.2 14 Cecil County 6.6
3 Queen Anne's County 5.5 15 Baltimore County 6.7
4 Frederick County 5.6 16 Prince George's County 6.9
5 Carroll County 5.8 17 Worcester County 7.0
6 Talbot County 5.9 18 Caroline County 7.2
7 Anne Arundel County 6.0 19 Washington County 7.4
8 Calvert County 6.1 20 Allegany County 7.5
9 St. Mary's County 6.3 21 Wicomico County 7.7
10 Garrett County 6.4 22 Dorchester County 8.7
11 Charles County 6.5 23 Somerset County 9.8
11 Harford County 6.5 24 Baltimore City 9.9
Source: U.S. Bureau of Labor Statistics
Source: U.S. Bureau of Labor Statistics
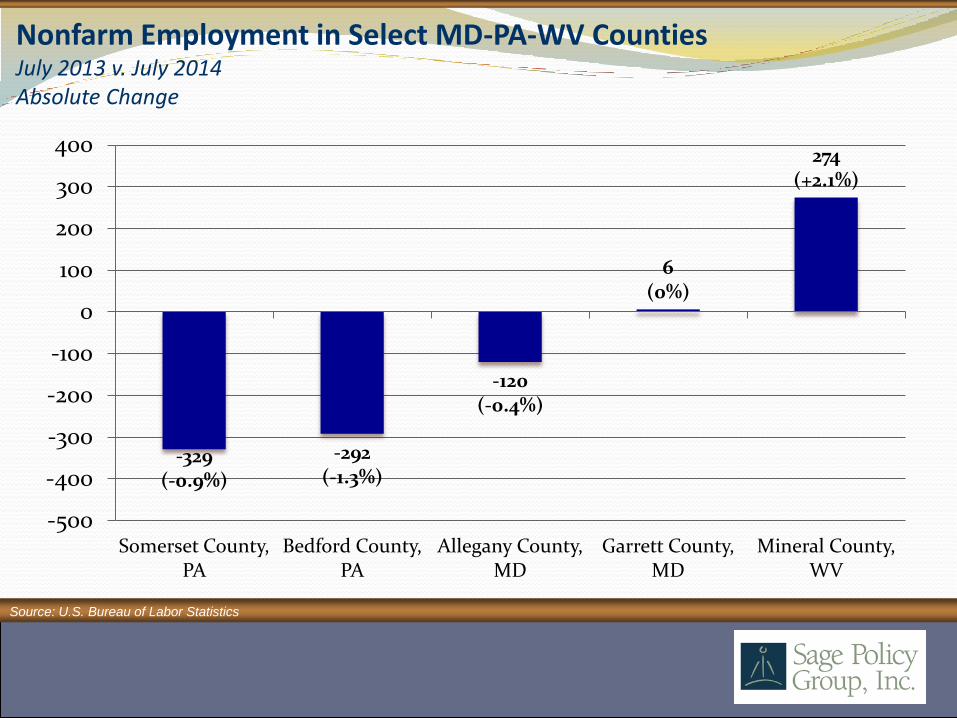
-329 (-0.9%)
-292 (-1.3%)
-120 (-0.4%)
6 (0%)
274 (+2.1%)
-500
-400
-300
-200
-100
0
100
200
300
400
Somerset County, PA
Bedford County, PA
Allegany County, MD
Garrett County, MD
Mineral County, WV
Nonfarm Employment in Select MD-PA-WV Counties July 2013 v. July 2014 Absolute Change
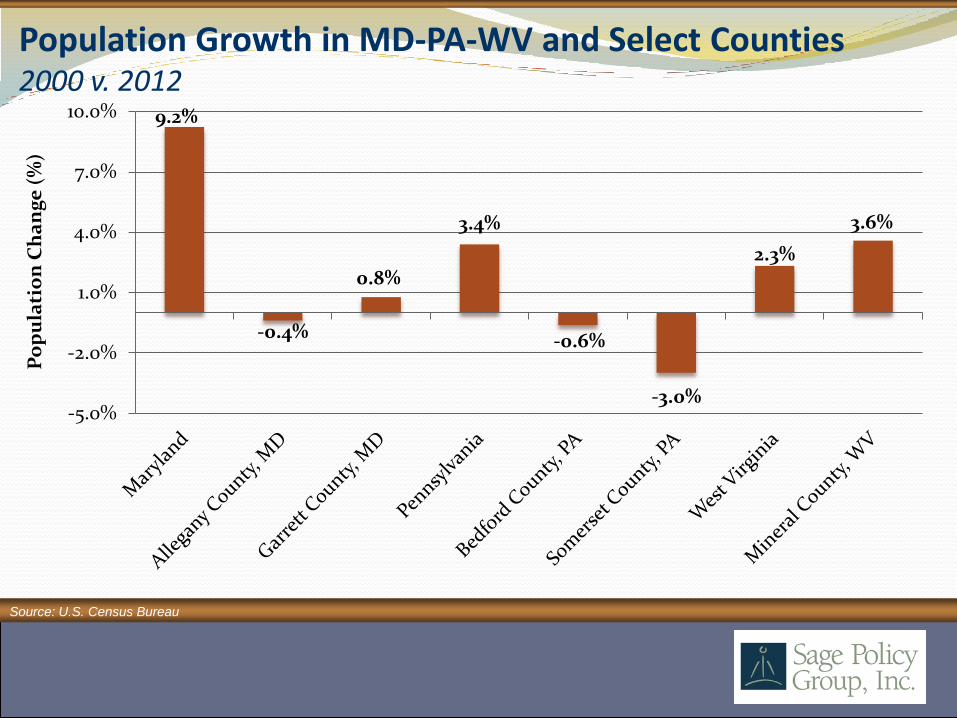
Population Growth in MD-PA-WV and Select Counties 2000 v. 2012
Source: U.S. Census Bureau
9.2%
-0.4%
0.8%
3.4%
-0.6%
-3.0%
2.3%
3.6%
-5.0%
-2.0%
1.0%
4.0%
7.0%
10.0%
Po
pu
lati
on
Ch
an
ge
(%
)

Unemployment Rates in Select MD-PA-WV Counties June 2009 through July 2014
5
6
7
8
9
10
11
12
13
14
Jun
-09
Sep
-09
Dec
-09
Mar
-10
Jun
-10
Sep
-10
Dec
-10
Mar
-11
Jun
-11
Sep
-11
Dec
-11
Mar
-12
Jun
-12
Sep
-12
Dec
-12
Mar
-13
Jun
-13
Sep
-13
Dec
-13
Mar
-14
Jun
-14
Allegany County, MD Garrett County, MD Bedford County, PA Somerset County, PA Mineral County, WV
Source: U.S. Bureau of Labor Statistics
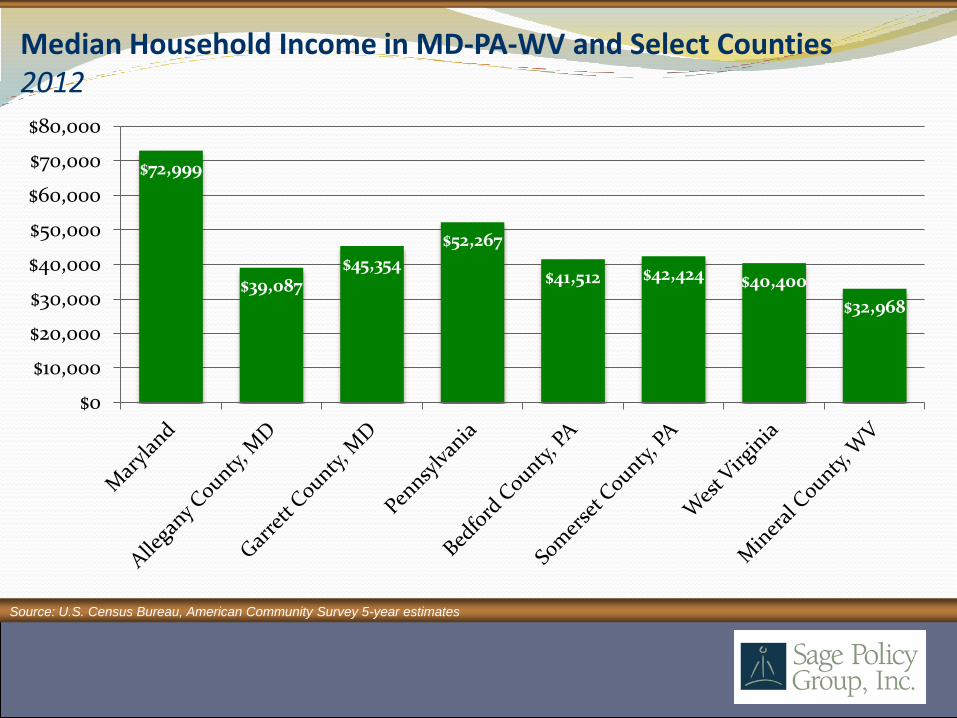
Median Household Income in MD-PA-WV and Select Counties 2012
Source: U.S. Census Bureau, American Community Survey 5-year estimates
$72,999
$39,087 $45,354
$52,267
$41,512 $42,424 $40,400
$32,968
$0
$10,000
$20,000
$30,000
$40,000
$50,000
$60,000
$70,000
$80,000

Field of Dreams (1989)

15-Year & 30-Year Fixed Mortgage Rates February 1995 through August 2014*
Source: Freddie Mac
3.23%
4.10%
1%
2%
3%
4%
5%
6%
7%
8%
9%
10%
Feb
-95
Au
g-9
5
Feb
-96
A
ug
-96
Feb
-97
Au
g-9
7
Feb
-98
A
ug
-98
Feb
-99
A
ug
-99
Feb
-00
A
ug
-00
Feb
-01
Au
g-0
1
Feb
-02
Au
g-0
2
Feb
-03
Au
g-0
3 Feb
-04
A
ug
-04
Feb
-05
Au
g-0
5
Feb
-06
A
ug
-06
Fe
b-0
7 A
ug
-07
Feb
-08
A
ug
-08
Feb
-09
A
ug
-09
Feb
-10
A
ug
-10
Feb
-11
Au
g-1
1
Feb
-12
Au
g-1
2
Feb
-13
Au
g-1
3
Feb
-14
A
ug
-14
Rat
e
15-yr 30-yr
*Week ending 8/21/2014

U.S. New Home Sales January 1999 through July 2014
Source: U.S. Census Bureau
July 2014 412K
0
200
400
600
800
1,000
1,200
1,400
1,600
Th
ou
san
ds,
SA
AR

U.S. Housing Starts January 1999 through July 2014
Source: U.S. Census Bureau
0
500
1,000
1,500
2,000
2,500
Jan
-99
Jul-
99
Jan
-00
Jul-
00
Jan
-01
Jul-
01
Jan
-02
Jul-
02
Jan
-03
Jul-
03
Jan
-04
Jul-
04
Jan
-05
Jul-
05
Jan
-06
Jul-
06
Jan
-07
Jul-
07
Jan
-08
Jul-
08
Jan
-09
Jul-
09
Jan
-10
Jul-
10
Jan
-11
Jul-
11
Jan
-12
Jul-
12
Jan
-13
Jul-
13
Jan
-14
Jul-
14
Th
ou
san
ds,
SA
AR
1 Unit 5 units or more
July 2014: 1 Unit: 656K 5 Units or more: 423K

U.S. Housing Building Permits January 1999 through July 2014
Source: U.S. Census Bureau
0
500
1,000
1,500
2,000
2,500
Jan
-99
Jul-
99
Jan
-00
Jul-
00
Jan
-01
Jul-
01
Jan
-02
Jul-
02
Jan
-03
Jul-
03
Jan
-04
Jul-
04
Jan
-05
Jul-
05
Jan
-06
Jul-
06
Jan
-07
Jul-
07
Jan
-08
Jul-
08
Jan
-09
Jul-
09
Jan
-10
Jul-
10
Jan
-11
Jul-
11
Jan
-12
Jul-
12
Jan
-13
Jul-
13
Jan
-14
Jul-
14
Th
ou
san
ds,
SA
AR
1 Unit 5 units or more
July 2014: 1 Unit: 640K 5 Units or more: 382K
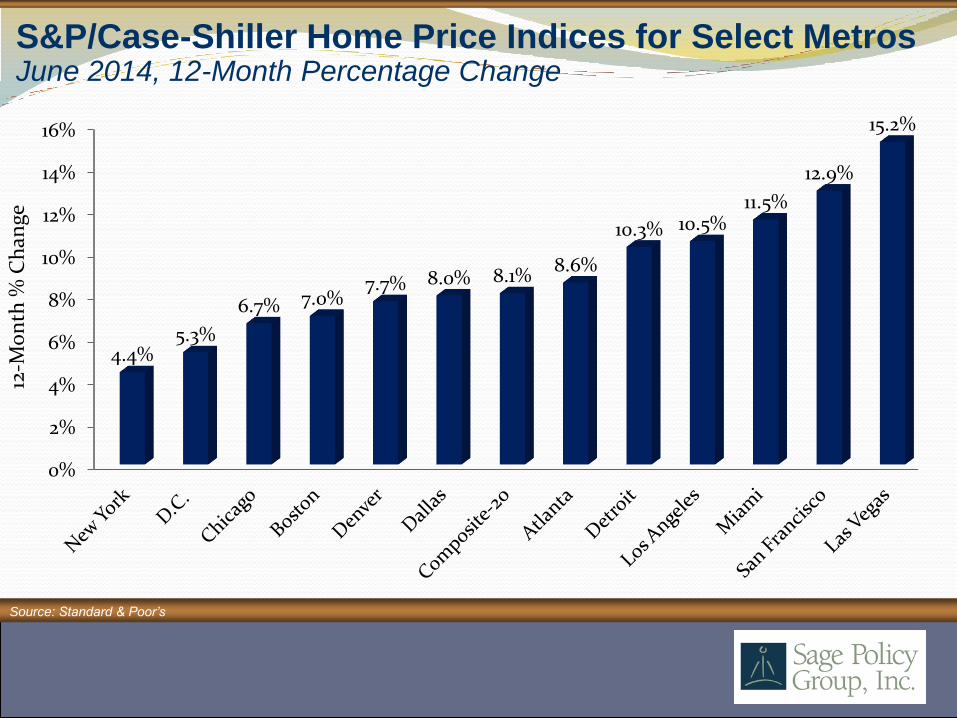
0%
2%
4%
6%
8%
10%
12%
14%
16%
4.4% 5.3%
6.7% 7.0% 7.7% 8.0% 8.1%
8.6%
10.3% 10.5% 11.5%
12.9%
15.2%
12-M
on
th %
Ch
ange
S&P/Case-Shiller Home Price Indices for Select Metros June 2014, 12-Month Percentage Change
Source: Standard & Poor’s

The Shining (1980)
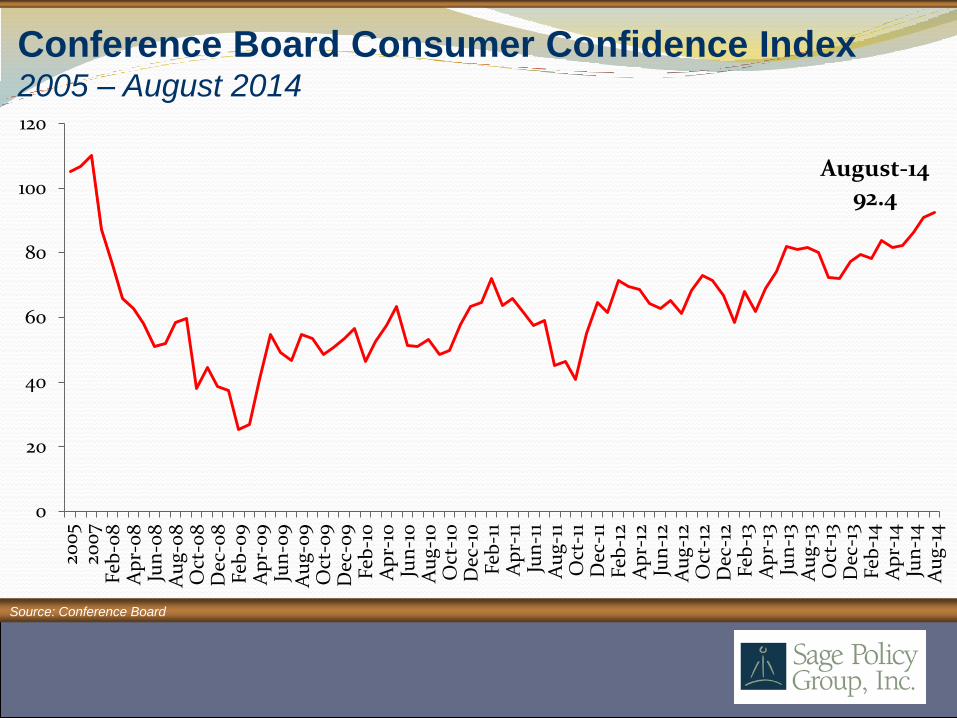
August-14 92.4
0
20
40
60
80
100
120
200
5 20
07
Feb
-08
A
pr-
08
Ju
n-0
8
Au
g-0
8
Oct
-08
D
ec-0
8
Feb
-09
A
pr-
09
Ju
n-0
9
Au
g-0
9
Oct
-09
D
ec-0
9
Feb
-10
A
pr-
10
Jun
-10
A
ug
-10
O
ct-1
0
Dec
-10
F
eb-1
1 A
pr-
11
Jun
-11
Au
g-1
1 O
ct-1
1 D
ec-1
1 F
eb-1
2 A
pr-
12
Jun
-12
Au
g-1
2 O
ct-1
2 D
ec-1
2 F
eb-1
3 A
pr-
13
Jun
-13
Au
g-1
3 O
ct-1
3 D
ec-1
3 F
eb-1
4
Ap
r-14
Ju
n-1
4
Au
g-1
4
Conference Board Consumer Confidence Index 2005 – August 2014
Source: Conference Board
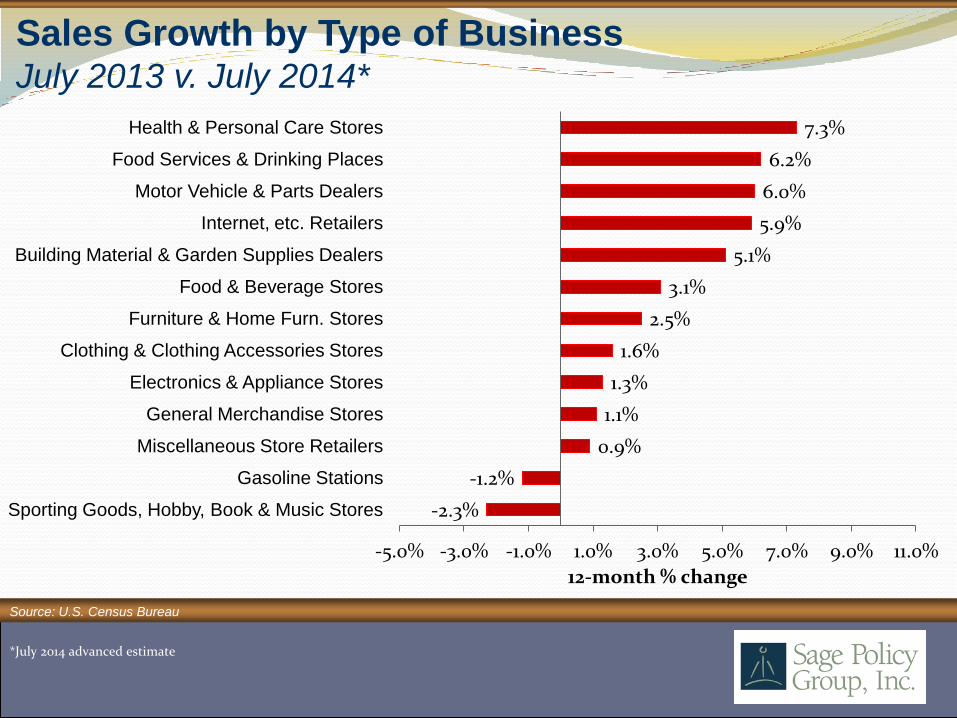
-2.3%
-1.2%
0.9%
1.1%
1.3%
1.6%
2.5%
3.1%
5.1%
5.9%
6.0%
6.2%
7.3%
-5.0% -3.0% -1.0% 1.0% 3.0% 5.0% 7.0% 9.0% 11.0%
Sporting Goods, Hobby, Book & Music Stores
Gasoline Stations
Miscellaneous Store Retailers
General Merchandise Stores
Electronics & Appliance Stores
Clothing & Clothing Accessories Stores
Furniture & Home Furn. Stores
Food & Beverage Stores
Building Material & Garden Supplies Dealers
Internet, etc. Retailers
Motor Vehicle & Parts Dealers
Food Services & Drinking Places
Health & Personal Care Stores
12-month % change
Sales Growth by Type of Business July 2013 v. July 2014*
Source: U.S. Census Bureau
*July 2014 advanced estimate

Conference Board Leading Economic Indicators Index August 2007 through July 2014
Source: Conference Board
-1.5%
-1.0%
-0.5%
0.0%
0.5%
1.0%
1.5% A
ug
-07
No
v-0
7
Feb
-08
May
-08
Au
g-0
8
No
v-0
8
Feb
-09
May
-09
Au
g-0
9
No
v-0
9
Feb
-10
May
-10
Au
g-1
0
No
v-10
Feb
-11
May
-11
Au
g-1
1
No
v-11
Feb
-12
May
-12
Au
g-1
2
No
v-12
Feb
-13
May
-13
Au
g-1
3
No
v-13
Feb
-14
May
-14
On
e-m
on
th P
erc
en
t C
ha
ng
e
July 2014 = 103.3 where 2004=100

Coming to America (1988)
• Nationally, we are likely approaching the peak of the business cycle;
• Tailwinds include booming stock market, lower gasoline prices, stabilizing global economy, and consumer expenditures on interest rate sensitive durable goods like autos;
• The current year is associated with greater certainty regarding federal budgeting and monetary policy – that helps;
• The world is not perfect - black swan threats remain: (1) Iran (2) Israel/Iran (3) Europe (4) contagion (5) cyber (6) EMP;
• Longer term question is how do we increase incomes and family stability in the Greater Cumberland area?; &
• Regions with rapid population growth and/or significant import/export activity, industrial output and energy production will lead the way.

Thank You
Follow us on Twitter @SagePolicyGroup
You can always reach me at [email protected]
Please look for updates of information at www.sagepolicy.com.
Also, if you need us in a hurry, we are at 410.522.7243 (410.522.SAGE)
Please contact us when you require economic research & policy analysis.