Back Pain Report - The North East Quality Observatory … work has been funded through the Getting...
26
Back Pain Report June 2016 Nene Copyright © 2016 Northumberland Tyne and Wear NHS Foundation Trust and South Tees NHS Foundation Trust (on behalf of the North East Quality Observatory Service, NEQOS) BetterKnowledgeBetterCareBetterOutcomes Page 1 of 26 [email protected] www.neqos.nhs.uk
Transcript of Back Pain Report - The North East Quality Observatory … work has been funded through the Getting...

Back Pain Report
June 2016
Nene
Copyright © 2016 Northumberland Tyne and Wear NHS Foundation Trust and South Tees NHS Foundation
Trust (on behalf of the North East Quality Observatory Service, NEQOS)
BetterKnowledgeBetterCareBetterOutcomes
Page 1 of [email protected]
www.neqos.nhs.uk

<----
NEQOS Back Pain Report This back pain report contains health intelligence produced by NEQOS to support the implementation of the national pathfinder project to provide better pathways of care for people with low back and radicular pain. The NHS England Pathfinder Projects were established to address high value care pathways which cross commissioning and health care boundaries. Many conditions require a pathway of care which moves from the general practitioner through primary care and community services and into secondary care and sometimes specialised services. Difficulties in commissioning across boundaries, however, can cause artificial interruptions in what should be a seamless care pathway. The Pathfinder Projects are designed for all Stakeholders to work collaboratively to examine in depth these health care interfaces and to develop commissioning structures to commission care across the whole pathway. The Trauma Programme of Care Board selected low back pain and radicular pain as the Pathfinder Project as this is a high value care pathway in view of the very large number of patients involved. The future of the pathway is that it is designed to be run in primary care (general practice and community physiotherapy) and referral into secondary specialist care is only at the end of the pathway. Key to the success of the pathway are the Triage and Treat practitioners; the highly trained practitioners, either extended scope physiotherapists or nurse specialists who essentially run the pathway and have access to bookable slots for the core therapies, nerve root blocks, spinal surgical clinic appointments or pain clinic appointments. This reduces very significantly the delays in the previous system and also reduces the “pinball” management that is a feature of so many health care systems. Quality care is less expensive by reducing ineffective or repetitive treatment and by reducing conversion into chronic disability In this profile, the current utilisation of secondary care services for back and radicular pain are shown by CCG and providers, including both NHS Trusts and Independent Sector providers to demonstrate variation in activity regionally and across England. This report is based on the population of patients under the care of CCGs in the Central Midlands Region and provides important information about patient flows from these CCGs across all providers within this region. Information on hospital admissions is presented by admission method (elective vs. emergency) and type of procedure (surgery, injections, pain management etc.) undertaken. The aim of this report is to assist both clinicians and commissioners in comparing treatment activity rates between regional providers and against national data to reduce variation and develop evidence based care pathways to improve patient outcomes. Ongoing monitoring of this secondary care activity will evidence where changes implemented through the national pathfinder project for acute low back and radicular pain to provide timely access to evidence based treatments can improve the quality of patient care, provide community based alternatives to secondary care admissions for back pain and reduce secondary care expenditure. It is important to note that this report is based on the cohort of patients with back and/or radicular pain but does not include patients who have back pain due to specific diagnosis such as cancer, infection, spinal trauma, inflammatory arthritis, cauda equine syndrome as these patients have very different treatment pathways of care.
Acknowledgements This work has been funded through the Getting It Right First Time (GIRFT) project that is part of the Department of Health funded Clinically-Led Quality and Efficiency Programme. Acknowledgements to the Health & Social Care Information Centre (HSCIC) as the source of data used in this report and to Professor Greenough and Mr Ashley Cole for their expert clinical guidance and advice.
Page 2 of [email protected]
www.neqos.nhs.uk

<----
The NHS Trusts included for the Central Midlands Region are: • Nottingham University Hospitals NHS Trust • Royal Free London NHS Foundation Trust • West Hertfordshire Hospitals NHS Trust • United Lincolnshire Hospitals NHS Trust • Buckinghamshire Healthcare NHS Trust • University Hospitals Of Leicester NHS Trust • East & North Hertfordshire NHS Trust • Northampton General Hospital NHS Trust • Kettering General Hospital NHS Foundation Trust • Luton & Dunstable University Hospital NHS Foundation Trust • Milton Keynes Hospital NHS Foundation Trust
The Independent Sector Providers included for the Central Midlands Region are: • Fitzwilliam Hospital • One Health Group Ltd • Woodland Hospital
Introduction and background Low back pain is extremely common and is the largest single cause of loss of disability adjusted life years, and the largest single cause of years lived with disability in England (Global Burden of Disease, 2013). In terms of disability adjusted life years lost per 100,000, low back pain is responsible for 2,313. By contrast the remainder of musculo-skeletal complaints counts for 911, depression 704 and diabetes 337. It should be borne in mind that this is principally occurring in people of working age, or with families. UK specific data shows that LBP was top cause of years lived with disability in both 1990 and 2010 – with a 12% increase over this time. Back pain accounts for 11% of the entire disability burden from all diseases in the UK; furthermore the burden is increasing both absolutely (3.7% increase) and proportionally (7% to 8.5%). NEQOS have produced CCG and hospital Trust level activity profiles to understand the current position in terms of secondary care activity for back and radicular pain and have worked with a range of key stakeholders from both provider and commissioner organisations to develop the profiles to ensure that the indicators shown are appropriate and relevant to the project. This information needs to be viewed in conjunction with data soon to become available from Arthritis Research UK about the prevalence of back pain and associated risk factors and where possible with locally available data from general practice, including prescribing rates, and onward referrals from primary care (e.g. physiotherapy and radiology). Technical specification Following a data discovery exercise supported by Professor Charles Greenough (National Clinical Director for Spinal Disorders, South Tees NHS Foundation Trust), definitions for low back and radicular pain were developed based on a combination of diagnosis codes (ICD-10) and relevant secondary care procedures were identified using OPCS 4.7 codes. These codes have been supported by Mr Ashley Cole, Chair of Specialised Spinal Surgery Clinical Reference Group (Consultant Orthopaedic Surgeon, Northern General Hospital and Sheffield Children's Hospital).
Data definitions Data Source: Hospital Episode Statistics (Health & Social Care Information Centre via HDIS). Please note that 2014/15 data is currently classed as provisional. CCG populations: Health & Social Care Information Centre (Ages 15 & over as at April 2015) (Data was provided in 5 year ages bands, therefore we were unable to use exact figures for Ages 16 & over) A summary of the data definitions used is shown below: Time period: April 2011 - March 2015 Primary diagnosis = back pain (specific ICD10 codes) Limited to episode 1 Age 16 years and over Private patients are included unless specified Admission costs are based on the national tariff Directly Age & Sex Standardised Rates use the European Standard Populations
Page 3 of [email protected]
www.neqos.nhs.uk

Clinical Commissioning Group (CCG) activity summary
1. Hospital admissions for low back and radicular pain in people aged 16 years and over (April 2014 - March 2015), summarya. Hospital admissions at national level, indicating back pain type and admission method
England Back Radicular Total % Back % Radicular
Elective 134,448 102,808 237,256 56.7% 43.3%
Emergency 39,331 14,309 53,640 73.3% 26.7%
Other 771 951 1,722 44.8% 55.2%
Total 174,550 118,068 292,618 59.7% 40.3%
Central
Midlands CCGs Back Radicular Total % Back % Radicular
Elective 10,945 7,546 18,491 59.2% 40.8%
Emergency 2,776 1,045 3,821 72.7% 27.3%
Other 76 100 176 43.2% 56.8%
Total 13,797 8,691 22,488 61.4% 38.6%
b. Hospital admissions at CCG level, indicating proportion of admissions for back pain
Table indicates the proportion of admissions for back pain only (and not radicular pain)
Herts Valleys 50.5% East & North Hertfordshire 62.0%
Lincolnshire West 53.8% South West Lincolnshire 62.7%
East Leicestershire & Rutland 55.0% Corby 63.6%
West Leicestershire 57.0% South Lincolnshire 65.9%
Leicester City 59.1% Milton Keynes 67.9%
Bedfordshire 60.0% Nene 68.9%
Luton 61.7% Lincolnshire East 72.8%
61.4% 59.8%
c. Hospital admissions at CCG level, by admission method
Table indicates the proportion of admissions for back and radicular pain that is recorded as elective
Leicester City 60.9% Milton Keynes 82.1%
East Leicestershire & Rutland 73.8% Herts Valleys 83.1%
West Leicestershire 74.2% Corby 85.5%
Luton 74.3% Lincolnshire West 88.7%
Bedfordshire 78.8% South Lincolnshire 90.1%
East & North Hertfordshire 80.9% South West Lincolnshire 90.6%
Nene 81.4% Lincolnshire East 91.0%
82.2% 81.1%
Nene
Highlighted CCGs:
Nene
Central Midlands CCGs England
Central Midlands CCGs England
Highlighted CCGs:
0%
10%
20%
30%
40%
50%
60%
70%
80%
90%
100%
Per
cen
tage
of
All
Ad
mis
sio
ns
Percentage of Admissions that are Elective 01/04/2014 - 31/03/2015 Central Midlands CCGs National Average Central Midlands CCGs Average
CCG
0%
10%
20%
30%
40%
50%
60%
70%
80%
90%
100%
Per
cen
tage
of
All
Ad
mis
sio
ns
Percentage of Admissions for Back Pain 01/04/2014 - 31/03/2015 All Admission Methods
Central Midlands CCGs National Average Central Midlands CCGs Average
CCG
What is the data telling us?
In the latest 12 month period there were almost 300,000 admissions for back and radicular pain in England, with 22,488 (7.7%) of these from patients registered within the Central Midlands CCGs.
At a national level the proportional split for hospital admissions is 60% for back pain and 40% for radicular pain, and at CCG level in the Central Midlands the proportion of admissions for back pain ranges from 50.5% to 72.8%.
Approximately 81% of back and radicular pain admissions are elective, with the Central Midlands slightly higher than the national rate. At CCG level in the Central Midlands the proportion of elective admissions ranges from 60.9% in Leicester City to 91% in Lincoln East.
Page 4 of [email protected]
www.neqos.nhs.uk

Clinical Commissioning Group (CCG) activity
2. Hospital admissions for low back and radicular pain in people aged 16 years and over (April 2014 - March 2015)
a. Hospital admissions for back pain by CCG (all admission methods), Directly Age & Sex Standardised Admission rate per 100,000 population
All Elective Emergency All Elective Emergency
1077.4 979.5 92.3 593.9 484.1 108.7873.4 785.1 87.0 Luton 569.3 436.0 131.6796.1 668.1 121.9 Bedfordshire 482.1 380.4 98.3739.8 656.9 75.9 Milton Keynes 468.0 380.2 82.2
733.4 664.7 64.6 East Leicestershire & Rutland 348.3 257.3 82.4
702.8 598.9 103.9 West Leicestershire 323.8 238.5 78.6
663.2 538.9 120.3 Leicester City 292.3 180.2 104.6598.4 493.5 100.1 645.6 526.5 115.4
b. Hospital admissions for back and radicular pain (all admission methods), Directly Age & Sex Standardised Admission rate per 100,000 population
c. Elective hospital admissions for back and radicular pain, Directly Age & Sex Standardised Admission rate per 100,000 population
d. Emergency hospital admissions for back and radicular pain, Directly Age & Sex Standardised Admission rate per 100,000 population
Nene
Highlighted CCGs:
Nene
Highlighted CCGs:
Highlighted CCGs:
Nene
Central Midlands CCGs England
East & North Hertfordshire
Corby
Nene
South West Lincolnshire
CCG name
Lincolnshire East
CCG name
Lincolnshire WestHerts ValleysSouth Lincolnshire
0
200
400
600
800
1,000
1,200
1,400
1,600
1,800
Dir
ectl
y A
ge &
Sex
Sta
nd
ard
ised
Rat
e o
f A
dm
issi
on
s p
er
10
0,0
00
Directly Age & Sex Standardised Rate of Admissions per 100,000 Population 01/04/2014 - 31/03/2015 All Admission Methods
Central Midlands CCGs National Average Central Midlands CCGs Average
CCG
What is the data telling us?
There is considerable variation in elective admission rates across the CCGs within Central Midlands with a 5.4-fold difference between the highest CCG for the region (Lincolnshire East CCG), and the regional lowest (Leicester City CCG), which has the lowest elective admission rates nationally. There is also wide variation for emergency admissions across the CCGs in the region, with over a 2-fold difference between the regional lowest (South West Lincolnshire CCG) and the highest CCG for the region (Luton CCG).
0
200
400
600
800
1,000
1,200
1,400
1,600
1,800
Dir
ectl
y A
ge &
Se
x St
and
ard
ised
Rat
e o
f A
dm
issi
on
s p
er 1
00
,00
0
Directly Age & Sex Standardised Rate of Admissions per 100,000 Population 01/04/2014 - 31/03/2015 Elective Admissions only
Central Midlands CCGs National Average Central Midlands CCGs Average
CCG
0
50
100
150
200
250
300
Dir
ectl
y A
ge &
Sex
Sta
nd
ard
ised
Rat
e o
f A
dm
issi
on
s p
er 1
00
,00
0
Directly Age & Sex Standardised Rate of Admissions per 100,000 Population 01/04/2014 - 31/03/2015 Emergency Admissions only
Central Midlands CCGs National Average Central Midlands CCGs Average
CCG
Page 5 of [email protected]
www.neqos.nhs.uk

Clinical Commissioning Group (CCG) activity - GP practice level
3. Hospital admissions for low back and radicular pain in people aged 16 years and over (April 2014 - March 2015)Each symbol represents one GP practice
a. Hospital admissions for back pain (Elective admissions), Indirectly Standardised RatioNene
b. Hospital admissions for back pain (Emergency admissions), Indirectly Standardised Ratio
Legend:
Nene
Legend:
Nene
What is the data telling us?
The admission rates for elective and emergency admissions for each GP practice within the CCG are expressed as Indirectly Standardised Ratios with 100 representing the national average. This adjustment has been made due to small numbers and in order that comparisons can be made between practices.
The upper and lower confidence limits on the funnel charts above are based on national data. Each circle represents the constituent GP Practices for the selected CCG(s). All GP practices within the funnel have admission rates that are not significantly different that the national rates with those above the upper blue funnel having significantly higher rates than the national average.
0
50
100
150
200
250
300
350
0 20 40 60 80 100 120
Ind
irec
tly
stan
dar
dis
ed
Rat
io
Expected events
Elective Admissions - Indirectly Standardised Ratios
Upper 3SD limit
Upper 2SD limit
National Average
Lower 2SD limits
Lower 3SD limits
0
50
100
150
200
250
300
350
400
450
500
0 5 10 15 20 25 30
Ind
irec
tly
stan
dar
dis
ed
Rat
io
Expected events
Emergency Admissions - Indirectly Standardised Ratios
Upper 3SD limit
Upper 2SD limit
National Average
Lower 2SD limits
Lower 3SD limits
Page 6 of [email protected]
www.neqos.nhs.uk

4. Indirectly Standardised Ratios for Elective & Emergency Admissions for Back & Radicular Pain, by GP Practice
Nene
Practice Code Practice Name CCG Population 15+ Observed Expected Ratio Observed Expected Ratio
K83003 Queensview Medical Centre 04G 7,052 46 35.06 131.19 8 7.69 103.96
K83004 Brackley Health Centre 04G 3,897 11 20.10 54.73 <6 4.41 90.62
K83005 Dr Wainwright & Partners 04G 9,611 44 45.47 96.78 13 10.16 127.90
K83006 Headlands Surgery 04G 8,156 40 42.16 94.89 8 9.27 86.32
K83007 Dr Wingfield & Partners 04G 9,722 71 49.18 144.37 10 10.74 93.10
K83008 The Pines Surgery 04G 6,942 33 38.57 85.55 <6 8.05 62.08
K83009 Moulton Surgery 04G 9,904 28 38.48 72.77 8 9.52 84.05
K83010 Delapre Medical Centre 04G 13,538 79 64.93 121.68 12 14.30 83.91
K83011 The Redwell Medical Centre 04G 10,079 50 53.88 92.80 11 11.46 96.00
K83012 King Edward Road Surgery 04G 9,227 41 44.23 92.70 8 10.37 77.18
K83013 Eskdaill Medical Centre 04G 10,351 51 49.33 103.39 20 11.23 178.08
K83014 Leicester Tce H/Care Ctr. 04G 11,656 35 51.99 67.32 19 12.33 154.11
K83015 Danetre Medical Practice 04G 10,636 69 56.19 122.79 8 11.82 67.70
K83018 Springfield Surgery 04G 7,626 27 40.78 66.21 <6 8.61 34.82
K83019 The Long Buckby Practice 04G 4,799 21 27.47 76.44 <6 5.57 53.85
K83020 Rillwood Medical Centre 04G 2,574 <6 10.87 46.00 <6 2.48 80.77
K83021 Rothwell Medical Centre 04G 16,754 93 88.54 105.04 17 18.78 90.51
K83022 Towcester Medical Centre 04G 6,925 21 36.17 58.05 <6 7.76 38.67
K83024 Dr Hanspaul & Partners 04G 8,731 36 44.78 80.39 11 9.72 113.22
K83025 The Mounts Medical Centre 04G 12,204 51 52.03 98.02 9 12.50 71.98
K83026 Dr Craig & Partners 04G 13,618 61 63.59 95.93 8 14.57 54.90
K83027 Langham Place Surgery 04G 8,304 42 35.07 119.78 22 8.53 258.05
K83028 Dr Bevan & Partners 04G 8,970 59 46.86 125.89 6 10.14 59.20
K83029 Abington Park Surgery 04G 10,224 43 49.12 87.54 8 11.29 70.86
K83030 The Cottons Medical Centre 04G 7,798 39 42.44 91.90 14 8.83 158.60
K83031 Byfield Medical Centre 04G 6,643 16 36.63 43.68 6 7.43 80.71
K83032 Abbey House Medical Practice 04G 16,108 81 80.33 100.83 12 17.26 69.54
K83033 Molla & Kesani 04G 2,798 9 13.58 66.29 <6 3.02 99.43
K83035 Kingsthorpe Medical Ctr. 04G 4,472 31 21.80 142.18 <6 4.91 61.04
K83036 Linden Avenue Medical Centre 04G 11,383 69 58.95 117.05 11 12.82 85.82
K83037 Dr Spencer & Partners 04G 10,561 44 55.96 78.63 13 11.76 110.53
K83039 Dryland Medical Centre 04G 10,411 56 56.08 99.85 7 12.23 57.23
K83040 Woodview Medical Centre 04G 7,759 66 37.14 177.69 13 8.05 161.58
K83041 St Lukes Primary Care Centre 04G 17,288 88 85.38 103.07 24 19.22 124.85
K83042 Park Avenue Medical Ctr. 04G 8,446 49 44.27 110.68 11 9.86 111.54
K83043 Abington Medical Centre 04G 11,482 67 56.29 119.02 15 12.73 117.83
K83044 Dr Hogg & Partners 04G 10,176 44 55.11 79.84 14 11.69 119.72
K83047 Abbey Medical Practice 04G 13,423 61 67.83 89.93 16 15.12 105.80
K83048 Brook Medical Centre 04G 5,091 16 24.85 64.40 <6 5.27 94.83
K83049 Washington House Surgery 04G 7,295 17 38.62 44.01 6 8.16 73.57
K83050 The Crescent Medical Ctr. 04G 3,122 16 15.67 102.09 <6 3.62 82.99
K83051 Weavers Medical 04G 13,674 76 66.72 113.92 12 14.94 80.34
K83052 Dr Hillier & Partners 04G 15,897 66 84.09 78.48 16 17.99 88.95
K83053 Crick Medical Practice 04G 4,066 12 23.32 51.45 <6 4.62 108.17
K83055 Wootton Medical Centre 04G 5,209 26 26.28 98.93 <6 5.74 69.74
K83056 County Surgery 04G 3,274 7 16.09 43.51 <6 3.59 83.49
K83058 Clarence Avenue Surgery 04G 3,767 27 19.38 139.28 <6 4.22 47.37
K83064 The Saxon Spires Practice 04G 12,250 42 65.95 63.68 12 13.58 88.35
K83065 Dr Cotterell & Partners 04G 4,748 19 26.18 72.57 8 5.33 150.12
K83066 Greens Norton & Weedon Medical Practice 04G 10,747 59 62.28 94.73 8 12.47 64.17
K83068 Denton Village Surgery 04G 5,082 25 29.29 85.36 <6 5.89 50.94
K83069 Dr Alexander 04G 2,082 10 12.17 82.18 <6 2.47 202.58
K83070 Bugbrooke Medical Practice 04G 8,075 30 41.83 71.72 16 8.92 179.43
K83076 Jameel 04G 3,091 6 14.34 41.84 <6 3.09 97.08
K83077 Greenview Surgery 04G 6,076 33 31.90 103.46 7 7.09 98.72
K83079 Wollaston & Bozeat Surgeries 04G 4,001 28 22.01 127.24 <6 4.51 88.70
K83080 Higham Ferrers Surgery 04G 4,229 13 22.10 58.82 <6 4.88 41.00
K83081 Summerlee Medical Centre 04G 965 <6 5.11 39.18 1.05
K83601 Earls Barton Medical Centre 04G 4,311 20 24.23 82.54 <6 4.87 102.75
K83610 Danes Camp Medical Centre 04G 6,820 32 31.90 100.32 <6 7.11 70.32
K83616 The Meadows Surgery 04G 4,389 23 22.62 101.66 <6 4.65 85.95
K83618 Dr Abbas 04G 4,766 17 20.51 82.90 9 4.70 191.29
K83619 Penvale Park Medical Ctr 04G 3,438 15 15.67 95.71 <6 3.42 58.49
K83620 The Brook Health Centre 04G 7,009 14 37.15 37.68 7 7.69 91.01
K83621 Maple Access Partnership Llp 04G 5,973 15 18.84 79.63 14 5.50 254.72
K83625 Dr Oliver Dk 04G 3,676 25 17.83 140.18 <6 3.79 26.37
Y00028 Kings Health & Lings Brook Practice 04G 5,345 9 21.07 42.71 <6 5.17 38.67
Y00399 Dr Pasquali 04G 3,590 25 20.01 124.96 <6 4.21 47.51
Y01139 Dr Datta & Partners 04G 3,178 8 15.47 51.70 <6 3.33 30.01
Indirectly Standardised Ratios that are coloured Red are higher than 3 standard deviations from the mean. Those coloured Yellow are between 2 and 3 higher
standard deviations from the mean.
Elective Emergency
Page 7 of [email protected]
www.neqos.nhs.uk

Hospital Trust activity
5. Hospital admissions for low back and radicular pain in people aged 16 years and over (April 2014 - March 2015)a. Number of hospital admissions for back pain (all admission methods, NHS Trusts only)
Nottingham 5,112 East & North Hertfordshire 1,781
Royal Free London 2,981 Northampton 1,431West Hertfordshire 2,827 Kettering 1,122United Lincolnshire 2,436 Luton & Dunstable 965Buckinghamshire 2,302 Milton Keynes 624Leicester 2,020
Central Midlands NHS Trusts 23,601 England 251,444
b. Number of admissions per hospital Trust, by admission method(Central Midlands Providers only)
What is the data telling us?
The total number of admissions for back pain is presented due to the absence of a relevant denominator at hospital Trust level. Activity for the 9 NHS Trusts is to some degree proportional to the size of the Trust and is spread across the quintile chart.
The proportion of hospital activity for back pain which is classed as elective care is slightly higher than the England proportion for the Central Midlands providers overall, however at NHS Trust level the proportion this varies between 67% at Luton and Dunstable to 89% at Buckinghamshire. All NHS activity at independent sector providers is classed as elective.
0
1,000
2,000
3,000
4,000
5,000
6,000
7,000
8,000
Nu
mb
er
of
Ad
mis
sio
ns
Number of Admissions per Provider 01/04/2014 - 31/03/2015 All Admissions Central Midlands NHS Trusts
Trusts
0%
10%
20%
30%
40%
50%
60%
70%
80%
90%
100%
Pe
rce
nta
ge o
f A
dm
issi
on
s
Hospital Admissions for Back Pain by Admission Method 01/04/2014 - 31/03/2015
Elective Emergency Other
Page 8 of [email protected]
www.neqos.nhs.uk

Hospital Trust activity
5. Hospital admissions for low back and radicular pain in people aged 16 years and over (April 2014 - March 2015)c. Elective admissions for back and radicular pain, by treatment specialty(Central Midlands Providers only)
Provider Name
Pain
Management &
Anaesthetics
Trauma &
Orthopaedics
Spinal Surgery
Service
Interventional
Radiology Neurosurgery Other Functions Total
United Lincolnshire 2,055 <6 - - - <6 2,055
Nottingham 2,338 <6 1,881 - 103 11 4,333
Leicester 553 819 - <6 - 17 1,389
Kettering 494 374 - - - 9 877
Northampton 969 113 - - - <6 1,082
Milton Keynes 445 14 - - - <6 459
East & North Hertfordshire 725 574 - - - <6 1,299
Luton & Dunstable 111 89 427 - - 12 639
Buckinghamshire 1,162 728 - 140 - 11 2,041
West Hertfordshire 601 1,691 <6 - - 11 2,303
Royal Free London 1,196 1,002 - - - 176 2,374
Fitzwilliam Hospital 500 214 890 - - 13 1,617
Woodland Hospital 271 175 66 - - - 512
One Health Group Ltd - 14 - - 1,106 - 1,120
Total 11,420 5,807 3,264 140 1,209 260 22,100
d. Elective admissions for injections for back and radicular pain, by injection type and treatment specialty (national data)
Updated with new codes. Not automatically updated yet.
BUT doesn't need to be updated
What is the data telling us?
For elective activity the treatment specialty code indicated within the hospital data varies by hospital trust. Overall the most common specialties are trauma and orthopaedics and pain management, however for Nottingham and Luton & Dunstable Hospitals a high volume of activity is recorded within spinal surgery service and the One Health Group records the majority of their activity under Neurosurgery.
The second table shows the different types of injections being undertaken within each of the treatment function codes and demonstrates that nationally over 62% (104,751) of injections take place within Pain Management/Anaesthetics and 25% of injections are undertaken within Trauma and Orthopaedics.
The most common injection type is facet joint injections, which mainly take place within Pain Management/Anaesthetics treatment function, but are also being used in Trauma and Orthopaedics, Spinal Surgery Service and Neurosurgery.
Page 9 of [email protected]
www.neqos.nhs.uk

Hospital Trust activity from CCGs
a. Hospital elective admissions by CCG population (percentage of activity)
b. Hospital elective admissions by CCG population (actual activity)
6. Patient flows from CCG to Hospital Trust for back and radicular pain in people aged 16 years and over (April 2014 - March
2015)
What is the data telling us?
There is variation between hospital trusts in terms of the number of patients from each of the CCGs that are admitted for back and radicular pain. Some high volume providers are located outside of the Central Midlands CCG boundary (i.e. Nottingham, Royal Free London and Buckinghamshire Hospital ) and the majority of their patients are coming from CCGs outside of Central Midlands. We have included them in this report as they provide similar spinal surgery activity to some of the other providers located within the Central Midlands CCGs.
The data is shown in two ways, indicating both the proportion and amount of activity relating to each CCG.
1,130
93
451
231
95
220
493
404
443
220
21
636
1,028
13
79 182
250
143 102
30
353
193
1,034
54 171
33
352
135
32 22
109
1,834
255
27
3,977
14
1,574
144
1,938
0%
10%
20%
30%
40%
50%
60%
70%
80%
90%
100%
Per
cen
tage
of
adm
issi
on
s
Elective Admissions by NHS Trust from each CCG 01/04/2014 - 31/03/2015 Other
Herts Valleys
Luton
East & North Hertfordshire
Milton Keynes
Bedfordshire
Nene
Corby
West Leicestershire
Leicester City
East Leicestershire &RutlandSouth Lincolnshire
South West Lincolnshire
Lincolnshire West
Lincolnshire East
1,130
93
451
231 220
493
404
443
220
636 1,028
79 182 250 143 102 353 193
1,034
171
352 135
109
1,834
255
27
3,977
1,574
144
1,938
-
500
1,000
1,500
2,000
2,500
3,000
3,500
4,000
4,500
5,000
Nu
mb
er o
f ad
mis
sio
ns
Elective Admissions by NHS Trust from each CCG 01/04/2014 - 31/03/2015 Other
Herts Valleys
Luton
East & North Hertfordshire
Milton Keynes
Bedfordshire
Nene
Corby
West Leicestershire
Leicester City
East Leicestershire &RutlandSouth Lincolnshire
South West Lincolnshire
Lincolnshire West
Lincolnshire East
Page 10 of [email protected]
www.neqos.nhs.uk

Hospital Trust activity from CCGs
c. Hospital elective admissions for surgery by CCG population (percentage of activity)
d. Hospital elective admissions for surgery by CCG population (actual activity)
6. Patient flows from CCG to Hospital Trust for back and radicular pain in people aged 16 years and over (April 2014 - March
2015)
What is the data telling us?
There is variation between hospital trusts in terms of the number of patients from each of the CCGs that are admitted for spinal surgery for back and radicular pain. Some high volume providers are located outside of the Central Midlands CCG boundary (i.e. Nottingham, Royal Free London and Buckinghamshire Hospital ) and the majority of their patients are coming from CCGs outside of Central Midlands. We have included them in this report as they provide similar spinal surgery activity to some of the other providers located within the Central Midlands CCGs. Nottingham has the highest activity for spinal surgery overall but more patients from the Central Midlands CCGs have spinal surgery at Leicester and West Hertfordshire hospitals.
The data is shown in two ways, indicating both the proportion and amount of activity relating to each CCG.
22 10 18 8
87
55
7
77
23
6
57
48
16
12 9
7
27
9
45
7 15
27
21
6
152
16
292 119
13
96
0%
10%
20%
30%
40%
50%
60%
70%
80%
90%
100%
Per
cen
tage
of
adm
issi
on
s
Elective Surgery Admissions by NHS Trust from each CCG 01/04/2014 - 31/03/2015 Other
Herts Valleys
Luton
East & North Hertfordshire
Milton Keynes
Bedfordshire
Nene
Corby
West Leicestershire
Leicester City
East Leicestershire &RutlandSouth Lincolnshire
South West Lincolnshire
Lincolnshire West
Lincolnshire East
22 10 18 8
87
55
7
77
23
6
57
48 16 12 9
7
27 9
45 7 15
27 21 6
152
16
292
119
13
96
-
50
100
150
200
250
300
350
400
Nu
mb
er o
f ad
mis
sio
ns
Elective Surgery Admissions by NHS Trust from each CCG 01/04/2014 - 31/03/2015 Other
Herts Valleys
Luton
East & North Hertfordshire
Milton Keynes
Bedfordshire
Nene
Corby
West Leicestershire
Leicester City
East Leicestershire &RutlandSouth Lincolnshire
South West Lincolnshire
Lincolnshire West
Lincolnshire East
Page 11 of [email protected]
www.neqos.nhs.uk

Hospital Trust activity from CCGs
e. Hospital elective admissions for injections by CCG population (percentage of activity)
f. Hospital elective admissions for injections by CCG population (actual activity)
6. Patient flows from CCG to Hospital Trust for back and radicular pain in people aged 16 years and over (April 2014 - March
2015)
What is the data telling us?
There is variation between hospital trusts in terms of the number of patients from each of the CCGs that are admitted for injections for back and radicular pain. Some high volume providers are located outside of the Central Midlands CCG boundary (i.e. Nottingham, Royal Free London and Buckinghamshire Hospital ) and the majority of their patients are coming from CCGs outside of Central Midlands. We have included them in this report as they provide similar spinal surgery activity to some of the other providers located within the Central Midlands CCGs. Nottingham has the highest activity for injections overall but more patients from the Central Midlands CCGs have injections at United Lincolnshire and West Hertfordshire hospitals.
The data is shown in two ways, indicating both the proportion and amount of activity relating to each CCG.
993
59
365
202
200
345
313
309
181
505
715
10
67 158
208
94 79
17
281
133
871
42 142
32
286
92
27 18
69
1,488
189
20
3,173
8 8 13 12 8
1,058
119
1,610
0%
10%
20%
30%
40%
50%
60%
70%
80%
90%
100%
Pe
rce
nta
ge o
f ad
mis
sio
ns
Elective Injections Admissions by NHS Trust from each CCG 01/04/2014 - 31/03/2015 Other
Herts Valleys
Luton
East & North Hertfordshire
Milton Keynes
Bedfordshire
Nene
Corby
West Leicestershire
Leicester City
East Leicestershire &RutlandSouth Lincolnshire
South West Lincolnshire
Lincolnshire West
Lincolnshire East
993
59
365
202
200
345
313
309
181
505 715
158 208 94 79 281 133
871
142
286 92
69
1,488
189
20 3,173
1,058
119
1,610
-
500
1,000
1,500
2,000
2,500
3,000
3,500
4,000
Nu
mb
er o
f ad
mis
sio
ns
Elective Injections Admissions by NHS Trust from each CCG 01/04/2014 - 31/03/2015 Other
Herts Valleys
Luton
East & North Hertfordshire
Milton Keynes
Bedfordshire
Nene
Corby
West Leicestershire
Leicester City
East Leicestershire &RutlandSouth Lincolnshire
South West Lincolnshire
Lincolnshire West
Lincolnshire East
Page 12 of [email protected]
www.neqos.nhs.uk

CCG activity to Hospital Trust
7. Patient flows to Hospital Trusts from CCGs for back pain in people aged 16 years and over (April 2014 - March 2015)a. Hospital elective admissions by CCG population (percentage of activity)
b. Hospital elective admissions from each CCG (actual activity)
What is the data telling us?
There is variation between CCGs in terms of the number of the number of hospital trusts that their patients are admitted to. Bedfordshire CCG patients attend five of the acute hospital trusts as well as using Independent Sector Providers which is in contrast to the 3 CCGs across Leicester that use mainly Leicester Hospitals.
Activity is highest for Herts Valley CCG and is spread across several providers. The 4 CCGs across Lincolnshire have the highest proportion of Independent Sector activity.
The data is shown in two ways, indicating both the proportion and amount of activity relating to each hospital trust.
1,130
451 231
220
93
58 95
12
43 39
493
404
443
11
220
636
9
1,028
30 79
353
182
1,034
33
250
352
143
193
109
102
38
54
135
1,834
171
255
697
533 373
533
91
35
65
443
329
75
794
42
519
236 190
56
352
77 13
215
24 353
315
75 427
55 425
0%
10%
20%
30%
40%
50%
60%
70%
80%
90%
100%
Lin
coln
shir
e Ea
st
Lin
coln
shir
e W
est
Sou
th W
est
Lin
coln
shir
e
Sou
th L
inco
lnsh
ire
East
Leic
este
rsh
ire
&R
utl
and
Leic
este
r C
ity
Wes
tLe
ices
ters
hir
e
Co
rby
Nen
e
Bed
ford
shir
e
Milt
on
Key
nes
East
& N
ort
hH
ertf
ord
shir
e
Luto
n
Her
ts V
alle
ys
Pe
rce
nta
ge o
f ad
mis
sio
ns
Elective Admissions by CCG to each Provider 01/04/2014 - 31/03/2015 Other
Independent SectorProviders
Royal Free London
West Hertfordshire
Buckinghamshire
Luton & Dunstable
East & NorthHertfordshire
Milton Keynes
Northampton
Kettering
Leicester
Nottingham
United Lincolnshire
1,130
451 231 220
93
58
95 493 404 443
220
636
1,028
353 182
1,034 250
352
143 193
109
102
54
135
1,834 171
255
697
533
373 533 91
443
329
75
794
519
236
190
56
352
77 215
353
315
75
427
55
425
-
500
1,000
1,500
2,000
2,500
3,000
3,500
Lin
coln
shir
e Ea
st
Lin
coln
shir
e W
est
Sou
th W
est
Lin
coln
shir
e
Sou
th L
inco
lnsh
ire
East
Lei
cest
ersh
ire
& R
utl
and
Leic
este
r C
ity
We
stLe
ices
ters
hir
e
Co
rby
Nen
e
Be
dfo
rdsh
ire
Milt
on
Ke
yne
s
East
& N
ort
hH
ertf
ord
shir
e
Luto
n
Her
ts V
alle
ys
Nu
mb
er o
f ad
mis
sio
ns
Elective Admissions by CCG to each Provider 01/04/2014 - 31/03/2015 Other
Independent SectorProviders
Royal Free London
West Hertfordshire
Buckinghamshire
Luton & Dunstable
East & NorthHertfordshire
Milton Keynes
Northampton
Kettering
Leicester
Nottingham
United Lincolnshire
Page 13 of [email protected]
www.neqos.nhs.uk

CCG activity to Hospital Trust
7. Patient flows to Hospital Trusts from CCGs for back pain in people aged 16 years and over (April 2014 - March 2015)c. Hospital elective admissions for surgery by CCG population (percentage of activity)
d. Hospital elective admissions for surgery from each CCG (actual activity)
What is the data telling us?
There is variation between CCGs in terms of the number of the number of hospital trusts that their patients are admitted to for spinal surgery. Nene CCG has the highest number of admissions for surgery and patients attend at least three of the acute hospital trusts as well as using Independent Sector Providers which is in contrast to the 3 CCGs across Leicester that use mainly Leicester Hospitals.
The 4 CCGs across Lincolnshire have the highest proportion of Independent Sector activity.
The data is shown in two ways, indicating both the proportion and amount of activity relating to each hospital trust.
22 10
18
8 7
87
55
77
6
23
57
48
7
45 16
27
12
27
6
9
9
7
21
152
15
16
131 152
63
78
10
9 10
117
37
7
83
46
44 40
6
18
8
34 83
82
35 76
8 47
0%
10%
20%
30%
40%
50%
60%
70%
80%
90%
100%
Lin
coln
shir
e Ea
st
Lin
coln
shir
e W
est
Sou
th W
est
Lin
coln
shir
e
Sou
th L
inco
lnsh
ire
East
Leic
este
rsh
ire
&R
utl
and
Leic
est
er
Cit
y
Wes
tLe
ices
ters
hir
e
Co
rby
Nen
e
Bed
ford
shir
e
Milt
on
Key
nes
East
& N
ort
hH
ertf
ord
shir
e
Luto
n
Her
ts V
alle
ys
Per
cen
tage
of
adm
issi
on
s
Elective Surgery Admissions by CCG to each Provider 01/04/2014 - 31/03/2015 Other
Independent SectorProviders
Royal Free London
West Hertfordshire
Buckinghamshire
Luton & Dunstable
East & NorthHertfordshire
Northampton
Kettering
Leicester
Nottingham
22 10 18 8 7
87
55 77
6 23
57
48
7 45
16 27 12 27
6
9 9 7
21
152
15
16
131 152
63 78
10 9
10
117
37 7
83
46
44 40
6 18
8 34
83
82
35
76
8
47
-
50
100
150
200
250
300
350
Lin
coln
shir
e Ea
st
Lin
coln
shir
e W
est
Sou
th W
est
Lin
coln
shir
e
Sou
th L
inco
lnsh
ire
East
Lei
cest
ersh
ire
& R
utl
and
Leic
este
r C
ity
We
stLe
ices
ters
hir
e
Co
rby
Nen
e
Be
dfo
rdsh
ire
Milt
on
Ke
yne
s
East
& N
ort
hH
ertf
ord
shir
e
Luto
n
Her
ts V
alle
ys
Nu
mb
er
of
adm
issi
on
s
Elective Surgery Admissions by CCG to each Provider 01/04/2014 - 31/03/2015 Other
Independent SectorProviders
Royal Free London
West Hertfordshire
Buckinghamshire
Luton & Dunstable
East & NorthHertfordshire
Northampton
Kettering
Leicester
Nottingham
Page 14 of [email protected]
www.neqos.nhs.uk

CCG activity to Hospital Trust
7. Patient flows to Hospital Trusts from CCGs for back pain in people aged 16 years and over (April 2014 - March 2015)e. Hospital elective admissions for injections by CCG population (percentage of activity)
f. Hospital elective admissions for injections from each CCG (actual activity)
What is the data telling us?
There is variation between CCGs in terms of the number of the number of hospital trusts that their patients are admitted to for injections. Herts Valley CCG has the highest number of admissions for injections and patients attend at least three of the acute hospital trusts as well as using Independent Sector Providers which is in contrast to the 3 CCGs across Leicester that use mainly Leicester Hospitals.
The 4 CCGs across Lincolnshire have the highest proportion of Independent Sector activity.
The data is shown in two ways, indicating both the proportion and amount of activity relating to each hospital trust.
993
365 202
200
59
38 56
6
22 21
345
313
309
8
181
505
8
715
17
10
67
281
158
871
32
208 286
94
133
69
79
26
42
92
1,488
142
189
497
340 261
413
69
23
48 285
275
41
606
35
413
121 107
43
297
49 6
144
11 151
141
9
261 33
279
0%
10%
20%
30%
40%
50%
60%
70%
80%
90%
100%
Lin
coln
shir
e Ea
st
Lin
coln
shir
e W
est
Sou
th W
est
Lin
coln
shir
e
Sou
th L
inco
lnsh
ire
East
Leic
este
rsh
ire
&R
utl
and
Leic
este
r C
ity
Wes
tLe
ices
ters
hir
e
Co
rby
Nen
e
Bed
ford
shir
e
Milt
on
Key
nes
East
& N
ort
hH
ertf
ord
shir
e
Luto
n
Her
ts V
alle
ys
Pe
rce
nta
ge o
f ad
mis
sio
ns
Elective Injections Admissions by CCG to each Provider 01/04/2014 - 31/03/2015 Other
Independent SectorProviders
Royal Free London
West Hertfordshire
Buckinghamshire
Luton & Dunstable
East & NorthHertfordshire
Milton Keynes
Northampton
Kettering
Leicester
Nottingham
United Lincolnshire
993
365 202 200
59
38 56 345 313 309
181
505
715
6 67 281 158
871
32
208 286
94 133
69
79
42
92
1,488 142
189
497
340
261 413 69
285
275
606
413
121
107
43
297
49 144
151
141
261
279
-
500
1,000
1,500
2,000
2,500
3,000
Lin
coln
shir
e Ea
st
Lin
coln
shir
e W
est
Sou
th W
est
Lin
coln
shir
e
Sou
th L
inco
lnsh
ire
East
Lei
cest
ersh
ire
& R
utl
and
Leic
este
r C
ity
We
stLe
ices
ters
hir
e
Co
rby
Nen
e
Be
dfo
rdsh
ire
Milt
on
Ke
yne
s
East
& N
ort
hH
ertf
ord
shir
e
Luto
n
Her
ts V
alle
ys
Nu
mb
er o
f ad
mis
sio
ns
Elective Injections Admissions by CCG to each Provider 01/04/2014 - 31/03/2015 Other
Independent SectorProviders
Royal Free London
West Hertfordshire
Buckinghamshire
Luton & Dunstable
East & NorthHertfordshire
Milton Keynes
Northampton
Kettering
Leicester
Nottingham
United Lincolnshire
Page 15 of [email protected]
www.neqos.nhs.uk
Hospital Trust activity (national level)
a. Hospital admissions by procedure type over time (all admission types)
b. Elective hospital admissions by surgery procedure type over time
c. Hospital admissions by injection procedure type over time
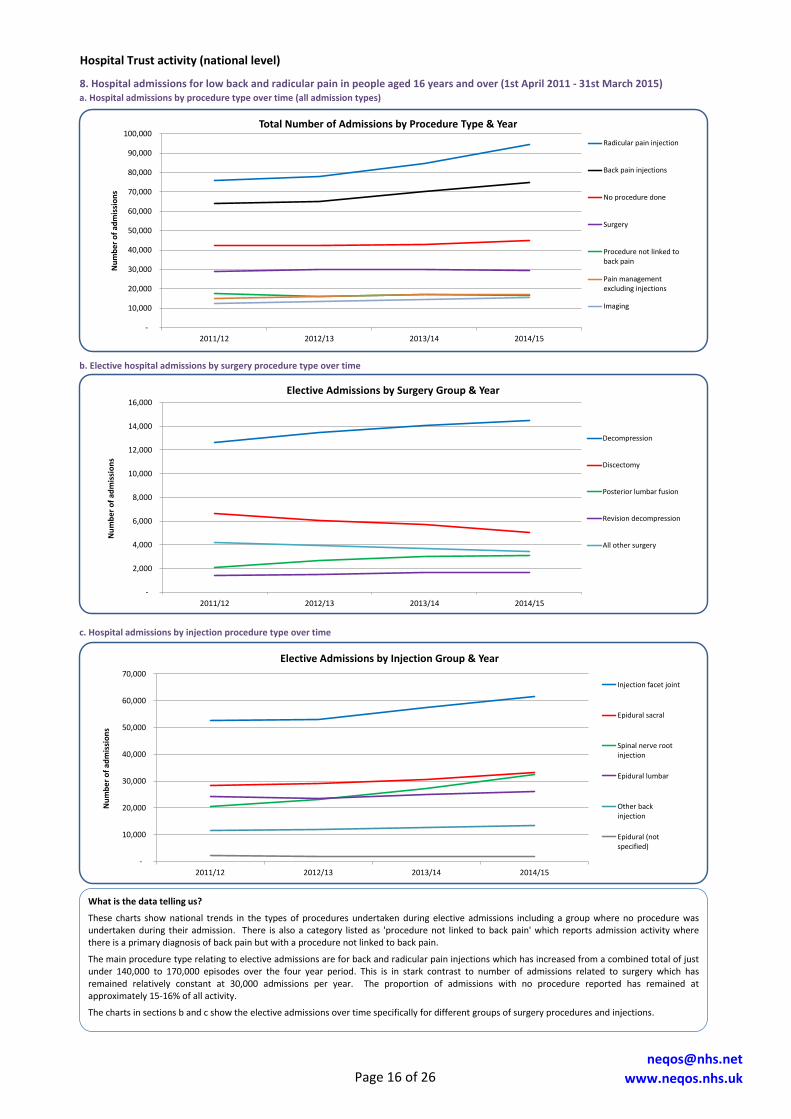
8. Hospital admissions for low back and radicular pain in people aged 16 years and over (1st April 2011 - 31st March 2015)
What is the data telling us?
These charts show national trends in the types of procedures undertaken during elective admissions including a group where no procedure was undertaken during their admission. There is also a category listed as 'procedure not linked to back pain' which reports admission activity where there is a primary diagnosis of back pain but with a procedure not linked to back pain.
The main procedure type relating to elective admissions are for back and radicular pain injections which has increased from a combined total of just under 140,000 to 170,000 episodes over the four year period. This is in stark contrast to number of admissions related to surgery which has remained relatively constant at 30,000 admissions per year. The proportion of admissions with no procedure reported has remained at approximately 15-16% of all activity.
The charts in sections b and c show the elective admissions over time specifically for different groups of surgery procedures and injections.
-
10,000
20,000
30,000
40,000
50,000
60,000
70,000
80,000
90,000
100,000
2011/12 2012/13 2013/14 2014/15
Nu
mb
er
of
adm
issi
on
s
Total Number of Admissions by Procedure Type & Year
Radicular pain injection
Back pain injections
No procedure done
Surgery
Procedure not linked toback pain
Pain managementexcluding injections
Imaging
-
2,000
4,000
6,000
8,000
10,000
12,000
14,000
16,000
2011/12 2012/13 2013/14 2014/15
Nu
mb
er
of
adm
issi
on
s
Elective Admissions by Surgery Group & Year
Decompression
Discectomy
Posterior lumbar fusion
Revision decompression
All other surgery
-
10,000
20,000
30,000
40,000
50,000
60,000
70,000
2011/12 2012/13 2013/14 2014/15
Nu
mb
er
of
adm
issi
on
s
Elective Admissions by Injection Group & Year
Injection facet joint
Epidural sacral
Spinal nerve rootinjection
Epidural lumbar
Other backinjection
Epidural (notspecified)
Page 16 of [email protected]
www.neqos.nhs.uk

Hospital Trust activity
a. Elective hospital admissions by procedure type (national level including all providers)
b. Number of elective admissions per hospital Trust, by procedure type (percentage of activity)
(Central Midlands Providers only)
c. Number of elective admissions per hospital Trust, by procedure type (actual activity)
(Central Midlands Providers only)
9. Elective hospital admissions for low back and radicular pain in people aged 16 years and over (April 2014 - March 2015)
What is the data telling us?
The table shows the number of procedures done in the latest 12 month period, by procedure type, with injections being the most common elective procedure. Nationally only 4.4% of elective admissions have no procedure recorded (compared to 15-16% of all admission types - see previous sheet).
Eight of the Central Midlands Trusts have a higher proportion of elective activity for injections than the England rate and it is possible that the variation is due to differences in the point of delivery of care across hospital Trusts (for example it is possible that activity may also take place as outpatient procedures). Leicester Trust has a notably higher proportion of admissions for surgery compared to the other NHS Trusts.
The data is shown in two ways, indicating both the proportion and amount of activity relating to each procedure.
756 1,565
269
407 506 261
273
377
621 574
826
300 145
139
7,019 74,701
1,025 1,819
727
296
250
112
831
147
746 1,273
1,123
944 209
607
10,109 93,605
369 227
82
55
49 47
167
211 127 242 114 304 1,994
27,668
96 166 58 34
56
17
52 36
74
106 82
37 13 828
10,552
101 282 84 46
54 17
48 15
54
37 97 64 31 52
982 12,765
82 91 16 8
163 55 49 17
359
71 118 1,055 16,797
0%
10%
20%
30%
40%
50%
60%
70%
80%
90%
100%
Per
cen
tage
of
adm
issi
on
s
Elective Admissions for Back Pain by Procedure Type, 01/04/2014 - 31/03/2015
Back pain Injections Radicular Pain Injections Surgery No procedure done Procedure not linked to Back Pain Pain Management excluding Injections Imaging
756
1,565
269 407 506 261 273 377
621 574 826
300 145 139
1,025
1,819
727 296 250
112
831 147
746 1,273
1,123
944
209 607
369
227
82
167
211 127
242
114
304
96
166
74
106 101
282
84
91
163
359
118
-
500
1,000
1,500
2,000
2,500
3,000
3,500
4,000
4,500
5,000
Nu
mb
er
of
adm
issi
on
s
Elective Admissions for Back Pain by Procedure Type, 01/04/2014 - 31/03/2015
Back pain Injections Radicular Pain Injections Surgery No procedure done Procedure not linked to Back Pain Pain Management excluding Injections Imaging
Page 17 of [email protected]
www.neqos.nhs.uk

Hospital Trust activity
d. Number of elective admissions for injections per hospital Trust, by injection type (percentage of activity)
(Central Midlands Providers only)
e. Number of elective admissions for injections per hospital Trust, by injection type (actual activity)
(Central Midlands Providers only)
f. Proportion of elective admissions for lumbar facet joint injections, by hospital trust
From FT4b Data
9. Elective hospital admissions for low back and radicular pain in people aged 16 years and over (April 2014 - March 2015)
What is the data telling us?
Spinal nerve root joint injections are more frequently done within the Central Midlands, constituting almost 27% of injection activity compared to 19% across England as a whole. The data is shown in two ways, indicating both the proportion and amount of activity relating to each CCG.
The proportion of facet joint injections done at Trust level ranges from 16% to 65% compared to the England figure of 37%.
700
916 213
232 182 105
644
65
351
726 570
646 156
48
5,554 61,147
325
903
514
64
68 7
187
82
395
547
553
298
53
559 4,555 32,458
462 1,284
226
335 433
183
247
341
410
492
694
272
106
118
5,603 61,463
294 281 43
72 73
78
26 36
211 82 132
28 39
21 1,416 13,238
0%
10%
20%
30%
40%
50%
60%
70%
80%
90%
100%
Per
cen
tage
of
adm
issi
on
s
Elective Admissions for Back Pain for Injections, by Injection Type, 01/04/2014 - 31/03/2015
Epidurals Spinal nerve root injection Injection facet joint Other back injections
700 916
213 232 182 105
644 351
726 570 646
156
325
903
514 64 68
187
82
395
547 553 298
559
462
1,284
226
335 433
183
247
341
410
492 694
272
106
118
294
281
72 73
78
211
82 132
-
500
1,000
1,500
2,000
2,500
3,000
3,500
4,000
Nu
mb
er o
f ad
mis
sio
ns
Elective Admissions for Back Pain for Injections, by Injection Type, 01/04/2014 - 31/03/2015
Epidurals Spinal nerve root injection Injection facet joint Other back injections
0%
10%
20%
30%
40%
50%
60%
70%
Pro
po
rtio
n o
f in
ject
ion
s w
hic
h w
ere
for
face
t jo
int
Proportion of Elective Admissions for Injections which relate to Facet Joint Injections, 01/04/2014 - 31/03/2015
Injection facet joint % Central Midlands Providers Average England Average
Page 18 of [email protected]
www.neqos.nhs.uk

Hospital Trust activity
g. Number of elective admissions for surgery per hospital Trust, by surgery type (percentage of activity)
(Central Midlands Providers only)
h. Number of elective admissions for surgery per hospital Trust, by surgery type (actual activity)
(Central Midlands Providers only)
9. Elective hospital admissions for low back and radicular pain in people aged 16 years and over (April 2014 - March 2015)
What is the data telling us?
The charts above show the range in activity relating specifically to elective admissions for surgery, by type of surgery, for the Central Midlands Trusts. Overall across the Central Midlands Trusts there is a higher proportion of spinal fusions compared to England and there are variations at Trust level with the Royal Free and Fitzwilliam providers doing higher proportions of fusions. Decompression is the most common surgical procedure for back pain across the NHS Trusts.
The data is shown in two ways, indicating both the proportion and amount of activity relating to each surgery type.
218 119
48
25 23 24 68
109 60 89
23
120 926
14,509
37 35
9
9 9 49
49
6 58 63
99 428 5,014
29 6 11 10
8
12
25 114
1,631 6 40
12
6
23 10
104 883
51 6
12
21 33 20
47
39 238 3,115
28 22 7
13 8
12 10 10 26
26
19 184 2,516
0%
10%
20%
30%
40%
50%
60%
70%
80%
90%
100%
Per
cen
tage
of
adm
issi
on
s
Elective admissions for back pain for surgery, by surgery type, 01/04/2014 - 31/03/2015
Decompression Discectomy Revision decompression Decompression + fusion Posterior lumbar fusion All Other Surgery
218
119
48 25 23 24
68 109
60 89
23
120
37
35
9 9 9
49
49 58
63
99
29
11
10
8
12
25
6
40
12 23
10
51
6
12
21
33
20
47
39
28
22
13 8
12
10
10
26
26
19
-
50
100
150
200
250
300
350
400
Nu
mb
er
of
adm
issi
on
s
Elective admissions for back pain for surgery, by surgery type, 01/04/2014 - 31/03/2015
Decompression Discectomy Revision decompression Decompression + fusion Posterior lumbar fusion All Other Surgery
Page 19 of [email protected]
www.neqos.nhs.uk

CCG activity by back pain procedure group
a. Number of elective admissions for surgery per CCG, by surgery type (Central Midlands only)
b. Number of elective admissions for injections per CCG, by injection type (Central Midlands only)
c. Number of elective admissions for lumbar facet joint injections, by CCG (Central Midlands only)
From CCG3 Data
10. Elective hospital admissions for low back and radicular pain in people aged 16 years and over (April 2014 - March 2015)
What is the data telling us?
Chart 10a shows the range in the activity rate relating specifically to elective admissions for surgery, by type of surgery, for the Central Midlands CCGs, with chart 9b showing the same for injections.
Overall, Central Midlands CCGs have lower rates of surgery per 100,00 and similar rates of injections compared to England but there is wide variation between the CCGs within Central Midlands. There is a 5-fold difference in surgery admissions between Leicester City and Lincoln West and an 8-fold difference between Leicester City and Lincoln East for injection admissions.
The proportion of facet joint injections done at CCG level ranges from 17% to 47% compared to the England figure of 37%.
0%
5%
10%
15%
20%
25%
30%
35%
40%
45%
50%
Lin
coln
shir
eW
est
Leic
este
r C
ity
Lin
coln
shir
eEa
st
We
stLe
ices
ters
hir
e
East
Leic
este
rsh
ire
& R
utl
and
Her
ts V
alle
ys
Sou
th W
est
Lin
coln
shir
e
East
& N
ort
hH
ertf
ord
shir
e
Sou
thLi
nco
lnsh
ire
Milt
on
Ke
yne
s
Be
dfo
rdsh
ire
Co
rby
Luto
n
Nen
e
Pro
po
rtio
n o
f in
ject
ion
s w
hic
h w
ere
for
face
t jo
int
Proportion of Elective Admissions for Injections which relate to Facet Joint Injections 01/04/2014 - 31/03/2015
Injection facet joint % Central Midlands Average England Average
325
93 171
302
41 24 38
141 92 93 70
164 67
198 122 130
160
225 130
88
78 56 62
56
41 53 38
89
71
127
86 69
217
75 163
228
54
21 44
184
148 114 89
135
124
144
117 131
102
48
51
58
12 14
49
34 15
35
16
20
23
28 28
-
100
200
300
400
500
600
700
800
900
Lin
coln
shir
eEa
st
Lin
coln
shir
eW
est
Sou
th W
est
Lin
coln
shir
e
Sou
thLi
nco
lnsh
ire
East
Leic
este
rsh
ire
& R
utl
and
Leic
este
r C
ity
Wes
tLe
ices
ters
hir
e
Co
rby
Nen
e
Bed
ford
shir
e
Milt
on
Key
nes
East
& N
ort
hH
ertf
ord
shir
e
Luto
n
Her
ts V
alle
ys
Cen
tral
Mid
lan
ds
Engl
andN
um
ber
of
adm
issi
on
s p
er
10
0,0
00
po
pu
lati
on
Elective Admissions for Back Pain for Injections, by Injection Type, 01/04/2014 - 31/03/2015 Epidurals Spinal nerve root injection Injection facet joint Other back injections
48 47 39 36
26 14
21 27 27 31 17
25 15
31 28 33
22 32
15 19
6 9
27 16
15
10 11 12
6
8
7
6
10
9
12
13 11
9
10
7 6 7
12
7
6 7
10 6
-
20
40
60
80
100
120Li
nco
lnsh
ire
East
Lin
coln
shir
eW
est
Sou
th W
est
Lin
coln
shir
e
Sou
thLi
nco
lnsh
ire
East
Leic
este
rsh
ire
&R
utl
and
Leic
este
r C
ity
We
stLe
ices
ters
hir
e
Co
rby
Nen
e
Be
dfo
rdsh
ire
Milt
on
Ke
yne
s
East
& N
ort
hH
ertf
ord
shir
e
Luto
n
Her
ts V
alle
ys
Ce
ntr
alM
idla
nd
s
Engl
and
Nu
mb
er
of
adm
issi
on
s p
er
10
0,0
00
po
pu
lati
on
Elective Admissions for Back Pain for Surgery, by Surgery Type, 01/04/2014 - 31/03/2015 Decompression Discectomy Revision decompression Decompression + fusion Posterior lumbar fusion All Other Surgery
Page 20 of [email protected]
www.neqos.nhs.uk

Hospital Trust activity
11. Hospital admissions for low back and radicular pain in people aged 16 years and over (April 2014 - March 2015)a. Elective admissions for back pain by patient classification and type, all providers
b. Elective admissions for back pain, average length of stay by provider
c. Emergency admissions for back pain, average length of stay by provider
(Central Midlands Trusts only)
What is the data telling us?
Over 98% of elective admissions for back pain in the current data extraction relate to NHS patients, with just over 0.5% relating to private patients.
The boxplot indicates the variation in length of stay for emergency admissions to the Central Midlands Trusts and shows that all Trusts have a higher median length of stay (1 days), compared to the England rate of zero days.
67% of elective admissions for back pain are day cases, therefore the range in length of stay has not been calculated.
Other Patient Types are Amenity patients and Category II patients, and where the Administrative Category is unknown.
-
1
2
3
4
5
6
7
Len
gth
of
stay
Variation in length of stay Emergency Admissions only 01/04/2014 - 31/03/2015
2nd Quartile 3rd Quartile Median
Page 21 of [email protected]
www.neqos.nhs.uk

Hospital Trust Activity Total Costs
a. Total Costs by Admission Method Type (Central Midlands FTs only)
Provider Name Elective Emergency Other Total
Nottingham 4,897,379£ 1,090,109£ 91,265£ 6,078,753£
West Hertfordshire 2,645,187£ 641,454£ 34,600£ 3,321,242£
Royal Free London 2,021,281£ 763,347£ 15,272£ 2,799,899£
Leicester 1,726,764£ 876,513£ 2,258£ 2,605,535£
Buckinghamshire 2,091,169£ 290,480£ 2,476£ 2,384,125£
East & North Hertfordshire 1,078,787£ 501,569£ 19,800£ 1,600,155£
United Lincolnshire 1,171,633£ 408,665£ 17,297£ 1,597,595£
Kettering 853,214£ 318,281£ 6,799£ 1,178,294£
Northampton 786,968£ 362,171£ -£ 1,149,139£
Luton & Dunstable 648,787£ 405,703£ 2,969£ 1,057,459£
Milton Keynes 252,015£ 213,758£ 7,791£ 473,564£ Total 18,173,185£ 5,872,049£ 200,526£ 24,245,760£
b. Total Costs by Procedure Type (Central Midlands FTs only)
Provider Name Surgery
Radicular pain
Injections
Back pain
Injections
No procedure
done
Procedure not
linked to back
pain Imaging
Pain
Management
excluding
Injections
Other Non-
Surgical Total
Nottingham 2,267,213£ 1,222,173£ 962,850£ 480,023£ 635,300£ 362,759£ 148,434£ -£ 6,078,753£
West Hertfordshire 1,150,320£ 962,734£ 422,899£ 409,143£ 102,061£ 219,746£ 54,339£ -£ 3,321,242£
Royal Free London 668,955£ 757,761£ 489,819£ 346,433£ 234,198£ 225,858£ 76,874£ -£ 2,799,899£
Leicester 1,062,797£ 465,075£ 146,341£ 478,150£ 226,321£ 216,268£ 10,582£ -£ 2,605,535£
Buckinghamshire 934,854£ 527,378£ 356,579£ 106,773£ 123,046£ 121,896£ 213,600£ -£ 2,384,125£
East & North Hertfordshire 237,005£ 597,169£ 183,531£ 321,601£ 90,002£ 142,641£ 28,207£ -£ 1,600,155£
United Lincolnshire -£ 663,650£ 385,438£ 199,079£ 96,103£ 184,053£ 69,272£ -£ 1,597,595£
Kettering 390,278£ 197,572£ 248,546£ 150,518£ 92,221£ 87,692£ 11,467£ -£ 1,178,294£
Northampton 250,002£ 159,325£ 277,265£ 167,048£ 78,706£ 131,131£ 85,662£ -£ 1,149,139£
Luton & Dunstable 270,283£ 99,903£ 260,098£ 213,448£ 76,508£ 115,722£ 18,946£ 2,552£ 1,057,459£
Milton Keynes -£ 77,000£ 141,956£ 114,864£ 28,213£ 83,381£ 28,150£ -£ 473,564£ Total 7,231,708£ 5,729,739£ 3,875,320£ 2,987,080£ 1,782,680£ 1,891,149£ 745,534£ 2,552£ 24,245,760£
12. Total costs to the commissioner for hospital admissions for low back and radicular pain in people aged 16 years and over
(April 2014 - March 2015)
What is the data telling us?
Across all Central Midlands Trusts in 2014/15 the total cost to commissioners for back and radicular pain admissions was almo st £24.3 million, with 75% of the costs attributed to elective activity. Note that these costs are by provider Trust and will include activity for CCGs outside of th e Central Midlands region.
Activity at Nottingham Hospitals accounts for 25% of the total spend for the Central Midlands.
The surgery procedures group accounts for almost 30% of the total cost of all procedures, and the cost of injections is an ad ditional 40% of the total.
Page 22 of [email protected]
www.neqos.nhs.uk

CCG Activity Total Costs
13. Hospital admissions Total Cost for low back and radicular pain in people aged 16 years and over (April 2014 - March 2015)a. All Admission Methods - Table
Responsible CCG Name
Cost per head
of Population Total Cost
Cost per head
of Population Total Cost
Cost per head
of Population Total Cost
Registered
Population
(Ages 15+)
Leicester City 3.04£ 935,602£ 1.72£ 530,684£ 1.13£ 348,452£ 308,125
West Leicestershire 4.30£ 1,354,147£ 3.13£ 985,204£ 1.01£ 317,076£ 314,855
East Leicestershire & Rutland 5.15£ 1,387,149£ 3.56£ 958,508£ 1.29£ 346,168£ 269,183
Bedfordshire 5.54£ 2,076,673£ 4.06£ 1,522,164£ 1.41£ 527,683£ 375,067
Luton 5.63£ 985,644£ 4.07£ 712,470£ 1.55£ 271,083£ 175,060
Milton Keynes 5.72£ 1,274,851£ 4.36£ 970,675£ 1.09£ 242,000£ 222,774
Nene 6.93£ 3,708,242£ 5.53£ 2,963,789£ 1.37£ 734,113£ 535,484
East & North Hertfordshire 7.52£ 3,605,689£ 6.03£ 2,892,869£ 1.40£ 670,556£ 479,374
Corby 7.84£ 465,716£ 6.42£ 381,042£ 1.43£ 84,675£ 59,396
Herts Valleys 8.83£ 4,490,493£ 7.06£ 3,591,236£ 1.55£ 787,638£ 508,335
South West Lincolnshire 8.95£ 984,185£ 8.05£ 884,550£ 0.75£ 81,987£ 109,916
South Lincolnshire 9.25£ 1,258,991£ 8.00£ 1,089,233£ 1.16£ 158,434£ 136,155
Lincolnshire West 9.49£ 1,847,553£ 8.38£ 1,631,041£ 0.88£ 171,031£ 194,705
Lincolnshire East 11.91£ 2,480,900£ 10.29£ 2,144,404£ 1.49£ 310,710£ 208,321
Central Midlands Total 6.89£ 26,855,837£ 5.46£ 21,257,867£ 1.30£ 5,051,608£ 3,896,750
b. All Admission Methods - Quintile Chart
c. Elective Admissions only, by Procedure Type
Responsible CCG Name Surgery
Radicular pain
Injections
Back pain
Injections
No procedure
done
Procedure not
linked to back
pain Imaging
Pain
Management
excluding
Injections
Other Non-
Surgical
Total Cost
Herts Valleys 1,380,838£ 1,178,465£ 576,887£ 25,503£ 285,364£ 28,007£ 116,172£ -£ 3,591,236£
Nene 1,497,950£ 436,201£ 548,038£ 10,243£ 327,243£ 7,258£ 136,856£ -£ 2,963,789£
East & North Hertfordshire 1,259,001£ 815,773£ 460,657£ 3,033£ 227,876£ 4,282£ 119,969£ 2,278£ 2,892,869£
Lincolnshire East 915,972£ 638,290£ 344,300£ 5,984£ 179,951£ 15,334£ 43,874£ 699£ 2,144,404£
Lincolnshire West 902,030£ 382,252£ 142,816£ 1,875£ 138,755£ 2,796£ 60,517£ -£ 1,631,041£
Bedfordshire 720,975£ 308,117£ 256,324£ 10,648£ 132,429£ 5,626£ 88,046£ -£ 1,522,164£
South Lincolnshire 452,931£ 345,638£ 208,109£ 10,122£ 48,895£ 1,398£ 22,139£ -£ 1,089,233£
West Leicestershire 576,539£ 196,270£ 104,800£ 2,197£ 90,855£ 1,714£ 12,828£ -£ 985,204£
Milton Keynes 469,146£ 161,965£ 152,618£ 1,316£ 131,256£ 2,437£ 51,938£ -£ 970,675£
East Leicestershire & Rutland 518,035£ 194,764£ 97,964£ 602£ 114,647£ 7,521£ 24,976£ -£ 958,508£
South West Lincolnshire 429,616£ 217,282£ 127,989£ -£ 89,053£ 716£ 19,894£ -£ 884,550£
Luton 331,781£ 168,129£ 161,185£ 1,210£ 21,814£ 3,273£ 25,077£ -£ 712,470£
Leicester City 270,894£ 150,868£ 43,153£ 1,031£ 58,446£ 4,296£ 1,995£ -£ 530,684£
Corby 170,747£ 70,970£ 82,697£ -£ 56,119£ -£ 509£ -£ 381,042£
All Admissions Elective Admissions Emergency Admissions
Nene
Highlighted CCGs:
What is the data telling us?
There is wide variation across the CCGs in Central Midlands in cost per head of population for admissions related to back and radicular pain.
Lincolnshire East CCG has the highest spend per head of population regionally (£11.91) driven mainly by high costs for elective admissions. Leicester City CCG has the lowest costs per head for both emergency and elective admissions regionally (£3.04) and this is also the lowest cost per head nationally.
The final table shows the total spend for elective admissions for each CCG for 2014/15 (based on national tariff) and includes a breakdown of this spend by procedure type. Surgery generally accounts for the majority of spend but we observe that for some CCGs in the region more is spent on injections compared to what is spent on surgery; most notably in Herts Valley where the surgery spend is £1.38M and injection spend is £1.75M.
£0
£2
£4
£6
£8
£10
£12
£14
£16
Co
st p
er
he
ad o
f p
op
ula
tio
n
Cost of Back Pain Admissions per head of Population 01/04/2014 - 31/03/2015 All Admission Methods
Central Midlands CCGs National Average Central Midlands CCGs Average
CCG
Page 23 of [email protected]
www.neqos.nhs.uk

14. Back & Radicular Pain Admissions Breakdown for the Central Midlands RegionHighlighted Provider Data is included in this report(Red=Complex Spinal Provider, Blue=NHS Trust & Green=Independent Sector Provider)
Code Provider Name Surgery Injections Other
RWG WEST HERTFORDSHIRE HOSPITALS NHS TRUST 198 1,728 238 463 9 2,636
RWD UNITED LINCOLNSHIRE HOSPITALS NHS TRUST - 1,761 272 341 9 2,383
RWE UNIVERSITY HOSPITALS OF LEICESTER NHS TRUST 226 985 163 615 <6 1,991
RWH EAST AND NORTH HERTFORDSHIRE NHS TRUST 49 1,092 146 450 8 1,745
RNS NORTHAMPTON GENERAL HOSPITAL NHS TRUST 55 748 273 338 - 1,414
RNQ KETTERING GENERAL HOSPITAL NHS FOUNDATION TRUST 82 695 91 240 <6 1,111
NVC06 FITZWILLIAM HOSPITAL 168 808 90 - 1,066
RC9 LUTON AND DUNSTABLE UNIVERSITY HOSPITAL NHS FOUNDATION TRUST 46 516 67 309 <6 943
RD8 MILTON KEYNES HOSPITAL NHS FOUNDATION TRUST - 360 88 142 <6 593
NTX01 ONE HEALTH GROUP LTD 141 347 37 - 525
RAL ROYAL FREE LONDON NHS FOUNDATION TRUST 31 339 66 85 - 521
NVC23 WOODLAND HOSPITAL 114 353 44 - 511
RXQ BUCKINGHAMSHIRE HEALTHCARE NHS TRUST 48 309 110 32 - 499
RX1 NOTTINGHAM UNIVERSITY HOSPITALS NHS TRUST 77 211 73 66 14 441
RGN PETERBOROUGH AND STAMFORD HOSPITALS NHS FOUNDATION TRUST - 325 26 71 <6 423
RAN ROYAL NATIONAL ORTHOPAEDIC HOSPITAL NHS TRUST 37 268 96 <6 - 402
NVC19 RIVERS HOSPITAL 61 278 46 - 385
RGT CAMBRIDGE UNIVERSITY HOSPITALS NHS FOUNDATION TRUST 90 90 73 112 10 375
NVC15 PINEHILL HOSPITAL <6 298 38 - 341
RQW THE PRINCESS ALEXANDRA HOSPITAL NHS TRUST 43 126 16 102 - 287
RKB UNIVERSITY HOSPITALS COVENTRY AND WARWICKSHIRE NHS TRUST 51 133 68 28 - 280
RTH OXFORD UNIVERSITY HOSPITALS NHS TRUST 89 31 98 34 11 263
RRV UNIVERSITY COLLEGE LONDON HOSPITALS NHS FOUNDATION TRUST 34 108 52 9 22 225
NT405 BMI - BISHOPS WOOD <6 199 23 - 224
NTP13 BARLBOROUGH NHS TREATMENT CENTRE 82 102 <6 - 189
NVC27 BOSTON WEST HOSPITAL - 145 42 - 187
NT421 BMI - THE KINGS OAK HOSPITAL <6 147 31 - 183
NT423 BMI - THE MANOR HOSPITAL - 169 <6 - 171
RC1 BEDFORD HOSPITAL NHS TRUST - <6 <6 147 <6 155
RJL NORTHERN LINCOLNSHIRE AND GOOLE NHS FOUNDATION TRUST - 44 62 24 - 130
RWA HULL AND EAST YORKSHIRE HOSPITALS NHS TRUST 23 82 14 9 <6 130
RTG DERBY TEACHING HOSPITALS NHS FOUNDATION TRUST 23 78 8 17 - 126
NT315 SPIRE BUSHEY HOSPITAL 33 78 <6 - 116
RHQ SHEFFIELD TEACHING HOSPITALS NHS FOUNDATION TRUST 51 19 28 6 <6 105
NT411 BMI - THE CLEMENTINE CHURCHILL HOSPITAL 8 67 9 - 84
RAS THE HILLINGDON HOSPITALS NHS FOUNDATION TRUST - 64 12 7 - 83
NV313 CIRCLE - NOTTINGHAM NHS TREATMENT CENTRE - 69 14 - 83
RLT GEORGE ELIOT HOSPITAL NHS TRUST - 35 20 27 - 82
RT5 LEICESTERSHIRE PARTNERSHIP NHS TRUST - - 12 8 59 79
RCX THE QUEEN ELIZABETH HOSPITAL, KING'S LYNN, NHS FOUNDATION TRUST 7 35 <6 21 - 66
RQQ HINCHINGBROOKE HEALTH CARE NHS TRUST 6 43 <6 <6 - 57
NT410 BMI - THE CHILTERN HOSPITAL <6 31 15 - 48
RK5 SHERWOOD FOREST HOSPITALS NHS FOUNDATION TRUST - 43 - <6 - 45
NVC40 NOTTINGHAM WOODTHORPE HOSPITAL 23 16 <6 - 42
RP5 DONCASTER AND BASSETLAW HOSPITALS NHS FOUNDATION TRUST 8 26 <6 <6 - 41
RJ1 GUY'S AND ST THOMAS' NHS FOUNDATION TRUST <6 13 23 <6 - 39
NT434 BMI - THE SAXON CLINIC - 19 19 - 38
NTE02 ST HUGH'S HOSPITAL - 32 <6 <6 35
NT316 SPIRE HARPENDEN HOSPITAL 7 22 <6 - 34
NYW04 ASPEN - CLAREMONT HOSPITAL 17 15 <6 - 34
RYJ IMPERIAL COLLEGE HEALTHCARE NHS TRUST <6 13 6 9 - 33
NT209 NUFFIELD HEALTH, CAMBRIDGE HOSPITAL 28 - <6 - 33
NT424 BMI - THE MERIDEN HOSPITAL 22 <6 6 - 32
NY601 PAIN MANAGEMENT SOLUTIONS - OAKS PARK PCC - 15 11 - 26
NT351 SPIRE HULL AND EAST RIDING HOSPITAL <6 14 8 - 23
NT416 BMI - HENDON HOSPITAL <6 18 <6 - 22
NYW01 ASPEN - HOLLY HOUSE HOSPITAL <6 17 <6 - 22
R1H BARTS HEALTH NHS TRUST <6 <6 7 6 - 19
RDU FRIMLEY HEALTH NHS FOUNDATION TRUST <6 6 <6 6 - 17
RAP NORTH MIDDLESEX UNIVERSITY HOSPITAL NHS TRUST - <6 <6 8 - 15
RDD BASILDON AND THURROCK UNIVERSITY HOSPITALS NHS FOUNDATION TRUST - <6 12 - - 13
RJF BURTON HOSPITALS NHS FOUNDATION TRUST 13 - 13
NT451 BMI THE CAVELL HOSPITAL 10 <6 - - 12
R1E STAFFORDSHIRE AND STOKE ON TRENT PARTNERSHIP NHS TRUST - 11 - - - 11
RJ6 CROYDON HEALTH SERVICES NHS TRUST - <6 <6 <6 - 9
RRJ THE ROYAL ORTHOPAEDIC HOSPITAL NHS FOUNDATION TRUST <6 <6 <6 - - 9
NVC14 PARK HILL HOSPITAL - 9 - - 9
NT435 BMI - THE SHELBURNE HOSPITAL <6 <6 <6 - 8
RL1 THE ROBERT JONES AND AGNES HUNT ORTHOPAEDIC HOSPITAL NHS FOUNDATION TRUST <6 6 - - - 7
RN5 HAMPSHIRE HOSPITALS NHS FOUNDATION TRUST <6 <6 - <6 - 7
NT422 BMI - THE LONDON INDEPENDENT HOSPITAL - <6 <6 - 7
RCB YORK TEACHING HOSPITAL NHS FOUNDATION TRUST - <6 <6 <6 - 6
RF4 BARKING, HAVERING AND REDBRIDGE UNIVERSITY HOSPITALS NHS TRUST <6 - <6 - <6 6
RFS CHESTERFIELD ROYAL HOSPITAL NHS FOUNDATION TRUST - <6 - <6 - 6
RGR WEST SUFFOLK NHS FOUNDATION TRUST - <6 <6 - - 6
NT343 SPIRE THAMES VALLEY HOSPITAL <6 <6 - - 6
RRK UNIVERSITY HOSPITALS BIRMINGHAM NHS FOUNDATION TRUST - <6 - <6 - <6
RWN SOUTH ESSEX PARTNERSHIP UNIVERSITY NHS FOUNDATION TRUST - <6 <6
RJZ KING'S COLLEGE HOSPITAL NHS FOUNDATION TRUST <6 - <6 <6 - <6
RKE THE WHITTINGTON HOSPITAL NHS TRUST <6 <6 - <6 - <6
RQ8 MID ESSEX HOSPITAL SERVICES NHS TRUST - <6 <6 - - <6
RQM CHELSEA AND WESTMINSTER HOSPITAL NHS FOUNDATION TRUST - <6 <6 - - <6
RY5 LINCOLNSHIRE COMMUNITY HEALTH SERVICES NHS TRUST - - <6 <6 <6 <6
NT440 BMI - THORNBURY HOSPITAL <6 <6 - - <6
RGQ IPSWICH HOSPITAL NHS TRUST - <6 <6 <6 - <6
RJE UNIVERSITY HOSPITALS OF NORTH MIDLANDS NHS TRUST <6 - <6 - - <6
RM1 NORFOLK AND NORWICH UNIVERSITY HOSPITALS NHS FOUNDATION TRUST <6 - <6
Elective Admissions Emergency
Admissions
Other Admission
Types Total
Page 24 of [email protected]
www.neqos.nhs.uk
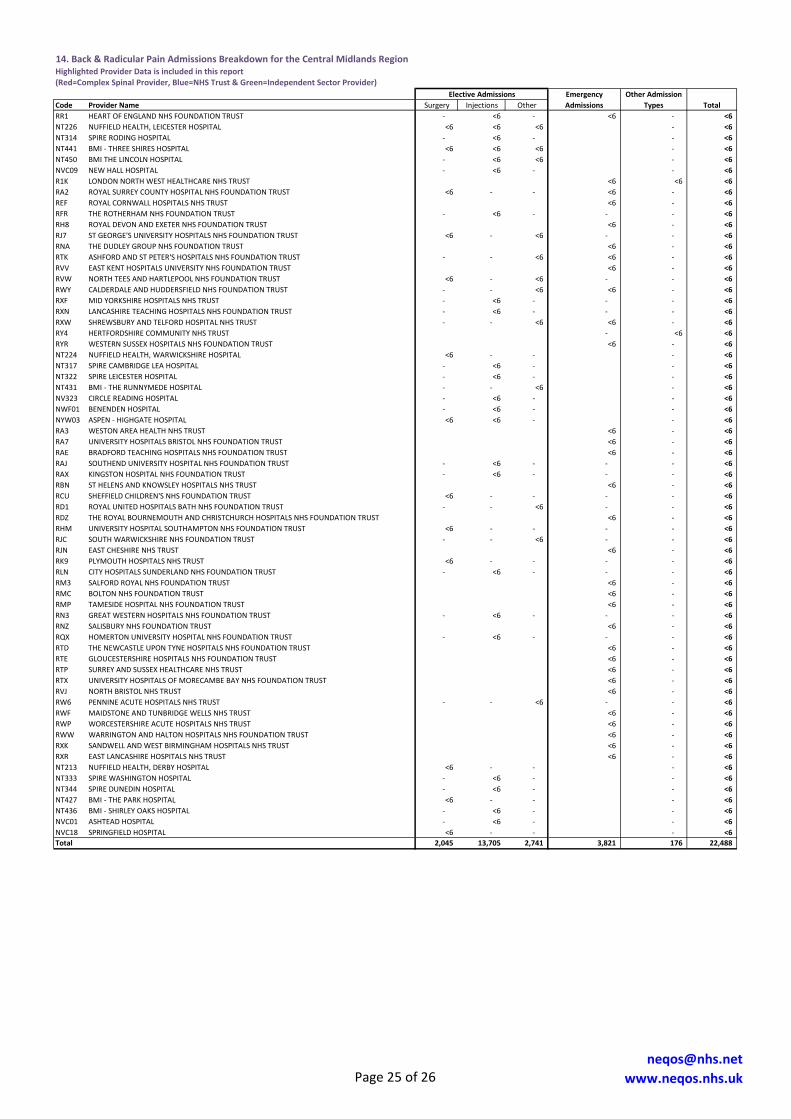
14. Back & Radicular Pain Admissions Breakdown for the Central Midlands RegionHighlighted Provider Data is included in this report(Red=Complex Spinal Provider, Blue=NHS Trust & Green=Independent Sector Provider)
Code Provider Name Surgery Injections Other
Elective Admissions Emergency
Admissions
Other Admission
Types Total
RR1 HEART OF ENGLAND NHS FOUNDATION TRUST - <6 - <6 - <6
NT226 NUFFIELD HEALTH, LEICESTER HOSPITAL <6 <6 <6 - <6
NT314 SPIRE RODING HOSPITAL - <6 - - <6
NT441 BMI - THREE SHIRES HOSPITAL <6 <6 <6 - <6
NT450 BMI THE LINCOLN HOSPITAL - <6 <6 - <6
NVC09 NEW HALL HOSPITAL - <6 - - <6
R1K LONDON NORTH WEST HEALTHCARE NHS TRUST <6 <6 <6
RA2 ROYAL SURREY COUNTY HOSPITAL NHS FOUNDATION TRUST <6 - - <6 - <6
REF ROYAL CORNWALL HOSPITALS NHS TRUST <6 - <6
RFR THE ROTHERHAM NHS FOUNDATION TRUST - <6 - - - <6
RH8 ROYAL DEVON AND EXETER NHS FOUNDATION TRUST <6 - <6
RJ7 ST GEORGE'S UNIVERSITY HOSPITALS NHS FOUNDATION TRUST <6 - <6 - - <6
RNA THE DUDLEY GROUP NHS FOUNDATION TRUST <6 - <6
RTK ASHFORD AND ST PETER'S HOSPITALS NHS FOUNDATION TRUST - - <6 <6 - <6
RVV EAST KENT HOSPITALS UNIVERSITY NHS FOUNDATION TRUST <6 - <6
RVW NORTH TEES AND HARTLEPOOL NHS FOUNDATION TRUST <6 - <6 - - <6
RWY CALDERDALE AND HUDDERSFIELD NHS FOUNDATION TRUST - - <6 <6 - <6
RXF MID YORKSHIRE HOSPITALS NHS TRUST - <6 - - - <6
RXN LANCASHIRE TEACHING HOSPITALS NHS FOUNDATION TRUST - <6 - - - <6
RXW SHREWSBURY AND TELFORD HOSPITAL NHS TRUST - - <6 <6 - <6
RY4 HERTFORDSHIRE COMMUNITY NHS TRUST - <6 <6
RYR WESTERN SUSSEX HOSPITALS NHS FOUNDATION TRUST <6 - <6
NT224 NUFFIELD HEALTH, WARWICKSHIRE HOSPITAL <6 - - - <6
NT317 SPIRE CAMBRIDGE LEA HOSPITAL - <6 - - <6
NT322 SPIRE LEICESTER HOSPITAL - <6 - - <6
NT431 BMI - THE RUNNYMEDE HOSPITAL - - <6 - <6
NV323 CIRCLE READING HOSPITAL - <6 - - <6
NWF01 BENENDEN HOSPITAL - <6 - - <6
NYW03 ASPEN - HIGHGATE HOSPITAL <6 <6 - - <6
RA3 WESTON AREA HEALTH NHS TRUST <6 - <6
RA7 UNIVERSITY HOSPITALS BRISTOL NHS FOUNDATION TRUST <6 - <6
RAE BRADFORD TEACHING HOSPITALS NHS FOUNDATION TRUST <6 - <6
RAJ SOUTHEND UNIVERSITY HOSPITAL NHS FOUNDATION TRUST - <6 - - - <6
RAX KINGSTON HOSPITAL NHS FOUNDATION TRUST - <6 - - - <6
RBN ST HELENS AND KNOWSLEY HOSPITALS NHS TRUST <6 - <6
RCU SHEFFIELD CHILDREN'S NHS FOUNDATION TRUST <6 - - - - <6
RD1 ROYAL UNITED HOSPITALS BATH NHS FOUNDATION TRUST - - <6 - - <6
RDZ THE ROYAL BOURNEMOUTH AND CHRISTCHURCH HOSPITALS NHS FOUNDATION TRUST <6 - <6
RHM UNIVERSITY HOSPITAL SOUTHAMPTON NHS FOUNDATION TRUST <6 - - - - <6
RJC SOUTH WARWICKSHIRE NHS FOUNDATION TRUST - - <6 - - <6
RJN EAST CHESHIRE NHS TRUST <6 - <6
RK9 PLYMOUTH HOSPITALS NHS TRUST <6 - - - - <6
RLN CITY HOSPITALS SUNDERLAND NHS FOUNDATION TRUST - <6 - - - <6
RM3 SALFORD ROYAL NHS FOUNDATION TRUST <6 - <6
RMC BOLTON NHS FOUNDATION TRUST <6 - <6
RMP TAMESIDE HOSPITAL NHS FOUNDATION TRUST <6 - <6
RN3 GREAT WESTERN HOSPITALS NHS FOUNDATION TRUST - <6 - - - <6
RNZ SALISBURY NHS FOUNDATION TRUST <6 - <6
RQX HOMERTON UNIVERSITY HOSPITAL NHS FOUNDATION TRUST - <6 - - - <6
RTD THE NEWCASTLE UPON TYNE HOSPITALS NHS FOUNDATION TRUST <6 - <6
RTE GLOUCESTERSHIRE HOSPITALS NHS FOUNDATION TRUST <6 - <6
RTP SURREY AND SUSSEX HEALTHCARE NHS TRUST <6 - <6
RTX UNIVERSITY HOSPITALS OF MORECAMBE BAY NHS FOUNDATION TRUST <6 - <6
RVJ NORTH BRISTOL NHS TRUST <6 - <6
RW6 PENNINE ACUTE HOSPITALS NHS TRUST - - <6 - - <6
RWF MAIDSTONE AND TUNBRIDGE WELLS NHS TRUST <6 - <6
RWP WORCESTERSHIRE ACUTE HOSPITALS NHS TRUST <6 - <6
RWW WARRINGTON AND HALTON HOSPITALS NHS FOUNDATION TRUST <6 - <6
RXK SANDWELL AND WEST BIRMINGHAM HOSPITALS NHS TRUST <6 - <6
RXR EAST LANCASHIRE HOSPITALS NHS TRUST <6 - <6
NT213 NUFFIELD HEALTH, DERBY HOSPITAL <6 - - - <6
NT333 SPIRE WASHINGTON HOSPITAL - <6 - - <6
NT344 SPIRE DUNEDIN HOSPITAL - <6 - - <6
NT427 BMI - THE PARK HOSPITAL <6 - - - <6
NT436 BMI - SHIRLEY OAKS HOSPITAL - <6 - - <6
NVC01 ASHTEAD HOSPITAL - <6 - - <6
NVC18 SPRINGFIELD HOSPITAL <6 - - - <6
Total 2,045 13,705 2,741 3,821 176 22,488
Page 25 of [email protected]
www.neqos.nhs.uk

Version Document Type Date Amendments By
0.1 First Draft 10/03/2016 ---Adam Fearing,
Liz Lingard
0.2 Draft V2 15/03/2016 Amendments & Final QAAdam Fearing,
Kayoung Goffe
0.3 Draft V3 15/04/2016 Further minor amendmentsAdam Fearing,
Kayoung Goffe
0.4 Draft V4 03/05/2016 Further minor amendments Adam Fearing
0.5 Draft V5 11/05/2016 Further minor amendments Adam Fearing
0.6 Draft V6 13/06/2016 Narrative & formatting Liz Lingard
CONFIDENTIALITY CHECKLIST – FOR COMPLETION PRIOR TO ANY DRAFTS SENT TO CLIENTS
Document Classification
Prepared on behalf of
Created by
If not, the Epidemiologist AND Director must
justify why not here, highlight, and agree the need
for an NDA
Have Lightfoot/HSCIC approved use of NDA in
order to disclose small numbers?
Approved by Epidemiologist
Approved by Project Director
Peer Reviewed by (if appropriate)
Originating organisation
Website of originating organisation
Confidential
GIRFT
Adam Fearing, Andrea Brown & Liz Lingard
Liz Lingard
Helen Ridley
DOCUMENT GOVERNANCEBack Pain Report
Final
0.5
12/05/2016
Document name
Document type
Version
Date
Has the recipient of the report signed the NDA?
NEQOS
www.neqos.nhs.uk -
Please contact the NEQOS advisory service through this web link for further
information or to enquire about NEQOS undertaking similar work.
N/A
Contact email address
VERSION CONTROL
Public file location
Internal file location G:\Project Management\Project Mgt 15-16\Back Pain
Does the report include any small numbers?
If yes, can we produce a meaningful suppressed
version?
Yes
Yes, the small numbers in this report have been suppressed.
Observed events less than 6 have been replaced by "<6". Rates where
the numerator or denominator are less than 6 have been shown,
although to calculate that small number would not be possible from
the data shown here.
Page 26 of [email protected]
www.neqos.nhs.uk