BACK PAIN AND LUMBAR STENOSIS IN OLDER ADULTS. RESEARCH GROUP University of Pittsburgh Shervadalonna...
57
BACK PAIN AND LUMBAR STENOSIS IN OLDER ADULTS
-
Upload
alfred-lee -
Category
Documents
-
view
215 -
download
0
Transcript of BACK PAIN AND LUMBAR STENOSIS IN OLDER ADULTS. RESEARCH GROUP University of Pittsburgh Shervadalonna...

BACK PAIN AND LUMBAR STENOSIS IN OLDER ADULTS

RESEARCH GROUPUniversity of PittsburghShervadalonna Brown, MD Mark Chirumbole, BSJane A. Cauley, DrPH Anthony DeLitto, PhDWilliam F. Donaldson, MD Julie Fritz, PhDJames D. Kang, MD Lewis H. Kuller, MDDouglas Musgrave, MD Molly T. Vogt, PhDTerence Starz, MD
University of California at San FranciscoMichael Nevitt, PhD Lisa Palermo, MSRia San Valentin, MD
Georgetown UniversityWilliam C. Lauerman, MD
Dartmouth Medical CenterBrett Hanscom, MS James Weinstein, DO
Washington University, St LouisDavid Rubin, MD

INTRODUCTION
80% of US population experience one or more episodes of low back pain during lifetime.
One of leading causes for physician office visits and for filing disability claims.
During last 3 decades disability claim rate has increased 13 fold.
Annual medical costs related to back pain are estimated to be $8 - $18 billion.
Low back pain (LBP) affects 90% of individuals.
LBP impacts quality of life & health care expenditures.
Recovery in 4-6 weeks 90%
Recurrence in one year- 30%
Initial episode of LBP
Persistent LBP after 4-6 weeks-10%
INTRODUCTION

INTRODUCTION
National guidelines have recommended the use of analgesics as the primary pharmacologic treatment for LBP.
The choice of analgesic agent has major implications for health care costs.
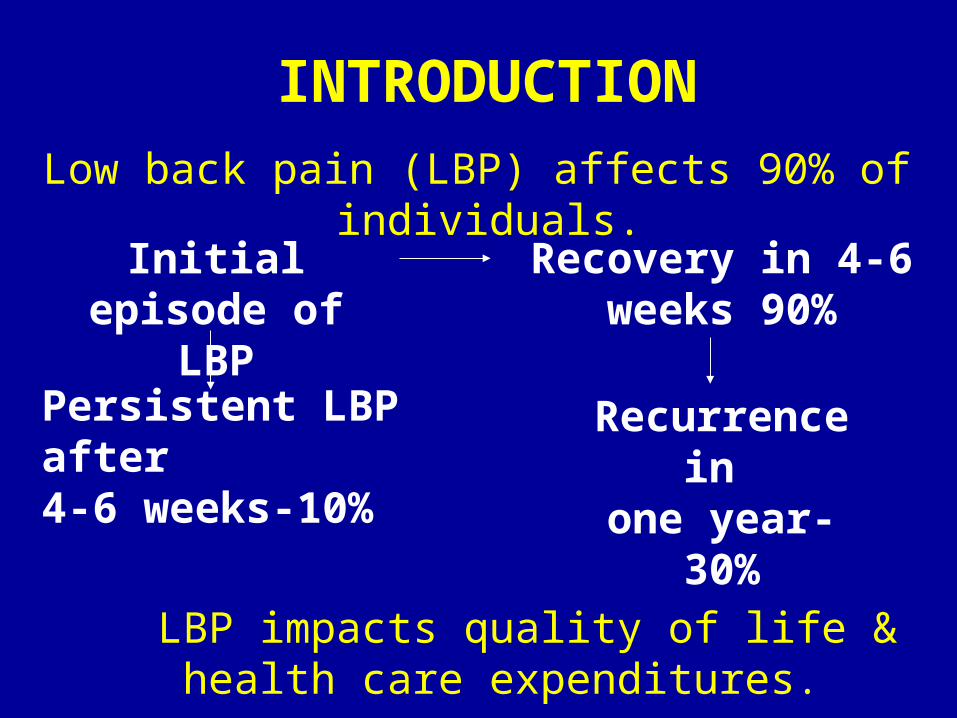
UPMC Health Plan (Commercial) • 17,228 (14.8% of total) health plan
members had at least one claim for service (pharmacy, inpatient, outpatient, laboratory, and physical /occupational therapy) for LBP management.
Total cost = $6,419,696
• 9,566 (56% of members with LBP claims) had pharmacy claims for narcotics, NSAID’s, Cox2’s or other analgesics.
Total cost = $1,403,837
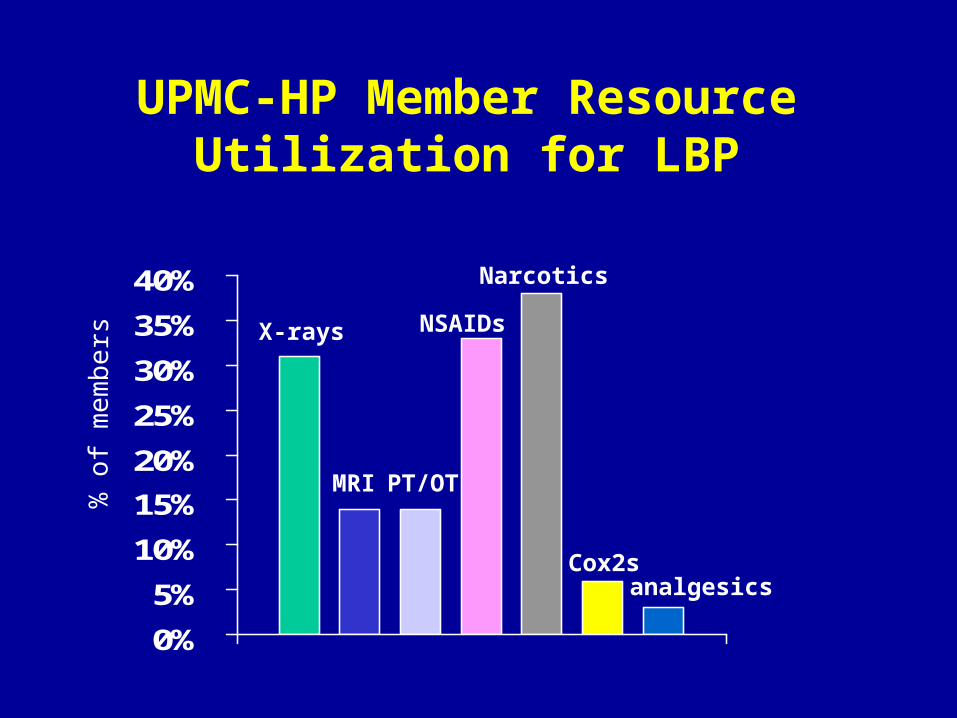
UPMC-HP Member Resource Utilization for LBP
0%
5%
10%
15%
20%
25%
30%
35%
40%
% o
f me
mb
e rs X-rays
MRI PT/OT
NSAIDs
Narcotics
Cox2sanalgesics
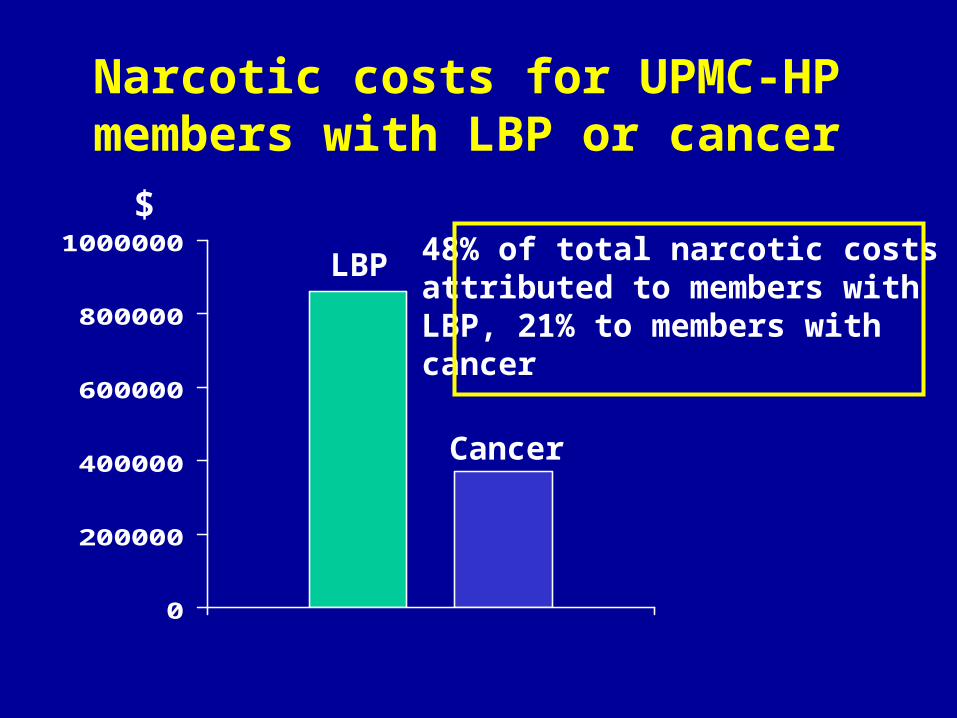
Narcotic costs for UPMC-HP members with LBP or cancer
0
200000
400000
600000
800000
1000000$
Cancer
LBP 48% of total narcotic costs attributed to members with LBP, 21% to members with cancer
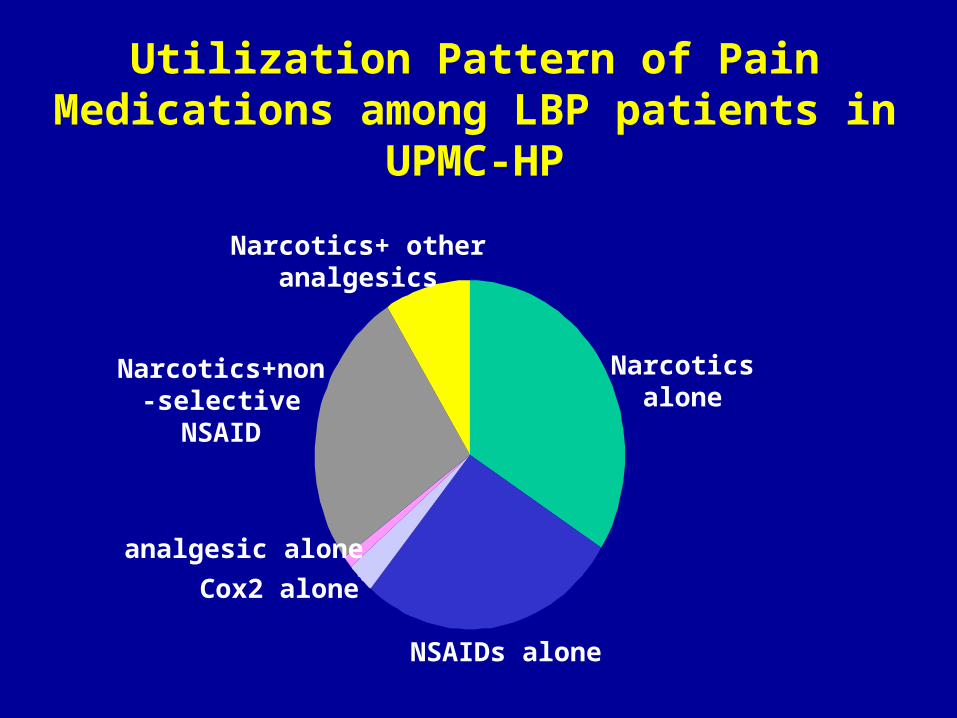
Utilization Pattern of Pain Medications among LBP patients in UPMC-HP
Narcotics alone
NSAIDs alone
Cox2 alone
analgesic alone
Narcotics+non-selective NSAID
Narcotics+ other analgesics
INTRODUCTION
Back pain in adult patients linked with:
• lifestyle factors (smoking, obesity, physical activity, education)
• anatomic abnormalities of lumbar spine
Back pain in the elderly related to:
• degenerative changes due to aging• lifestyle less important
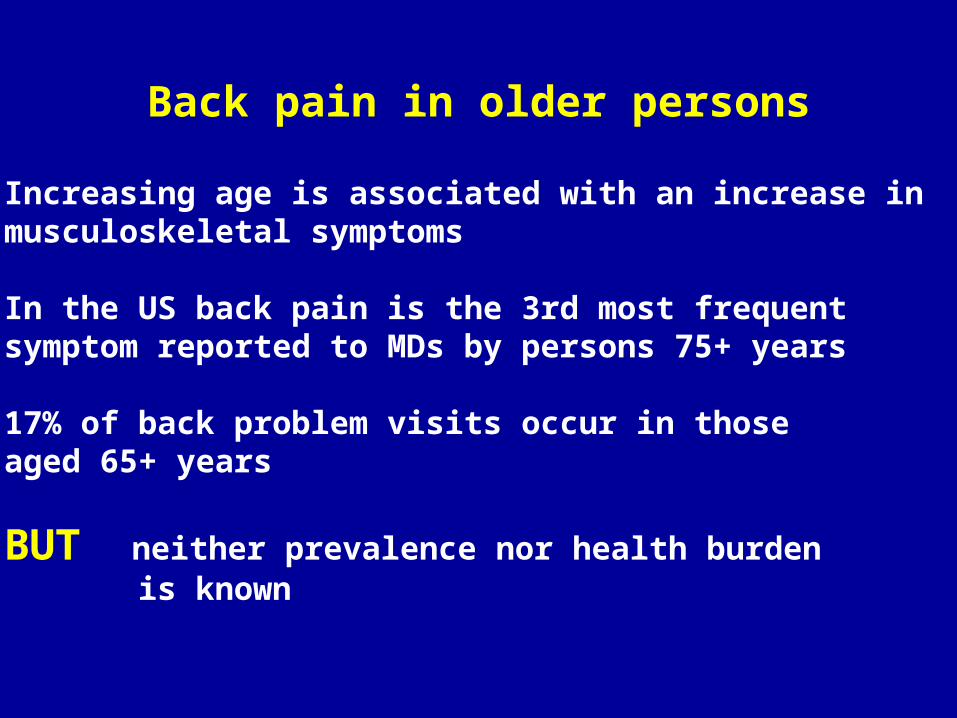
Back pain in older persons
Increasing age is associated with an increase in musculoskeletal symptoms
In the US back pain is the 3rd most frequent symptom reported to MDs by persons 75+ years
17% of back problem visits occur in those aged 65+ years
BUT neither prevalence nor health burden is known

Prevalence of back pain in older persons
# studies % prevalence
Community
9
13 - 49
Primary practice
3
23 - 51
Nursing home
1
40
Bressler, et al. Spine 1999
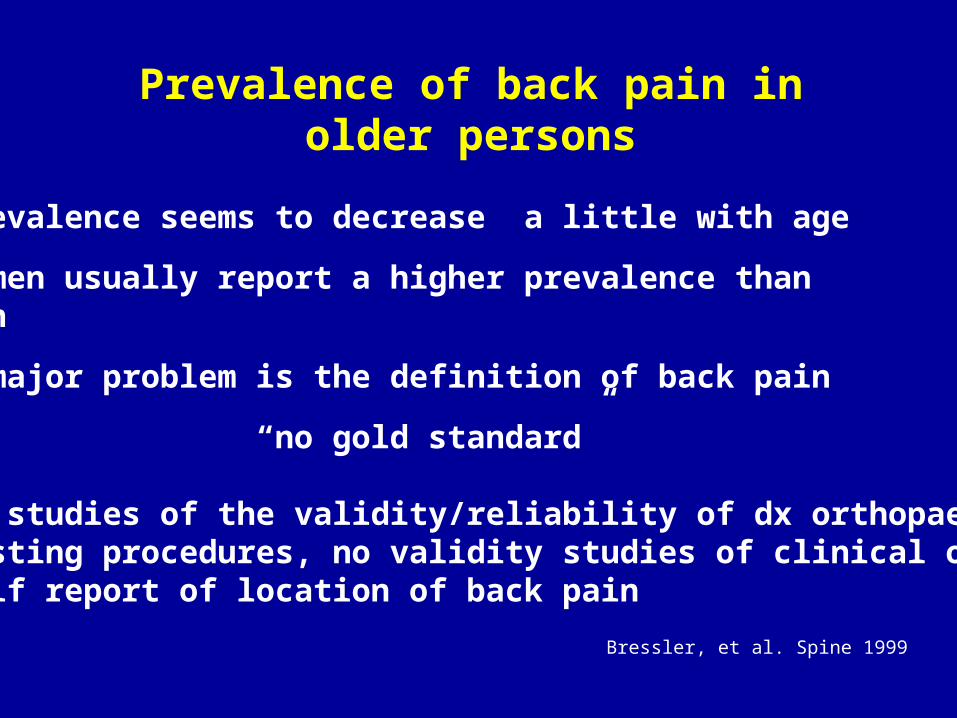
Prevalence of back pain in older persons
Prevalence seems to decrease a little with age
Women usually report a higher prevalence than men
A major problem is the definition of back pain
“no gold standard”
No studies of the validity/reliability of dx orthopaedic testing procedures, no validity studies of clinical or self report of location of back pain
Bressler, et al. Spine 1999

Patient factors contributing to the variability of prevalence of back pain in
older persons
• cognitive impairment• depression• decreased pain perception• increased pain tolerance• comorbid conditions• decreased physical activity• resignation to aging effects• selective participation in studies
Overall seems likely that back pain is often under-reported

Relationship between history of CVD at baseline and back problems at the 3rd clinic visit
Age-adj OR (95% CI) ______________________________________________
Back pn since 1st clin vis none 1.0 mild/mod 1.3 (1.0, 1.6) severe 2.6 (1.7, 4.0)
One + days of lim act due to back pain 2.3 (1.6, 2.3)
One + days in bed due to back pain 1.2 (0.6, 2.3)
Vogt, et al, Spine 1997

Odds ratio for back pain at baseline in SOF women (65+ yrs) by estrogen usage
0
0.2
0.4
0.6
0.8
1
1.2
1.4
1.6
baseline follow-up
Never
Former
Current
Od
ds
rati
o
*
**
*
Visit Musgrave, et al. Spine 2001

Causes of back pain in older patients
Acute (< four weeks)
lumbar strain/sprain osteoporotic fracture, vertebral or pelvic abdominal aortic aneurysm
Subacute/Chronic (> four weeks)
degenerative disc and joint disease malignancy fibromyalgia polymyalgia rheumatica Parkinson’s disease
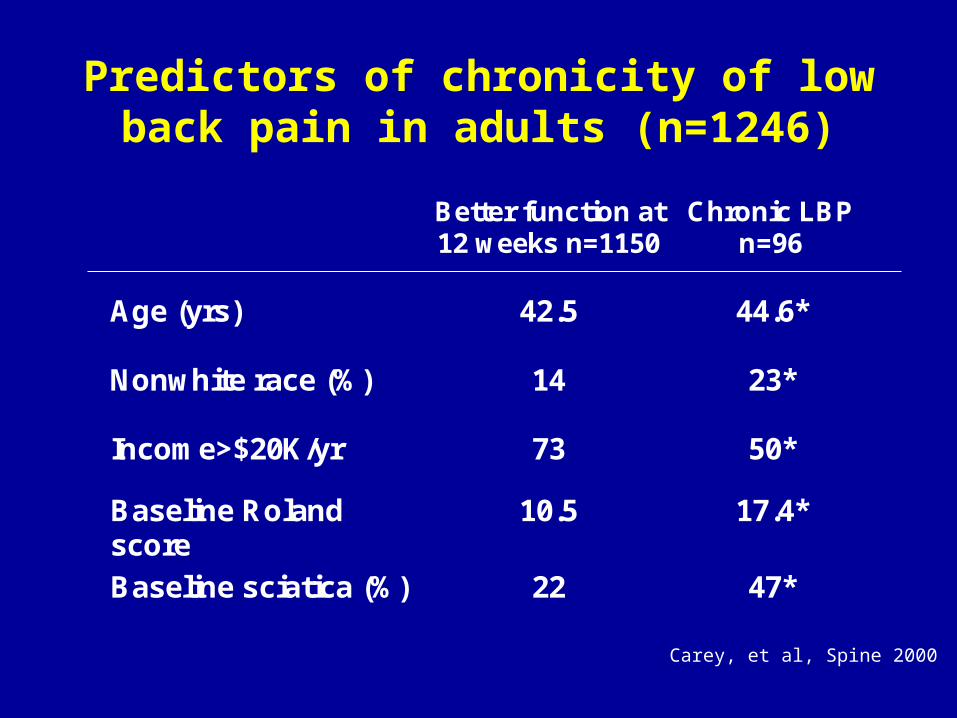
Predictors of chronicity of low back pain in adults (n=1246)
Better function at 12 weeks n=1150
Chronic LBP n=96
Age (yrs)
42.5
44.6*
Nonwhite race (%)
14
23*
Income>$20K/yr 73 50*
Baseline Roland score
10.5 17.4*
Baseline sciatica (%) 22 47*
Carey, et al, Spine 2000

Primary location of pain
1. Lower back pain alone
2. Pain radiating into buttocks and leg
* upper anterior thigh/groin * lateral hip * below knee
Malignant, infectious or visceral pain is constant whatever position of body. Mechanical, myofascialor degenerative pain varies by body position - usually lessens when personis supine

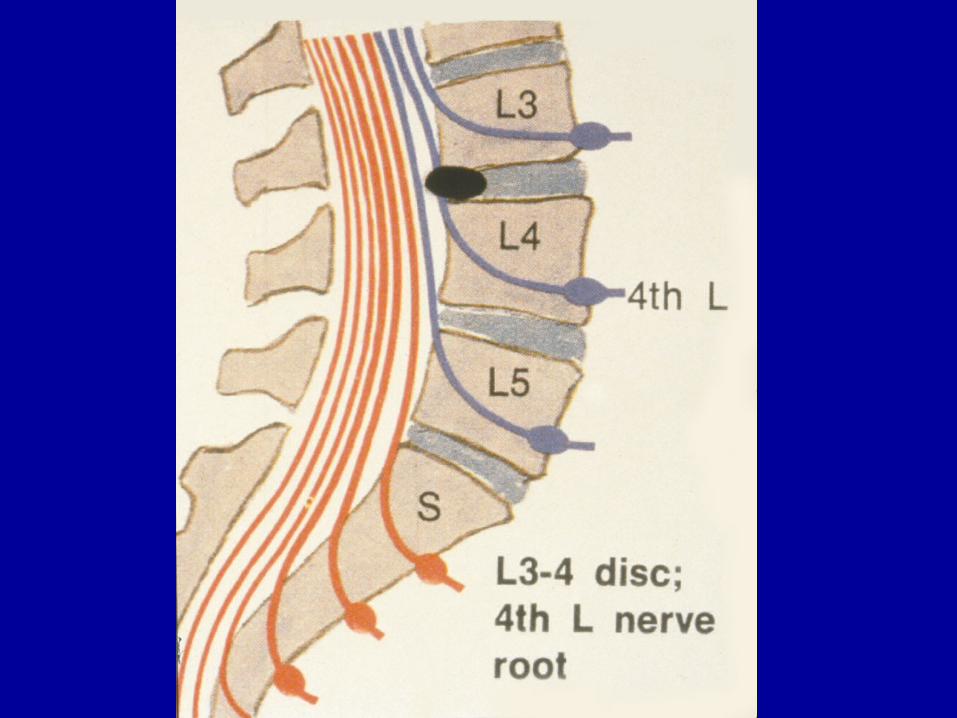
Radicular pain
spinal nerve entrapment by disc herniation or spinal stenosis
pain in leg, paresthesia, weakness


Causes of leg pain in older patients
True radicular pain
lumbar stenosislumbar disc herniation
Pseudosciatica
trochanteric bursitisosteoarthritis of the hipdiabetic neuropathy


ANATOMY
Normal human spine is lordotic in the lumbar region. During typical movements
upper lumbar vertebrae - posterior shear lower lumbar vertebrae - anterior shear
Stability maintained by facet joints, intervertebral discs, ligaments, related muscle groups

PATHOLOGY
Degenerative changes in the lumbar spine
disc degenerationvertebral compression deformitiesligamentous laxitydeterioration of facet joint cartilage
May cause instability and subluxation of one vertebra on another (degenerative spondylolisthesis)
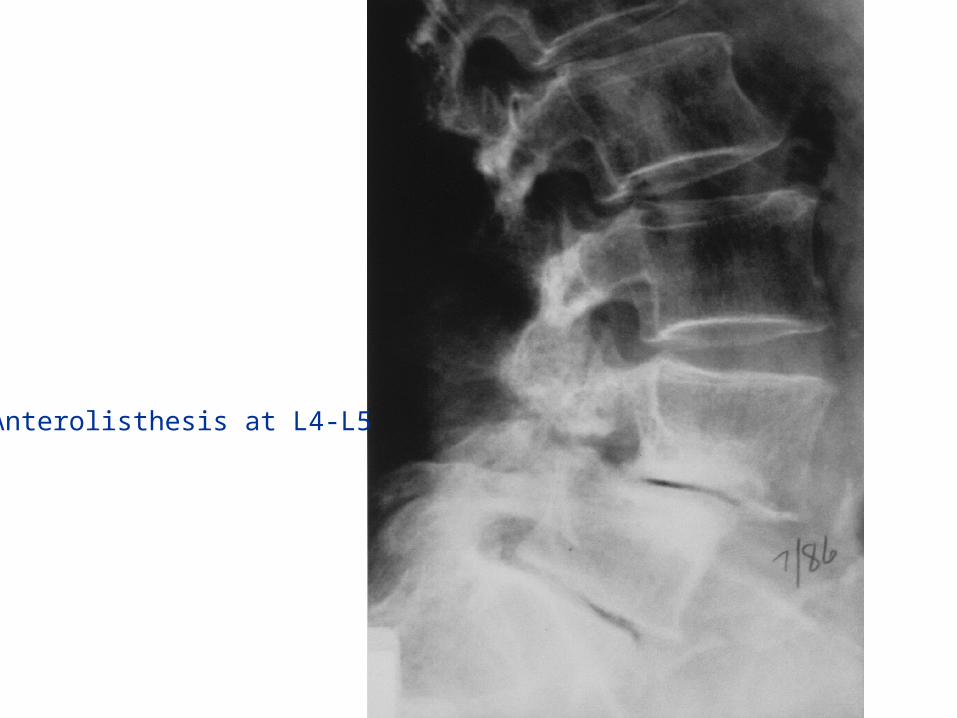
Anterolisthesis at L4-L5

PATHOLOGY
Backward slippage (retrolisthesis) is generally believed to be asymptomatic and of little clinical significance.
Forward slippage (anterolisthesis) may result in narrowing of vertebral canal and neural foramina (spinal stenosis) leading to development of chronic back pain (with or without leg pain). Compression of L5 spinal nerve may be involved.
PATHOLOGY
When LS joint is particularly stable, L4 and L5 are more vulnerable to stress forces. If degenerative changes have occurred, anterolisthesis at L4 is more likely.
Clinical symptoms associated with anterior subluxation
at L4-L5 80% at L3-L4 10-20%

PATHOLOGY
Spinal stenosis symptoms:
back pain progressing to leg painfunctional independence deterioratesreduced ability to walkreduced ability to carry out ADLs
Symptoms often episodic, no natural resolution over time
EPIDEMIOLOGY
Several clinical and cadaveric studies suggest that anterolisthesis is 5 times more common in women vs men
2-4 times more common in blacks than whites
4 times more prevalent in diabetics
3 times more common in oophorectomized women compared to controls

Prevalence of lumbar listhesis (L3-S1) in elderly white women (SOF)
05
1015202530354045
65-69 70-74 75-79 80+
Age in years
% p
reva
len
ce
anterolisthesis
retrolisthesisp for trend = 0.027
p for trend = 0.75
listhesis defined as subluxation > 3mm
CLINICAL RELATIONSHIPS
Relationship between radiographic abnormalities and spinal symptoms is unclear.
People with no back pain show disc abnormalities (64%), stenosis (7%) andanterolisthesis (7%) (Boden, JBJS 1990, Jensen NEJM 1994 ).
Not known whether people with sub-clinical disease later develop symptoms.
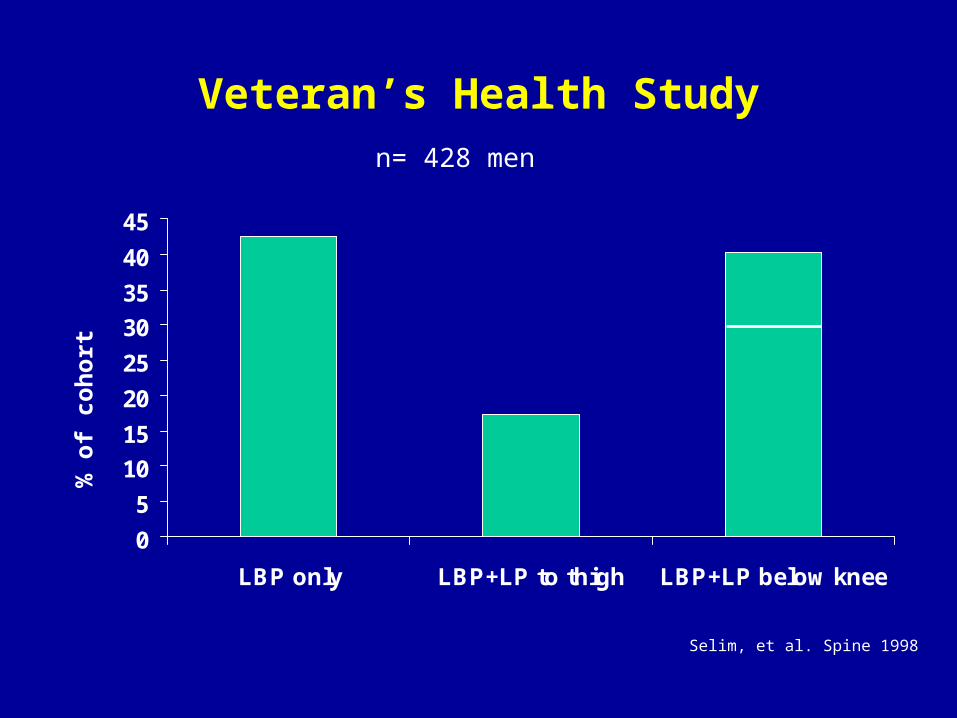
Veteran’s Health Study
0
5
10
15
20
25
30
35
40
45
LBP only LBP+LP to thigh LBP+LP below knee
% o
f co
ho
rt
n= 428 men
Selim, et al. Spine 1998

Veteran’s Health Study
Medic use
MRI
Surgery LBP alone
1.0
1.0
1.0
LP to thigh
1.5
(0.7,3.1)
3.2
(1.5,6.7)
0.9
(0.3,3.0)
LP below knee (-ve SLR)
1.8
(1.0,3.4)
3.5
(1.9,6.5)
3.7
(1.7,8.1)
LP below knee (+ve SLR)
5.1
(1.2,22.9)
6.8
(2.7,17.2)
3.9
(1.3,11.4)
Selim, et al. Spine 1998

0
10
20
30
40
50
60
70
PF RP BP GH VT MH SF RE
LBP onlyLBP/LP to thigh
LBP/LP below knee (-ve SLR)LBP/LP below knee (+ve SLR)
SF-36 scores for men with LBP enrolled in the Veteran’s Health Study
Sco
re
p for trend <0.05 for all domains
Selim, et al. Spine 1998

Distribution of lower back and leg pain symptoms w/in last month among white WHI women aged 50 years and older
0
10
20
30
40
50
60
No LBP LBP only LBP+LP LBP+LP imprby sitting
% o
f c
oh
ort
n=295 n=182n=47 n=49
Vogt et al. J Gerontol 2002

30
40
50
60
70
80
90
100
PF RP BP GH VT MH SF RE
no LBPLBP
LBP/LPLBP/LP improved by sitting
SF-36 scores for white women enrolled in WHI (adjusted for age and BMI)
Sco
re
Vogt et al. J Gerontol 2002

Relationship of race to prevalence and use of health care resources for LBP
Whites (%) AAmer (%)
Prev acute LBP last yr 8.3 (7.3, 9.3) 5.2 (3.8, 6.6)
Prev chronic LBP last yr 4.1 (3.4, 4.7) 3.0 (2.0, 4.0)
Prev seeking care 36 59
Random digit dialing + structured interview4,437 households in NC 8067 individuals
Carey, et al, Spine 1996

Relationship of race to prevalence and use of health care resources for LBP
Whites AAmer p
Pain score 5.25 5.92 <0.01
Disability score 11 12.1 0.01
X-rays (%) 49 40 0.05
Other imaging 10 6 0.05
Cohort study, random group of health care providers
Carey, et al, 2000

Elderly African American women (SOF) reporting back pain during previous four
weeks
50%
23%
20%
7%
no LBP
mild LBP
moderate LBP
severe LBPN=470
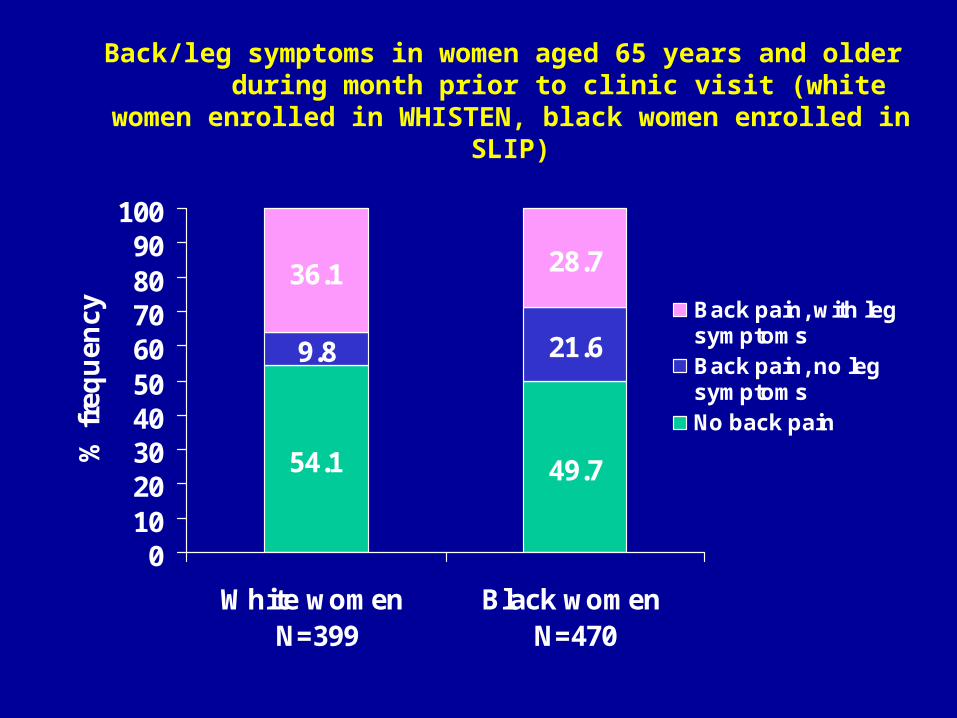
Back/leg symptoms in women aged 65 years and older during month prior to clinic visit (white women enrolled in
WHISTEN, black women enrolled in SLIP)
54.1 49.7
21.6
36.1 28.7
9.8
0102030405060708090
100
White women N=399
Black women N=470
% f
req
uen
cy Back pain, with legsymptomsBack pain, no leg symptomsNo back pain

Prevalence of lumbar listhesis (L3-S1) in black elderly women by age
0
10
20
30
40
50
60
70
80
65-69 70-74 75-79 80+
Age in years
% p
reva
len
ce
Anterolisthesis
Retrolisthesis
p for trend = 0.095
p for trend = 0.207
listhesis defined as subluxation > 3mm
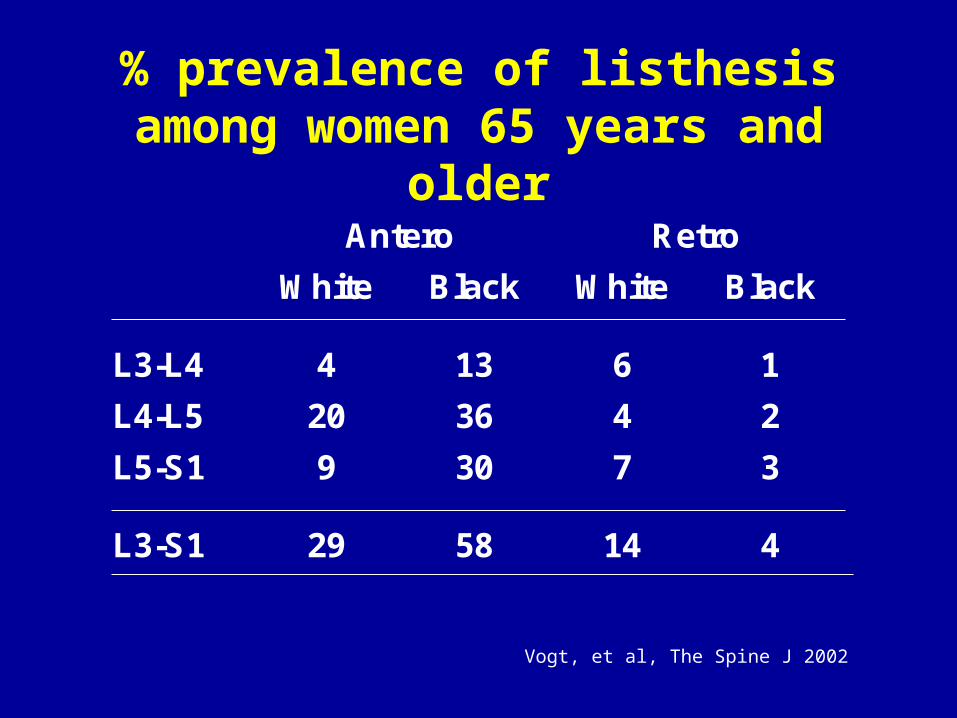
% prevalence of listhesis among women 65 years and older
Antero Retro
White Black White Black
L3-L4 4 13 6 1
L4-L5 20 36 4 2
L5-S1
9 30 7 3
L3-S1 29 58 14 4
Vogt, et al, The Spine J 2002
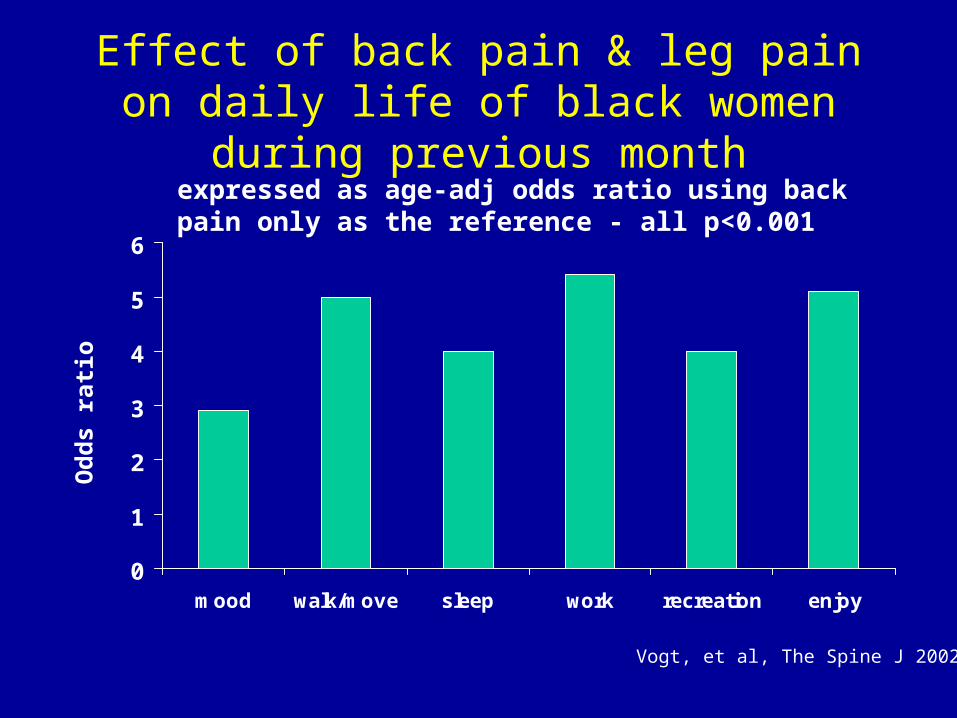
Effect of back pain & leg pain on daily life of black women during previous month
0
1
2
3
4
5
6
mood walk/move sleep work recreation enjoy
Od
ds
rat i
o
expressed as age-adj odds ratio using back pain only as the reference - all p<0.001
Vogt, et al, The Spine J 2002

PREVENTION
Because most people experience LBPduring their lifetime, the distinction between primary and secondary prevention is blurred.
• which interventions can prevent occurrence of LBP?
• which interventions can prevent development of chronic LBP?

PREVENTION
Evidence-based medicine categories
Level A - strong consistent - multiple RCTs
Level B - moderate - one RCT + multiple CCTs
Level C - limited - one CCT
Level D - no evidence

PREVENTION
Lumbar supports
•provide support• remind to lift properly intra-abdom pressure and intradiscal pressure
RCTs negativeCCTs positive – reduce incidence of LBP and back injury
Level A - ve

PREVENTION
Back Schools and Education
• provide knowledge about body mechanics, stress, exercise• aim to influence behavior
9 RCTs - most are negative5 CCTs - positive
Level A -ve

PREVENTION
Exercises
• strengthen back muscles• increase blood supply • improve mood and alter perception of pain
6 RCTs – reduced pain and sick leave
Level A + ve

PREVENTION
Ergonomics
• job related interventions
No RCTs or CCTs
Level D - ve

PREVENTION
Risk Factor Modification
• individual (weight, strength, smoking)
• biomechanical (lifting, posture)
• psychosocial (job control, job dissatisfaction, depression)
No RCTs or CCTs
Level D - ve

Review of 47 epidemiologic studies concluded that smoking may be a ‘weak risk indicator and not a cause of low back pain’ Le-Bouef-Yde Spine 1999
Smoking may have a systemic effect on the musculoskeletal system - associated with generalized pain.
Biological basis unknown - neuroendocrine effect?

Decrement in SF-36 scores (compared to age-sex specific norms) for patients with
spinal problems by smoking status
-80
-70
-60
-50
-40
-30
-20
-10
0
PF RP BP HP MH EF SF RE
Smokers (n = 4249)
Non-smokers (n = 21206)
General population in US
SF
-36
sco
re
Vogt, et al, Spine 2002

PREVENTION
Currently only exercise seems to be helpful in prevention of LBP.
Consistent evidence – Level A.
Linton, van Tulder, Spine 2001
PREVENTION
Why the disappointing results?
• small studies, low power, short follow-up, variation in intervention, varying outcome
• natural course of back pain, hard to define and categorize, multi-factorial causation
• single modal programs studied mostly, maybe multi-dimensional approach needed
• timing, compliance