Consumers Awareness, Attitude and Preference towards Patanjali Retail Products

University of Fribourg Faculty of Economics and Social Sciences Chair of Marketing Studies: BA in Management
Bachelor Thesis Consumers’ attitude towards social media advertising An empirical study
Deposed by Camilla Cretti
Date of birth: 14.03.1992 Student number: 11-746-674 eMail address: [email protected]
Pursuant to the requirements for obtaining the Bachelor of Arts (B.A.)
Supervisor Prof. Dr. Olivier Furrer Grad.Assist. Ghizlane Arifine
Period of redaction 28.10.2014 - 04.09.2015
Place and Date Fribourg, [DD.09.2015]

1
Table of contents
TABLE OF CONTENTS .................................................................................................................................... 1
INDEX OF FIGURES ......................................................................................................................................... 2
INDEX OF TABLES .......................................................................................................................................... 2
ABSTRACT ........................................................................................................................................................ 3
1. INTRODUCTION ...................................................................................................................................... 4 1.1. THE RESEARCH QUESTION ........................................................................................................................................ 4 1.2. STRUCTURE OF THE RESEARCH ............................................................................................................................... 5
2. THEORETICAL FRAMEWORK ............................................................................................................. 6 2.1. THE SOCIAL NETWORKS ............................................................................................................................................ 6 2.2. SOCIAL NETWORKS’ UTILITY FOR COMPANIES ...................................................................................................... 7 2.3. THE ATTITUDE TOWARDS DIGITAL ADVERTISING ................................................................................................ 9 2.4. COMMUNICATION ..................................................................................................................................................... 12 2.4.1. Consumers’ Online Brand Related Activities ....................................................................................... 12 2.4.2. The Word of Mouth ........................................................................................................................................ 14
2.5. BRAND ENGAGEMENT .............................................................................................................................................. 16 2.6. DEVELOPMENT OF THE RESEARCH MODEL ..................................................................................................... 17
3. STUDY DESIGN ..................................................................................................................................... 18 3.1. SAMPLE ...................................................................................................................................................................... 18 3.2. INSTRUMENTS ........................................................................................................................................................... 18
4. RESULTS ................................................................................................................................................. 20 4.1. FACTOR ANALYSIS .................................................................................................................................................... 21 4.2. RELIABILITY OF THE RESEARCH ............................................................................................................................ 27 4.3. REGRESSION ANALYSIS ............................................................................................................................................ 29 4.3.1. Regression analysis -‐ Group 1 .................................................................................................................... 29 4.3.2. Regression analyses – Group 2 .................................................................................................................. 31

2
Index of figures
Figure 1: Research Model ........................................................................................................ 17
Figure 2: Pie chart of the average use of social media ............................................................ 20
Index of Tables
Table 1: Schema of the three analyses ..................................................................................... 21
Table 2: Pattern Matrix analysis 1, n=124 ............................................................................... 22
Table 3: Pattern Matrix analyse number 2, Group 1, n=55 ..................................................... 23
Table 4: Factor analyse number 3, Group 2, Pattern Matrix ................................................... 24
Table 5: Component Correlation Matrix of the whole sample ................................................ 25
Table 6: Component Correlation Matrix, Group 1 .................................................................. 26
Table 7: Component Correlation Matrix, Group 2 .................................................................. 26
Table 8: KMO and Bartlett's Indexes ...................................................................................... 27
Table 9: Mean, Stardard Deviation and Cronbach's alpha of the items, scale 1 to 5, n=124 .. 28
Table 10: Model Summary of the Regression, Group 1 .......................................................... 30
Table 11: ANOVA table, Group 1 ........................................................................................... 30
Table 12: Coefficients of the Analysis, Group 1 ..................................................................... 31
Table 13: Model Summary, Group 2 ....................................................................................... 31
Table 14: ANOVA table, Group 2 ........................................................................................... 31
Table 15: Coefficients of the analysis, Group 2 ...................................................................... 32
Table 16: Significance ............................................................................................................. 33

3
Abstract
4
1. Introduction
1.1. The research question
We live in an era where technology has come to play a very important role in our society. The
advent of the Internet has taken over people’s lives, enabled by the enormous growth of
technologies that can be accessed very easily: whoever is interested in connecting to the web
can do it whenever, everywhere and almost for free thanks to the extremely modern
technologies that are nowadays accessible to most people (Boyd & Ellison, 2008).
Social media followed shortly after: the number of people using these platforms has been
growing very rapidly in the past few years and is changing the way people interact and
communicate with each other. In 2011, 2.4 billion accounts were created on social media
(Chitu & Tecau, 2012). These numbers are facilitated by smartphones, applications and
laptops. As a result, people use social media on a daily basis, as a part of their lives.
Social networks are incredibly powerful tools that have forced companies to adapt their
strategy to conform to them. Marketing has gone trough an important development, as the
Internet has changed its rules, and most organizations saw the opportunity to advertise on
social media. This adaptation became integrated within any company media plan, in order to
reach the millions of consumers that use social media on a daily basis (Chu, 2011).
The acceptance of social media marketing is very important to the success of companies
(Tucker, 2014): consumers can feel overwhelmed by social network marketing, which makes
it counterproductive: companies have to find a certain balance in order not to scare them away
(Zhou & Bao, 2002). For example, according to a study, only 22% of the questioned users
had a positive attitude towards advertising and 8% of them had left a certain social network
because of the feeling of being overexposed to advertising (Taylor et al., 2011; Hair, Hadija
& Barnes, 2012). Is it possible to find some of the factors that inhibit or stimulate consumer
attitudes toward social media advertising?
The aforementioned question highlights a very important challenge of social network
marketing, which is fundamental for any organization to understand: which factors have an
influence on the acceptance of social network advertising? This paper makes a first effort to
come to such an understanding, trying to describe how individuals react to this kind of
advertising, what affects their behaviour and how do these factors influence it.

5
1.2. Structure of the research
The purpose of this paper is to understand which are the factors that have an impact on
customer’s acceptance of social network advertising and what influences them.
First, I will introduce the importance of the Internet in reshaping markets, with an accent on
the developments that marketing has gone through with its arrival. To fully understand how
entrepreneurs and companies have had to adapt to this technological revolution, the paper will
continue by explaining how social networks have come to play a role in marketing.
Then the importance of consumer’s attitude will be analysed (the central topic of the research)
and of some influencing factors on the reception of social networks in general and on people’s
tendency to communicate about their preferred brands creating “brand communities” (a fact
seen as a form of engagement). The goal of this research is to come to a conclusion on
whether these factors have a positive or negative influence on the attitude towards social
media advertising. A collecting of data and empirical part will follow, first explaining the
generalities of the sample and the instruments used.
The chapter of the results, showing the various analyses done on the data collected will start
with a factor analysis, followed by the values that give reliability to the research. At last, a
regression will be done to confirm or deny the hypotheses formulated in the theoretical
chapter.
A discussion of the results will follow, in order to conclude the analysis and examine the
results.

6
2. Theoretical framework
In this chapter, some of the previous research made in the field of social network advertising
will be mentioned in order to create a theoretical basis for my research hypothesis.
The importance of the World Wide Web phenomenon can be expressed in digits: in 2011 the
number of Internet users counted 2.1 billion people, and it was estimated to grow to 3.4
billion by 2015. The e-mail accounts for that year were 3.14 billion, the number of existing
websites 555 million and the Web was counting 95 million of pages ending in ‘.com’ (Chitu
& Tecau, 2012). These numbers are impressing, but not surprising. The Internet has taken
over our lives, enabled by the enormous growth of technological progress allowing easy
access to its resources: whoever is interested in connecting on the web can do it whenever he
wants to, everywhere and almost for free thanks to the extremely modern technologies that
nowadays are accessible to most people. The occurrence of social networks followed the
popularity of the Internet among the newest generation, which in terms of use of technology
has habits completely different from the previous ones (Erragcha & Romdhane, 2014).
2.1. The social networks
The notion of ‘social network’ is more ancient than we may think and belongs to sociology: it
states that to study a society it is necessary to examine the connections and interactions
between its single individuals. Since the advent of the Internet the expression has largely
evolved (Cordina, 2012), and now it mainly refers to social platforms on the Web, where
people are connected on a virtual level and in many ways (Bauer, Barnes, Reichardt &
Neumann, 2005): these platforms are highly interactive virtual communities that permit the
conversation and exchange of information between users, the dissemination of any kind of
content on the web (Mangold & Faulds, 2009).
The introduction of social networks on the net in 2004, followed by its tremendously rapid
growth (Kelly, Kerr & Drennan, 2010), has changed not only the Internet (which before was
used mostly as an information source) but also the way people interact and communicate with
each other. In 2011, 2.4 billion accounts were created on social media (Chitu & Tecau, 2012).
It is difficult to fully describe the domain of social networks because of the very varied sites,
services and possibilities: there simply are too many, and they offer too wide a spectrum of

7
opportunities (Tucker, 2014). Social platforms allow users to exchange content, create digital
connections and interact with friends (Cordina, 2012). People are not anonyms but registered
and they show on the platforms their personal information, pictures and intimate details about
themselves: opinions, thoughts and ideas that can be seen by a large spectrum of selected
friends. They allow users, thanks to a specific set of tools, to be part of incredibly big and
international communities (Kelly et al. 2010).
Communication and its rules have incredibly changed and are still evolving, putting into
discussion issues like privacy, credibility and also advertising avoidance (Bauer & al., 2005).
Many factors have an influence on the user’s perceptions, which can also be negative. The
acceptance of the information and stimuli coming from social networks appears to come from
different factors, which will be the central focus of this empirical research. Because social
networks are usually financed by targeted advertising (Kelly, Kerr & Drennan, 2010), often
people develop negative, overwhelming feelings towards them (Kelly et al. 2010; Aaker &
Bruzzone, 1985; Hair et al., 2012; Taylor et al., 2011).
2.2. Social networks’ utility for companies
Internet is companies’ first source of information, a powerful instrument that holds any
answer the customer could be looking for. Today, 70% of users surfing the Web state that the
advent of the Internet has deeply and significantly changed the way they get informed about
company related content, and 74% of them before purchasing an item have looked for the
opinion of others (Cordina, 2012). The combination of increased product availability and
limited brand knowledge has boosted the demand for product information (Van-Tien Dao et
al., 2014), which the customer purposefully looks for on online advertisement (Sultan, Gao &
Rohm, 2010).
Research shows that when a customer is looking for certain information related to a company
or a specific product on the web, he relies on social networks as much as on the company
websites (Kazm Kirtia & Filiz Karahanb, 2011): that leads to social network marketing.
It is fundamental for companies to have a consistent presence on the web in order to survive.
Nowadays they can’t afford not to have their own website or social network, the enormous
development of the platforms making it impossible for a brand to ignore the great spectrum of
opportunities enclosed there. Companies have to embrace this new marketing opportunity and
challenge (Cordina, 2012).
8
The marketing strength of these platforms is in the fact that they are self-selected and not
imposed: the individual himself has chosen to belong to them.
The principle of advertising on social media is to include the potential customer at every level
of the marketing strategy: his role is no longer only passive (Parsons, 2013) and the challenge
is to get him involved and to establish a lasting connection by making him participate
indirectly in the marketing operation. The customer can now be an active player in the
process, and the advantages of this are numerous and mutual (Rodgers & Chen, 2002). Such
customer participation is less expensive than common advertising as it enables both direct
links and communication between the targeted public and the organization, allowing a
customized promotion. Long-term relationships are built through interaction, which is
enabled by the tools of social networks - the comments, the “likes” and the different features
offered by the platforms. One of the purposes of this kind of marketing is to participate
actively but not too formally, in people’s lives, so that in turn users are involved in the
creation of marketing content (Chu, 2011).
Companies can participate on the platforms in different ways: by creating their own page or
by communicating through an already existing community, or by promoting the
communication and interaction with consumers, just like these latter do with their friends and
family (Rodgers & Thorson, 2000).
In these digital communities, customers have the opportunity to communicate whatever they
wish directly to the brand, and to share their opinion and experiences with other users
(Rodgers & Thorson, 2000). As aforementioned, they don’t merely play a passive role in the
marketing like before the advent of the Internet, but they rather can contribute to the
marketing by creating content, giving feedbacks and opinions and sharing their interests. The
consumer is creator of consensus and opinions and thus he has become a ‘consumactor’
(Cordina, 2012), not just a receiver of information but also a releaser of his own content. He
even came to embody the media by playing a role in the transmission, creation, dissemination
and collection of information. Therefore, power has moved away from organizations and
towards the individual and the communities of social networks (Berthon, Pitt, Plangger &
Shapiro, 2012).
Each and every user is only a click away from an incredible number of contacts (social
networks allow the users to create a network of virtual friends), which enables an important

9
communication flow. The key fact that information doesn’t come only from companies but
from users as well defines the horizontal revolution, the empowerment of the consumer
(Tuten & Solomon, 2012).
Since now customers have the power to influence the reputation of a company, it is very
important to consider the way they communicate. This can occur in different ways: electronic
word of mouth (eWoM), user generated content (UGC) and general consumers online brand
related activities. All of these virtual actions result from the fact that people tend to share
features they like and consider worthy to be spread. The message, coming from user to user,
is identified as trusted since it comes from a known source: it has been estimated that 10% of
Americans judge and determine other’s people lives basing on their likes and dislikes on
social networks (Cooke & Buckley, 2008). Three important groups of people have been
identified by Malcolm Gladwell in 2002 on the platforms (Cooke & Buckley, 2008): the
‘connectors’ have a large number of contacts and spread a message quickly through this net;
the ‘mavens’ have a certain area of expertise and collect and gather information in order to
pass it on; at last the ‘salesmen’ are the kind of people able to spread a certain message only
by using their character as a force. These typologies are limited in a way that often people
engage in multiple roles (Muntinga et al. 2011), but they are useful to underline how
incredibly powerful the word of mouth on social network is for marketing purposes, and
confirms the possibilities of examining the flows of information on the net.
However, despite all the great possibilities that social networks give to companies, active
social media advertisements can (paradoxically) be counterproductive. There is a thin line
between acceptance and intolerance: consumers can feel overwhelmed and annoyed by this
latter kind of marketing (Greengard, 2012). As aforementioned, websites are financed by
targeted advertising, which is on the one hand necessary for the platform’s survival, but on
the other hand can distance users, who can feel overwhelmed by it (Kelly et al. 2010; Aaker
& Bruzzone, 1985; Hair et al., 2012; Taylor et al., 2011).
2.3. The attitude towards digital advertising
Many studies have focused on social media users’ attitude towards publicity (Campbell,
Ferraro & Sands, 2012; Kelly, Kerr & Drennan, 2010; Wolin, Korgaonkar & Lund, 2002),
and they all report that customers often have a certain inclination to avoid advertising.

10
Keeping track of this behaviour is extremely important for both advertisers and the websites
themselves, as they obviously influence the consumer’s attention (Cheng, Blackson, Wang &
Cho, 2009). According to a study, only 22% of consumers questioned had a positive attitude
towards digital advertising, and 8% of users studied had left a certain social network because
of what they felt as excessive publicity (David et al., 2011).
Advertising avoidance can occur in different ways: for example while reading a magazine or
the newspaper we purposely skip the advertisements (cognitive method), or when the
commercials are up on TV we leave the room (behavioural method) or last, we close the
banners on our pc (mechanical method). Before the occurrence of modern technologies it was
possible to avoid publicity only by ignoring it or turning the head around, while now video
recorders and computers make it easier to completely hide it from the sight (Kelly, Kerr &
Drennan, 2010), another sign of consumer empowerment. The attitude towards social network
advertising is very important, as this kind of publicity isn’t only beneficial for organizations,
it also provides the websites with the revenue that allows their survival: the problem is that at
the same time, users can feel overwhelmed by it and social network lose their appeal (Hadija,
Barnes & Hair, 2012).
As a reaction to excessive publicity customers close themselves up to shield it out: this way
they manage to control, and so to avoid, the ‘push’ factor of the markets that are spreading the
message. They are the ones who decide which advertisements will manage to reach them
(Kelly et al., 2010): this kind of selection, that empowers the user, enables him to ‘pull’
whatever information he desires from the media, be it television or the Internet. Basically, the
consumer controls the flow of information, so it is fundamental for companies to understand
what makes them ‘accept’ the advertised message; otherwise it probably won’t get to them
(Wang & Sun 2010).
Younger users tend to trust Internet sources more than their older counterparts (Thayer &
Ray, 2006). It appears as logical news, as they have been growing up in an era where
technology has always existed: they are digital natives (Tuten & Solomon, 2012). Online use
is being integrated in this generation’s personal and professional life, also encouraged by
schools: nowadays students probably cannot even recall when the Internet was made of fuzzy
images that could almost only transmit text. They are the first ones to have embraced the Web
2.0 technologies and the new social media that came along, they have grown up with
technology and are much more elastic to it (Correa, Hinsley, & De Zúñiga, 2010). It was

11
found that the most frequent users of the Internet are men and women between 20 and 30
years old, while older users (between the 50s and 60s) tend to use it less and only for
exchanging emails, reading the news or checking weather forecasts, for example. In this latter
case, the Internet doesn’t have any recreational use, only practical. The big generation gap
caused by technology justifies the following data: 81% of people who say they will never get
online are over 50, and so say 56% of people over 65 years (Thayer & Ray, 2006).
For what concerns the average amount of time spent on the Internet, people can be divided in
three different groups; depending on the frequency of they use and on the nature of their
experience (Correa, Hinsley, & De Zúñiga, 2010). High Internet users have used it for over
three years, they log onto it every day, and have made it an integrant part of their daily life
(Wang & Sun, 2010). They use it for work or school tasks, to boost their social life and are
more likely to accept the Web as they feel more comfortable on it than low or medium users.
Medium Internet users may have used it for two to three years and log in daily, and though
they do it for a shorter period of time than the ‘high Internet users’, it is enough to make them
feel comfortable in Web-related activities. Low Internet users are often relatively new to the
concept of using the Internet frequently or as a part of their daily lives: consequently they are
not really confortable with it. Gender also plays a role in determining consumers’ attitudes:
males apparently are more likely to accept digital advertising than females (Cheng et al.,
2009).
Beyond gender and age, the attitude toward social media advertising is influenced by
numerous factors. According to Muheling (1987) who conducted investigations on the topic
of the attitude towards ads long before the income of social platforms, the attitude toward the
media itself has an influence on the credibility of its message and thus, acceptance of the
latter. Despite all the results that see Internet sources in a positive way, it remains true that it
is still considered the least trustworthy media, compared for example to traditional ones like
television or newspapers (Kelly, Kerr & Drennan, 2010). This happens not only because
whoever can publish anything on the Web, but also because it is considered more of an
interactive or utilitarian media.
Generally, the customer’s attitude towards the website or platform at large is a good indicator
of his attitude towards its content: users are more likely to accept and rely on the information
they see on a website they appreciate (Chu, 2011).

12
Muheling’s researches were set in a decade where the public hadn’t experimented with the
Internet yet. To find out whether his theory is valid also on the World Wide Web, specifically
on social platforms, a first hypothesis can be articulated:
H1: Users that have a positive attitude towards social media also have a more positive
attitude towards social media advertising.
2.4. Communication
It has been mentioned how Social Networks have empowered consumers, giving them the
opportunity to create content and influence the reputation of a company. It is very important
to consider their communication as a factor that influences the success of social network
advertising.
2.4.1. Consumers’ Online Brand Related Activities
Social networks provide a wide spectrum of opportunities for users to create content (UGC as
User’s Generated Content) and share it, obviously including brand related activities: this
implies the increasing influence of the consumers, which rely more on each other than on the
companies they follow. When a client is satisfied, he shares his satisfaction with an average of
three people; on the contrary, when he is unhappy with a certain product he will inform about
15 people, leaving an indelible mark on the Web (Cordina, 2012). If we googled the name of
one of the world’s top ten brands, we would see that 25% of the results are user generated
content (Tuten & Solomon, 2012).
Those interactions about or with a certain brand influence consumer behaviour in a greater
way than the classical forms of advertising (Van Noort et al., 2014): they are referred to as
‘COBRAs’, consumers’ online brand related activities. An example of an online brand related
activity could be uploading a picture of their new Kenzo sweatshirt on Instagram or tweeting
about a new U2 album they’ve been listening to. This concept is used to express and define
those consumers’ actions on social media platforms that directly connect to a certain brand
(Mangold & Faulds, 2009). COBRAs imply different brand-related behaviours, for instance
the expression ‘Word of Mouth’ is associated with consumer-to-consumer interaction and
13
content exchange about brands, and ‘User Generated Content’ that defines what is uploaded
directly by the user and not by the brand.
Muntinga, Moorman & Smit found out in their research conducted in 2011 that consumers’
online brand related activities could be divided in three different typologies, as they can
engage in different ways. According to the authors, each typology has its own motivation to
share and create brand related content online. First we find the ‘consuming’ category, which
implies the lowest level of brand-related activeness, as the user participates without an active
contribution in the creation of content (for example by watching a commercial on Youtube or
the comments left on forums by other users). People that fall in this category according to the
authors are driven by three motivations, namely remuneration (prospect of job or money-
related benefits, like a free trip or a free Vespa), entertainment and information. The
entertainment motivation shows how people often get on the Internet to relax and use it as a
distressing tool or a pastime, which almost inevitably implies stumbling upon brand related
content. For what concerns information, users do specifically go online to access it, but also
to know more about their brand related social environment.
Another way to participate in a COBRA is by contributing to something that is brand related
and it can be a user-to-user relation as well as a user-to-content relation or interaction about a
certain brand. People that are engaged this way leave comments on photos, forums or videos,
and they do it for entertainment, integration and social interaction, or for self-expression and
assurance. Users seeking self expression and assurance hope to provide other people with a
glimpse of their personality, as they wish to become associated to a certain brand or activity.
If a brand plays a relevant role in somebody’s life (being the owner of an Audi car for
example), it will become a small part of his identity and he will like to be associated to it. For
what concerns social interaction and integration, people like to share opinions, interests and
information with like-minded users.
The ultimate level of activeness consists in the production of brand related content, as the user
actively creates and uploads content, which other users will consume and contribute to. These
people are defined as ‘opinion leaders’ (Cordina, 2012), and can be affectionate experts on the
brand or engaged by the company itself to promote it. People are motivated in engaging in
such activities in order to achieve gratification: they actively select certain media in order to
feel satisfied. Users who create content are driven by different motivations: entertainment,
personal identity, integration and social interaction, or lastly empowerment. Empowerment

14
comes from the fact that writing about a certain brand gives the user the ability to reach both
customers and companies (Berthon, Pitt, Plangger & Shapiro, 2008), thus playing a certain
influence on other individuals.
According to David Fayon and Christine Balagué, 1% of users produce content, 10% of them
comment or modify it, and 89% consult content created by others (Cordina, 2012). It is thus
very important for brands to identify the opinion leaders and stimulate or encourage their
publishing.
COBRAs have been proved to influence purchase behaviour and attitudes towards advertising
and brands (Rodgers, 2002): communications between consumers or with the brand shows the
engagement of the subject, proving a positive influence on the attitude towards advertising.
2.4.2. The Word of Mouth
Word of mouth, that can also be unrelated to the Internet and social networks, is the action of
speaking and exchanging information between customers: it acts like a special kind of
marketing and has an important influence on the user’s attitude and perception towards a
certain product (Trusov, Bucklin & Pauwells, 2009). The effect of the WOM on the
customer’s behaviour is greater than a company’s publicity message, as it comes from a more
trusted source of information, somebody known that has probably already had an experience
with the product or brand: this is why it is often a source that people rely on. It isn’t
necessarily positive (it can also be a negative statement) and neither it can occur only on
social networks: electronic word of mouth can ensue on many different channels such as
emails, blogs, forums, virtual communities and websites (Shu-Chuan & Yoojung, 2011).
Social networks as aforementioned have allowed - thanks to their special structure and to the
many users connected - the establishing of stronger relationships between a certain company
and its customers (Riegner, 2007 - Shu-Chuan & Yoojung, 2011). As users are enabled to
connect with each other, they exchange information and opinions about their favourite brands,
resulting in a phenomenon named (brand-related) electronic-word-of-mouth (eWOM). Over
social networks, users can have discussions on chat, forums, or their own profiles, ‘like’ a
certain message on the official page of the brands they prefer or simply share an object or a
message: while they do this to get emotional benefits from the discussion and the exchange of
opinions, these dialogues have important commercial implications (Riegner, 2006).

15
There have been identified three groups of people that influence the spreading of content on
the social networks (Gladwell, 2002) through word of mouth. First of all we have the
‘connectors’, users with a wide number of contacts who can quickly spread a message in a
large group of people, extremely important to show how a message can get viral. Then there
are the ‘mavens’, those who rate and evaluate all the information of their area of expertise that
they gather from the various ‘connectors’, in order to pass it on. Last, we find the ‘salesmen’,
those who are not necessarily expert in the matter but have a certain personality and charisma
that influences other people to spread their message. This domain represents an exceptional
marketing tool for organizations (as well as marketing research domain), as the customers are
disseminating brand-related information for free in their group of friends and other contacts:
people influence the dissemination of ideas, they drive trends and influence mass opinion
(Herr, Kardes & Kim, 1991). The act itself of advertising on social networks allows a direct
contact with customers and enables interaction, which can occur in different forms (for
example with a ‘like’, a comment or sharing). This way customers purposely show and
associate with their favourite brand via word of mouth communication (Shu-Chuan & al.,
2011). Word of mouth behaviour starts from an individual who wishes to maintain and
establish contacts or relationships within the platforms. Social connectivity is at the centre of
this process, and by sharing their experience users help and influence their contacts to take
determined decisions (Attié, 2012). Consequently, variables that influence social networks are
fundamental to understand the word of mouth dynamics. A challenge for companies is to try
to trigger and influence this phenomenon in order to take advantage of this level of word of
mouth and influence the customer’s perception and behaviour (Trusov & al., 2009).
We can safely conclude that eWOM and COBRAs, people interacting and creating brand
related content on the web, are indicators of customers seeking or creating information about
a company or product (Shu-Chuan & al., 2011). Consequently, they have been proven to
influence the attitude towards advertising on social networks (Rodgers, 2002). Users
particularly active in creating, searching and commenting any kind of news see this kind of
advertising more positively than users who avoid it.
Following this reasoning, we can set the hypothesis for the factor ‘communications’.
16
H2: Consumption-related consumers communication about a known brand is
positively associated with the attitude towards social media advertisement.
2.5. Brand engagement
A consequence of the non-geographically bound communications and relationships on the
web between customers and brands is the creation of brand communities (a special form of
consumer communities), virtual gatherings of people with a firm in its centre (Brodie, Ilic,
Juric & Hollebeek, 2011), whose context is the consumption of a certain product or service
(Laroche, Habibi & Richards, 2012). Such consumer communities are a very powerful
management tool in terms of marketing and customer relationship, because they have a big
impact on the business and offer many advantages (Zaglia, 2012): the interactions between
members of a same community influence in an important way the attitude towards the brand.
Most of the time this expression is used in an explicit online context. Customer engagement
can be defined as ‘the level of a customer’s physical, cognitive and emotional presence in
their relationship with a service organization’ (Patterson et al., 2006); that is, how much the
customer is involved in connecting and interacting with a brand’s activities and its cognitive
and affective attachment towards it (Goldsmith, Lafferty, & Newell, 2000). However, it
would be wrong to claim that customer engagement has merely to do with involvement. In
fact, it goes far beyond as it requires an interactive relationship and also a certain emotional
bound with the organization. What digital communities and classical communities have in
common is the fact that they are ‘instrumental to human well-being’ (Laroche et al. 2012).
The process of engagement starts with the satisfaction of the customer that will consequently
lead to customer loyalty, the ‘Holy Grail’ for companies (Laroche et al. 2012). This, together
with a long lasting relationship, has as consequences commitment, involvement and finally
entrustment from the side of the consumer (Brodie et al., 2011), influencing future purchase
intentions.
Engaged customers can cover different roles in their online community (Brodie & al., 2011),
starting from the learners who are only on the hunt for information, to the members that share
their previous experiences or comments on the product by giving their feedback (Goldsmith
& al., 2000).
Enhancing the engagement with the consumer creates and builds stronger customer
relationships: it results in a competitive advantage and in sale growth, as customers that have
17
already purchased a product and found themselves satisfied will feel an emotive connection,
which is a basis for re-purchase (Zaglia, 2012). Other consequences are commitment,
consumer value and empowerment (especially in online brand communities) and finally,
loyalty.
We can conclude that, according to previous researches (Brodie et al., 2011; Patterson et al.,
2006), customers belonging to brand communities have an emotional attachment and are
cognitively involved: consequently, an engaged customer will have higher tolerance towards
social network advertising.
H3: Customers that are engaged with a brand (and belonging to brand communities)
have a higher acceptability towards social network advertisement.
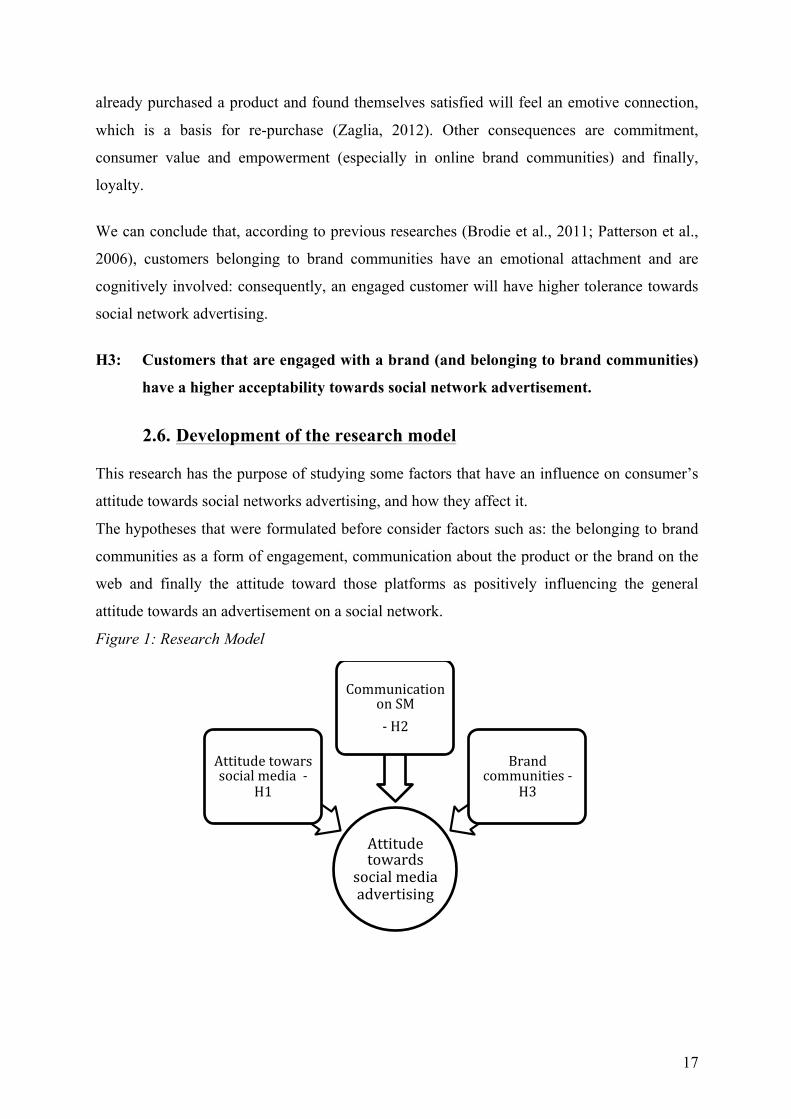
2.6. Development of the research model
This research has the purpose of studying some factors that have an influence on consumer’s
attitude towards social networks advertising, and how they affect it.
The hypotheses that were formulated before consider factors such as: the belonging to brand
communities as a form of engagement, communication about the product or the brand on the
web and finally the attitude toward those platforms as positively influencing the general
attitude towards an advertisement on a social network.
Figure 1: Research Model
Attitude towards
social media advertising
Attitude towars social media -‐
H1
Communication on SM -‐ H2
Brand communities -‐
H3

18
3. Study design
3.1. Sample
In order to collect the data needed to proceed with the empirical research, a questionnaire was
sent out in Switzerland in the summer of 2015. The purpose of the investigation was to collect
information regarding the attitude of the users toward social network advertising and their
Internet habits, to fully understand which factors influence and affect it. To be sure to target
the proper segment of population, it was sent around different social networks such as
Facebook and LinkedIn: the only requisite to participate in the investigation was to have a
profile on at least one social platform. In order to have a wide and heterogeneous sample,
people from every age, also that are not familiar with the social platforms (even though they
have a presence on them) were invited and encouraged to participate.
The questionnaire was formulated online by using Google Forms and, as aforementioned, it
was shared using the feature of the online chat or post on some social networks. Most of the
questions were compulsory and had to be answered to finish the form, in order to avoid
incomplete questionnaires that would have been pointless.
The first few questions were set to define age and gender of the respondent, followed by
general enquiries to understand whether the subject had a frequent presence on social media
and to define the attitude demonstrated towards them. Communication and the belonging to
brand communities were then verified. During the entire questionnaire the interviewed was
asked to keep in mind a brand he is accustomed to, in order to verify the relation between the
attitude towards advertisement, communication (about that certain company), and the
belonging to online brand communities.
3.2. Instruments
The questionnaire is composed in total of 27 questions, the first two of which ask about the
generalities of the sample (age and gender), as it is part of the study to understand whether or
not these two factors affect the use of social media and consequently the acceptance of
Internet advertisement.
The next 7 questions aim to measure social network use and the attitude of the questioned
towards it (hours spent on the media, number of profiles on social platforms…), followed by
4 about the attitude towards social network advertising, 4 more for the attitude towards

19
advertising in general and 4 about the communication about a specific brand on social media
(all of which use a scale of agreement/disagreement that will be explained later on in this
chapter).
The last 8 questions, which have the purpose of investigating the concept of the online
community, start with the last two compulsory questions of the survey asking whether the
user belongs to one of them or not: if answered negatively, then the questionnaire is finished.
If the answer is positive, the respondent has to proceed with the last 6 questions testing six
different items, which are used to determine his degree of involvement in an online brand
community of his choice. The two groups of people – those who belong to an online
community and those who don’t – were divided in two different categories, which during the
analysis will be treated differently.
To determine the sample’s degree of involvement with a precise factor that has to be tested, a
psychometric rating scale of five points (Likert) was used, asking to specify the degree of
agreement the user has with a statement. Precisely, the value scale starts from one that
corresponds to ‘strongly disagree’, until ‘strongly agree’ represented with the maximum
value, hence five.
Resuming, the purpose of this paper is to understand the mechanism through which some
specific factors affect the attitude of the users towards social media advertising.
What is studied is whether communication about a certain brand on social networks, the
attitude toward the media itself, and finally the belonging to brand related online
communities, have a direct positive or negative influence on the attitude towards social media
advertising.
The data analysis will examine whether the observed variable (in this case, the three
variables) is causally related to the result (the attitude of the users towards advertisements on
social media) by using two linear multiple regressions.

20
4. Results
The questionnaire was answered by a total of 124 people, of which 65 (52.4%) are female and
59 (47.6%) male, with an average age of 30 years.
As aforementioned, the respondents were divided in two groups: those who belong to an
online community (Group 1) and those who don’t (Group 2). After deleting some outliners,
51 people, 51% males and 49% females, with an average age of 32 years old, compose the
first group. The second group, those who do not belong to an online brand community (67 on
124), is 45% male and 55% female, aged around the 27 years old.
From the data collected we can deduce the favourite social media of the whole sample. 94%
of the people that compiled the form have a presence on Facebook (117 profiles in total),
making it the most used social network, followed by Instagram (53% of the people questioned
have a profile), and LinkedIn (30%), while only around 20 people out of 124 were on
Pinterest, Google plus or Twitter.
Most of those 124 people have two profiles on social media (38%), three (20%) or one (25%),
while only 17% have a presence on three, four or more social networks.
Figure 2: Pie chart of the average use of social media
As can be seen on the pie chart on the right, most of the people (35% of the sample) spend on
average approximately less than one hour a day on social networks. 27% affirms to be on the
platforms one to three hours each day, 17% a few hours a week and 15% a few hours a
month. Only 6% of the questioned have an assiduous presence of more than 3 hours a day.

21
4.1. Factor analysis
Through the questionnaire, it was possible to collect information for various variables and the
respective items to be tested. To validate the scales that were used for measure, some analysis
have to be run: this way it is possible to confirm the statistical value of the study and, if
necessary, discard some items (Draper & Smith, 1998).
In total three factorial analyses will be run, to determine whether the factors found are correct:
the first one will comprehend the totality of the respondents of the questionnaire and all the
factor excluded social brand community will be tested. The second test will only include
Group 1 (people who belong to an online brand community) and will test all of the variables;
and finally the third factor analysis, run on Group 2, and testing (like the first analysis) all the
factors excluded brand communities. In the table below, a résumé of the three different
analyses is displayed.
Table 1: Schema of the three analyses
Analyse Number
Sample tested
Factors tested
1)
The whole sample
n=118 • Attitude toward SNS • Communication on SNS • Attitude toward SNS ads
2)
Group 1 n=51
People who belong to online brand communities
• Attitude toward SNS • Communication on SNS • Attitude toward SNS ads • Brand communities on SNS
3)
Group 2 n=67
People who do not belong to online brand communities
• Attitude toward SNS • Communication on SNS • Attitude toward SNS ads
The PCA (principal component analysis) allows the logical assembling of the variables in
similar sets with a feature reduction (Field, 2013).

22
The Pattern Matrix, of which three are shown in the next few pages, display the coefficients
for the linear combination of the researched variables, the communalities between each item
(the proportion of each variable’s variance that is explained by the factor itself). All of the
variables used and tested with the questionnaire will be discussed later on this chapter.
Analyses number one is represented in the table 2. The distinction between the three
components (two independent and the dependent variable) is quite clear: the hypotheses tested
can be clearly seen (social media use and brand related communication con social media) and
are respectively associated as components 3 and 1, as well as the dependent variable, the
attitude towards social media advertising (component number 2). The matrix has values that
space between 0,673 and 0,923.
Table 2: Pattern Matrix analysis 1, n=118
Pattern Matrixa
Component 1 2 3
Attitude SN use ,900 Attitude SN comfort ,847 Attitude SN importance ,775 Attitude SN love ,766 Communication on SM-write ,923 Communication on SM-
communicate ,888
Communication on SM-talk ,817 Attitude towards SN advertising-
reliable ,835
Attitude towards SN advertising-
appreciable ,748
Attitude towards SN advertising-
satisfactory ,720
Attitude towards SN advertising-
useful ,673
Extraction Method: Principal Component Analysis. Rotation Method: Oblimin with Kaiser Normalization. a. Rotation converged in 6 iterations.
23
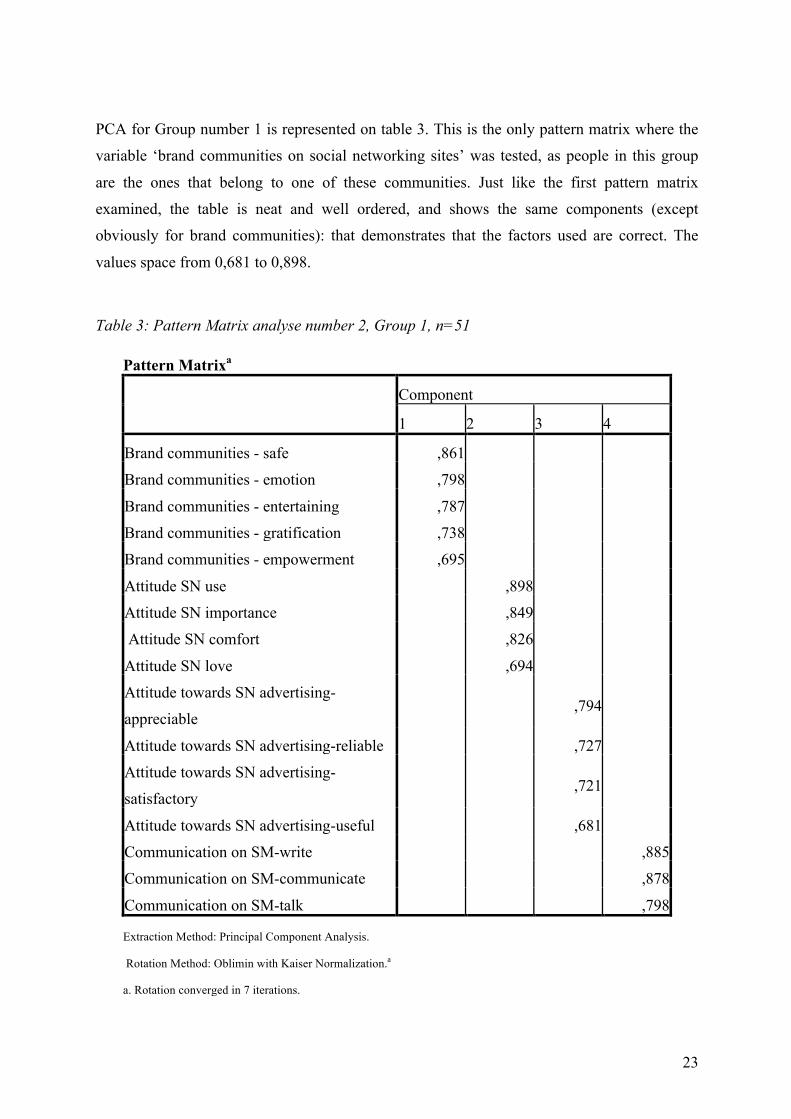
PCA for Group number 1 is represented on table 3. This is the only pattern matrix where the
variable ‘brand communities on social networking sites’ was tested, as people in this group
are the ones that belong to one of these communities. Just like the first pattern matrix
examined, the table is neat and well ordered, and shows the same components (except
obviously for brand communities): that demonstrates that the factors used are correct. The
values space from 0,681 to 0,898.
Table 3: Pattern Matrix analyse number 2, Group 1, n=51
Pattern Matrixa
Component
1 2 3 4
Brand communities - safe ,861
Brand communities - emotion ,798
Brand communities - entertaining ,787
Brand communities - gratification ,738
Brand communities - empowerment ,695
Attitude SN use ,898
Attitude SN importance ,849
Attitude SN comfort ,826
Attitude SN love ,694
Attitude towards SN advertising-
appreciable ,794
Attitude towards SN advertising-reliable ,727
Attitude towards SN advertising-
satisfactory ,721
Attitude towards SN advertising-useful ,681
Communication on SM-write ,885
Communication on SM-communicate ,878
Communication on SM-talk ,798
Extraction Method: Principal Component Analysis.
Rotation Method: Oblimin with Kaiser Normalization.a
a. Rotation converged in 7 iterations.

24
The last pattern matrix, representing analyses number 3, is displayed on Table 4. The only
people considered for this table are the ones that do not belong to any brand communities, and
so the variable ‘ Brand related online communities’ was excluded from the matrix.
Table 4: Pattern Matrix analyse number 3, Group 2, n=67
Pattern Matrixa
Component
1 2 3 Communication on SM-write ,884 Communication on SM-talk ,868 Communication on SM-
communicate ,845
Attitude SN use ,915 Attitude SN comfort ,856 Attitude SN love ,764 Attitude SN importance ,703 Attitude towards SN
advertising-appreciable ,811
Attitude towards SN
advertising-reliable ,773
Attitude towards SN
advertising-satisfactory ,678
Attitude towards SN
advertising-useful ,595
Extraction Method: Principal Component Analysis.
Rotation Method: Oblimin with Kaiser Normalization.a
a. Rotation converged in 6 iterations.
The PCA automatically enables the logical assembling of the variables in similar sets.
The principal variable of the research (the dependent) regroups all the factors that represent
how the consumer feels about social network advertising, his attitude towards it. In this part
of the questionnaire it was asked whether the user felt that this type of publicity as
satisfactory, appreciable, reliable and useful. Two items that were tested in the questionnaire

25
(irritation and intrusion) had to be eliminated from the research, as they didn’t fit with the
other factors.
The factor tested only in the analyses number 2 is the belonging to brand related communities
on the social platforms. In the questionnaire it was asked whether the respondent belonged or
not to the community of a certain brand. Many questioned answered no, and so didn’t have
access to the Likert scales that tested the five different items. If the answer was positive, the
user had to grade his emotions, feeling of safety, entertainment, gratification and finally
empowerment on the brand communities, going straight into Group number 1.
The factor ‘social networking sites use’ aims to verify how much of a fervid user the
questioned is: how much of his time he spends on average on social media and how many
profiles he has on distinct social network (not necessarily with an active presence).
Finally, the last factor scrutinizes the topic of brand related communication on social media: it
has been proven that people chat a lot about products or companies on the web. This is why
the questionnaire tested how much, on the usual Likert scale from one to five, the users
communicate with the friends about a known company and write or comment public posts
that are written directly by the it or simply concern it.
Another element of the factor analysis is the Component Correlation Matrix. The table is
composed by a symmetrical matrix that displays the relation between the different variables
and their correlation (thus, the intensity of such relation).
It is noticeable that the values in table 5 (the component correlation for analyses number one)
are quite low but still positive: it is reasonable to assume independence between factors.
Table 5: Component Correlation Matrix of the whole sample
Component Correlation Matrix Component 1 2 3 1 1,000 ,081 ,261 2 ,081 1,000 ,218 3 ,261 ,218 1,000 Extraction Method: Principal Component Analysis.
Rotation Method: Oblimin with Kaiser Normalization.

26
Table 6 represents the matrix for analyses 2. The values space between -0,036 and 0,337.
At last, table 7 shows the correlation matrix for analyses 3 and so Group 2.
Table 6: Component Correlation Matrix, Group 1
Component Correlation Matrix Component 1 2 3 4 1 1,000 ,082 ,134 ,337 2 ,082 1,000 ,223 -,036 3 ,134 ,223 1,000 ,060 4 ,337 -,036 ,060 1,000 Extraction Method: Principal Component Analysis.
Rotation Method: Oblimin with Kaiser Normalization.
Table 7: Component Correlation Matrix, Group 2
Component Correlation Matrix Component 1 2 3 1 1,000 ,131 ,283 2 ,131 1,000 ,172 3 ,283 ,172 1,000 Extraction Method: Principal Component Analysis.
Rotation Method: Oblimin with Kaiser Normalization. Last, the KMO test (Kaiser-Meyer-Olkin measure of sampling) allows the measurement of
the relationship strength among variables, the sampling adequacy. In order for the scale to be
acceptable, the value has to be greater than 0.5: the closer to the value 1 it is, the more
excellent the information. As shown in the next table, the KMOs fot analyses one, two and
three amount respectively to 0,747, 0,702 and 0,727 (which are considered ‘middling’ values)
and are more than acceptable. The Bartlett’s test of Sphericity is another measure of testing
the strength amongst variables: the probability that the correlation matrix is an identity matrix
has to be less than 0.05. Our Bartlett’s value are all 0%, which makes the variables perfectly
independent between each others (Field, 2013).

27
Table 8: KMO and Bartlett's Indexes
Index Analyses 1 Analyses 2 Analyses 3
Kaiser-Meyer-Olkin Measure
of Sampling Adequacy
,747 ,702 ,727
Bartlett's Test of Sphericity ,000 ,000 ,000
4.2. Reliability of the research
The table in the following page shows the standard deviation (the dispersion of every set of
data) as well as the mean of all the items that were tested, and so we can see precisely how
social media and social media advertisement, as well as brand communities and so on, are
perceived. It can be seen that the attitude towards social media advertising is not tendentially
positive, generally negative (2.861 out of 5), while social media in general are more
appreciated (3.113).
The table also shows the reliability of the items used to define each factor. To determine how
closely related a set of items in this paper is, which means, if the items chosen measure the
same idea, Cronbach’s alpha was used. It is a reliable measure of consistency, widely used in
social sciences (Field, 2013), used to verify whether or not the items were properly set
together.
A general rule for evaluating Cronbach’s alpha is that its value should be greater than 0,7: this
way the internal consistency will be more than acceptable. As it is shown in the table below,
the alphas for the variables of the research are the following: attitude towards social media in
general 0.848, attitude towards social media advertising 0,745, Internet use 0,520 (when
considering two items, the alpha is acceptable when it is greater than 0,5), communication on
social media 0,866 and finally brand communities 0,868. All of the alphas obtained from the
different factors and the respective items are more than good and can be accepted.
Although, it has to be specified that two items (‘intruding’ and ‘irritating’) from ‘attitude
towards social media advertising’ had to be eliminated in order to obtain an alpha bigger than
0.7: if they were included in the calculations, the alpha would have only been 0.326, thus,
unacceptable.

28
Table 9: Mean, Stardard Deviation and Cronbach's alpha of the items, scale 1 to 5, n=124
Standard Deviation
Mean Reliability
Attitude towards social media
On social networks I feel comfortable I use social networks a lot To me social networks are important I love social networks
1.0069 1.0694 1.0230 0.9656
3.113 3.548 3.363 2.815 2.726
0.848
Attitude towards social media advertising Social media advertising is: Reliable Useful Satisfactory Appreciable
0.9636 1.1404 0.8980 0.8923
2.861 2.734 2.702 2.879 3.129
0.745
Internet use Number of social media used Average use
1.2002 1.1202
2.653 2.379 2.927
0.520
Communication on social media On social media, what I do is Communicate Write Talk about brand related thing
0.9293 0.9211 1.0621
1.699 1.766 1.573 1.758
0.866
Brand communities Belonging to an online brand community, I feel Gratification Empowered Safe Entertained Emotionally bound
1.0738 0.9897 1.1761 1,2936 0.9858
2.308 2.100 2.000 2.380 2.800 2.260
0.868

29
4.3. Regression analysis
The results obtained in the KMO & Bartlett, PCA and reliability analysis allow the pursuit of
the research.
The purpose of the analysis is to find out which influence the researched factors have on
consumers’ perception of social media publicity. Through a linear multiple regression it is
meant to verify the impact of the three independent variables; the interaction about a brand
through communication, the habits in terms of use of the users and finally engagement in
form of the presence on online brand communities, with our dependent variable, the
perception that the consumers have towards social media ads.
In this research two different groups of people have been formed, so two linear regressions
were carried out to determine the effect of the researched factors on the perception toward
social media advertising. The first one on Group 1, were the relation between the dependent
variable and the three factors will be tested. The second linear multiple regression will be
developed on Group two, testing the connection between the attitude toward social media
advertising and the other two factors: in this case, brand communities will be excluded from
the research as people in the sample that will be used does not belong to one of them. Table
number 1 will be used yet again, the regression analyses will be run on the analyses model
number 2 and number 3.
4.3.1. Regression analysis - Group 1
The analysis starts with table 10, a summary of the linear multiple regressions. From the data
displayed a few information can be deducted. In the first column R (Pearson correlation), the
correlation between the observed values and the dependent variable is shown, which is how
strongly the variables relate and in what direction: its value stands between -1 and 1. The
value 0,488 represents a linear correlation. The R-Square value is the percentage of variance
in the independent value that can be explained through the dependent values, the strength of
the fit, but doesn’t reflect the extent to which any particular independent variable is associated
with it. The factors taken into consideration for this research explain about 23,8% of the
attitude towards social media advertising. The adjusted R-Square (the adjustment made
downwards, to give an estimate of the population instead of the sample) is 19,1%. Both
values are acceptable and allow the pursuance of the work.
The final column of the table represents the standard deviation of the error term and the
square root of the third column of the ANOVA (table 11), the mean square for the residuals,

30
which amounts to 0,628.
Table 10: Model Summary of the Regression, Group 1
Model Summary
Model R R Square Adjusted R
Square Std. Error of the Estimate
1 ,488a ,238 ,191 ,628 a. Predictors: (Constant), Mean_BrandCom, Mean_AtSN, Mean_Commu
In the ANOVA table (table 11) are displayed the result of the analysis of the variance of one
variable compared to that of another. Fisher’s exact Test (=5,006) and its coefficient of
significance (=0,004) allow the rejection of the null-hypothesis. In any empirical research for
which a sample from a population is drawn, exists the possibility that one of the observed
effects is the result of a sampling error, thus, the explanation of non-significance. When a p-
value is inferior to the significance level, it can be concluded that this effect actually reflects
the population instead of a sampling error, rejecting the null-hypothesis.
The p value should be less than the significance level, in this case 0,004<0,05, thus it is
significant. Table 11: ANOVA table, Group 1
ANOVAa
Model Sum of Squares df Mean Square F Sig.
1 Regression 5,924 3 1,975 5,006 ,004b Residual 18,935 48 ,394 Total 24,859 51
a. Dependent Variable: Mean_atSNA b. Predictors: (Constant), Mean_BrandCom, Mean_AtSN, Mean_Commu
The last table for the regression analysis of the sample group number 1 exhibits the
standardised Beta values, with whom we can measure to which point the variables influence
the independent variable. If the Beta is positive, the existing relation between the independent
and dependent variable is also positive and vice-versa. The factor ‘communication has a
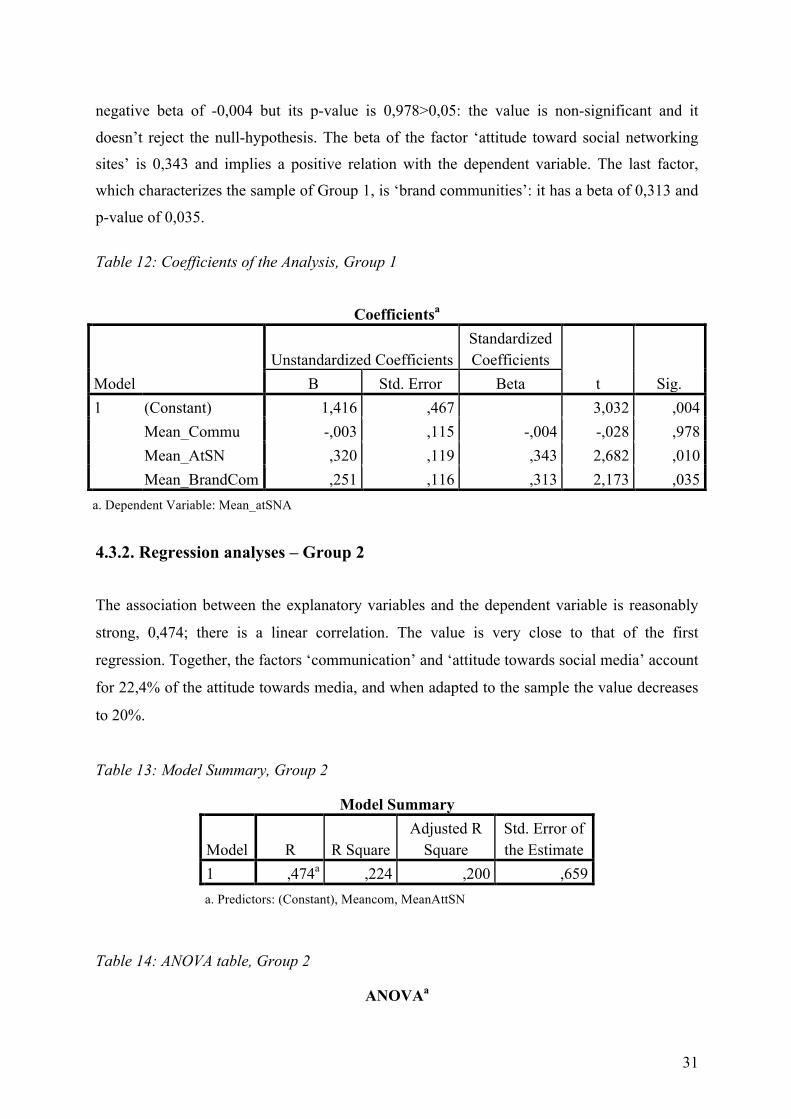
31
negative beta of -0,004 but its p-value is 0,978>0,05: the value is non-significant and it
doesn’t reject the null-hypothesis. The beta of the factor ‘attitude toward social networking
sites’ is 0,343 and implies a positive relation with the dependent variable. The last factor,
which characterizes the sample of Group 1, is ‘brand communities’: it has a beta of 0,313 and
p-value of 0,035. Table 12: Coefficients of the Analysis, Group 1
Coefficientsa
Model Unstandardized Coefficients
Standardized Coefficients
t Sig. B Std. Error Beta 1 (Constant) 1,416 ,467 3,032 ,004
Mean_Commu -,003 ,115 -,004 -,028 ,978 Mean_AtSN ,320 ,119 ,343 2,682 ,010 Mean_BrandCom ,251 ,116 ,313 2,173 ,035
a. Dependent Variable: Mean_atSNA
4.3.2. Regression analyses – Group 2
The association between the explanatory variables and the dependent variable is reasonably
strong, 0,474; there is a linear correlation. The value is very close to that of the first
regression. Together, the factors ‘communication’ and ‘attitude towards social media’ account
for 22,4% of the attitude towards media, and when adapted to the sample the value decreases
to 20%.
Table 13: Model Summary, Group 2
Model Summary
Model R R Square Adjusted R
Square Std. Error of the Estimate
1 ,474a ,224 ,200 ,659 a. Predictors: (Constant), Meancom, MeanAttSN
Table 14: ANOVA table, Group 2
ANOVAa

32
Model Sum of Squares df Mean Square F Sig.
1 Regression 8,166 2 4,083 9,398 ,000b Residual 28,241 65 ,434 Total 36,407 67
a. Dependent Variable: MeanAttAds b. Predictors: (Constant), Meancom, MeanAttSN
The ANOVA table displays a Fisher’s test of 9,398 with a significance of 0, which rejects the
null-hypothesis.
The attitude toward social media in general has a regression coefficient of 0,13: if perception
towards the platforms increases by one unit, the attitude toward social media ads will increase
by 0,13. Instead, if communication increases by one unit, the attitude toward social networks
ads will increase by 0,353.
The beta of the factor ‘attitude towards social media’ has a value of 0,148 and
‘communication’ 0,422, although the p-value of the first factor is 0,188 which is greater than
0,05, making it non-significant. The p-value of ‘communication’ is 0, showing that the
results are unlikely to have arisen by sampling error. The standardised regression coefficients
show this last factor is a stronger predictor than the attitude in general for social media. Table 15: Coefficients of the analysis, Group 2
Coefficientsa
Model Unstandardized Coefficients
Standardized Coefficients
t Sig. B Std. Error Beta 1 (Constant) 1,724 ,311 5,544 ,000
MeanAttSN
,130 ,098 ,148 1,332 ,188
Meancom ,353 ,093 ,422 3,791 ,000 a. Dependent Variable: attitude toward social media advertising.
The following tables (number 16 and 17) resume the regression coefficients of each factor for
both groups specifying whether they are significant or not.
We can finally confirm or deny the hypotheses formulated on the base of previous researches;
as we have two distinct groups of respondents, the values may vary from one to the other.
Starting from Group 1, the factor ‘brand related communication’ has a beta of -0,004 but it is

33
non-significant: the hypotheses H2, ‘consumption-related consumers communication about a
known brand is positively associated with the attitude towards social media advertisement’
doesn’t reject the null-hypothesis and so we cannot accept the alternative hypothesis.
The hypothesis H1, ‘users that have a positive attitude towards social media also have a more
positive attitude towards social media advertising’ is confirmed, as well as hypotheses H3
‘customers that are engaged with a brand (and belonging to brand communities) have a higher
acceptability towards social network advertisement’.
Group 2, the people who answered ‘no’ when questioned whether they belong to brand
communities, had a variable less to analyse. H1 with a beta of 0,148 is non-significant and
doesn’t reject the null-hypothesis. H2 instead, with a significance of 0 and a beta of 0,442 is
confirmed. The results will be further discussed in the next chapter.
Table 16: Significance
Group 1
Variable Beta Significance
Brand related communication on SNS
-,004 Non-significant
Attitude toward the media ,343 Significant
Belonging to brand communities
,313 Significant
Group2
Variable Beta Significance
Attitude towards the media 0,148 Non-significant
Brand related
communication on SNS
0,442 Significant

34
5. Discussion
This study has the purpose of analysing the direct influence that a few factors have on social
network advertising acceptance. Social networks with the income of the Internet have come to
play an important role in people’s lives, giving companies huge and unique marketing
opportunities thanks to their special structure and features as well as their popularity,
contributing to an on-going dialogue about their importance. Studies in the field that test the
attitude that users have towards social media have already been conducted, mainly for other
factors, but there still is a lack of empirical research. Despite the fame and economic
relevance of social platforms the topic still is still little known and researches in this field are
surely recognized as potentially important to companies and in general advertising
practitioners: this is the reason this topic was chosen as a subject.
Companies have had to embrace the upcoming of social networking sites and integrate them
in the creation of value. In order to do that it’s necessary to deliver the desired message
without overwhelming the users in a space that is for them considered intimate and private
and where they are used to have basically control over everything, from connections to
privacy. People tend to avoid publicity on social media, it is so fundamental to understand
how to influence and manipulate their attitude towards it, focusing on some factors rather than
others that do not indicate an appreciably important impact on consumer’s perception.
This study has aimed to understand the mechanism through which the observed factors have a
direct influence on social media publicity acceptance. The hypotheses formulated, based on
previous researches conducted on the field of social network publicity and publicity in
general, concern different aspects of the platforms: brand related communication, the general
attitude towards social media and engagement in the form of participation to online
communities of a brand.
To determine whether the relation between one of the factors and the attitude towards
publicity on social networks is positive or negative, a linear multiple regression analysis was
conducted twice, each time for a different group of people. The results of such analysis are
displayed in figure 3 and 4.

35
Figure 3: Results of the research, Group 1
Data analysis provided results strongly in support of the validity of the previously proposed
relationships. Two out of three hypotheses were confirmed, endorsing the theoretical
background. As forecasted, both the general attitude towards social media and the belonging
to brand communities have an influence on the perception that consumers have toward social
media advertisements. The last factor to be confirmed for the analysis of Group 1 was
unfortunately not possible to be determined because of its non-significance. For what
concerns Group 2, of the two hypotheses only one was significant, also confirming the
previsions made during the theoretical part of the research: brand related communication
between users can be seen as a manifestation of positive attitude towards social network
publicity.
Figure 4: Results of the research, Group 2
The non-significance of the factor ‘communication’ for Group 1 and ‘attitude toward social
media’ for Group 2 can be the consequence of the very small sample, especially after being
Attitude towards social media ads Group 1
Attitude towards social media
0,343
Belonging to brand
communities 0,313
Attitude towards social media ads Group 2
Brand related communication
0,442

36
split up in two groups of 51 and 67 (several outliers have had to be eliminated from the initial
sample). Although, it is safe to assume that the two hypotheses that could not be confirmed
nor denied would have probably been the same between the two groups. As ‘brand related
communication’ was proved to have an influence on social media ads acceptance in Group 2,
and ‘attitude toward the media’ in Group 1, we can estimate that the results would have been
the same, as also seen in previous literature.
The essential contribution of this study is to have shown that factors concerning the behaviour
of users are really linked to the attitude of consumers towards social media publicity
acceptance, by statistically proving it. First of all, the attitude toward the media itself confirms
to have an influence on the attitude toward the advertisement displayed on it.
The second interdependence to have been proven is that the more a consumer engages in
brand related communication (this factor has the strongest influence potential) on a social
platform, the more positive is his attitude towards the advertisements he sees on them,
confirming the result of other researchers (Herr et al., 1991; Rodgers, 2002; Shu-Chuan &
Yoojung, 2011; Trusov & al., 2009). Engagement has also been proven to be a determining
factor: ‘the level of a customer’s physical, cognitive and emotional presence in their
relationship with a service organization’ (Patterson et al., 2006), which on social media takes
the form of brand related communities, such as pages on Facebook or so on, has now be
confirmed to influence the attitude toward social media. And vice-versa: a positive perception
of publicity on social platforms induces consumers to not only engage in communication as
previously mentioned, but also to participate in brand communities. Many authors have
analysed the specificities of those communities and their importance for marketers and
companies in general (Brodie et al., 2011; Goldsmith, et al., 2000; Laroche et al., 2012;
Patterson et al., 2006): they already had been proven to demonstrate commitment,
engagement and emotive connection, which are the base of re-purchase (Zaglia, 2012). But no
previous study has examined the impact this has on the attitude towards publicity: the
important contribution of this research is to have found out and statistically proven that the
belonging to brand communities influences consumer’s attitude toward advertising on the
media, social networks, filling a gap on an important issue.
This study shows and confirms the fact that it is fundamental to acknowledge the reaction of
customers as important in the publicity process. Companies have to not only consider how
advertising achieves the operational objectives of the company, but also take into account
people’s reaction. It implies that companies should never underestimate the quality of

37
publicity on social media, keeping well in mind their target and proposing them a customized
advertisement: different kind of users react in different ways. The purpose is to reach them
effectively, trying to influence their attitude towards advertisement on the platforms. Social
media marketing is generally malleable and not expensive which makes it flexible to
innovations: thanks to the special features of the different platforms it is possible to quickly
see exactly how many people a certain message reached, which kind of people (gender, age,
habits, culture, hobbies) and the reaction to it, allowing an adaptation of the information to the
consumer’s attitude. Publicity should always be adapted and improved.
Addressing to future researchers it would be useful to continue in the same direction, by
analysing further the relationship between marketing on social media and the rejection that
costumers have towards it; especially the positive and effective implications that a successful
marketing executed on social media can have on the sales, as obviously the ultimate objective
of marketing is to increase revenues. Another interesting matter would be, instead of focusing
on the users as this thesis (their attitude towards the media, the way they communicate about
the brand and their engagement) is that future researches could consider as a focal point the
advertisement itself, in terms of content, reliability, design…and determine which factors of
form influence customer’s perception on ads on social networking sites, inspecting whether
there is a similarity with the factor the affect the attitude towards publicity in general, not on
the Web.
Other promising explorations could be in the field of brand communities; this research does
not investigate the reason why people participate in brand communities, but only questions
their active presence. Future studies could focus on the motivations that drive people into that
and analyse the different reasons to participate in such thing, creating a connection with the
attitude towards the media.
The study has had to face a few limits that are compulsory to take into consideration.
First of all (as in every empirical study), problems faced in terms of non-significance of some
factors, may be somewhat due to the small sample of people questioned: it is a very restrictive
fragment numerically (the 118 respondents obviously cannot represent the totality of the
social media population) especially after having split the sample into two different groups.
The model could benefit from a similar analyse with a wider sample. In terms of generalities,
women and men responded almost equally to the questionnaire, giving it a balance in terms of
gender. The average age of the respondents was 30 years old, which makes it young but yet
satisfying, considering that very young users have a stronger presence on the Internet and

38
social media than their older counterparts. Finally, it has to be considered that the respondents
were reached on social media through the undersigned’s web of contacts, making them very
similar in terms of culture and lifestyle, making it a potential source of bias: in order to have a
more varied sample, further researches could address to an international audience.
Another limitation in terms of content is that exploration of other variables affecting
acceptance of ads on social networking ads.
39
6. References
Aaker, D. & Bruzzone, D. (1985). Causes of Irritation in Advertising. Journal of Marketing, Vol. 49, No. 2, pp. 47-57.
Attié, M. (2012). Réussir grâce au bouche à oreille. Paris: Dunod Editions.
Bauer, H., Barnes, S., Reichardt, T. & Neumann, M. (2005). Driving consumer acceptance of mobile marketing: A theoretical framework and empirical study. Journal of Electronic Commerce Research, Vol. 6, No. 3, pp. 181-192.
Berthon, P., Pitt, L., Plangger, K. & Shapiro, D. (2012). Marketing meets Web 2.0, social media, and creative consumers: Implications for international marketing strategy. Business Horizons, Vol. 55, pp. 261-271.
Boyd, D.M. & Ellison, N.B. (2008). Social Network Sites: Definition, History, and Scholarship. Journal of Computer-Mediated Communication, Vol. 13, No. 1, pp. 210-230.
Brodie, R. J., Ilic, A., Juric, B. & Hollebeek, L. (2011). Consumer engagement in a virtual brand community: An exploratory analysis. Journal of Business Research, Vol. 66, pp. 105-114.
Chu, S. C. (2011). Viral advertising in social media: participation in facebook groups and responses among college-aged users. Journal of Interactive Advertising, Vol. 12, No. 1, pp. 30-43.
Cordina, P. (2012). Tout savoir sur … Les Marques et les Réseaux Sociaux. Bluffy: Editions Kawa.
Correa, T., Hinsley, A. W. & De Zúñiga, H. G. (2010). Who interacts on the Web?: The intersection of users’ personality and social media use. Computers in Human Behavior, Vol. 26, No. 2, pp. 247–253.
Dancey, C. P. & Reidy, J. (2004). Statistics Without Maths for Psychology: using SPSS for Windows. Harlow: Pearson Education Limited.
Draper, N. R. & Smith, H. (1998). Applied regression analysis. New York: Wiley Interscience Publications.
Erickson, B. H. & Nosanchuk, T. A. (1992). Understanding Data. Buckingham: Open University Press.

40
Field, A. (2005). Discovering Statistics using SPSS. London: Sage Publications.
Field, A., Miles, J. & Field, Z. (2014). Discovering Statistics using R. London: Sage Publications.
Field, A. (2013). Discovering statistics using IBM SPSS statistics, 4th edition. London: SAGE publications.
Goldsmith, R., Lafferty, B. & Newell, S. (2000). The impact of corporate credibility and celebrity on consumer reaction to advertisements and brands. Journal of Advertising, Vol. 29, No. 3, pp. 43-54.
Greengard, S. (2012). Advertising Gets Personal. Communications of the acm, Vol. 55, No. 8, pp. 18-20.
Hadija, Z., Barnes, S. B., & Hair, N.(2012). Why we ignore social network advertising. Qualitative Market Research: An International Journal, Vol. 15, No. 1, pp. 19-32.
Hair N., Hadija, Z., & Barnes S.B. (2012). Why We Ignore Social Networking Advertising. Qualitative Market Research: An International Journal, Vol. 15, No. 1, pp. 19-32.
Herr, P. M., Kardes, F. R., Kim, J. (1991). Effects of Word-of-Mouth and Product Attribute Information on Persuasion: An Accessibility-Diagnosticity Perspective. Journal Of Consumer Research, Vol. 17, pp. 454-462.
Kelly, L., Kerr, G. & Drennan, J. (2010). Avoidance of advertising in social networking sites: the teenage perspective. Journal of Interactive Advertising, Vol. 10, No. 2, pp. 16-27.
Laroche, M., Habibi, M. R. & Richard, M. O. (2012). To be or not to be in social media: How brand loyalty is affected by social media? International Journal of Information Management, Vol. 33, pp. 76–82.
Levine, D. M., Berenson, M. L. & Stephan, D. (1997). Statistics for Managers using Microsoft Excel. Upple Saddle River: Prentice Hall Publishing.
Mangold, W. G., Faulds, D. J. (2009). Social media: The new hybrid element of the promotion mix. Business Horizons, Vol. 52, pp. 357-365.
Middleton, M. R. (2004). Analisi statistica con Excel. Milano: Apogeo

41
Ming-Sung Chen, J., Blankson, C., Shih-Tse Wang, E. & Shui-Lien Chen, L. (2009). Consumer attitudes and interactive digital advertising. International Journal of Advertising, Vol. 28, No. 3, pp. 501–525.
Muheling, D. D. (1986). An investigation of factors underlying attitude-toward-advertising-in-general. Journal of advertising, Vol. 16, No. 1, pp. 32-40.
Muheling, D.D. (1987). Comparative Advertising: The Influence of Attitude toward the Ad on Brand Evaluation. Journal of Advertising, Vol. 16, No. 4, pp. 43-49.
Muntinga, D.G., Moorman, M. & Smit, E.G. (2011). Introducing COBRAs: exploring motivations for brand-related social media use. International Journal of Advertising, Vol. 30, No. 1, pp. 13-46.
Radbata, A. & Kubenka, M. (2012). Students’ attitudes towards internet advertising study case: University of Pardubice. Bulletin of the Transilvania University of Brasov, Vol. 5, No. 1, pp. 127-134.
Riegner, C. (2007). Word of Mouth on the Web: The Impact of Web 2.0 on Consumer Purchase Decisions. Journal of Advertising Research, Vol. 47, No. 4, pp. 436-447
Rodgers, S, & Thorson, E. (2000). The Interactive Advertising Model: How Users Perceive and Process Online Ads. Journal of Interactive Advertising, Vol. 1, No. 1, pp. 26–50.
Rodgers, S., & Chen, Q. (2002). Post-Adoption Attitudes to Advertising on the Internet. Journal of Advertising Research, Vol. 42, No. 5, pp. 95–104.
Rohrs, J. (2014). Marketing in the age of subscribers, fans & followers. Hoboken: John Wiley & Sons, Inc.
Saporta, S. (2014). Comment booster sa marque sur Internet. Les strategies gagnantes. Paris: Groupe Eyrolles.
Sernovitz, A. (2012). Word of mouth marketing. How Smart Companies Get People Talking. Austin: Greenleaf Book Group Press.
Seung Jin, H. & Lutz, R. J. (2013). The Typicality and Accessibility of Consumer Attitudes Toward Television Advertising: Implications for the Measurement of Attitudes Toward Advertising in General. Journal of Advertising, Vol. 42, No. 4, pp. 343-357.
42
Shu-Chuan Chu & Yoojung Kim. (2011), Determinants of Consumer Engagement in Electronic Word-Of-Mouth (eWOM) in Social Networking Sites. International Journal of Advertising, Vol. 30, No. 1, pp. 47-75
Stenger, T., Bourliataux-Lajoinie, S. (2014). E-Marketing & e-Commerce. Paris: Dunod Editions.
Sultan, F., Gao T. & Rohm. A. (2010). Factors influencing Chinese youth consumers acceptance of mobile marketing. Journal of Consumer Marketing, Vol. 27, pp. 574-583.
Taylor, D. G., Lewin, J. E., Strutton, D. (2011). Friends, Fans, and Followers: Do Ads Work on Social Networks? Journal of advertising research, Vol. 51, No. 1, pp. 258-275.
Tucker, C.E. (2014). Social Networks, Personalized Advertising, and Privacy Controls. Journal of Marketing Research, Vol. 51, No. 5, pp. 546-562.
Tuten, T. & Solomon, M. (2012). Social Media Marketing. Upple Saddle River: Pearson International Edition.
Trusov M, Bucklin R., & Pauwells K. (2009). Effects of Word-of-Mouth Versus Traditional Marketing: Findings from an Internet Social Networking Site. Journal of Marketing, Vol. 73, No. 5, pp. 90-102.
Van Noort, G., Antheunis, M.L. & Verlegh, P.W.J. (2014). Enhancing the effects of social network site marketing campaigns: if you want customers to like you, ask them about themselves. International journal of advertising, Vol. 33, No. 2, pp. 235-252.
Wang, Y & Sun, S. (2010). Assessing beliefs, attitudes, and behavioral responses toward online advertising in three countries. International Business Review, Vol. 19, No. 4, pp. 333-344.
Welkowitz, J., Cohen, B. H. & Ewen, R. B. (2006). Statistics for the behavioral sciences. Hoboken: John Wiley & Sons Publishing.
Zaglia, M.E. (2012). Brand communities embedded in social networks. Journal of Business Research, Vol. 66, pp. 216-223.
Zhou, Z. & Bao, Y. (2002). Users Attitudes toward Web Advertising: Effects of Internet Motivation and Internet Ability. Advances in Consumer Research, Vol. 29, pp. 71-78.

43
7. Annexes
Questionnaire
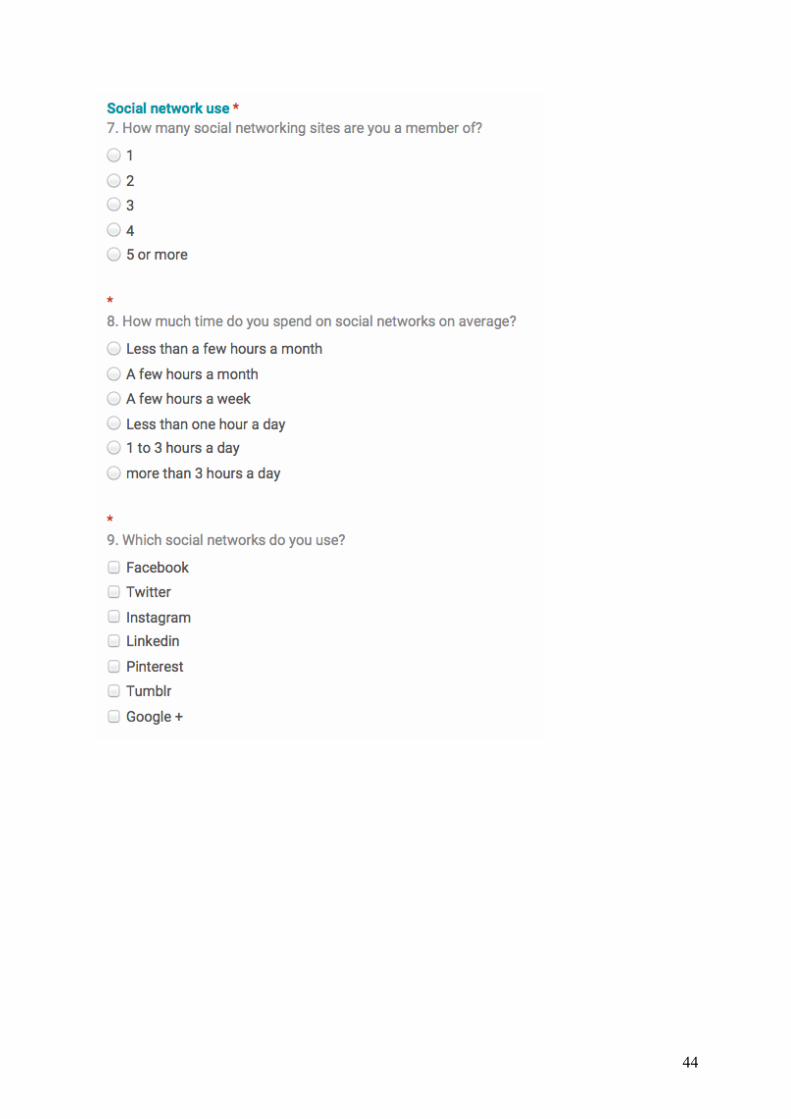
44

45

46

47

48