Bachelor Thesis - digitalcollection.zhaw.ch · Chatbots/Conversational Interfaces in the Context of...
80
Bachelor Thesis Zurich University of Applied Sciences School of Management and Law Chatbots/Conversational Interfaces in the Context of the Stereotype Content Model (SCM) Author: Annemarie Schär Hermannstrasse 11 8400 Winterthur [email protected] Matriculation Number: 14-676-399 Program: Bachelor of Science (BSc) ZFH in Business Information Technology Supervisor: Dr. Roger Seiler Date of submission: 24 th May 2018
Transcript of Bachelor Thesis - digitalcollection.zhaw.ch · Chatbots/Conversational Interfaces in the Context of...

Bachelor Thesis
Zurich University of Applied Sciences
School of Management and Law
Chatbots/Conversational Interfaces
in the Context of the Stereotype Content Model (SCM)
Author:
Annemarie Schär
Hermannstrasse 11
8400 Winterthur
Matriculation Number: 14-676-399
Program:
Bachelor of Science (BSc) ZFH in Business Information Technology
Supervisor:
Dr. Roger Seiler
Date of submission: 24th May 2018
Bachelor Thesis Annemarie Schär
ZHAW School of Management and Law II
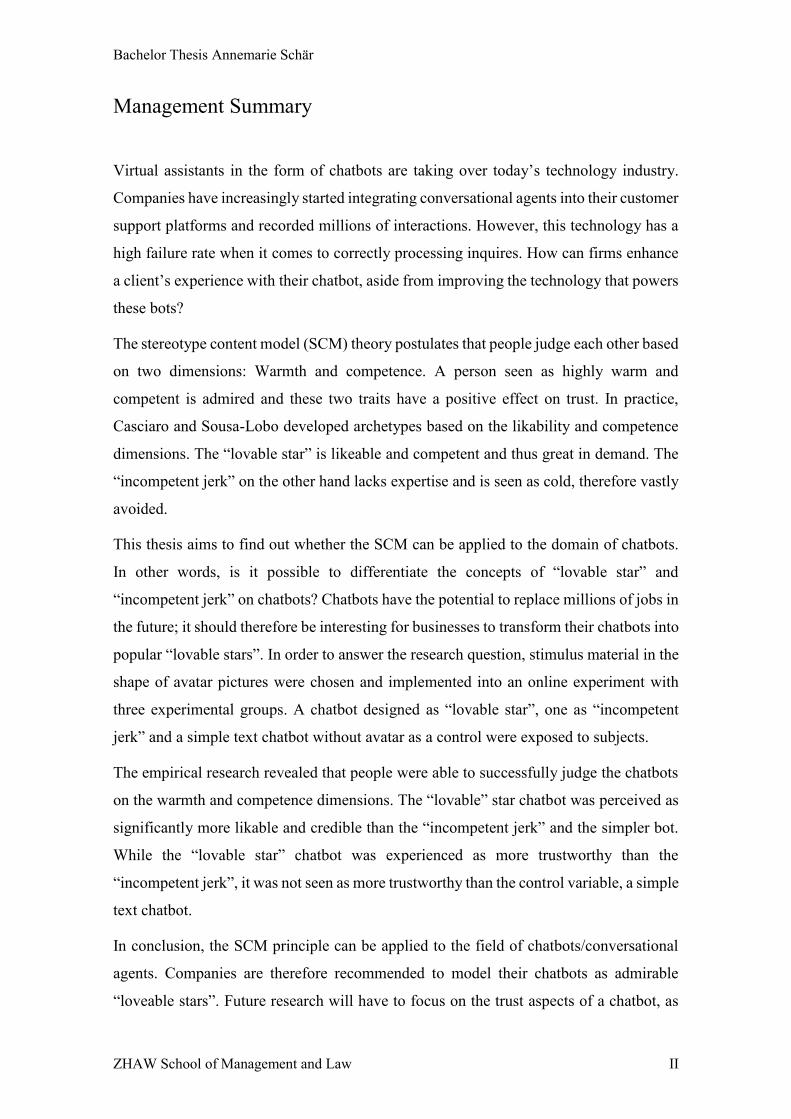
Management Summary
Virtual assistants in the form of chatbots are taking over today’s technology industry.
Companies have increasingly started integrating conversational agents into their customer
support platforms and recorded millions of interactions. However, this technology has a
high failure rate when it comes to correctly processing inquires. How can firms enhance
a client’s experience with their chatbot, aside from improving the technology that powers
these bots?
The stereotype content model (SCM) theory postulates that people judge each other based
on two dimensions: Warmth and competence. A person seen as highly warm and
competent is admired and these two traits have a positive effect on trust. In practice,
Casciaro and Sousa-Lobo developed archetypes based on the likability and competence
dimensions. The “lovable star” is likeable and competent and thus great in demand. The
“incompetent jerk” on the other hand lacks expertise and is seen as cold, therefore vastly
avoided.
This thesis aims to find out whether the SCM can be applied to the domain of chatbots.
In other words, is it possible to differentiate the concepts of “lovable star” and
“incompetent jerk” on chatbots? Chatbots have the potential to replace millions of jobs in
the future; it should therefore be interesting for businesses to transform their chatbots into
popular “lovable stars”. In order to answer the research question, stimulus material in the
shape of avatar pictures were chosen and implemented into an online experiment with
three experimental groups. A chatbot designed as “lovable star”, one as “incompetent
jerk” and a simple text chatbot without avatar as a control were exposed to subjects.
The empirical research revealed that people were able to successfully judge the chatbots
on the warmth and competence dimensions. The “lovable” star chatbot was perceived as
significantly more likable and credible than the “incompetent jerk” and the simpler bot.
While the “lovable star” chatbot was experienced as more trustworthy than the
“incompetent jerk”, it was not seen as more trustworthy than the control variable, a simple
text chatbot.
In conclusion, the SCM principle can be applied to the field of chatbots/conversational
agents. Companies are therefore recommended to model their chatbots as admirable
“loveable stars”. Future research will have to focus on the trust aspects of a chatbot, as

Bachelor Thesis Annemarie Schär
ZHAW School of Management and Law III
the “lovable star” chatbot did not receive significantly higher trust scores than the plain
chatbot.
Although the model is transferrable, businesses are advised to be upfront about their
chatbot technology. Further findings show that consumers want to know that they are
talking to a chatbot and not a real human. It is also suggested for firms to use a modern
approach and illustrate cartoonish avatars in order to avoid the uncanny valley effect.
Lastly, companies should aim to reduce a chatbot’s error rates, enable a fast processing
of inquiries and offer individualized consulting sessions. They should be cautious about
data privacy, particularly when it comes to asking consumers about sharing sensitive
information with a bot.

Bachelor Thesis Annemarie Schär
ZHAW School of Management and Law IV
Contents
1. Introduction ............................................................................................................... 1
1.1. Background information .................................................................................... 1
1.2. Problem Statement ............................................................................................. 2
1.3. Aim of the Thesis ............................................................................................... 3
2. Theoretical Framework ............................................................................................. 3
2.1. Chatbots ............................................................................................................. 3
2.1.1. Definition ....................................................................................................... 3
2.1.2. Natural Language Processing (NLP).............................................................. 4
2.2. Nonverbal Communication ................................................................................ 5
2.2.1. Definition ....................................................................................................... 5
2.2.2. Nonverbal Warmth and Competence Cues .................................................... 5
2.2.3. Facial Expressions .......................................................................................... 6
2.2.4. Appearance ..................................................................................................... 7
2.2.5. Body Language .............................................................................................. 7
2.3. First Impressions ................................................................................................ 8
2.4. Stereotype Content Model (SCM) ..................................................................... 9
2.4.1. Definition ....................................................................................................... 9
2.4.2. The SCM Applied to Practice ...................................................................... 10
2.5. Trust ................................................................................................................. 11
2.5.1. Definition ..................................................................................................... 11
2.5.2. Online Trust.................................................................................................. 12
2.5.3. Online Trust in Chatbots .............................................................................. 13
2.5.4. The SCM and Trust ...................................................................................... 14
3. Hypothesis Statements ............................................................................................ 14
3.1. SCM Theory .................................................................................................... 15
3.2. Trust ................................................................................................................. 15

Bachelor Thesis Annemarie Schär
ZHAW School of Management and Law V
4. Methodology ........................................................................................................... 16
4.1. Research Design .............................................................................................. 16
4.2. Structure of the Experiment ............................................................................. 17
4.2.1. Manipulation Check ..................................................................................... 17
4.3. Questionnaire ................................................................................................... 18
4.3.1. Demographic questions ................................................................................ 19
4.3.2. Warmth items ............................................................................................... 19
4.3.3. Competence items ........................................................................................ 20
4.3.4. Trust items .................................................................................................... 20
4.3.5. General questions ......................................................................................... 21
5. Collection of Primary Data ..................................................................................... 22
5.1. Sample selection .............................................................................................. 22
6. Analysis of Data ...................................................................................................... 23
6.1. Data Preparation .............................................................................................. 23
6.2. Statistical Methods ........................................................................................... 23
6.3. Descriptive Statistics ........................................................................................ 24
6.4. Psychographic Information .............................................................................. 26
6.5. Reliability ......................................................................................................... 27
6.6. Hypothesis Testing .......................................................................................... 27
6.6.1. Hypothesis 1 ................................................................................................. 27
6.6.2. Hypothesis 2 ................................................................................................. 28
6.6.3. Hypothesis 3 ................................................................................................. 28
6.6.4. Hypothesis 4 ................................................................................................. 28
6.6.5. Hypothesis 5 ................................................................................................. 29
6.6.6. Hypothesis 6 ................................................................................................. 29
6.6.7. Results .......................................................................................................... 29
6.7. Further Analysis ............................................................................................... 30
Bachelor Thesis Annemarie Schär
ZHAW School of Management and Law VI
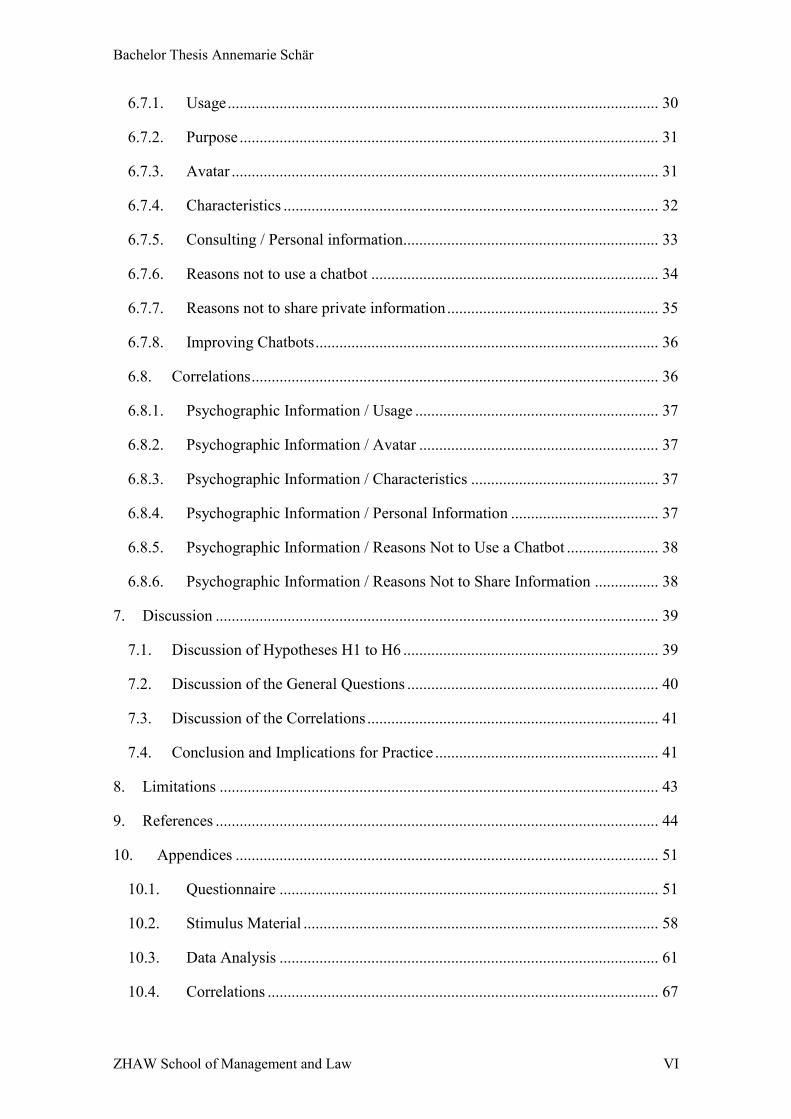
6.7.1. Usage ............................................................................................................ 30
6.7.2. Purpose ......................................................................................................... 31
6.7.3. Avatar ........................................................................................................... 31
6.7.4. Characteristics .............................................................................................. 32
6.7.5. Consulting / Personal information................................................................ 33
6.7.6. Reasons not to use a chatbot ........................................................................ 34
6.7.7. Reasons not to share private information ..................................................... 35
6.7.8. Improving Chatbots ...................................................................................... 36
6.8. Correlations ...................................................................................................... 36
6.8.1. Psychographic Information / Usage ............................................................. 37
6.8.2. Psychographic Information / Avatar ............................................................ 37
6.8.3. Psychographic Information / Characteristics ............................................... 37
6.8.4. Psychographic Information / Personal Information ..................................... 37
6.8.5. Psychographic Information / Reasons Not to Use a Chatbot ....................... 38
6.8.6. Psychographic Information / Reasons Not to Share Information ................ 38
7. Discussion ............................................................................................................... 39
7.1. Discussion of Hypotheses H1 to H6 ................................................................ 39
7.2. Discussion of the General Questions ............................................................... 40
7.3. Discussion of the Correlations ......................................................................... 41
7.4. Conclusion and Implications for Practice ........................................................ 41
8. Limitations .............................................................................................................. 43
9. References ............................................................................................................... 44
10. Appendices .......................................................................................................... 51
10.1. Questionnaire ............................................................................................... 51
10.2. Stimulus Material ......................................................................................... 58
10.3. Data Analysis ............................................................................................... 61
10.4. Correlations .................................................................................................. 67

Bachelor Thesis Annemarie Schär
ZHAW School of Management and Law VII
List of Figures
Figure 1: Model of Casciaro and Sousa-Lobo (2005) .................................................... 10
Figure 2: Model of Online Trust by Corritore et al. (2003) ........................................... 13
Figure 3: Structure of the experiment ............................................................................. 18
Figure 4: Stimulus Material for Chatbot 1, part 1 .......................................................... 58
Figure 5: Stimulus material for Chatbot 1, part 2 ........................................................... 58
Figure 6: Stimulus material for Chatbot 2, part 1 ........................................................... 59
Figure 7: Stimulus material for Chatbot 2, part 2 ........................................................... 59
Figure 8: Stimulus material for Chatbot 3, part 1 ........................................................... 60
Figure 9: Stimulus material for Chatbot 3, part 2 ........................................................... 60
Bachelor Thesis Annemarie Schär
ZHAW School of Management and Law VIII
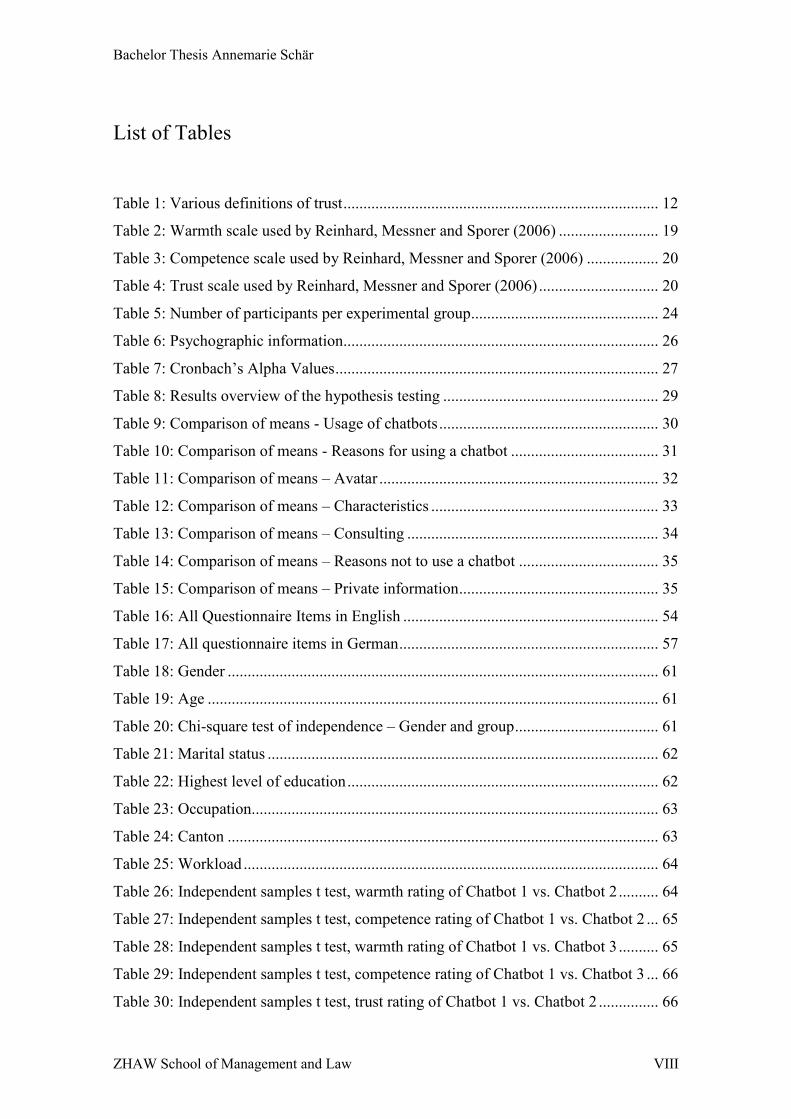
List of Tables
Table 1: Various definitions of trust ............................................................................... 12
Table 2: Warmth scale used by Reinhard, Messner and Sporer (2006) ......................... 19
Table 3: Competence scale used by Reinhard, Messner and Sporer (2006) .................. 20
Table 4: Trust scale used by Reinhard, Messner and Sporer (2006) .............................. 20
Table 5: Number of participants per experimental group............................................... 24
Table 6: Psychographic information............................................................................... 26
Table 7: Cronbach’s Alpha Values ................................................................................. 27
Table 8: Results overview of the hypothesis testing ...................................................... 29
Table 9: Comparison of means - Usage of chatbots ....................................................... 30
Table 10: Comparison of means - Reasons for using a chatbot ..................................... 31
Table 11: Comparison of means – Avatar ...................................................................... 32
Table 12: Comparison of means – Characteristics ......................................................... 33
Table 13: Comparison of means – Consulting ............................................................... 34
Table 14: Comparison of means – Reasons not to use a chatbot ................................... 35
Table 15: Comparison of means – Private information .................................................. 35
Table 16: All Questionnaire Items in English ................................................................ 54
Table 17: All questionnaire items in German ................................................................. 57
Table 18: Gender ............................................................................................................ 61
Table 19: Age ................................................................................................................. 61
Table 20: Chi-square test of independence – Gender and group .................................... 61
Table 21: Marital status .................................................................................................. 62
Table 22: Highest level of education .............................................................................. 62
Table 23: Occupation...................................................................................................... 63
Table 24: Canton ............................................................................................................ 63
Table 25: Workload ........................................................................................................ 64
Table 26: Independent samples t test, warmth rating of Chatbot 1 vs. Chatbot 2 .......... 64
Table 27: Independent samples t test, competence rating of Chatbot 1 vs. Chatbot 2 ... 65
Table 28: Independent samples t test, warmth rating of Chatbot 1 vs. Chatbot 3 .......... 65
Table 29: Independent samples t test, competence rating of Chatbot 1 vs. Chatbot 3 ... 66
Table 30: Independent samples t test, trust rating of Chatbot 1 vs. Chatbot 2 ............... 66
Bachelor Thesis Annemarie Schär
ZHAW School of Management and Law IX
Table 31: Independent samples t test, trust rating of Chatbot 1 vs. Chatbot 3 ............... 67
Table 32: Psychographic / Usage ................................................................................... 67
Table 33: Psychographic / Avatar .................................................................................. 68
Table 34: Psychographic / Characteristics...................................................................... 68
Table 35: Psychographic / Consulting ............................................................................ 69
Table 36: Psychographic / Reasons not to use a bot....................................................... 69
Table 37: Psychographic / Reasons not to share information ........................................ 70

Bachelor Thesis Annemarie Schär
ZHAW School of Management and Law X
List of Abbreviations
SCM Stereotype Content Model
AI Artificial Intelligence
NLP Natural Language Processing
ML Machine Learning
DCA Disembodied conversational agents
ECA Embodied conversational agents
M Mean
SD Standard Deviation
Bachelor Thesis Annemarie Schär
ZHAW School of Management and Law 1
1. Introduction
This thesis starts with an introduction and background information on chatbots. After that,
the problem statement and the aim of this thesis are presented.
1.1. Background information
Intelligent virtual assistants in the form of chatbots, conversational interfaces or digital
assistants are taking over today's technology industry (DALE, 2016, p. 811). The most
famous technologies are the voice-driven virtual assistants such as the well-known
Google Assistant, Apple's Siri, Amazon's Alexa and Microsoft's Cortana. The lesser
known technology is the text-based chatbot which is taking over messaging apps and
social media (DALE, 2016, p. 811). In less than a year, Facebook Messenger released
over 100,000 chatbots (Johnson, 2017). On Pandorabots, a leading chatbot platform and
community, over 300,000 chatbots have been created by more than 250,000 registered
bot developers, as well as over six billion interactions with users have been recorded
(Pandorabots & Inc, 2018). Microsoft’s conversational artificial intelligence (AI) tools
report a monthly activity of 30,000 bots (Dillet, 2018). Approximately 30 million
messages are handled across thousands of company platforms, including UPS, Stack
Overlow, Asiana Airlines, and many more (Dillet, 2018)
Bots can execute simple tasks such as booking hotel rooms and airline tickets, or complex
tasks like financial aid, health and insurance advice or online shopping guidance. This
form of AI can potentially replace millions of human worker jobs. According to a recent
forecast study, chatbots might deliver the banking and insurance sectors up to $8 billion
in cost savings per year by 2022 (Foye, 2017). It is also estimated that chatbots will take
over 25 percent of customer service communication by the year 2020 (Gartner, 2018). In
addition, by the year 2020, 80 percent of businesses will have implemented a form of
chatbot technology into their processes (Business Insider, 2016).

Bachelor Thesis Annemarie Schär
ZHAW School of Management and Law 2
1.2. Problem Statement
Making use of conversational interfaces has become a top priority for companies and
consumers, as well as several scientific organizations (DALE, 2016). As companies
increasingly utilize these conversational agents with customers, it becomes crucial to
understand the influencing factors that drive consumers towards the use of chatbots. This
calls for greater urgency especially since current reports show the drawbacks and high
failure rates of chatbots implemented on social media and messaging apps (Knight, 2016).
Facebook reported that its AI bots hit a failure rate of 70 percent since the launch of their
bot API on its Messenger, e.g. not being able to answer correctly specific questions
(Orlowski, 2017).
Furthermore, a PointSource report showed that 80 percent of users looking for healthcare
or financial advice/products admitted that they would prefer talking to a human instead
of a bot, even though 90 percent of the users believe that companies are ready to make
use of the chatbot technology (Hopping, 2018). These examples show the need to
prioritize the development of the chatbot technology.
The stereotype content model (SCM) proposes that humans use the two primary
dimensions of warmth and competence to judge other humans in social interactions,
preferring someone with high degree of likability (warmth) and competence (Fiske et al.,
2007, p. 77). A study conducted by Casciaro and Sousa-Lobo (2005) shows that within
organizations, people prefer to work with “lovable stars” (highly warm and competent).
These two traits affect first impressions and trust. Customers are more likely to buy from
businesses they trust and of which they have a good impression.
Combining the domains of chatbots and the SCM, the author theorizes that the SCM
principle can be useful for businesses that want to launch more trustworthy and successful
chatbots and also improve the area of human-computer communication. Since chatbots
have the potential to replace millions human workers the future, it should be interesting
for companies to transforms their chatbots into trustworthy “lovable stars”.

Bachelor Thesis Annemarie Schär
ZHAW School of Management and Law 3
1.3. Aim of the Thesis
The aim of this Bachelor’s thesis is to answer the question whether the SCM can be
applied to the domain of chatbots/conversational interfaces. It is concerned with the
modeling of high warm and high competence conversational agents. The thesis examines
whether the concepts of a “lovable star” and “incompetent jerk” can be differentiated on
chatbots and whether high warmth and competence scores have a positive influence on
the trustworthiness of a chatbot.
2. Theoretical Framework
This section presents existing studies of the general topic and subtopics of this thesis. It
is designed to build an understanding of the contributions to the general problem being
researched. A set of hypotheses was drawn from this literature review.
2.1. Chatbots
This part starts with the definition of a chatbot, since essential parts of this thesis draw on
this subject. After defining what a chatbot is, the technology used to power chatbots is
explained.
2.1.1. Definition
Chatbots (a.k.a. chatterbots) simulate text or speech based conversations with the human
end-user (Pereira et al., 2016). A chatbot uses natural language to interact with users,
powered by natural language processing (NLP) and machine learning (ML), both related
to the field of AI (Pereira et al., 2016). The terms NLP and ML will be explained in detail
in the next chapters. This form of technology was first developed in the 1960s to make
users believe they were chatting with a real person. Some chatbots have avatars or talking
heads to display more human-like characteristics. To engage in conversation, the bot
accesses a large storage of response patterns. It usually replies to the user's input instead
of taking the initiative to start a chat (McTear et al., 2016).

Bachelor Thesis Annemarie Schär
ZHAW School of Management and Law 4
Chatbots on websites, messaging apps and social media are usually referred to as
Disembodied conversational agents (DCAs) (Araujo, 2018). These bots generally use a
text-based interface which allows the exchange of different media such as videos and
images between the DCA and the user. Conversational agents may also be embodied.
Embodied conversational agents (ECAs) usually have a non-static, virtual body (avatar)
and human-like facial features that enables them to use nonverbal communication (body
movements, facial expressions) (Araujo, 2018). The chatbot used in this study's empirical
research is a disembodied conversational agent.
2.1.2. Natural Language Processing (NLP)
As mentioned in the previous section, chatbots use NLP to learn how to converse with
humans. NLP is categorized in the field of computer science that focuses on
computational techniques (Hirschberg & D. Manning, 2015). These computational
techniques focus on learning, understanding, and creating human language content
(Hirschberg & D. Manning, 2015).
Boutin (2017) explains that the "intent" of a user is captured and classified by the bot.
The bot can then be trained with as many intents needed, depending on the purpose of the
chatbot. An example of an intent could be "small-talk". One would start training by
creating intents such as "how are you?", "it's nice weather today", or "when do we meet
up?”. NLP does not use keywords, instead it uses its understanding of pattern recognition,
sentence structures and idioms to match the users intent with the previously classified
intents (Boutin, 2017).
To enhance the performance of NLP, ML techniques are often used within it. ML can be
described as a computer program automatically learning and improving their performance
through experience. This is defined as "programming by example" (Mumford & Jain,
2009).
Bachelor Thesis Annemarie Schär
ZHAW School of Management and Law 5
2.2. Nonverbal Communication
This section begins the definition of nonverbal communication and its components. Also,
the concept of the SCM is presented to explain the two central social cognition
dimensions which are essential for this thesis: warmth and competence.
2.2.1. Definition
Nonverbal communication is a set of conscious or unconscious behaviors. This includes
gestures, facial expressions and the tonality of voice (Eunson, 2013, p. 256). Humans are
communicating even when they are not talking. Albert Mehrabian (1981) found that
communication is mainly expressed through nonverbal actions. 7% is conveyed verbally
(words), 38% vocally (tone, pitch) and 55% visually (nonverbal) (Mehabian, 1981).
According to Dickson and Hargie (2013), nonverbal communication is complementary to
verbal communication, strengthening the meaning of the message. It can also replace
verbal communication when one is not able to talk. It alters the said words, conveys
emotions and attitudes, shows identity through adornments and sets the framework in a
social setting (Hargie, 2003).
Nonverbal communication is subjective and can be ambiguous. People make judgments
based on what they think is correct, however, they could equally be wrong about their
perception. In an online context, communication does not allow the use of nonverbal
signals. With chat messengers, it is not possible to use body language and the tonality of
voice. One possible method to decrease confusion and misinterpretation is the use of
emoticons.
2.2.2. Nonverbal Warmth and Competence Cues
A person has some control over the impression he/she makes along the warmth and
competence dimensions through nonverbal cues (Cuddy et al., 2011, p. 88). One could
argue that in all social interactions, people are consistently projecting warmth/coldness
and competence/incompetence through nonverbal cues (Cuddy et al., 2011, p. 88).

Bachelor Thesis Annemarie Schär
ZHAW School of Management and Law 6
Nonverbal warm cues include smiling, leaning forward, nodding, leaning the body
towards someone and relaxed hand gestures (Cuddy et al., 2011, p. 89). Contrarily, cold
nonverbal cues are defined as having a tense posture, leaning backwards, shifting the
body away from someone, and tense intrusive hand gestures (Cuddy et al., 2011, p. 89).
Nonverbal competent cues are described as being dominant, expansive and open (e.g.
using up more space, a firm hand shake) (Cuddy et al., 2011, p. 90) Finally, nonverbal
incompetent cues include submissive poses and generally emitting low confidence
(Cuddy et al., 2011, p. 90).
To show the importance of non-verbal communication in an online setting (pictures,
avatars), the author will focus on three categories of nonverbal communication in
particular: facial expressions, appearance and body language.
2.2.3. Facial Expressions
Facial expressions generate the most data in terms of expressing emotions (Oatley, 1992).
They can have various meanings depending on the culture. For example, Japanese people
are taught not to reveal their emotions to other people unless they have an intimate
relationship with that person. This demonstrates self-control, which is highly valued in
the Japanese culture. Smiling also has diverse meanings in different cultures. In the selling
context, a study showed that a salesperson is perceived more capable and trustworthy
when the salesperson smiled a lot (Wood et al., 2008).
However, there are particular facial expressions that are recognizable across cultures,
which is known as the universality thesis (Russell, 1995). Russell categorizes two types
of universal facial expressions: "easily recognized" and "specific emotion categories”.
The latter category includes emotions such as happiness, fear, sadness and anger (Russell,
1995).
Additionally, research has shown that people can accurately detect the emotions of others
through facial expressions even without personal contact, e.g. in the form of photographs
(Ambady et al., 2006, p. 4)
Bachelor Thesis Annemarie Schär
ZHAW School of Management and Law 7
2.2.4. Appearance
Appearance is an important factor in nonverbal communication. It carries information on
the physical features of a person such as height, weight, age, sex and it offers insights
into someone's personality (Urbaniak, 2005). It also includes accessories, clothes,
environmental aspects and other adjustments on their appearance (Eunson, 2013).
Observers may identify personality traits about an individual through their dress style.
For example, professors are assessed as more knowledgeable when dressed smartly
(Morris et al., 1996). Teachers dressed casually were perceived as more entertaining
(Morris et al., 1996). In a professional setting, it is essential to dress appropriately as a
salesperson. By dressing smartly, salespeople are seen as more competent they are more
likely to gain the trust of their client (Wood et al., 2008). A newer study shows that men
and women are viewed more credible when dressed in smart attire. For instance, models
dressed in a suit were judged more competent than those dressed in a casual manner
(Gurney et al., 2017).
2.2.5. Body Language
Body language sends out more authentic signals than just words. Subconsciously, the
body will show different messages when lying or being insincere (Ekman, 2015). It
reflects how someone feels about themselves, it can influence the perception of an
audience and how the crowd views them in return (Cuddy, 2012).
A powerful, confident posture compared to a weak posture can make a person feel strong
and make them have more confidence in themselves (Briñol et al., 2009). Research shows
that when men displayed a power pose, they stated a change in behavior, feeling more
powerful, taking more risks and even went through hormonal changes such as increased
level of testosterone and reduced cortisol (Carney et al., 2010). Using power poses can
make someone feel fitter and physically stronger (Hee Lee & Schnall, 2014) Making use
of these poses also help achieve better results at job interviews (Cuddy et al., 2015). A
positive relationship is therefore apparent between power poses and feelings of being
strong.
Bachelor Thesis Annemarie Schär
ZHAW School of Management and Law 8
Moreover, admiration through body language is expressed by mirroring the admired
person's posture (Eunson, 2013, p. 267) This mimicry, the so called "chameleon effect",
was important in human evolution to bond and build relationships with other humans
(Lakin et al., 2003, p. 1).
2.3. First Impressions
A person needs less than 100 milliseconds of exposure to a face in order to make a
judgment on them (Willis & Todorov, 2006). Additional exposure time increases
confidence in judgments and allows for more differentiated impressions. Increased
exposure time may allow for more individualized impressions of a person, however, the
initial impression has already been set and anchored into a person's mind (Willis
& Todorov, 2006).
Berg and Piner (1990) stated that during the first two minutes, interviewers report
knowing whether a job candidate is suitable for the vacancy and people claimed knowing
within the first thirty seconds whether a blind date will go well (as cited in Bartneck,
2007). Clients judge a salesperson within seconds of the first confrontation, deciding
whether the salesperson is helpful or too pushy (Ambady et al., 2006). In the context of
the SCM, warmth and competence judgments are made within the first few seconds of an
encounter with another person (Fiske et al., 2007, p. 77).
Numerous studies have indicated that important judgments about others are made within
seconds, if not milliseconds of meeting another person. Consequently, it is highly likely
that people are also capable of making the same judgments on robots/virtual entities based
on their first impression (Bartneck et al., 2007).
Bachelor Thesis Annemarie Schär
ZHAW School of Management and Law 9
2.4. Stereotype Content Model (SCM)
This part starts with the definition, then explanation of the stereotype content model
(SCM) and finally its application to practice.
2.4.1. Definition
The SCM is a theory in social psychology that categorizes interpersonal impressions and
stereotypes based on the dimensions warmth and competence (Fiske et al., 2002). These
two attributes make up 82% of the diversity in perception of everyday social interactions
(Wojciszke et al., 1998).
According to Fiske et al. (2007) warmth is about good or bad intentions while competence
is about ability to ratify those intentions. Both stereotypes are rooted in evolutionary
pressures (Fiske et al., 2007, p. 77). This is because within seconds of the first encounter
between two people, one decides whether the other has good or bad intentions (Fiske et
al., 2007, p. 77). The next question would be whether the other person is able to act out
on his/her intention (Fiske et al., 2007, p. 77). People who are seen as warm and
competent evoke positive emotions and behavior, whereas those seen as lacking warmth
and competence evoke negative feelings (Fiske et al., 2007, p. 77). When two people
meet, they judge each other’s warmth and competence first (Cuddy et al., 2008, p. 62).
Evidence suggests that warmth is judged before competence, and causes stronger
affective and behavioral responses (Fiske et al., 2007, p. 77). This makes sense because
evaluating whether a person is a friend or foe is more important than whether a person
can carry out his/her intentions (Fiske et al., 2007, p. 77).
Warmth judgments primarily affect our perception of trust in another person and
competence judgments affect our perception of a person’s ability to enact his/her intent
(Cuddy et al., 2011, p. 74). There is a tendency to trust a person once it is apparent that
the person has no ill intent or cannot realize that intent (Fiske et al., 2007, p. 77). In other
words, perceived trustworthiness in others depends on a person’s warmth and competence
level (Fiske & Dupree, 2014, p. 13593).

Bachelor Thesis Annemarie Schär
ZHAW School of Management and Law 10
2.4.2. The SCM Applied to Practice
The SCM theory has been tested and applied to practice before. Aaker et al. (2010) found
that non-profit organizations are perceived warmer than for-profit organizations but also
as less competent. Additionally, customers would rather buy a product from a for-profit
than from a non-profit since they are seen as more competent (Aaker et al., 2010, p. 230).
When a non-profit’s perceived competence is improved, people are more willing to buy
from them. Finally, when consumers perceive a high level of warmth and competence,
they feel admiration for the company which then increases their willingness to buy (Aaker
et al., 2010, p. 230).
Another study showed that high warmth and high competence interactively affect the
intention to purchase, with competence being the more important driver of purchase intent
(Aaker et al., 2012, p. 193). This is because consumers admire brands that are placed in
the "golden quadrant" (highly warm and highly competent) (Aaker et al., 2012, p. 193).
Furthermore, Casciaro and Sousa-Lobo (2005) demonstrated in their study that when
people can decide with whom to work with, they choose based on the criteria of
competence (Does the person know what he/she is doing?) and likability (Is the person
pleasant to work with?) (Casciaro & Sousa Lobo, 2005, p. 3). They used the two
dimensions competence and likability and built a 2x2 matrix (see Figure 1).
Figure 1: Model of Casciaro and Sousa-Lobo (2005)
Bachelor Thesis Annemarie Schär
ZHAW School of Management and Law 11
Their study suggests that within an organization, people want to work with “lovable stars”
and avoid working with “incompetent jerks”. “Lovable stars” are seen as highly warm
and highly competent, whereas “incompetent jerks” are perceived as incompetent and not
likable. The “competent jerks” are competent, but mostly avoided since they are not seen
as warm/likable. The “lovable fools” are highly likable but incompetent, thus people only
mildly want to work with them (Casciaro & Sousa Lobo, 2005, p. 5).
Other studies confirmed that the SCM can be applied to the domain of insurance agents
(Seiler et al., 2015), as well as to the field of crowdfunding (Seiler et al., 2016). The
crowdfunding study suggests that the competence dimension is more important than the
warmth dimension, whether it is in a business context, consumer behavior context or
connected to a brand/person (Seiler et al., 2016, p. 6).
2.5. Trust
This section defines what trust is since it plays an important role in the SCM theory. In
addition, trust in an online context is discussed in this part.
2.5.1. Definition
Trust comes in many forms, e.g. in a friendship where secrets are exchanged, or in a
business context where trust is essential for business partners, or a more recent topic of
trust in an online context (cloud computing, social networks, data sharing, etc.)
(Walterbusch et al., 2014).
There are various definitions of trust in literature, however, there is no common definition
of trust (Rousseau et al., 1998, p. 393). For example, trust is from the perspective of an
economist mainly calculative, whereas sociologist believe that trust lies within the
characteristics of interpersonal relationships (Walterbusch et al., 2014). Trust can be
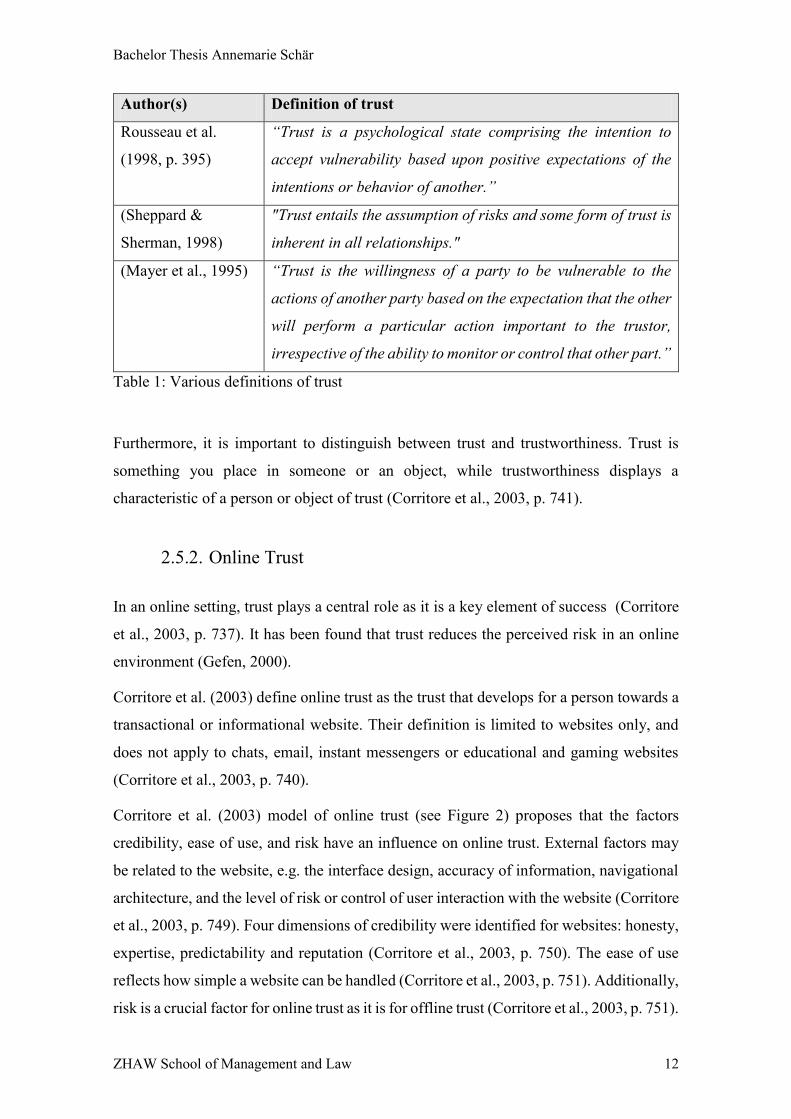
defined as in Table 1.
Bachelor Thesis Annemarie Schär
ZHAW School of Management and Law 12
Author(s) Definition of trust
Rousseau et al.
(1998, p. 395)
“Trust is a psychological state comprising the intention to
accept vulnerability based upon positive expectations of the
intentions or behavior of another.”
(Sheppard &
Sherman, 1998)
"Trust entails the assumption of risks and some form of trust is
inherent in all relationships."
(Mayer et al., 1995) “Trust is the willingness of a party to be vulnerable to the
actions of another party based on the expectation that the other
will perform a particular action important to the trustor,
irrespective of the ability to monitor or control that other part.”
Table 1: Various definitions of trust
Furthermore, it is important to distinguish between trust and trustworthiness. Trust is
something you place in someone or an object, while trustworthiness displays a
characteristic of a person or object of trust (Corritore et al., 2003, p. 741).
2.5.2. Online Trust
In an online setting, trust plays a central role as it is a key element of success (Corritore
et al., 2003, p. 737). It has been found that trust reduces the perceived risk in an online
environment (Gefen, 2000).
Corritore et al. (2003) define online trust as the trust that develops for a person towards a
transactional or informational website. Their definition is limited to websites only, and
does not apply to chats, email, instant messengers or educational and gaming websites
(Corritore et al., 2003, p. 740).
Corritore et al. (2003) model of online trust (see Figure 2) proposes that the factors
credibility, ease of use, and risk have an influence on online trust. External factors may
be related to the website, e.g. the interface design, accuracy of information, navigational
architecture, and the level of risk or control of user interaction with the website (Corritore
et al., 2003, p. 749). Four dimensions of credibility were identified for websites: honesty,
expertise, predictability and reputation (Corritore et al., 2003, p. 750). The ease of use
reflects how simple a website can be handled (Corritore et al., 2003, p. 751). Additionally,
risk is a crucial factor for online trust as it is for offline trust (Corritore et al., 2003, p. 751).

Bachelor Thesis Annemarie Schär
ZHAW School of Management and Law 13
Figure 2: Model of Online Trust by Corritore et al. (2003)
2.5.3. Online Trust in Chatbots
In the context of chatbots, social presence plays an important role when choosing to
interact with computer agents (Xu & Lombard, 2017, p. 152). Social presence can be
described as a psychological state where virtual actors are perceived as real actors (Lee,
2004, p. 37). Lombard and Ditton (1997) identified two types of social presence: a virtual
character presenting social cues within a medium and the medium itself presented as
social actor (Lombard & Ditton, 1997). When the medium signals social cues, people are
inclined to see the medium as a real person (Xu & Lombard, 2017, p. 155). Therefore,
social presence is explained as the phenomenon where people feel as if they were
interacting with a real human instead of a technology-driven entity (ISPR, 2009).
A study has shown that social presence of embodied avatars shown on company websites
significantly influenced the perceived trust and emotional appeal of the website, if the
avatars are perceived as pleasant (Etemad-Sajadi & Ghachem, 2015, pp. 84–85). It was
found that social presence is a main driver of trust and online purchase intent (Lu et al.,
2016, p. 225). Additionally, social presence was found to positively affect perceived trust
in recommendation agents (Hess et al., 2009, p. 908).

Bachelor Thesis Annemarie Schär
ZHAW School of Management and Law 14
Moreover, in order to generate trust with humans, a chatbot needs a face (Meadows,
2017). However, the effect of the “uncanny valley” can occur if the bot seems too realistic
(Meadows, 2017). The uncanny valley theory proposes that the more human-like a robot
is, the more it invokes positive human emotions towards them. This effect lasts up to a
certain point, where emotions become negative when one is not able to differentiate
between a real human and a robot (Bartneck et al., 2007, p. 368).
2.5.4. The SCM and Trust
Several studies have shown that warmth and competence have a positive effect on trust
(Seiler et al. 2016; Seiler et al. 2015). Aaker et al. (2012) demonstrated that warmth and
competence induce trust. Not only do high warmth and high competence lead to
admiration of a brand, it also leads to a higher willingness to purchase since the brand is
perceived more trustworthy (Aaker et al., 2012, p. 191). However, warmth has a bigger
effect on trust than competence (Aaker et al., 2012, p. 194). This was confirmed by a
study that showed that in a sales context between a salesperson and the customer, warmth
is the primary dimension (Arndt et al., 2014, p. 19).
Other findings also illustrated that warmth is a main driver of preferences towards
products or countries (Xu et al., 2013, p. 15). Moreover, the trust model by Martin (2014),
displays that high affinity and high competence lead to higher trust (Martin, 2014, p. 47).
One can therefore argue that companies should aim to build chatbots high in warmth and
competence, in order to be deemed as trustworthy.
3. Hypothesis Statements
This part focuses on the hypotheses that were developed based on current literature. It
presents the hypothesis statements that will either be rejected or accepted after the data
analysis. The chatbot designs are based on Casciaro and Sousa Lobo's (2005) 2x2 matrix
(see Figure 1).

Bachelor Thesis Annemarie Schär
ZHAW School of Management and Law 15
3.1. SCM Theory
The SCM postulates that people are judged on the two primary dimensions: warmth and
competence. This concept has been tested and applied to practice by Casciaro and Sousa
Lobo (2005). They found out that in an organization, people prefer to work with “lovable
stars” (highly warm and competent) and avoid the “incompetent jerk” (low warmth and
low competence). Another study showed that consumers admire brands placed in the
‘golden quadrant’ (highly warm and competent) (Aaker et al., 2012). Based on these
findings, the author theorizes following hypotheses relating to the domain of chatbots:
H1: Chatbot 1 (lovable star design) is perceived warmer than Chatbot 2
(incompetent jerk design)
H2: Chatbot 1 (lovable star design) is perceived more competent than Chatbot 2
(incompetent jerk design)
H3: Chatbot 1 (lovable star design) is perceived warmer than Chatbot 3 (simple
text chatbot)
H4: Chatbot 1 (lovable star design) is perceived more competent than Chatbot 3
(simple text chatbot)
3.2. Trust
As mentioned in the theoretical framework of this thesis, the dimensions warmth and
competence positively affect trust. Brands that are perceived as highly competent and
warm are admired and inspire trust (Aaker et al., 2012, p. 191). Additionally, Martin’s
(2014, p. 47) trust model stipulates that high trust can be achieved through high affinity
and high competence. The author therefore derives the following hypotheses on the
“lovable star” (highly warmth and competent) connected to chatbots:
H5: Chatbot 1 (lovable star design) is perceived more trustworthy than Chatbot 2
(incompetent jerk design).
H6: Chatbot 1 (lovable star design) is perceived more trustworthy than Chatbot 3
(simple text bot).

Bachelor Thesis Annemarie Schär
ZHAW School of Management and Law 16
4. Methodology
Based on current literature, six hypotheses were developed. In order to test the
hypotheses, an online experiment and questionnaire were conducted. The participants
were randomly assigned to three groups, each showing a different type of chatbot. The
intention was to use avatar designs that reflect the respective high/low warmth and
competence characteristics based on the social dimensions model proposed by Casciaro
and Sousa-Lobo (2005).
For stimulus material, pictures of sales agents used in a previous study on the
“experimental validation of the warmth and competence dimensions in the context of
insurance consultants” were used as avatars (Seiler et al., 2016). This study confirmed
that the SCM theory is applicable to the domain of insurance consultants, which is why
the pictures were selected.
Participants were shown screenshots of a scenario with an insurance agency chatbot (see
Appendix 9.2). Chatbot 1 was designed based on high warmth and high competence
attributes. Chatbot 2 was based on low warmth and low competence attributes, whereas
Chatbot 3 was designed as simple text chatbot to serve as a control. Participants were
randomly assigned to one of the chatbots. The text in all scenarios was the same; the only
difference was the avatar. This was to make sure that the participants focused on the
appearance of the chatbot.
4.1. Research Design
In order to determine whether the SCM theory can be applied to the context of chatbots,
a web-based experiment and a questionnaire were developed. The online experiment and
questionnaire were created with the online survey tool Unipark.
A questionnaire is used in descriptive research while an experiment is a method used in
causal research. The main principle of an experiment is the manipulation of an
independent variable(s) and then measures/observation of the effect(s) on the dependent
variable (Aaker et al., 2013, p. 324). Experimental research consists of one or more
experimental groups and one or more control groups. The experimental group is exposed
to the experimental treatment (e.g. low exposure level or medium exposure level in an
Bachelor Thesis Annemarie Schär
ZHAW School of Management and Law 17
advertising experiment) while the control group is not exposed to the experimental
treatment (Aaker et al., 2013, p. 330). A concept to increase the reliability of an
experiment is randomization. Randomization is a process where subjects are randomly
assigned to experimental groups (Aaker et al., 2013, p. 331).
4.2. Structure of the Experiment
At the beginning of the questionnaire, the subjects had to answer demographic and
psychographic questions. Then, the subjects were randomly assigned to one of the three
experimental groups including one control group. The first part of the questionnaire was
designed to answer the hypotheses H1 to H6 (see Figure 3). They had to fill out questions
concerning the aspects of warmth/likability, competence, and trust. The aim was to find
out whether the warmth and competence concept can be applied to the domain of chatbots.
In other words, will the subjects rate Chatbot 1 as warm and competent and Chatbot 2 as
incompetent and cold? The variable “trust” is the dependent variable in this experiment.
The question asked here is whether high warmth and high competence positively affect
the perceived trust of a chatbot. In the second part of the questionnaire, general questions
were asked.
4.2.1. Manipulation Check
A manipulation check was included after the first part of the questionnaire. The question
used as manipulation check was “What is the chatbot’s name?”. People who answered
the question wrongly were excluded from the study.

Bachelor Thesis Annemarie Schär
ZHAW School of Management and Law 18
Figure 3: Structure of the experiment
4.3. Questionnaire
The questionnaire (see Appendix 10.1) was designed based on the literature used in the
theoretical framework of this thesis. In first part of the questionnaire, only previously
tested and reliable multiple-item scales were used. Multiple-item scales were selected
since they have a clear advantage over single item scales in terms of predictive validity
(Diamantopoulos et al., 2012, p. 434). A seven point semantic differential and Likert
scale were used for the majority of the questions. Likert scales are widely used in research
and in practice since quantitative data can be analyzed with relative ease (Kuss, 2012,
p. 93).
Bachelor Thesis Annemarie Schär
ZHAW School of Management and Law 19
Another widespread scale used in marketing research is the semantic differential. It is
used for measuring the attitudes or feelings of the participants by using a pair of
contrasting adjectives (Kuss, 2012, p. 96).
The author translated the scales taken from previous studies from English to German, in
order to generate more responses. This is because the experiment/questionnaire was sent
to a mainly German-speaking sample. A native English speaker was consulted to ensure
an accurate translation.
4.3.1. Demographic questions
The demographic questions at the beginning of the questionnaire contained items about
age, gender, marital status, education, job status, workload, postal code and canton (see
Appendix 10.1). In order not to upset the participants, the option “not applicable” was
added to the mandatory questions.
At the end of the demographics part, four psychographic questions were asked. A seven
point Likert scale was used to ask whether the participant agreed/disagreed on being
technology-oriented, an early adopter of technology, whether he/she is up to date on
digital news and whether he/she regularly uses social media. These questions were asked
to gain more insight into the practical use of chatbots.
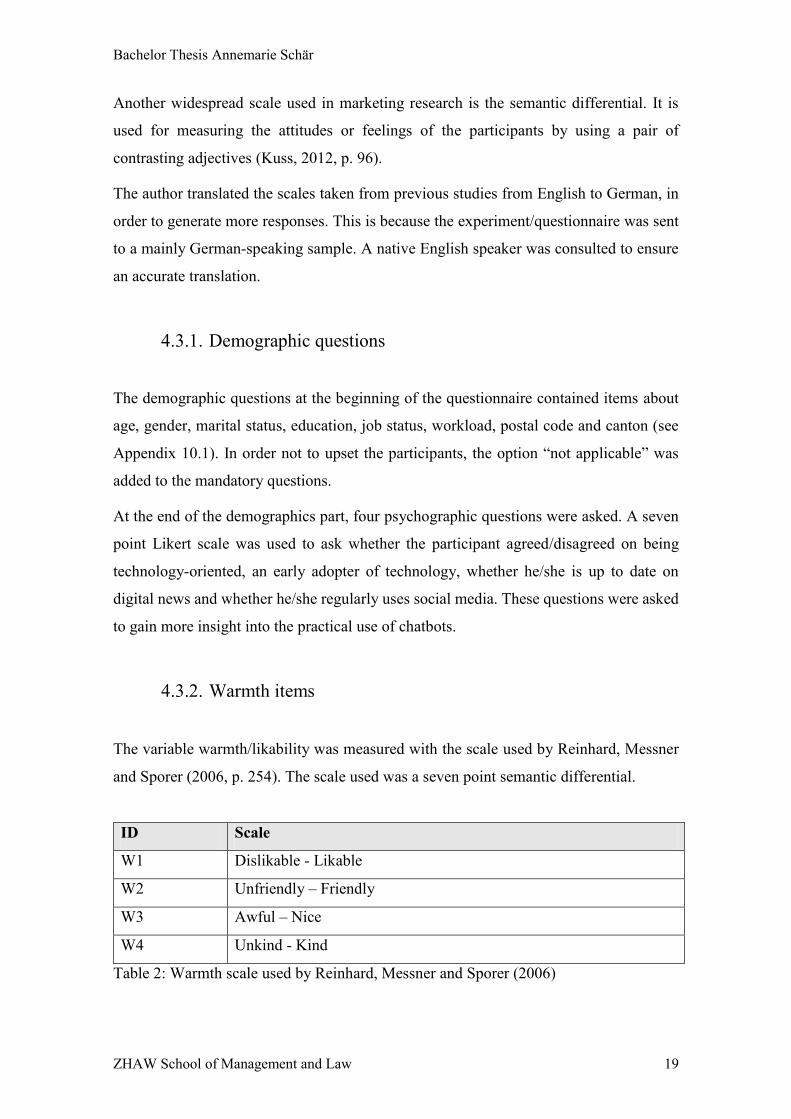
4.3.2. Warmth items
The variable warmth/likability was measured with the scale used by Reinhard, Messner
and Sporer (2006, p. 254). The scale used was a seven point semantic differential.
ID Scale
W1 Dislikable - Likable
W2 Unfriendly – Friendly
W3 Awful – Nice
W4 Unkind - Kind
Table 2: Warmth scale used by Reinhard, Messner and Sporer (2006)

Bachelor Thesis Annemarie Schär
ZHAW School of Management and Law 20
4.3.3. Competence items
Competence was measured with the construct “expertise” used by Reinhard, Messner and
Sporer (2006, p. 254) on a seven point semantic differential scale.
ID Scale
C1 Inexpert – Expert
C2 Inexperience – Experienced
C3 Unknowledgeable – Knowledgeable
C4 Unqualified – Qualified
C5 Unskilled - Skilled
Table 3: Competence scale used by Reinhard, Messner and Sporer (2006)
4.3.4. Trust items
Measured on a seven point semantic differential scale as well, the trust items were drawn
from Reinhard, Messner and Sporer (2006, p. 254), as shown in Table 4.
ID Scale
T1 Not dependable – Dependable
T2 Dishonest – Honest
T3 Unreliable – Reliable
T4 Insincere – Sincere
T5 Untrustworthy - Trustworthy
Table 4: Trust scale used by Reinhard, Messner and Sporer (2006)

Bachelor Thesis Annemarie Schär
ZHAW School of Management and Law 21
4.3.5. General questions
The second part of the questionnaire was composed of general questions about chatbots.
A Likert scale was used for all questions except for one open-ended question at the end
of the questionnaire. The same seven point Likert scales were consistently used
throughout the questionnaire in order to statistically examine the relationship between the
variables across the questionnaire.
No tested and reliable scales on measuring the characteristics/usage of a chatbot were
found. Instead, questions were grouped by the most relevant topics, based on extensive
literature research from scientific journals and websites. The lack of tested scales can be
explained by the fact that the chatbot technology is relatively new.

Bachelor Thesis Annemarie Schär
ZHAW School of Management and Law 22
5. Collection of Primary Data
The questionnaire was first sent to a group of six people in order to receive feedback on
it. Some questions were changed and inconsistencies removed after receipt of their
feedback. The final version of the questionnaire was sent to family, friends and ZHAW
students on April 24, 2018. It was open for responses until May 3, 2018.
5.1. Sample selection
The aim was to have at least n=30 subjects in all three experimental groups. This is
because of the central limit theorem which states that if the sample size is large enough,
then the distribution of the sample means will be approximately normal (Kuss, 2012,
p. 218). A sample size of at least 30 usually leads to a normal distribution of sample means
(Kuss, 2012, p. 218).
A total of n=140 subjects have fully completed the questionnaire. A sample of n=46
people were assigned to Chatbot 1, n=44 to Chatbot 2 and n=50 people saw Chatbot 3.
Since there are at least n=30 subjects per group, a normal distribution of the sampling
means in all three groups can be assumed.

Bachelor Thesis Annemarie Schär
ZHAW School of Management and Law 23
6. Analysis of Data
In this section the primary data collected from the experiment/questionnaire is analyzed.
An introduction to the statistical methods used is given and the hypotheses will be tested
using these methods. Additional statistical analysis is carried out to provide more insight
into the relationship between the variables.
6.1. Data Preparation
For the analysis of the data, only subjects who completed the entire questionnaire and
successfully passed the manipulation check were considered. Those who failed to pass
the manipulation check were removed as it is assumed that they did not pay enough
attention to the pictures and questions.
This leaves Chatbot 1 with n=38 subjects, Chatbot 2 with n=41 and Chatbot 3 with n=50
subjects, since all participants assigned to Chatbot 3 passed the manipulation check. A
total of n=129 responses were considered for the data analysis. A normal distribution of
the sample means is still assumed since there is a minimum of n=30 subjects per group.
The software “IBM SPSS Statistics 24” was used for the evaluation of the data. All
responses generated from Likert and semantic differential scales have a numeric value.
The numbers all run in the same direction and ranging from 1 (Strongly disagree/Not
important) to 7 (Strongly agree/Very important). The semantic differential scales range
from 1 to 7 from one adjective to the other.
6.2. Statistical Methods
The statistical methods used for the hypothesis testing are described in this section.
First, it is important to consider the type of data when choosing a statistical technique
(Aaker et al., 2013, p. 413). Scales of measurements can be sorted into nominal, ordinal,
interval and ratio scales (Aaker et al., 2013, p. 413).
Bachelor Thesis Annemarie Schär
ZHAW School of Management and Law 24
The nominal scale (nonmetric data) is made up of categorical data such as gender and age
(Aaker et al., 2013, p. 413). Only a few statistical analyses can be performed with this
type of data. The chi-square test is one of them and will be used in this thesis. It measures
the independence of two categorical variables to see if there is a relationship between
them (Aaker et al., 2013, p. 431).
The most useful type of data for statistical analysis are interval and ratio (metric) data
(Aaker et al., 2013, p. 413). The Likert and semantic differential scales used in this thesis
are classified as interval scales. Metric data can be tested using a set of statistical tests
explained in the next paragraphs.
To test difference between two sample means, an independent sample t-test was used
(Field, 2013, p. 365). A significance level of p ≤ 0.05 was chosen (Kuss, 2012, p. 221).
The same level of significance (p ≤ 0.05) was used for the Levene’s test (Field, 2013,
p. 193).
To determine the strength of association between two variables, Pearson correlation
coefficient r is used (Kuss, 2012, p. 207). The coefficient value can range from +1 to -1
(perfect positive or negative correlation) and a value of 0 indicates no correlation between
the variables (Kuss, 2012, p. 210).
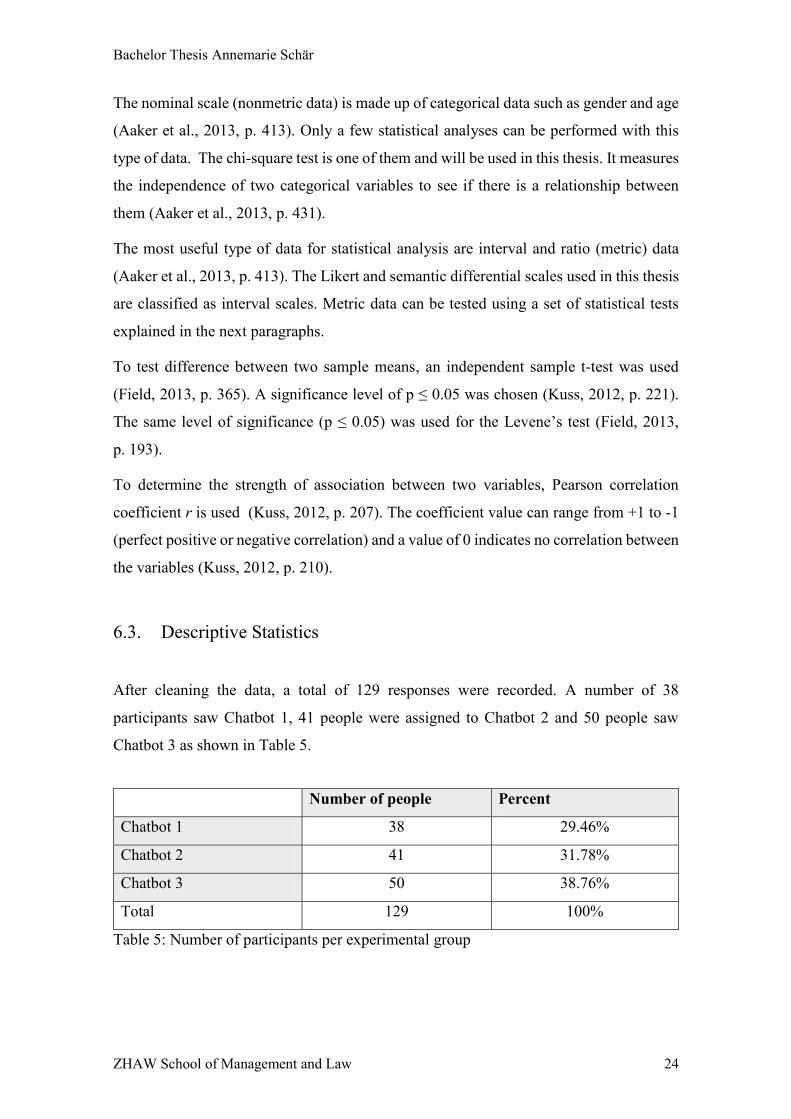
6.3. Descriptive Statistics
After cleaning the data, a total of 129 responses were recorded. A number of 38
participants saw Chatbot 1, 41 people were assigned to Chatbot 2 and 50 people saw
Chatbot 3 as shown in Table 5.
Table 5: Number of participants per experimental group
Number of people Percent
Chatbot 1 38 29.46%
Chatbot 2 41 31.78%
Chatbot 3 50 38.76%
Total 129 100%
Bachelor Thesis Annemarie Schär
ZHAW School of Management and Law 25
Participants were 60 women (46.5 percent), 66 men (51.2 percent) and 3 people (2.3
percent) preferred not to state their gender ( see Table 18) The age of participants ranged
from 19 to 54 with an average age of 27.41 years after the removal one outlier, a reported
value of 322 years (see Table 19). A chi-square test of independence was calculated
comparing the frequency of men and women per experimental group (see Table 20). No
association between gender and experimental group was observed (χ2(2) = 1.059, p =
0.588). The results were calculated with Excel as an exception.
The majority of the participants indicated that their marital status is single (87.6 percent,
n=113), 8.5 percent of the participants are married (n=11), 1.6 percent are divorced (n=2),
and 2.3 percent (n=3) did not state their marital status (see Table 21).
As highest level of education, 45.7 percent (n=59) of the subjects indicated that they have
a high school degree. This is followed by a degree from a university of applied sciences
with 26.4 percent (n=34). Next, 9.3 percent (n=12) of the participants completed an
apprenticeship and 7.8 percent (n=10) have a Swiss federal diploma of higher education
and also 7.8 percent (n=10) have a degree from a state recognized Swiss university or a
polytechnic institute. Some did not indicate their highest level of education (3.1 percent,
n=4) (see Table 22).
Most participants are part-time students with a job (48.8 percent, n=63). With 20.9 percent
(n=27), some participants are employed on a full-time basis. There are 15.5 percent
(n=20) full-time students with a job, 8.5 percent (n=11) full-time students without a job,
1.6 percent (n=1) part-time students without a job and 1.6 percent (n=2) did not state their
current occupation (see Table 23).
Regarding the workload of the participants, 25.6 percent (n=33) of the subjects work on
a part-time basis of 80 percent. Then, 20.9 percent (n=27) work on a full-time basis of
100 percent. This is followed by a workload of 60 percent (14.7 percent, n=19). The
subjects indicated working on a part-time basis of 40 percent (7 percent, n=9), 0 percent
(6.2 percent, n=8), 50 and 20 percent (4.7 percent, n=6), 70 percent (2.3 percent, n=3), 10
percent (1.6 percent, n=2), 30 percent (.8 percent, n=1) and finally 7 percent (n=9) did
not share their workload (see Table 25).
The participants were asked in which Swiss canton they reside. The question about the
postal code was excluded as it is similar to the question about the residential canton. With
69 percent (n=89), most subjects live in the canton of Zurich. Others live in the canton of
Bachelor Thesis Annemarie Schär
ZHAW School of Management and Law 26
Thurgau with 7.8 percent (n=10), followed by the canton St. Gallen with 4.7 percent (n=6)
then the canton of Schwyz with 3.9 percent (n=5), canton Schaffhausen and Aargau with
both 3.1 percent (n=4), Glarus with 2.3 percent (n=3), Basel-Stadt and Zug with each 1.6
percent (n=2), and lastly the cantons Appenzell Ausserrhoden, Graubünden, and Wallis
with each .8 percent (n=1) participants (see Table 24).
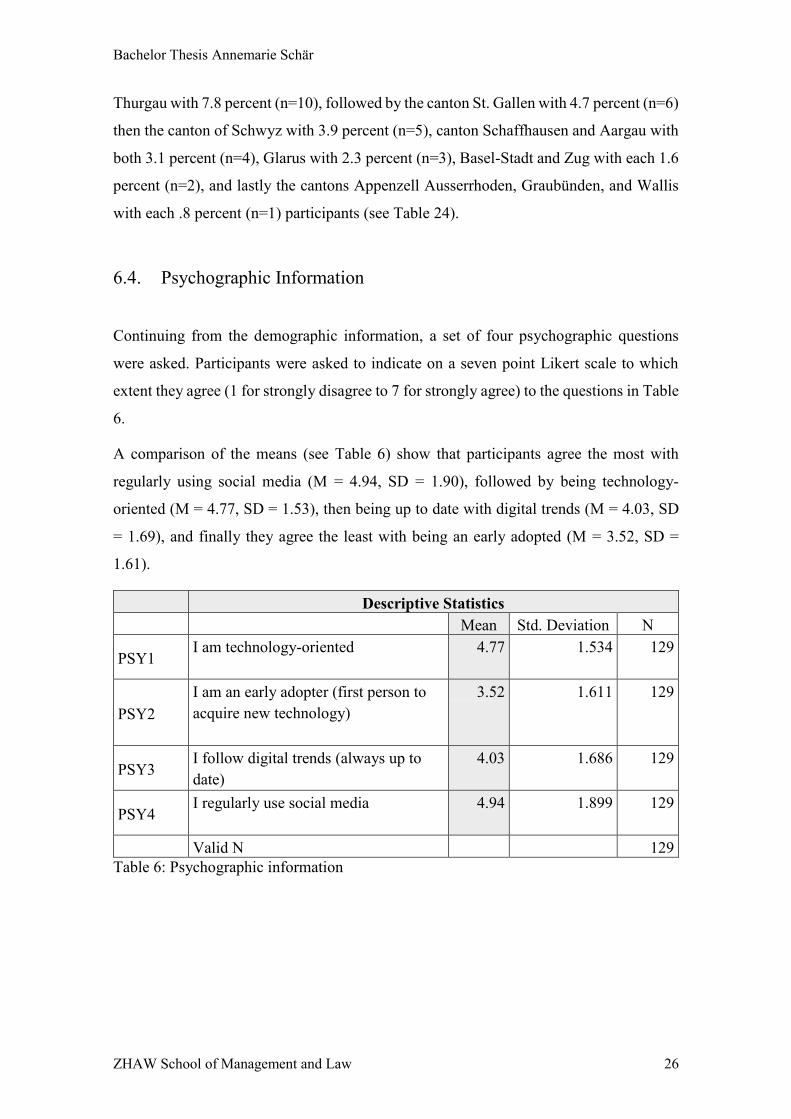
6.4. Psychographic Information
Continuing from the demographic information, a set of four psychographic questions
were asked. Participants were asked to indicate on a seven point Likert scale to which
extent they agree (1 for strongly disagree to 7 for strongly agree) to the questions in Table
6.
A comparison of the means (see Table 6) show that participants agree the most with
regularly using social media (M = 4.94, SD = 1.90), followed by being technology-
oriented (M = 4.77, SD = 1.53), then being up to date with digital trends (M = 4.03, SD
= 1.69), and finally they agree the least with being an early adopted (M = 3.52, SD =
1.61).
Descriptive Statistics
Mean Std. Deviation N
PSY1 I am technology-oriented 4.77 1.534 129
PSY2
I am an early adopter (first person to
acquire new technology)
3.52 1.611 129
PSY3 I follow digital trends (always up to
date)
4.03 1.686 129
PSY4 I regularly use social media 4.94 1.899 129
Valid N 129
Table 6: Psychographic information
Bachelor Thesis Annemarie Schär
ZHAW School of Management and Law 27
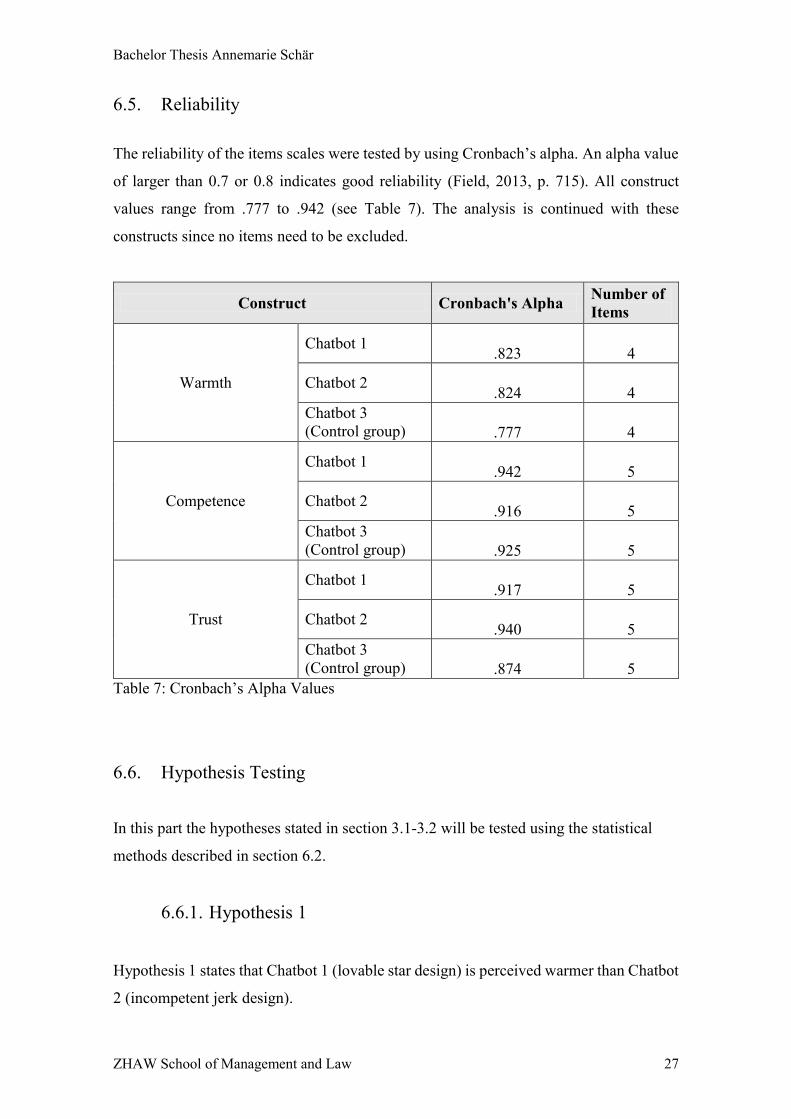
6.5. Reliability
The reliability of the items scales were tested by using Cronbach’s alpha. An alpha value
of larger than 0.7 or 0.8 indicates good reliability (Field, 2013, p. 715). All construct
values range from .777 to .942 (see Table 7). The analysis is continued with these
constructs since no items need to be excluded.
Construct Cronbach's Alpha Number of
Items
Warmth
Chatbot 1 .823 4
Chatbot 2 .824 4
Chatbot 3
(Control group) .777 4
Competence
Chatbot 1 .942 5
Chatbot 2 .916 5
Chatbot 3
(Control group) .925 5
Trust
Chatbot 1 .917 5
Chatbot 2 .940 5
Chatbot 3
(Control group) .874 5
Table 7: Cronbach’s Alpha Values
6.6. Hypothesis Testing
In this part the hypotheses stated in section 3.1-3.2 will be tested using the statistical
methods described in section 6.2.
6.6.1. Hypothesis 1
Hypothesis 1 states that Chatbot 1 (lovable star design) is perceived warmer than Chatbot
2 (incompetent jerk design).

Bachelor Thesis Annemarie Schär
ZHAW School of Management and Law 28
An independent-samples t-test (see Table 26) indicated that warmth scores were
significantly higher for Chatbot 1 (M = 4.59, SD = 1.57) than for Chatbot 2 (M = 3.13,
SD = 1.390), t (314) = 8.72, p < .001. Therefore, hypothesis number 1 is accepted.
6.6.2. Hypothesis 2
To test whether there is a significant difference between perceived competence in Chatbot
1 and 2, the same procedure used for H1 is applied for H2 test (see Table 27).
Scores on the competence scale were higher for Chatbot 1 (M = 5.01, SD = 1.45) than for
Chatbot 2 (M = 4.29, SD = 1.563), t (393) = 4.72, p < .001. As this result is significant,
hypothesis number 2 is accepted.
6.6.3. Hypothesis 3
For hypothesis number 3, an independent-samples t-test was used to examine the warmth
scores of Chatbot 1 and Chatbot 3 (Table 28).
The result showed that scores on the warmth scale were significantly higher for Chatbot
1 (M = 4.59, SD = 1.57) than for Chatbot 3 (M = 3.82, SD = 1.604), t (350) = 4.51, p <
.001). This supports hypothesis number 3, which is thus reported as accepted.
6.6.4. Hypothesis 4
Hypothesis number 4 hypothesizes that Chatbot 1 is judged as more competent than
Chatbot 3 (see Table 29).
The independent-samples t-test indicated that perceived competence was higher for
Chatbot 1 (M = 5.01, SD = 1.45) than for Chatbot 3 (M = 3.97, SD = 1.43), t (438) = 7.52,
p < .001). This shows support of hypothesis number 4, leading it to be accepted.
Bachelor Thesis Annemarie Schär
ZHAW School of Management and Law 29
6.6.5. Hypothesis 5
In order to examine the differences between the trust scores of Chatbot 1 and Chatbot 2,
an independent-samples t-test was used (see Table 30).
The result indicated that Chatbot 1 (M = 4.51, SD = 1.58), received significantly higher
trust ratings than Chatbot 2 (M = 4.15, SD = 1.59), t (393) = 2.25, p < .05). Chatbot 1 is
perceived more trustworthy and thus hypothesis number 5 is accepted.
6.6.6. Hypothesis 6
Hypothesis number 6 states that Chatbot 1 (lovable star design) is seen more trustworthy
than Chatbot 3 (simple text bot). The same t-test was used for hypothesis 6 (see Table
31).
There was no significant difference in the perceived trust of Chatbot 1 (M = 4.51, SD =
1.58) and Chatbot 3 (M = 4.43, SD = 1.30), t (438) = .599, p > .05. Therefore, hypothesis
number 6 is rejected.
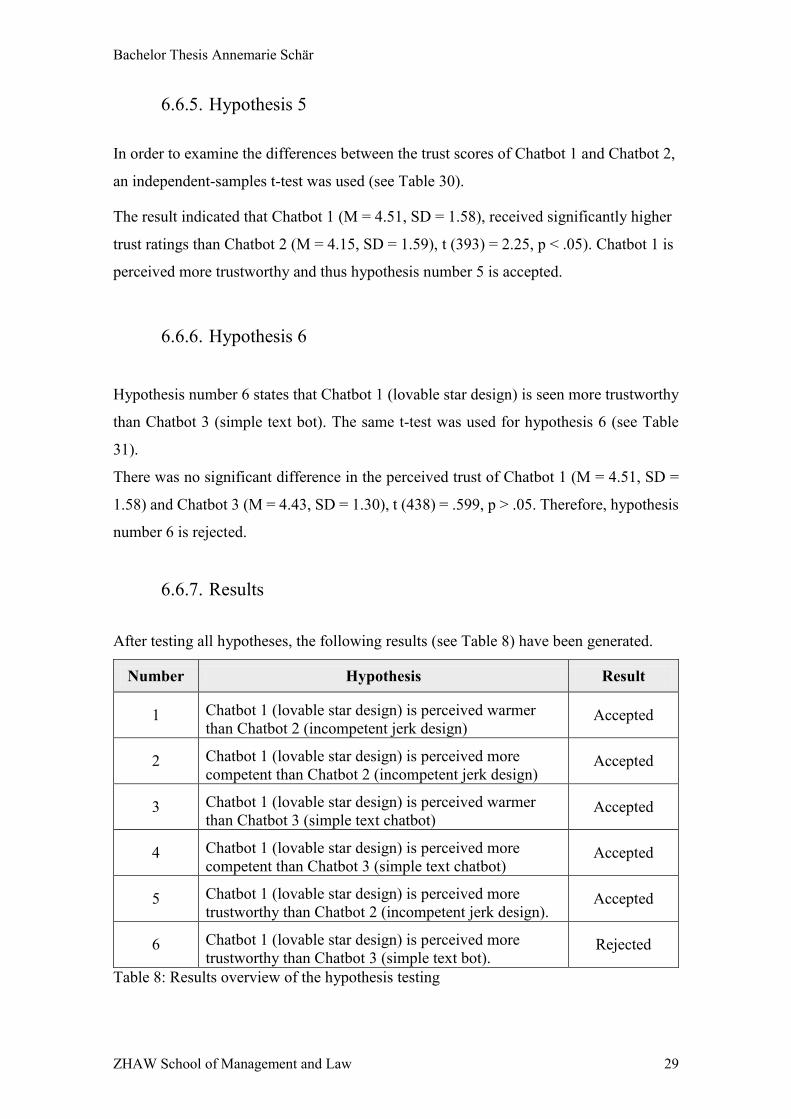
6.6.7. Results
After testing all hypotheses, the following results (see Table 8) have been generated.
Number Hypothesis Result
1 Chatbot 1 (lovable star design) is perceived warmer
than Chatbot 2 (incompetent jerk design) Accepted
2 Chatbot 1 (lovable star design) is perceived more
competent than Chatbot 2 (incompetent jerk design) Accepted
3 Chatbot 1 (lovable star design) is perceived warmer
than Chatbot 3 (simple text chatbot) Accepted
4 Chatbot 1 (lovable star design) is perceived more
competent than Chatbot 3 (simple text chatbot) Accepted
5 Chatbot 1 (lovable star design) is perceived more
trustworthy than Chatbot 2 (incompetent jerk design). Accepted
6 Chatbot 1 (lovable star design) is perceived more
trustworthy than Chatbot 3 (simple text bot). Rejected
Table 8: Results overview of the hypothesis testing

Bachelor Thesis Annemarie Schär
ZHAW School of Management and Law 30
6.7. Further Analysis
In the second part of the questionnaire, general questions about chatbots were asked. The
author grouped the questions by usage, purpose, characteristics of a chatbot (Avatar,
design, and privacy policy), sharing personal information, and reasons not to use a
chatbot. A seven point Likert scale was used for all items except for one last open ended
question. The means will be compared to analyze the data.
6.7.1. Usage
A comparison of the means (see Table 9) shows that the majority of the participants have
used/interacted with a chatbot before (M = 4.60, SD = 2.68), while some have never
used/interacted with a chatbot (M = 3.37, SD = 2.61). Only a few regularly interact with
a chatbot (M = 2.23, SD = 1.51).
When splitting the seven-point Likert scale into one bottom half (Ratings from 1-3,
strongly disagree to disagree) and one upper half (Ratings from 4-7, agree to strongly
agree), the responses can be turned into categorical data which yielded the following
results:
With 39.6 percent, participants indicated that they have never used a chatbot before.
Whereas 62.8 percent said that they have used a chatbot before, but only 23.3 percent of
the subjects regularly use a chatbot.
Descriptive Statistics
Mean Std. Deviation N
U1 I have never used a chatbot 3.37 2.610 129
U2 I have used a chatbot before 4.60 2.682 129
U3 I regularly use chatbots 2.23 1.508 129
Valid N (listwise) 129
Table 9: Comparison of means - Usage of chatbots

Bachelor Thesis Annemarie Schär
ZHAW School of Management and Law 31
6.7.2. Purpose
Looking at the means of Table 10, participants mainly use chatbots as part of a customer
support service (LiveChat) platform (M = 3.64, SD = 2.49). The second most common
usage of a chatbot is for online shopping (M = 1.81, SD = 1.51).
Descriptive Statistics
Mean Std. Deviation N
P1 Weather information 1.3178 .90125 129
P2 Online shopping 1.8140 1.51435 129
P3 Booking flights 1.6589 1.40031 129
P4 Booking hotels 1.6202 1.33577 129
P5 Insurance advice 1.6822 1.50512 129
P6 Financial aid 1.5039 1.31769 129
P7 Customer Service (LiveChat) 3.6434 2.48684 129
Valid N (listwise) 129
Table 10: Comparison of means - Reasons for using a chatbot
Other reasons indicated for using a chatbot were IT-Support, testing, social media / online
games, tourism inquiries, and planning a language stay.
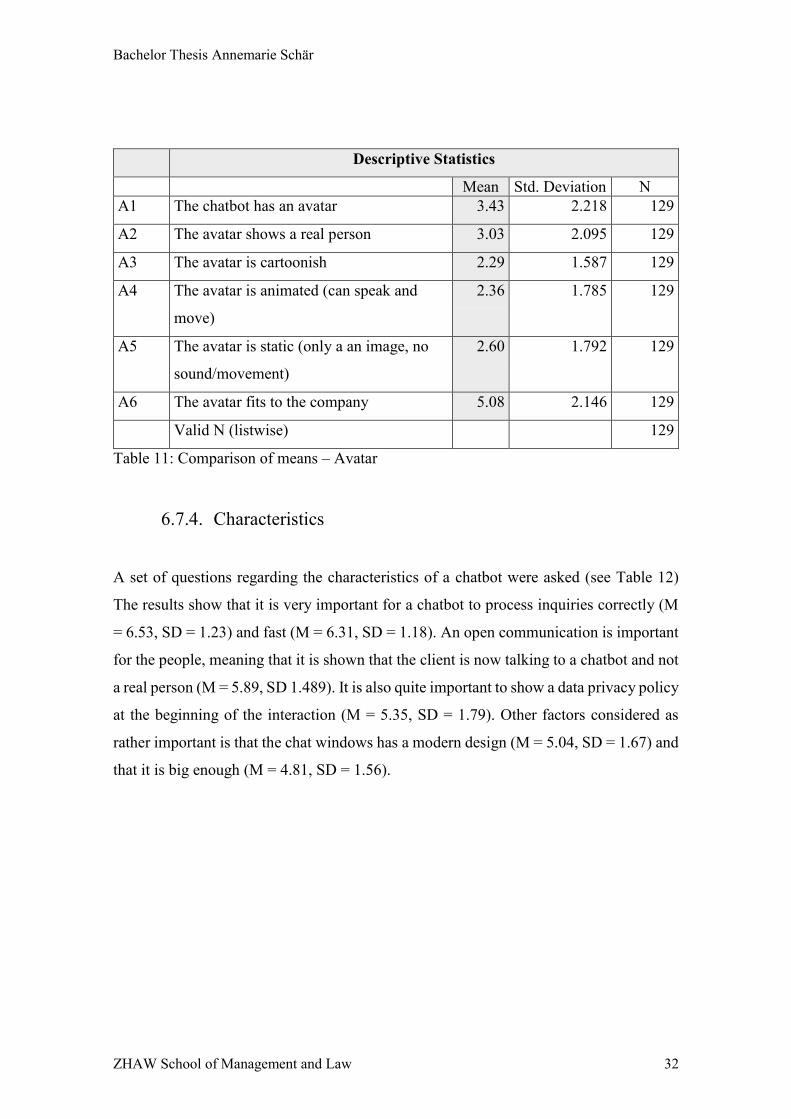
6.7.3. Avatar
The subjects were asked about the most important aspects of a chatbot avatar (see Table
11). The most important trait is that the avatar fits to the company (M = 5.08, SD = 2.15).
It is somewhat important for a chatbot to have an avatar at all (M = 3.43, SD = 2.22), but
less important that the avatar shows a real person (M = 3.03, SD = 2.10). It is rather
unimportant to show a static avatar picture (M = 2.60, SD = 1.79), be animated (M = 2.36,
SD = 1.79), or to be cartoonish (M = 2.29, SD = 1.59).
Bachelor Thesis Annemarie Schär
ZHAW School of Management and Law 32
Descriptive Statistics
Mean Std. Deviation N
A1 The chatbot has an avatar 3.43 2.218 129
A2 The avatar shows a real person 3.03 2.095 129
A3 The avatar is cartoonish 2.29 1.587 129
A4 The avatar is animated (can speak and
move)
2.36 1.785 129
A5 The avatar is static (only a an image, no
sound/movement)
2.60 1.792 129
A6 The avatar fits to the company 5.08 2.146 129
Valid N (listwise) 129
Table 11: Comparison of means – Avatar
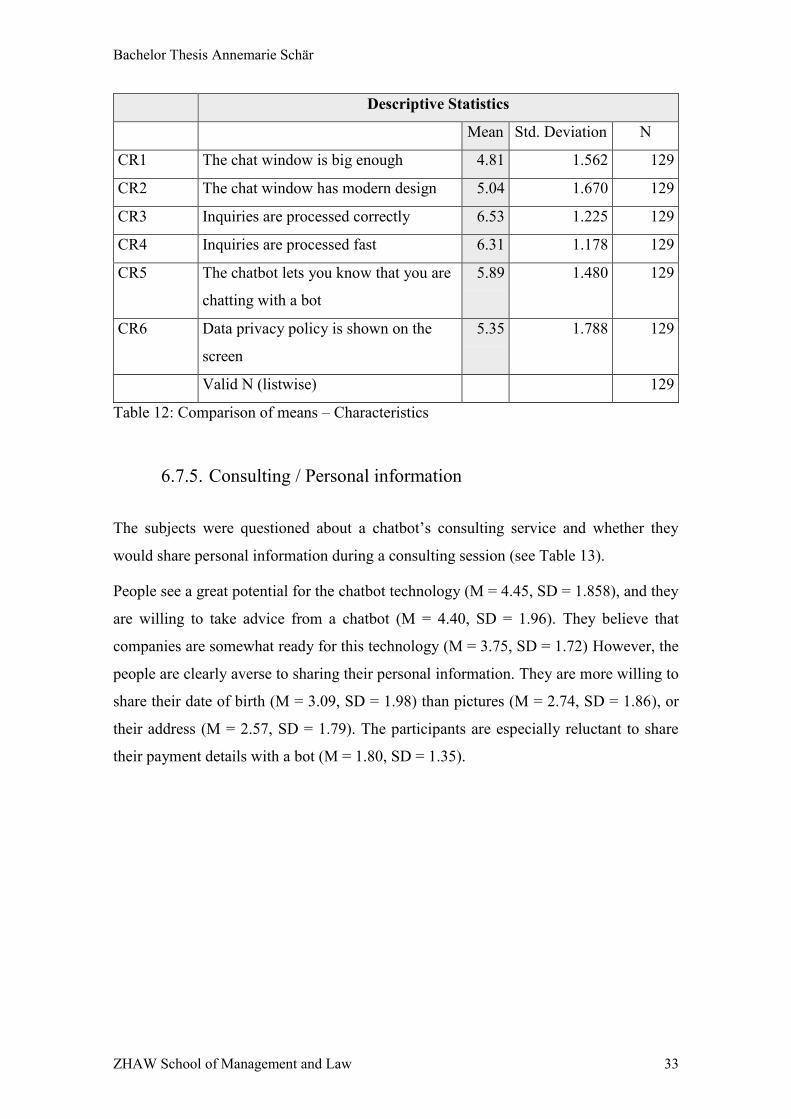
6.7.4. Characteristics
A set of questions regarding the characteristics of a chatbot were asked (see Table 12)
The results show that it is very important for a chatbot to process inquiries correctly (M
= 6.53, SD = 1.23) and fast (M = 6.31, SD = 1.18). An open communication is important
for the people, meaning that it is shown that the client is now talking to a chatbot and not
a real person (M = 5.89, SD 1.489). It is also quite important to show a data privacy policy
at the beginning of the interaction (M = 5.35, SD = 1.79). Other factors considered as
rather important is that the chat windows has a modern design (M = 5.04, SD = 1.67) and
that it is big enough (M = 4.81, SD = 1.56).
Bachelor Thesis Annemarie Schär
ZHAW School of Management and Law 33
Descriptive Statistics
Mean Std. Deviation N
CR1 The chat window is big enough 4.81 1.562 129
CR2 The chat window has modern design 5.04 1.670 129
CR3 Inquiries are processed correctly 6.53 1.225 129
CR4 Inquiries are processed fast 6.31 1.178 129
CR5 The chatbot lets you know that you are
chatting with a bot
5.89 1.480 129
CR6 Data privacy policy is shown on the
screen
5.35 1.788 129
Valid N (listwise) 129
Table 12: Comparison of means – Characteristics
6.7.5. Consulting / Personal information
The subjects were questioned about a chatbot’s consulting service and whether they
would share personal information during a consulting session (see Table 13).
People see a great potential for the chatbot technology (M = 4.45, SD = 1.858), and they
are willing to take advice from a chatbot (M = 4.40, SD = 1.96). They believe that
companies are somewhat ready for this technology (M = 3.75, SD = 1.72) However, the
people are clearly averse to sharing their personal information. They are more willing to
share their date of birth (M = 3.09, SD = 1.98) than pictures (M = 2.74, SD = 1.86), or
their address (M = 2.57, SD = 1.79). The participants are especially reluctant to share
their payment details with a bot (M = 1.80, SD = 1.35).

Bachelor Thesis Annemarie Schär
ZHAW School of Management and Law 34
Descriptive Statistics
Mean Std. Deviation N
CP1 I would take advice from a chatbot (e.g.
customer service, insurance or financial
advice, usw.).
4.40 1.958 129
CP2 I would share payment details in the chat
window
1.80 1.354 129
CP3 I would share pictures in the chat window 2.74 1.859 129
CP4 I would share address data in the chat
window
2.57 1.789 129
CP5 I would share my date of birth in the chat
window
3.09 1.978 129
CP6 I see great potential for this technology 4.45 1.858 129
CP7 Companies are ready for this technology 3.75 1.723 129
Valid N (listwise) 129
Table 13: Comparison of means – Consulting
6.7.6. Reasons not to use a chatbot
When asked about the reasons why the subjects would not use a chatbot, people reported
that they still value and prefer human contact (M = 5.35, SD = 1.72). This is followed by
the fact that people still prefer to look for information on a company’s website by
themselves (M = 4.82, SD = 1.684). A high error rate (M = 3.94, SD = 1.56) and the trust
in the technology (M = 3.61, SD = 1.69) were only moderate factors. Landing in the
middle of the scale, people indicated that they have no concerns and would take advice
from a chatbot (M = 3.5, SD = 1.82). The means are reported in Table 14.
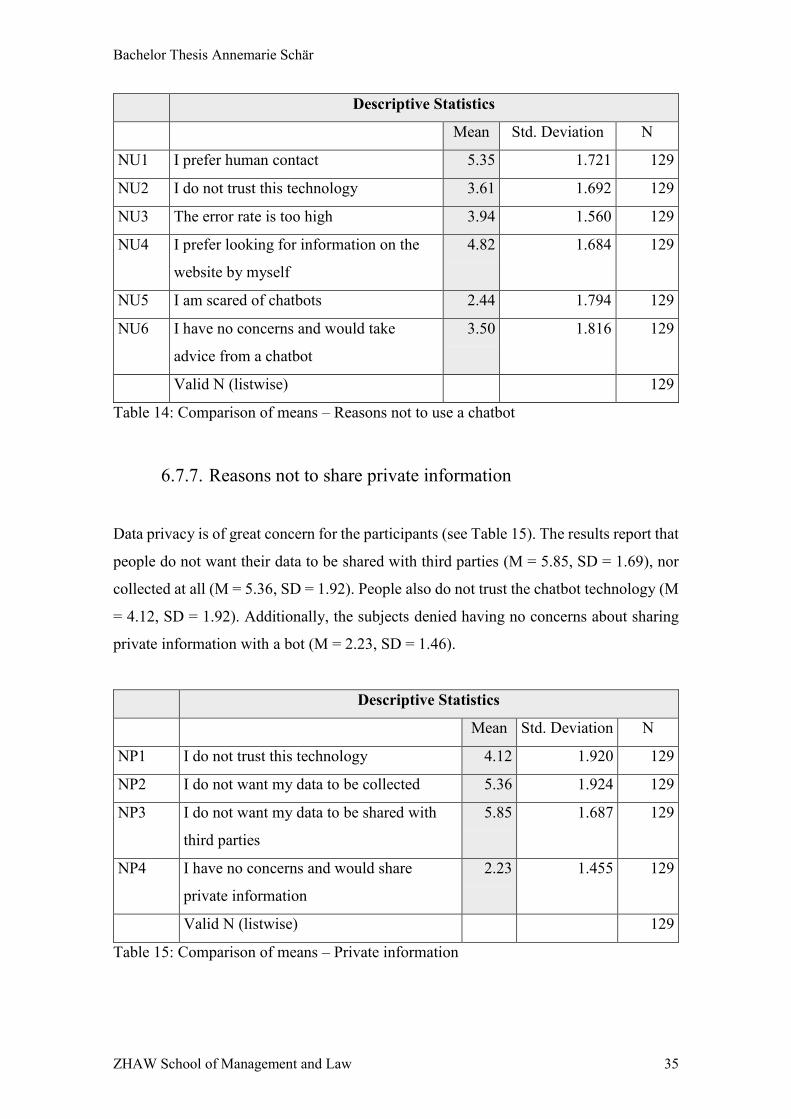
Bachelor Thesis Annemarie Schär
ZHAW School of Management and Law 35
Descriptive Statistics
Mean Std. Deviation N
NU1 I prefer human contact 5.35 1.721 129
NU2 I do not trust this technology 3.61 1.692 129
NU3 The error rate is too high 3.94 1.560 129
NU4 I prefer looking for information on the
website by myself
4.82 1.684 129
NU5 I am scared of chatbots 2.44 1.794 129
NU6 I have no concerns and would take
advice from a chatbot
3.50 1.816 129
Valid N (listwise) 129
Table 14: Comparison of means – Reasons not to use a chatbot
6.7.7. Reasons not to share private information
Data privacy is of great concern for the participants (see Table 15). The results report that
people do not want their data to be shared with third parties (M = 5.85, SD = 1.69), nor
collected at all (M = 5.36, SD = 1.92). People also do not trust the chatbot technology (M
= 4.12, SD = 1.92). Additionally, the subjects denied having no concerns about sharing
private information with a bot (M = 2.23, SD = 1.46).
Descriptive Statistics
Mean Std. Deviation N
NP1 I do not trust this technology 4.12 1.920 129
NP2 I do not want my data to be collected 5.36 1.924 129
NP3 I do not want my data to be shared with
third parties
5.85 1.687 129
NP4 I have no concerns and would share
private information
2.23 1.455 129
Valid N (listwise) 129
Table 15: Comparison of means – Private information
Bachelor Thesis Annemarie Schär
ZHAW School of Management and Law 36
6.7.8. Improving Chatbots
At the end of the questionnaire, participants were asked what companies should improve
so they would use their chatbot service more often. The question was open-ended. The
answers were categorized and ranked in the following order, starting with the most
mentioned suggestion for companies:
1. Lower error rates
2. More personalized advice
3. Faster process of inquiries
4. Open communication, reveal that you are now talking to a bot
5. Modern interface
6. Data privacy policy
The suggestions are in line with the findings in section 6.7.4., where the most important
feature of a chatbot was chosen to be the correct processing of inquiries. Additionally,
individualized advice from a chatbot is highly regarded. This personalized advice
includes the bot’s ability to answer to specific questions and coming across more personal
(No standard/robotic replies to questions).
A fast process was mentioned often, which is also one of the findings in section 6.7.4.
Moreover, transparency is important when interacting with a chatbot. People indicated
that they were frightened when a bot unexpectedly addressed the person by his/her name.
The bot should not pretend to be a real person. Furthermore, people welcome a modern
and responsive design when it comes to the chatbot technology. Lastly, data privacy is a
crucial matter, as people prefer not to have their data collected without their permission.
6.8. Correlations
To examine the relationships between the variables, several correlation analyses were
conducted in this section.
Bachelor Thesis Annemarie Schär
ZHAW School of Management and Law 37
6.8.1. Psychographic Information / Usage
The four psychographic questions were correlated with the items concerning the usage of
chatbots (see Table 32).
There is a significant negative relationship between PSY3 and U1 (r = -.316, p<0.05), as
well as a significant positive relationship between PSY3 and U2 (r = .357, p<0.05).
Furthermore, PSY4 significantly correlates with U1 (r = -.401, p<0.01), and with U2 (r =
.377, p<0.05), and also with U3 (r = .407, p<0.05).
6.8.2. Psychographic Information / Avatar
Correlations between the perception of chatbot avatars and psychographic information
were conduction to analyze the relationships between the variables (see Table 33).
The results show a significant positive relationship between PSY1 and A6 (r = .298,
p<0.05). Additionally, the variable PSY3 significantly correlates with A3 (r = .320,
p<0.05).
6.8.3. Psychographic Information / Characteristics
The characteristics items were correlated with the psychographic items A significant
relationship exists between PSY1 and CR1 (r = .312, p<0.05), as well as between PSY1
and CR2 (r = .312, p<0.05), between PSY1 and CR3 (r = .280, p<0.05), and between
PSY1 and CR5 (r = .332, p<0.05). Moreover, a high correlation between PSY3 and CR2
(r = .422, p<0.01) was detected. All correlations are illustrated in Table 34.
6.8.4. Psychographic Information / Personal Information
All correlations between psychographic questions and the questions about consulting and
sharing personal data can be seen in Table 35.
The highest significant correlations are between the items PSY2 and CP3 (r = .401,
p<0.01), PSY2 and CP6 (r = .394, p<0.01) and between the items PSY1 and CP4 (r =
.360, p<0.05).

Bachelor Thesis Annemarie Schär
ZHAW School of Management and Law 38
6.8.5. Psychographic Information / Reasons Not to Use a Chatbot
The relationship between reasons not to use a chatbot and psychographic information
were analyzed and summed up in Table 36.
A significant negative relationship exists between the variables PSY3 and NU2 (r = -.378,
p<0.01) and between the items PSY2 and NU2 (r = -.339, p<0.05). In addition, PSY1
correlates with NU6 (r = .340, p<0.05).
6.8.6. Psychographic Information / Reasons Not to Share
Information
Finally, the psychographic items were correlated with reasons not to share private
information (Table 37).
There is a significant negative correlation between PSY2 and NP1 (r = -.390, p<0.01) and
a significant positive relationship between PSY3 and NP1 (r = -.299, p<0.05).

Bachelor Thesis Annemarie Schär
ZHAW School of Management and Law 39
7. Discussion
This part shows an overview of the results found in the data analysis part in section 6. It
discusses and interprets the findings of this study.
7.1. Discussion of Hypotheses H1 to H6
The results show that Chatbot 1 (Lovable star design) is perceived significantly warmer
than Chatbot 2 (Incompetent jerk design), as well as Chatbot 3 (Simple text bot as a
control). Furthermore, Chatbot 1 is also rated more competent than Chatbot 2 and Chatbot
3, since the outcome displayed a statistically significant difference between the perceived
competences. Consequently, the hypotheses H1 to H4 have all been accepted. Hypothesis
H5 was accepted, as Chatbot 1 is seen as more trustworthy than Chatbot 2. However,
hypothesis H6 is rejected since there was no significant difference between the trust
scores of Chatbot 1 and Chatbot 3.
Despite hypothesis H6 being rejected, the participants were still able to successfully judge
the chatbots on the dimensions warmth and competence (Casciaro & Sousa Lobo, 2005;
Fiske et al., 2007), which is suggested through the acceptance of hypotheses H1 to H4.
The rejection of hypothesis H6 may be explained by a lack of transparency. The findings
of this study show that open communication by a bot is important (M = 5.89). If the
participants are not certain whether they are talking to a bot or a real human (Chatbot 1
showed a real person as avatar), it may negatively impact their trust towards the
technology/company.
Another explanation would be that the participants experienced the “uncanny valley
effect” with Chatbot 1, which negatively affects trust. This reason is in line with a study
that showed how a simpler text chatbot is perceived as less uncanny than a more complex
chatbot (Ciechanowski et al., 2018, p. 1). Modelling an avatar with a less realistic face
can decrease the uncanny valley effect (Meadows, 2017). However, it should be noted
that the uncanny effect is associated with appearance and movements of a robot, whereas
in this study a disembodied chatbot with static avatar was used.
Bachelor Thesis Annemarie Schär
ZHAW School of Management and Law 40
7.2. Discussion of the General Questions
The findings report that 62.8 percent of the people have used a chatbot before, however,
only 23.3 percent regularly use a bot. This shows how the chatbot technology has not yet
reached a widespread adoption. Additionally, the chatbots used are mostly in connection
with a customer live chat service provided by a company. Other types of chatbots are not
quite known nor utilized, such as bots for insurance and financial advice or for booking
flights/hotels.
Moreover, the results show that it is important to have a chatbot avatar that suits the
company’s image (M = 5.08). This result is in accordance to another study which found
that an online avatar should accurately reflect a firm’s corporate identity in order to
enhance the perception of the website’s quality (Etemad-Sajadi & Ghachem, 2015, p. 85).
Having an avatar at all is rather unimportant to the subjects (M = 3.43), and it is even
slightly less important that the avatar shows a real person (M = 3.03).
According to the questionnaire’s responses, the two most important characteristics a
chatbot should have is the correct and fast processing of a customer’s inquiry. A recent
survey conducted in the USA had similar results where 30 percent of the respondents
worry about the chatbot making a mistake and 75 percent of the people expect an
immediate response from a bot (Devaney, 2018).
Generally, the participants have a positive attitude towards taking advice from a bot and
they see a great potential for this technology in the future. However, they are opposed to
sharing personal information with a bot, especially when it comes to payment details.
While chatbots have existed for some time, they are still new to many consumers and
recent cybercrime activities around the world have raised concerns about data privacy.
The findings of this study reveal that people do not want their data to be collected or
shared with others.
Furthermore, the subjects still prefer human contact over a bot and they prefer looking
for information on the website themselves. The survey results from Devaney (2018) also
showed that people prefer dealing with a real-life assistant (43 percent) and they favor
using a normal website (26 percent).
Bachelor Thesis Annemarie Schär
ZHAW School of Management and Law 41
7.3. Discussion of the Correlations
There is a negative correlation between PSY4 and U1, as well as a positive correlation
between PSY3 and U2. This suggests that people who indicated using social media
regularly and people who follow digital trends, are more likely to have interacted with a
chatbot before. Additionally, those who follow digital trends are more likely to appreciate
a cartoon-ish looking chatbot avatar. This can be explained by the fact that a cartoon-ish
avatar is more modern and appeals to people with a digital mindset. A correlation between
PSY3 and CR2 also shows a preference of a modern chat window design by participants
who follow digital trends.
A positive correlation exists between being an early adopter of technology (PSY2) and
sharing pictures with a chatbot (CP3). PSY2 also correlates with CP6, which means early
adopters are more open to the chatbot technology.
The variables PSY3 and NU2 negatively correlate, suggesting that people who follow
digital trends, are more inclined to trust chatbots. The items PSY2 and NP1 also correlate,
which implies that early adopters tend to have more faith in the chatbot technology.
Importantly, while some correlations were significant, they did not exceed a value of -.5
or .5. These numbers implicate rather low correlations and therefore the results should be
treated with caution – using them only as a pointer in the right direction.
7.4. Conclusion and Implications for Practice
The aim of this Bachelor thesis is to find out whether the SCM theory can be applied to
the domain of chatbots. Stimulus material in the form of chatbot avatar pictures were
chosen and implemented into an online experiment/questionnaire with three experimental
groups, including one control group.
Hypotheses H1 to H4 all postulate that Chatbot 1, which is designed as a “lovable star”
(highly warm and competent), is perceived warmer and more competent than Chatbot 2
and Chatbot 3. As opposed to Chatbot 1, Chatbot 2 is designed as “incompetent jerk”
(incompetent and cold), while Chatbot 3 is a simple text chatbot (control variable). The
results revealed that Chatbot 1 was rated significantly warmer and more competent than
Chatbot 2 and Chatbot 3.
Bachelor Thesis Annemarie Schär
ZHAW School of Management and Law 42
Moreover, past studies have shown that warmth and competence positively affect trust.
This statement is only partially confirmed with the acceptance of hypothesis H5, where
Chatbot 1 received significantly higher trust scores than Chatbot 2. Hypothesis H6 on the
other hand was rejected, as Chatbot 1 was not perceived as significantly more trustworthy
than Chatbot 3.
In conclusion, with the acceptance of the hypotheses H1 to H4, this study suggests that
the SCM principle can be applied to the domain of chatbots. Should a company decide to
launch a chatbot with avatar, it is therefore recommended to model their avatars as
“lovable stars”, as they are seen as highly warm and competent. However, with regard to
the rejected hypothesis number 6, it is suggested for businesses to be upfront about their
chatbot technology. Consumers want to know that they are talking to a chatbot and not a
real human. In order to avoid the uncanny valley effect, it is recommended to use a less
realistic, cartoon-like avatar as a modern approach.
The findings further reveal that an avatar should suit the company’s image and corporate
identity. Firms should aim to reduce the chatbot’s failure rates, enable a fast processing
of inquiries and offer more personalized consulting sessions. The participants do not
appreciate standardized responses. In addition, data privacy is an important matter for the
subjects. They are averse to sharing personal information and the collection of their data.
Companies should therefore be cautious about asking their clients for sensitive
information, particularly when it comes to payment details.
To summarize, this study is the first to investigate whether the SCM theory can be
transferred to the context of text-based chatbots/converstational agents. Based on the
findings, the author claims that it is possible to apply the SCM to the domain of chatbots.
As a result, this thesis contributes to closing the research gap in this field. It is a small
step to improving human-computer communication by displaying highly warm and
competent chatbots. Future research will have to focus on the trust aspects of a chatbot,
as the “lovable star” chatbot was not seen as significantly more trustworthy than the
simpler text chatbot.
Bachelor Thesis Annemarie Schär
ZHAW School of Management and Law 43
8. Limitations
For this web-experiment, Casciaro and Sousa-Lobo's (2005) model was used as a basis
for the chatbot designs. However, only two of the four quadrants were considered in this
research. Further studies in the area of chatbots/conversational agents need to be made
with regard to the two other quadrants “competent jerk” and “lovable fool”. Additionally,
this Bachelor thesis only focuses on the appearance of a chatbot. The explicit content
(text) and the tonality of a bot were not examined.
Furthermore, it should be noted the participants were not able to actually interact with a
chatbot, instead, they were exposed to screenshots of a conversation with a bot. The
missing interaction could be an important factor for future studies to consider. Another
aspect to point out is that the majority of subjects who took part in the
experiment/questionnaire are part-time students with jobs, residing in the canton of
Zurich.

Bachelor Thesis Annemarie Schär
ZHAW School of Management and Law 44
9. References
Aaker, D. A., Kumar, V., Leone, R., & Day, G. S. (2013). Marketing Research, 11th
Edition.
Aaker, J., Vohs, K. D., & Mogilner, C. (2010). Nonprofits Are Seen as Warm and For-
Profits as Competent: Firm Stereotypes Matter. Journal of Consumer Research,
37(2), 224–237. https://doi.org/10.1086/651566
Aaker, J. L., Garbinsky, E. N., & Vohs, K. D. (2012). Cultivating admiration in brands:
Warmth, competence, and landing in the “golden quadrant”. Journal of Consumer
Psychology, 22(2), 191–194. https://doi.org/10.1016/j.jcps.2011.11.012
Ambady, N., Krabbenhoft, M. A., & Hogan, D. (2006). The 30-Sec Sale: Using Thin-
Slice Judgments to Evaluate Sales Effectiveness. Journal of Consumer Psychology,
16(1), 4–13. https://doi.org/10.1207/s15327663jcp1601_2
Araujo, T. (2018). Living up to the chatbot hype: The influence of anthropomorphic
design cues and communicative agency framing on conversational agent and
company perceptions. Computers in Human Behavior. Advance online publication.
https://doi.org/10.1016/j.chb.2018.03.051
Arndt, A., Evans, K., Landry, T. D., Mady, S., & Pongpatipat, C. (2014). The impact of
salesperson credibility-building statements on later stages of the sales encounter.
Journal of Personal Selling & Sales Management, 34(1), 19–32.
https://doi.org/10.1080/08853134.2013.870182
Bartneck, C, Kanda, T, Ishiguro, H,. . . N. (2007). Is The Uncanny Valley An Uncanny
Cliff?
Boutin, P. (2017). Does a Bot Need Natural Language Processing? – Chatbots
Magazine. Retrieved from https://chatbotsmagazine.com/does-a-bot-need-natural-
language-processing-c2f76ab7ef11
Briñol, P., Petty, R. E., & Wagner, B. (2009). Body posture effects on self-evaluation:
A self-validation approach. European Journal of Social Psychology, 39(6), 1053–
1064. https://doi.org/10.1002/ejsp.607
Business Insider. (2016). 80% of businesses want chatbots by 2020. Retrieved from
http://www.businessinsider.com/80-of-businesses-want-chatbots-by-2020-2016-12
Bachelor Thesis Annemarie Schär
ZHAW School of Management and Law 45
Carney, D. R., Cuddy, A. J. C., & Yap, A. J. (2010). Power posing: brief nonverbal
displays affect neuroendocrine levels and risk tolerance. Psychological Science,
21(10), 1363–1368. https://doi.org/10.1177/0956797610383437
Casciaro, T., & Sousa Lobo, M. (2005). Competent Jerks, Lovable Fools, and the
Formation of Social Networks.
Ciechanowski, L., Przegalinska, A., Magnuski, M., & Gloor, P. (2018). In the shades of
the uncanny valley: An experimental study of human–chatbot interaction. Future
Generation Computer Systems. Advance online publication.
https://doi.org/10.1016/j.future.2018.01.055
Corritore, C. L., Kracher, B., & Wiedenbeck, S. (2003). On-line trust: concepts,
evolving themes, a model. International Journal of Human-Computer Studies, 58(6),
737–758. https://doi.org/10.1016/S1071-5819(03)00041-7
Cuddy, A. (2012). Your body language may shape who you are. Retrieved from
https://www.ted.com/talks/amy_cuddy_your_body_language_shapes_who_you_are
Cuddy, A. J. C., Wilmuth, C. A., Yap, A. J., & Carney, D. R. (2015). Preparatory power
posing affects nonverbal presence and job interview performance. The Journal of
Applied Psychology, 100(4), 1286–1295. https://doi.org/10.1037/a0038543
Cuddy, A. J.C., Fiske, S. T., & Glick, P. (2008). Warmth and Competence as Universal
Dimensions of Social Perception: The Stereotype Content Model and the BIAS Map.
In Advances in Experimental Social Psychology (pp. 61–149). Academic Press.
https://doi.org/10.1016/S0065-2601(07)00002-0
Cuddy, A. J.C., Glick, P., & Beninger, A. (2011). The dynamics of warmth and
competence judgments, and their outcomes in organizations. Research in
Organizational Behavior, 31, 73–98. https://doi.org/10.1016/j.riob.2011.10.004
DALE, R. (2016). The return of the chatbots. Natural Language Engineering, 22(05),
811–817. https://doi.org/10.1017/S1351324916000243
Devaney, E. (2018). The 2018 State of Chatbots Report: How Chatbots Are Reshaping
Online Experiences | Drift Blog. Retrieved from https://blog.drift.com/chatbots-
report/
Diamantopoulos, A., Sarstedt, M., Fuchs, C., Wilczynski, P., & Kaiser, S. (2012).
Guidelines for choosing between multi-item and single-item scales for construct

Bachelor Thesis Annemarie Schär
ZHAW School of Management and Law 46
measurement: a predictive validity perspective. Journal of the Academy of Marketing
Science, 40(3), 434–449. https://doi.org/10.1007/s11747-011-0300-3
Dillet, R. (2018). Microsoft overhauls its conversational AI chatbot tools. Retrieved
from https://techcrunch.com/2018/05/07/microsoft-overhauls-its-conversational-ai-
chatbot-tools/
Ekman, P. (2015). 5 Signs of Lying - Paul Ekman Group, LLC. Retrieved from
https://www.paulekman.com/facial-expressions/signs-of-lying/
Etemad-Sajadi, R., & Ghachem, L. (2015). The impact of hedonic and utilitarian value
of online avatars on e-service quality. Computers in Human Behavior, 52, 81–86.
https://doi.org/10.1016/j.chb.2015.05.048
Eunson, B. (2013). Nonverbal Communication.
Field, A. (2013). Discovering Statistics Using IBM SPSS Statistics: SAGE Publications.
Retrieved from https://books.google.ch/books?id=srb0a9fmMEoC
Fiske, S. T., Cuddy, A. J. C., & Glick, P. (2007). Universal dimensions of social
cognition: warmth and competence. Trends in Cognitive Sciences, 11(2), 77–83.
https://doi.org/10.1016/j.tics.2006.11.005
Fiske, S. T., Cuddy, A. J. C., Glick, P., & Xu, J. (2002). A model of (often mixed)
stereotype content: Competence and warmth respectively follow from perceived
status and competition. Journal of Personality and Social Psychology, 82(6), 878–
902. https://doi.org/10.1037//0022-3514.82.6.878
Fiske, S. T., & Dupree, C. (2014). Gaining trust as well as respect in communicating to
motivated audiences about science topics. Proceedings of the National Academy of
Sciences of the United States of America, 111 Suppl 4, 13593–13597.
https://doi.org/10.1073/pnas.1317505111
Foye, L. (2017). Chatbot Conversations to deliver $8 billion in Cost savings by 2022.
Retrieved from https://www.juniperresearch.com/analystxpress/july-2017/chatbot-
conversations-to-deliver-8bn-cost-saving
Gartner. (2018). Gartner Says 25 Percent of Customer Service Operations Will Use
Virtual Customer Assistants by 2020. Retrieved from
https://www.gartner.com/newsroom/id/3858564
Gefen, D. (2000). E-commerce: the role of familiarity and trust. Omega, 28(6), 725–
737. https://doi.org/10.1016/S0305-0483(00)00021-9

Bachelor Thesis Annemarie Schär
ZHAW School of Management and Law 47
Gurney, D. J., Howlett, N., Pine, K., Tracey, M., & Moggridge, R. (2017). Dressing up
posture: The interactive effects of posture and clothing on competency judgements.
British Journal of Psychology (London, England : 1953), 108(2), 436–451.
https://doi.org/10.1111/bjop.12209
Hargie, O. (2003). Skilled Interpersonal Communication: Research, Theory and
Practice: Taylor & Francis. Retrieved from
https://books.google.ch/books?id=11vMyya6NxQC
Hess, T., Fuller, M., & Campbell, D. (2009). Designing Interfaces with Social Presence:
Using Vividness and Extraversion to Create Social Recommendation Agents.
Journal of the Association for Information Systems, 10(12), 889–919.
https://doi.org/10.17705/1jais.00216
Hirschberg, J., & D. Manning, C. (2015). Advances in natural language processing.
Hopping, C. (2018). 80% of customers don't trust chatbots for aftersales advice.
Retrieved from http://www.itpro.co.uk/machine-learning/30606/80-of-customers-
dont-trust-chatbots-for-aftersales-advice
ISPR. (2009). Presence defined. Retrieved from http://ispr.info/about-presence-2/about-
presence/
Johnson, K. (2017). Facebook Messenger hits 100,000 bots. Retrieved from
https://venturebeat.com/2017/04/18/facebook-messenger-hits-100000-bots/
Knight, W. (2016). How to Prevent a Plague of Dumb Chatbots. Retrieved from
https://www.technologyreview.com/s/601279/how-to-prevent-a-plague-of-dumb-
chatbots/
Kuss, A. (2012). Marktforschung: Grundlagen der Datenerhebung und Datenanalyse.
Lakin, J., Jefferis, V., Cheng, C. M., & Chartrand, T. (2003). The Chameleon Effect as
Social Glue: Evidence for the Evolutionary Significance of Nonconscious Mimicry.
Lee, E. H., & Schnall, S. (2014). The influence of social power on weight perception.
Journal of Experimental Psychology. General, 143(4), 1719–1725.
https://doi.org/10.1037/a0035699
Lee, K. M. (2004). Presence, Explicated. Communication Theory, 14(1), 27–50.
https://doi.org/10.1093/ct/14.1.27
Bachelor Thesis Annemarie Schär
ZHAW School of Management and Law 48
Lombard, M., & Ditton, T. (1997). At the Heart of It All: The Concept of Presence.
Journal of Computer-Mediated Communication, 3(2). https://doi.org/10.1111/j.1083-
6101.1997.tb00072.x
Lu, B., Fan, W., & Zhou, M. (2016). Social presence, trust, and social commerce
purchase intention: An empirical research. Computers in Human Behavior, 56, 225–
237. https://doi.org/10.1016/j.chb.2015.11.057
Martin, D. (2014). Towards a model of trust. Journal of Business Strategy, 35(4), 45–
51. https://doi.org/10.1108/JBS-05-2014-0053
Mayer, R., Davis, J., & Schoorman, D. (1995). An Integrative Model of Organizational
Trust.
McTear, M., Callejas, Z., & Griol, D. (2016). The Conversational Interface: Talking to
Smart Devices.
Meadows, M. S. (2017). Artificial Intelligence & Artificial Trust – Chatbots Magazine.
Retrieved from https://chatbotsmagazine.com/artificial-intelligence-artificial-trust-
5e01d32ae39a
Mehabian, A. (1981). Silent messages: Implicit communication of emotions and
attitudes (2d ed.). Belmont: Wadsworth.
Morris, T. L., Gorham, J., Cohen, S. H., & Huffman, D. (1996). Fashion in the
classroom: Effects of attire on student perceptions of instructors in college classes.
Communication Education, 45(2), 135–148.
https://doi.org/10.1080/03634529609379043
Mumford, C. L., & Jain, L. C. (Eds.). (2009). Intelligent systems reference library: Vol.
1. Computational Intelligence: Collaboration, Fusion and Emergence. Berlin,
Heidelberg: Springer. Retrieved from
http://site.ebrary.com/lib/alltitles/docDetail.action?docID=10317580
Oatley, K. (1992). Human Emotions: Function And Dysfunction. Annual Review of
Psychology, 43(1), 55–85. https://doi.org/10.1146/annurev.psych.43.1.55
Orlowski, A. (2017). Facebook scales back AI flagship after chatbots hit 70% f-AI-lure
rate. Retrieved from https://www.theregister.co.uk/2017/02/22/facebook_ai_fail/
Pandorabots, & Inc. (2018). Pandorabots: Home. Retrieved from
https://home.pandorabots.com/en/

Bachelor Thesis Annemarie Schär
ZHAW School of Management and Law 49
Pereira, M. J., Coheur, L., Fialho, P., & Ribeiro, R. (2016). Chatbots' Greetings to
Human-Computer Communication. Retrieved from
http://arxiv.org/pdf/1609.06479v1
Rousseau, D. M., Sitkin, S. B., Burt, R. S., & Camerer, C. (1998). Not So Different
After All: A Cross-Discipline View Of Trust. Academy of Management Review,
23(3), 393–404. https://doi.org/10.5465/amr.1998.926617
Russell, J. A. (1995). Facial expressions of emotion: What lies beyond minimal
universality? Psychological Bulletin, 118(3), 379–391. https://doi.org/10.1037//0033-
2909.118.3.379
Seiler, R., Hari, J., & Kavci, S. (2015). Changing the warmth and competence
dimensions: Experimental validation in the context of insurance consultants.
Seiler, R., Hari, J., & Kavci, S. (2016). Warmth and Competence in Crowdfunding
Final.
Sheppard, B., & Sherman, D. (1998). The Grammars of Trust: A Model and General
Implications.
Urbaniak, A. (2005). Nonverbal Communication. Retrieved from
http://prospectingprofessor.blogs.com/prospecting_professor/2005/06/nonverbal_co
mmu.html
Walterbusch, M., Gräuler, M., & Teuteberg, F. (2014). How Trust is Defined: A
Qualitative and Quantitative Analysis of Scientific Literature.
Willis, J., & Todorov, A. (2006). First Impressions: Make up your mind after a 100-Ms
exposure to a face. In Better Game Characters by Design (pp. 1–4). Elsevier.
https://doi.org/10.1016/B978-1-55860-921-1.50008-9
Wojciszke, B., Bazinska, R., & Jaworski, M. (1998). On the Dominance of Moral
Categories in Impression Formation. Personality and Social Psychology Bulletin,
24(12), 1251–1263. https://doi.org/10.1177/01461672982412001
Wood, J. A., Boles, J. S., & Babin, B. J. (2008). The Formation of Buyer's Trust of the
Seller in an Initial Sales Encounter. The Journal of Marketing Theory and Practice,
16(1), 27–39. https://doi.org/10.2753/MTP1069-6679160102
Xu, H., Leung, A., & Yan, R.-N. T. (2013). It is nice to be important, but it is more
important to be nice: Country-of-origin's perceived warmth in product failures.
Journal of Consumer Behaviour, 12(4), 285–292. https://doi.org/10.1002/cb.1419
Bachelor Thesis Annemarie Schär
ZHAW School of Management and Law 50
Xu, K., & Lombard, M. (2017). Persuasive computing: Feeling peer pressure from
multiple computer agents. Computers in Human Behavior, 74, 152–162.
https://doi.org/10.1016/j.chb.2017.04.043

Bachelor Thesis Annemarie Schär
ZHAW School of Management and Law 51
10. Appendices
10.1. Questionnaire
ID Question/Scale Source
DEM1 How old are you? Own item
DEM2 What is your gender? Own item
DEM3 Marital status Own item
DEM4 Highest level of education Own item
DEM5 Occupation Own item
DEM6 Please indicate your workload Own item
DEM7 Please indicate your postal code Own item
DEM8 Please indicate the canton you live in Own item
PSY1 I am technology-oriented Own item
PSY2 I am an early adopter (first person to
acquire new technology)
Own item
PSY3 I follow digital trends (always up to date) Own item
PSY4 I regularly use social media Own item
W1 Dislikable - Likable Reinhard, Messner and
Sporer (2006, p. 254)
W2 Unfriendly – Friendly Reinhard, Messner and
Sporer (2006, p. 254)
W3 Awful – Nice Reinhard, Messner and
Sporer (2006, p. 254)
W4 Unkind - Kind Reinhard, Messner and
Sporer (2006, p. 254)
C1 Inexpert – Expert Reinhard, Messner and
Sporer (2006, p. 254)
C2 Inexperience – Experienced Reinhard, Messner and
Sporer (2006, p. 254)
C3 Unknowledgeable – Knowledgeable Reinhard, Messner and
Sporer (2006, p. 254)
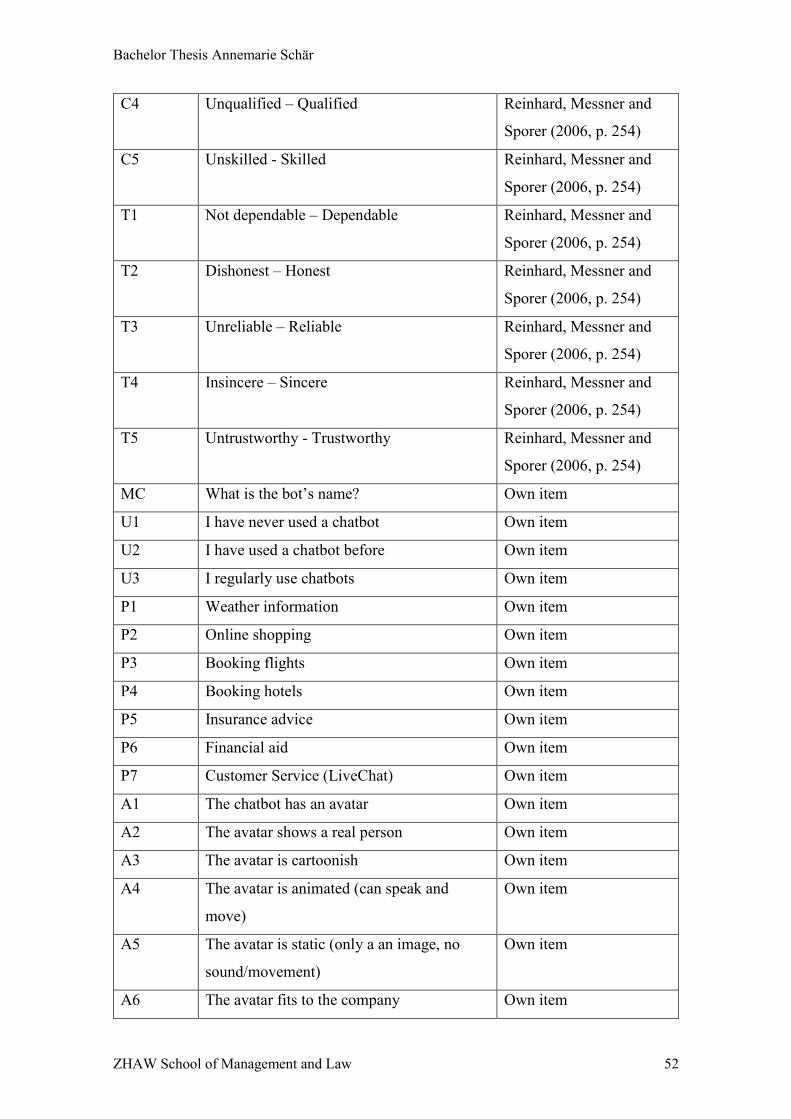
Bachelor Thesis Annemarie Schär
ZHAW School of Management and Law 52
C4 Unqualified – Qualified Reinhard, Messner and
Sporer (2006, p. 254)
C5 Unskilled - Skilled Reinhard, Messner and
Sporer (2006, p. 254)
T1 Not dependable – Dependable Reinhard, Messner and
Sporer (2006, p. 254)
T2 Dishonest – Honest Reinhard, Messner and
Sporer (2006, p. 254)
T3 Unreliable – Reliable Reinhard, Messner and
Sporer (2006, p. 254)
T4 Insincere – Sincere Reinhard, Messner and
Sporer (2006, p. 254)
T5 Untrustworthy - Trustworthy Reinhard, Messner and
Sporer (2006, p. 254)
MC What is the bot’s name? Own item
U1 I have never used a chatbot Own item
U2 I have used a chatbot before Own item
U3 I regularly use chatbots Own item
P1 Weather information Own item
P2 Online shopping Own item
P3 Booking flights Own item
P4 Booking hotels Own item
P5 Insurance advice Own item
P6 Financial aid Own item
P7 Customer Service (LiveChat) Own item
A1 The chatbot has an avatar Own item
A2 The avatar shows a real person Own item
A3 The avatar is cartoonish Own item
A4 The avatar is animated (can speak and
move)
Own item
A5 The avatar is static (only a an image, no
sound/movement)
Own item
A6 The avatar fits to the company Own item

Bachelor Thesis Annemarie Schär
ZHAW School of Management and Law 53
CR1 The chat window is big enough Own item
CR2 The chat window has modern design Own item
CR3 Inquiries are processed correctly Own item
CR4 Inquiries are processed fast Own item
CR5 The chatbot lets you know that you are
chatting with a bot
Own item
CR6 Data privacy policy is shown on the screen Own item
CP1 I would take advice from a chatbot (e.g.
customer service, insurance or financial
advice, usw.).
Own item
CP2 I would share payment details in the chat
window
Own item
CP3 I would share pictures in the chat window Own item
CP4 I would share address data in the chat
window
Own item
CP5 I would share my date of birth in the chat
window
Own item
CP6 I see great potential for this technology Own item
CP7 Companies are ready for this technology Own item
NU1 I prefer human contact Own item
NU2 I do not trust this technology Own item
NU3 The error rate is too high Own item
NU4 I prefer looking for information on the
website by myself
Own item
NU5 I am scared of chatbots Own item
NU6 I have no concerns and would take advice
from a chatbot
Own item
NP1 I do not trust this technology Own item
NP2 I do not want my data to be collected Own item
NP3 I do not want my data to be shared with
third parties
Own item
NP4 I have no concerns and would share private
information
Own item

Bachelor Thesis Annemarie Schär
ZHAW School of Management and Law 54
IMP What do companies have to improve with
the chatbot technology, in order for you to
use it more often? (E.g. lower failure rate,
faster service, personalized advice)
Own item
Table 16: All Questionnaire Items in English
ID Question/Scale in German Source
DEM1 Wie alt sind Sie? Own item
DEM2 Bitte geben Sie Ihr Geschlecht an. Own item
DEM3 Familienstand Own item
DEM4 Was ist Ihr höchster Bildungsabschluss? Own item
DEM5 Berufstätigkeit Own item
DEM6 Bitte geben Sie Ihr Arbeitspensum an. Own item
DEM7 Bitte geben Sie Ihre Postleitzahl an
(Wohnort)
Own item
DEM8 Bitte wählen Sie Ihren Wohnkanton aus. Own item
PSY1 Ich bin technikaffin Own item
PSY2 Ich bin ein Early Adopter (Nutzer, die als
erste neue technische Errungenschaften
erwerben)
Own item
PSY3 Ich verfolge digitale Trends (immer auf
dem laufenden sein)
Own item
PSY4 Ich benutze regelmässig Social Media Own item
W1 Unsympathisch - Sympathisch Reinhard, Messner and
Sporer (2006, p. 254)
W2 Unfreundlich - Freundlich Reinhard, Messner and
Sporer (2006, p. 254)
W3 Gemein - Nett Reinhard, Messner and
Sporer (2006, p. 254)
W4 Lieblos - Lieb Reinhard, Messner and
Sporer (2006, p. 254)
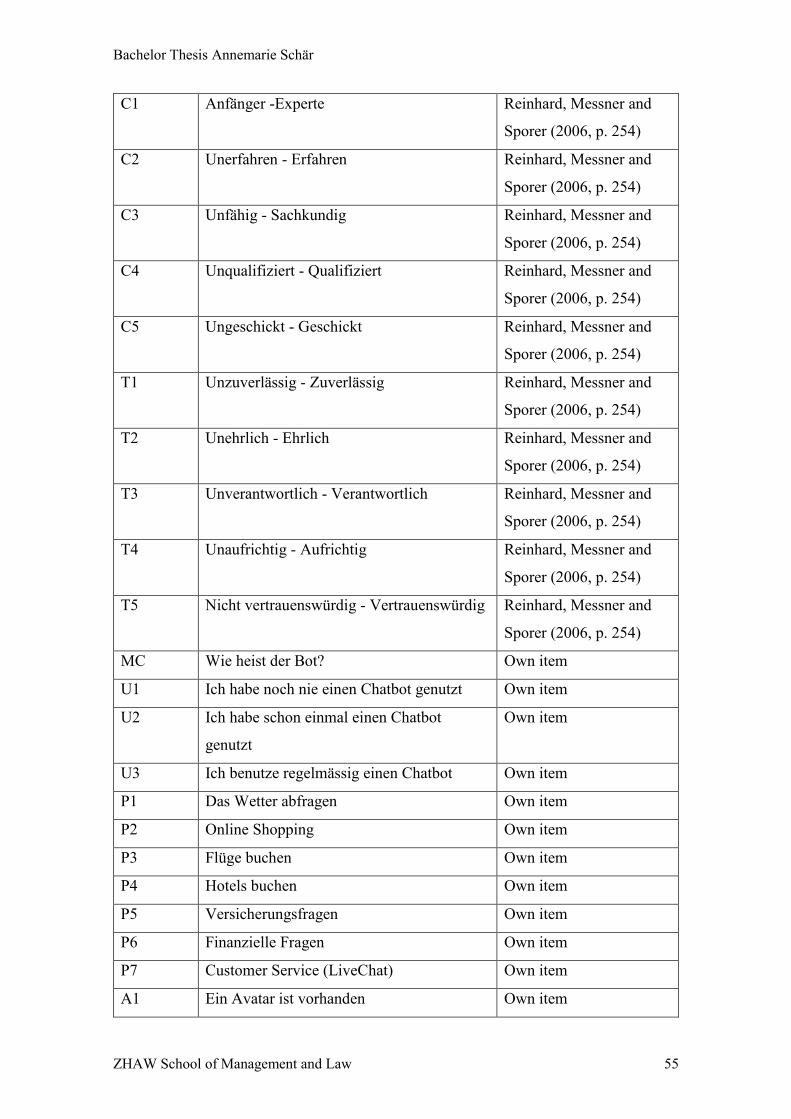
Bachelor Thesis Annemarie Schär
ZHAW School of Management and Law 55
C1 Anfänger -Experte Reinhard, Messner and
Sporer (2006, p. 254)
C2 Unerfahren - Erfahren Reinhard, Messner and
Sporer (2006, p. 254)
C3 Unfähig - Sachkundig Reinhard, Messner and
Sporer (2006, p. 254)
C4 Unqualifiziert - Qualifiziert Reinhard, Messner and
Sporer (2006, p. 254)
C5 Ungeschickt - Geschickt Reinhard, Messner and
Sporer (2006, p. 254)
T1 Unzuverlässig - Zuverlässig Reinhard, Messner and
Sporer (2006, p. 254)
T2 Unehrlich - Ehrlich Reinhard, Messner and
Sporer (2006, p. 254)
T3 Unverantwortlich - Verantwortlich Reinhard, Messner and
Sporer (2006, p. 254)
T4 Unaufrichtig - Aufrichtig Reinhard, Messner and
Sporer (2006, p. 254)
T5 Nicht vertrauenswürdig - Vertrauenswürdig Reinhard, Messner and
Sporer (2006, p. 254)
MC Wie heist der Bot? Own item
U1 Ich habe noch nie einen Chatbot genutzt Own item
U2 Ich habe schon einmal einen Chatbot
genutzt
Own item
U3 Ich benutze regelmässig einen Chatbot Own item
P1 Das Wetter abfragen Own item
P2 Online Shopping Own item
P3 Flüge buchen Own item
P4 Hotels buchen Own item
P5 Versicherungsfragen Own item
P6 Finanzielle Fragen Own item
P7 Customer Service (LiveChat) Own item
A1 Ein Avatar ist vorhanden Own item

Bachelor Thesis Annemarie Schär
ZHAW School of Management and Law 56
A2 Der Avatar zeigt einen realen Menschen Own item
A3 Der Avatar ist Cartoon-artig Own item
A4 Der Avatar ist animiert (Kann sich bewegen
und sprechen)
Own item
A5 Der Avatar ist statisch (Nur ein Bild, keine
Bewegungen/Audio)
Own item
A6 Der Avatar passt zum Unternehmen Own item
CR1 Das Chatfenster ist gross genug Own item
CR2 Das Chatfenster hat ein modernes Design Own item
CR3 Anfragen werden korrekt bearbeitet Own item
CR4 Anfragen werden schnell bearbeitet Own item
CR5 Der Chatbot gibt sich zu erkennen (z.B.
"Sie chatten jetzt mit einem Bot")
Own item
CR6 Datenschutzerklärung wird zu Beginn
angezeigt
Own item
CP1 Ich würde mich von einem Chatbot beraten
lassen (z.B. im Customer Service LiveChat,
Versicherungsberatung, usw.).
Own item
CP2 Ich würde Zahlungsangaben im Chatfenster
angeben
Own item
CP3 Ich würde Bilder im Chatfenster teilen Own item
CP4 Ich würde Adressdaten im Chatfenster
angeben
Own item
CP5 Ich würde Geburtsdatum im Chatfenster
angeben
Own item
CP6 Ich sehe ein grosses Potential für diese
Technologie
Own item
CP7 Unternehmen sind bereit für diese
Technologie
Own item
NU1 Ich bevorzuge Kontakt mit einem Menschen Own item
NU2 Ich traue dieser Technologie nicht Own item
NU3 Die Fehlerquote von Chatbots ist mir zu
hoch
Own item
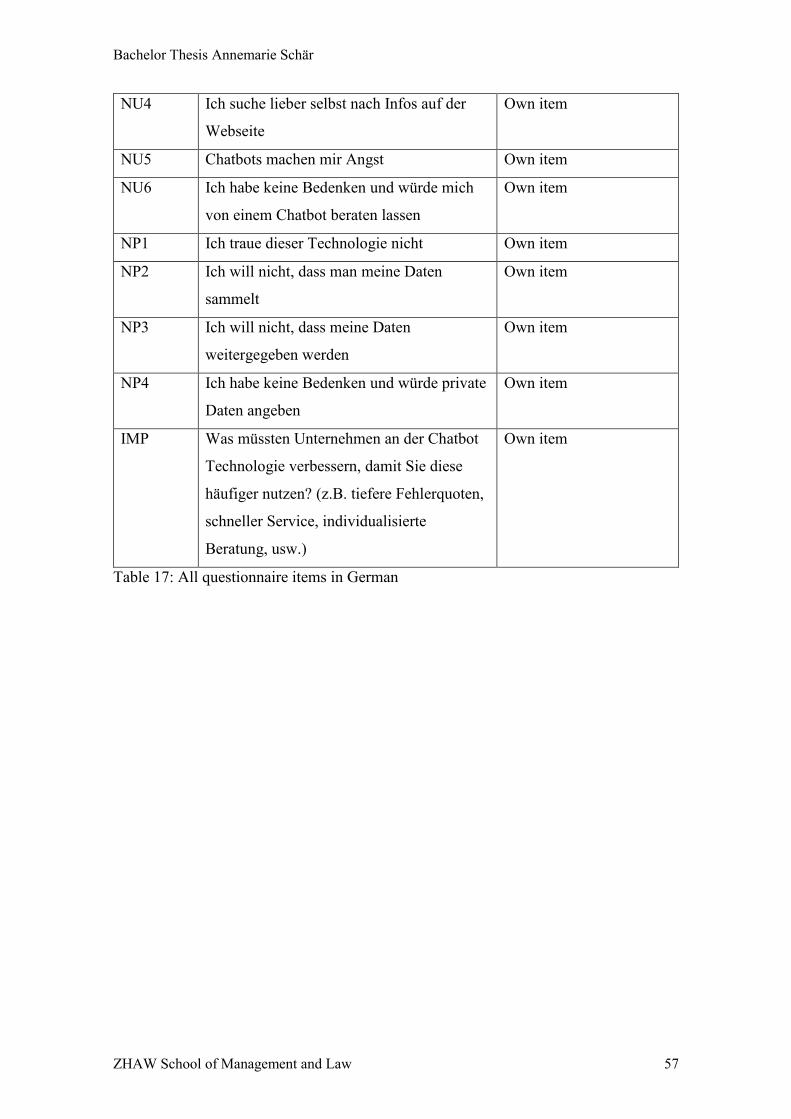
Bachelor Thesis Annemarie Schär
ZHAW School of Management and Law 57
NU4 Ich suche lieber selbst nach Infos auf der
Webseite
Own item
NU5 Chatbots machen mir Angst Own item
NU6 Ich habe keine Bedenken und würde mich
von einem Chatbot beraten lassen
Own item
NP1 Ich traue dieser Technologie nicht Own item
NP2 Ich will nicht, dass man meine Daten
sammelt
Own item
NP3 Ich will nicht, dass meine Daten
weitergegeben werden
Own item
NP4 Ich habe keine Bedenken und würde private
Daten angeben
Own item
IMP Was müssten Unternehmen an der Chatbot
Technologie verbessern, damit Sie diese
häufiger nutzen? (z.B. tiefere Fehlerquoten,
schneller Service, individualisierte
Beratung, usw.)
Own item
Table 17: All questionnaire items in German
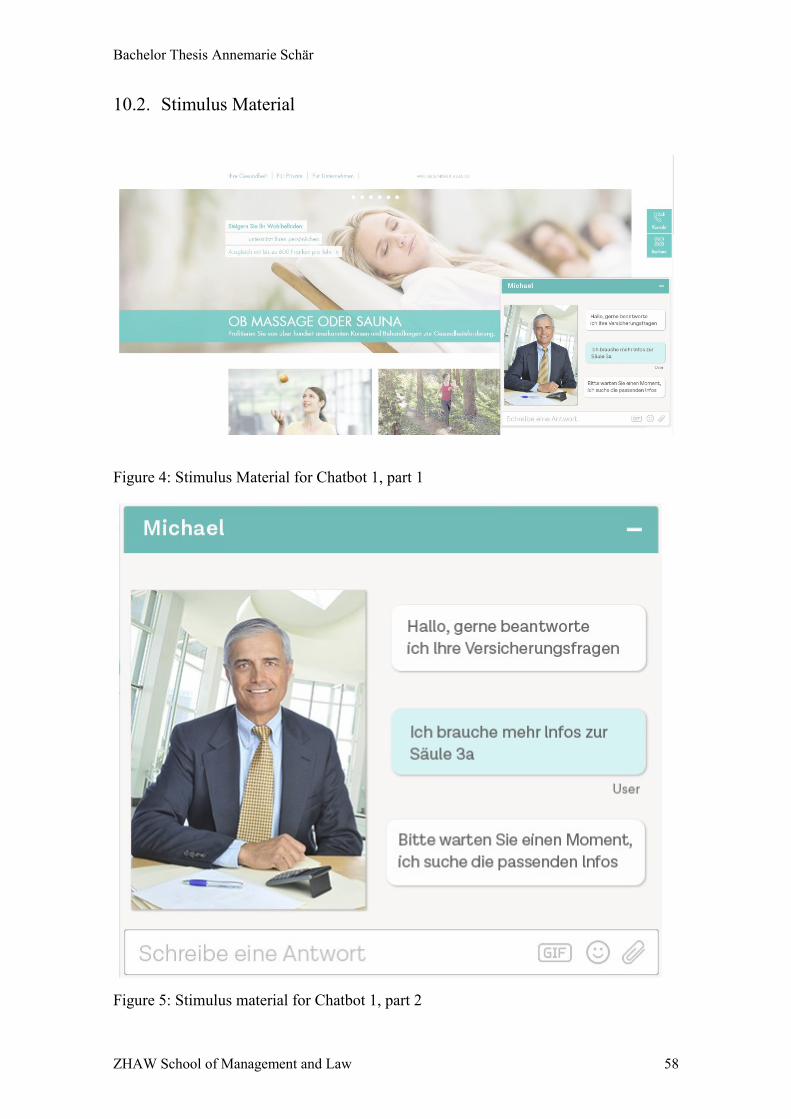
Bachelor Thesis Annemarie Schär
ZHAW School of Management and Law 58
10.2. Stimulus Material
Figure 4: Stimulus Material for Chatbot 1, part 1
Figure 5: Stimulus material for Chatbot 1, part 2
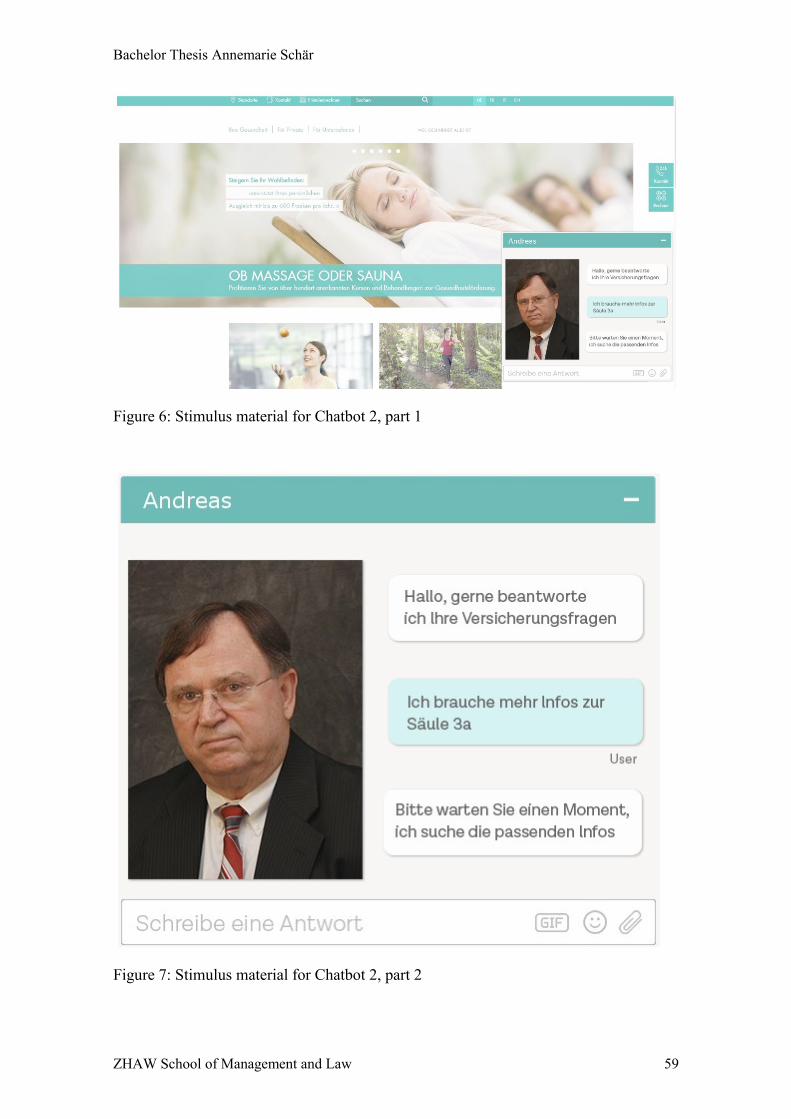
Bachelor Thesis Annemarie Schär
ZHAW School of Management and Law 59
Figure 6: Stimulus material for Chatbot 2, part 1
Figure 7: Stimulus material for Chatbot 2, part 2

Bachelor Thesis Annemarie Schär
ZHAW School of Management and Law 60
Figure 8: Stimulus material for Chatbot 3, part 1
Figure 9: Stimulus material for Chatbot 3, part 2

Bachelor Thesis Annemarie Schär
ZHAW School of Management and Law 61
10.3. Data Analysis
Gender
Frequency Percent Valid Percent Cumulative Percent
Valid Male 66 51.2 51.2 51.2
Female 60 46.5 46.5 97.7
N/A 3 2.3 2.3 100.0
Total 129 100.0 100.0
Table 18: Gender
Statistics
Age
N Valid 128
Missing 1
Mean 27.41
Median 26.00
Std. Deviation 6.545
Range 35
Minimum 19
Maximum 54
Table 19: Age
Chi-Square test
Table 20: Chi-square test of independence – Gender and group
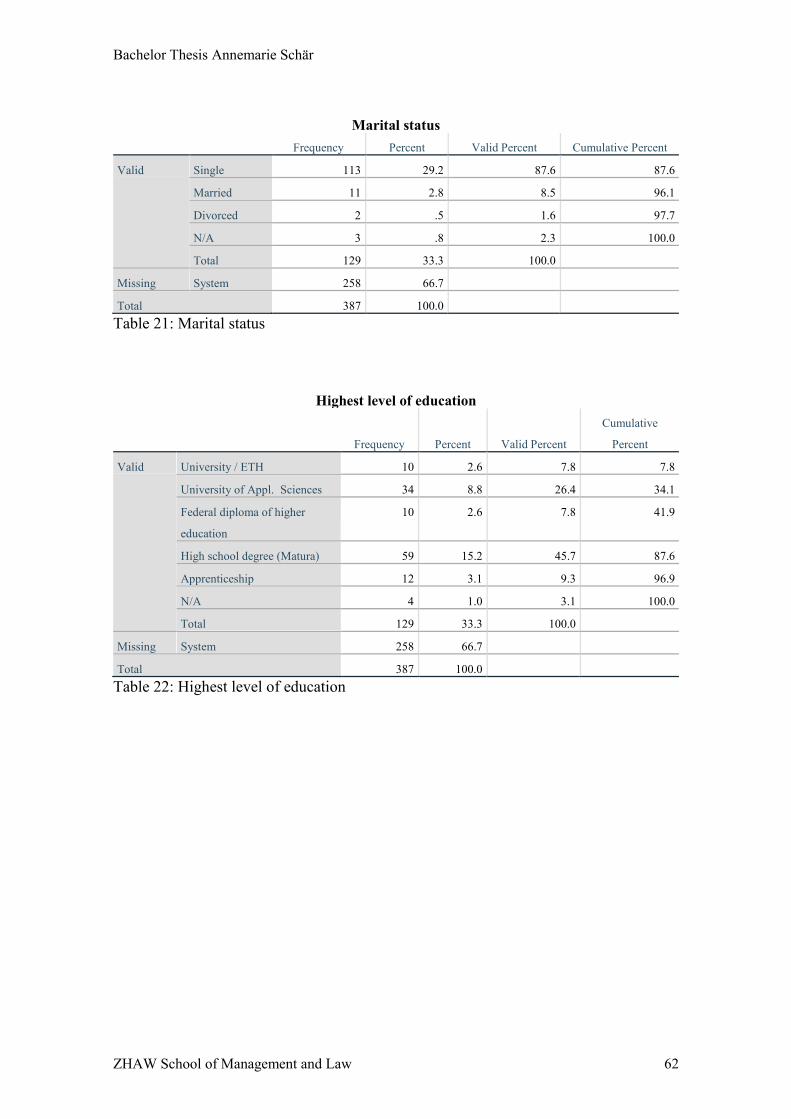
Bachelor Thesis Annemarie Schär
ZHAW School of Management and Law 62
Marital status
Frequency Percent Valid Percent Cumulative Percent
Valid Single 113 29.2 87.6 87.6
Married 11 2.8 8.5 96.1
Divorced 2 .5 1.6 97.7
N/A 3 .8 2.3 100.0
Total 129 33.3 100.0
Missing System 258 66.7
Total 387 100.0
Table 21: Marital status
Highest level of education
Frequency Percent Valid Percent
Cumulative
Percent
Valid University / ETH 10 2.6 7.8 7.8
University of Appl. Sciences 34 8.8 26.4 34.1
Federal diploma of higher
education
10 2.6 7.8 41.9
High school degree (Matura) 59 15.2 45.7 87.6
Apprenticeship 12 3.1 9.3 96.9
N/A 4 1.0 3.1 100.0
Total 129 33.3 100.0
Missing System 258 66.7
Total 387 100.0
Table 22: Highest level of education

Bachelor Thesis Annemarie Schär
ZHAW School of Management and Law 63
Occupation
Frequency Percent Valid Percent
Cumulative
Percent
Valid Full-time student without job 11 2.8 8.5 8.5
Part-time student without job 2 .5 1.6 10.1
Full-time student with job 20 5.2 15.5 25.6
Part-time student with job 63 16.3 48.8 74.4
Employed on a full-time basis 27 7.0 20.9 95.3
N/A 2 .5 1.6 96.9
Employed on a part-time basis 4 1.0 3.1 100.0
Total 129 33.3 100.0
Missing System 258 66.7
Total 387 100.0
Table 23: Occupation
Canton
Frequency Percent Valid Percent
Cumulative
Percent
Valid Aargau 4 1.0 3.1 3.1
Appenzell Ausserrhoden 1 .3 .8 3.9
Basel-Stadt 2 .5 1.6 5.4
Bern 1 .3 .8 6.2
Glarus 3 .8 2.3 8.5
Graubünden 1 .3 .8 9.3
St. Gallen 6 1.6 4.7 14.0
Schaffhausen 4 1.0 3.1 17.1
Schwyz 5 1.3 3.9 20.9
Thurgau 10 2.6 7.8 28.7
Wallis 1 .3 .8 29.5
Zug 2 .5 1.6 31.0
Zürich 89 23.0 69.0 100.0
Total 129 33.3 100.0
Missing System 258 66.7
Total 387 100.0
Table 24: Canton

Bachelor Thesis Annemarie Schär
ZHAW School of Management and Law 64
Workload
Frequency Percent Valid Percent Cumulative Percent
Valid 0% 8 2.1 6.2 6.2
10% 2 .5 1.6 7.8
20% 6 1.6 4.7 12.4
30% 1 .3 .8 13.2
40% 9 2.3 7.0 20.2
50% 6 1.6 4.7 24.8
60% 19 4.9 14.7 39.5
70% 3 .8 2.3 41.9
80% 33 8.5 25.6 67.4
90% 6 1.6 4.7 72.1
100% 27 7.0 20.9 93.0
N/A 9 2.3 7.0 100.0
Total 129 33.3 100.0
Missing System 258 66.7
Total 387 100.0
Table 25: Workload
Independent Samples Test
Levene's Test
for Equality
of Variances t-test for Equality of Means
F Sig. t df
Sig.
(2-
tailed)
Mean
Difference
Std. Error
Difference
95% Confidence
Interval of the
Difference
Lower Upper
Chatbot
1 vs. 2
Warmth
Equal
variances
assumed
1.222 .270 8.722 314 .000 1.451 .166 1.124 1.779
Equal
variances not
assumed
8.682 302.512 .000 1.451 .167 1.122 1.780
Table 26: Independent samples t test, warmth rating of Chatbot 1 vs. Chatbot 2

Bachelor Thesis Annemarie Schär
ZHAW School of Management and Law 65
Independent Samples Test
Levene's Test
for Equality of
Variances t-test for Equality of Means
F Sig. t df
Sig.
(2-
tailed)
Mean
Difference
Std. Error
Difference
95%
Confidence
Interval of the
Difference
Lower Upper
Chatbot 1
vs. 2
Competence
Equal
variances
assumed
2.569 .110 4.715 393 .000 .718 .152 .418 1.017
Equal
variances not
assumed
4.727 392.993 .000 .718 .152 .419 1.016
Table 27: Independent samples t test, competence rating of Chatbot 1 vs. Chatbot 2
Independent Samples Test
Levene's Test
for Equality of
Variances t-test for Equality of Means
F Sig. t df
Sig.
(2-
tailed)
Mean
Difference
Std. Error
Difference
95%
Confidence
Interval of the
Difference
Lower Upper
Chatbot 1
vs. 3
Warmth
Equal
variances
assumed
2.569 .110 4.715 393 .000 .718 .152 .418 1.017
Equal
variances not
assumed
4.727 392.993 .000 .718 .152 .419 1.016
Table 28: Independent samples t test, warmth rating of Chatbot 1 vs. Chatbot 3

Bachelor Thesis Annemarie Schär
ZHAW School of Management and Law 66
Independent Samples Test
Levene's Test
for Equality of
Variances t-test for Equality of Means
F Sig. t df
Sig.
(2-
tailed)
Mean
Difference
Std. Error
Difference
95% Confidence
Interval of the
Difference
Lower Upper
Chatbot 1
vs. Chatbot
3
Competence
Equal
variances
assumed
.356 .551 7.524 438 .000 1.04253 .13855 .77021 1.31484
Equal
variances not
assumed
7.505 403.087 .000 1.04253 .13891 .76946 1.31560
Table 29: Independent samples t test, competence rating of Chatbot 1 vs. Chatbot 3
Independent Samples Test
Levene's Test
for Equality of
Variances t-test for Equality of Means
F Sig. t df
Sig.
(2-
tailed)
Mean
Difference
Std. Error
Difference
95%
Confidence
Interval of the
Difference
Lower Upper
Chatbot 1 vs.
Chatbot 2
Trust
Equal
variances
assumed
.434 .510 2.248 393 .025 .359 .160 .045 .674
Equal
variances not
assumed
2.249 391.242 .025 .359 .160 .045 .673
Table 30: Independent samples t test, trust rating of Chatbot 1 vs. Chatbot 2

Bachelor Thesis Annemarie Schär
ZHAW School of Management and Law 67
Independent Samples Test
Levene's Test for
Equality of
Variances t-test for Equality of Means
F Sig. t df
Sig. (2-
tailed)
Mean
Difference
Std. Error
Difference
95% Confidence
Interval of the
Difference
Lower Upper
Chatbot 1
vs.
Chatbot 3
Trust
Equal
variances
assumed
5.138 .024 .599 438 .549 .083 .138 -.188 .353
Equal
variances
not assumed
.584 362.364 .559 .083 .141 -.195 .360
Table 31: Independent samples t test, trust rating of Chatbot 1 vs. Chatbot 3
10.4. Correlations
Correlations
Pearson Correlation
PSY1 PSY2 PSY3 PSY4 U1 U2 U3
PSY1 1 .735** .707** .234** -.260 .185 .032
PSY 2 .735** 1 .719** .120 -.144 .191 .126
PSY 3 .707** .719** 1 .203* -.316* .357* .289
PSY 4 .234** .120 .203* 1 -.401** .377* .407**
U1 -.260 -.144 -.316* -.401** 1 -.809** -.483**
U2 .185 .191 .357* .377* -.809** 1 .555**
U3 .032 .126 .289 .407** -.483** .555** 1
**. Correlation is significant at the 0.01 level (2-tailed).
*. Correlation is significant at the 0.05 level (2-tailed).
Table 32: Psychographic / Usage

Bachelor Thesis Annemarie Schär
ZHAW School of Management and Law 68
Correlations
Pearson Correlation
PSY1 PSY2 PSY3 PSY4 A1 A2 A3 A4 A5 A6
PSY1 1 .735** .707** .234** .157 .176 .117 .163 .117 .298*
PSY2 .735** 1 .719** .120 .095 -.031 .261 .017 .177 .142
PSY3 .707** .719** 1 .203* .124 .088 .320* .169 .121 .203
PSY4 .234** .120 .203* 1 .079 .218 .118 .253 .077 .224
A1 .157 .095 .124 .079 1 .561** .368** .255 .395** .488**
A2 .176 -.031 .088 .218 .561** 1 .201 .227 .188 .405**
A3 .117 .261 .320* .118 .368** .201 1 .531** .239 .370**
A4 .163 .017 .169 .253 .255 .227 .531** 1 .011 .397**
A5 .117 .177 .121 .077 .395** .188 .239 .011 1 .405**
A6 .298* .142 .203 .224 .488** .405** .370** .397** .405** 1
**. Correlation is significant at the 0.01 level (2-tailed).
*. Correlation is significant at the 0.05 level (2-tailed).
Table 33: Psychographic / Avatar
Correlations
Pearson Correlation
PSY1 PSY2 PSY3 PSY4 CP1 CP2 CP3 CP4 CP5 CP6 CP7
PSY1 1 .735** .707** .234** .252 .177 .350* .360* .261 .353* .204
PSY2 .735** 1 .719** .120 .243 .249 .401** .283* .135 .394** .141
PSY3 .707** .719** 1 .203* .194 .279* .320* .222 .084 .325* .266
PSY4 .234** .120 .203* 1 .280* .102 .140 .021 .166 .070 .194
CP1 .252 .243 .194 .280* 1 .095 .384** .285* .341* .641** .317*
CP2 .177 .249 .279* .102 .095 1 .522** .514** .461** .263 .125
CP3 .350* .401** .320* .140 .384** .522** 1 .760** .612** .529** .261
CP4 .360* .283* .222 .021 .285* .514** .760** 1 .724** .459** .259
CP5 .261 .135 .084 .166 .341* .461** .612** .724** 1 .422** .347*
CP6 .353* .394** .325* .070 .641** .263 .529** .459** .422** 1 .429**
CP7 .204 .141 .266 .194 .317* .125 .261 .259 .347* .429** 1
**. Correlation is significant at the 0.01 level (2-tailed).
*. Correlation is significant at the 0.05 level (2-tailed).
Table 34: Psychographic / Characteristics
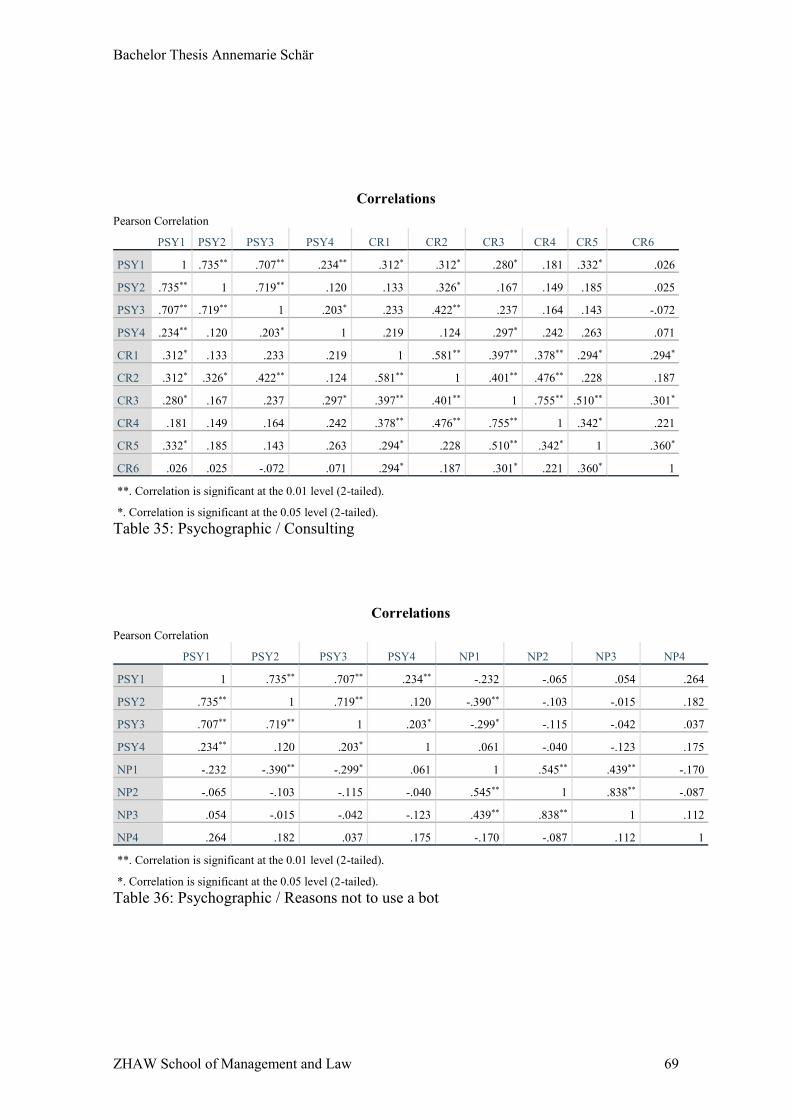
Bachelor Thesis Annemarie Schär
ZHAW School of Management and Law 69
Correlations
Pearson Correlation
PSY1 PSY2 PSY3 PSY4 CR1 CR2 CR3 CR4 CR5 CR6
PSY1 1 .735** .707** .234** .312* .312* .280* .181 .332* .026
PSY2 .735** 1 .719** .120 .133 .326* .167 .149 .185 .025
PSY3 .707** .719** 1 .203* .233 .422** .237 .164 .143 -.072
PSY4 .234** .120 .203* 1 .219 .124 .297* .242 .263 .071
CR1 .312* .133 .233 .219 1 .581** .397** .378** .294* .294*
CR2 .312* .326* .422** .124 .581** 1 .401** .476** .228 .187
CR3 .280* .167 .237 .297* .397** .401** 1 .755** .510** .301*
CR4 .181 .149 .164 .242 .378** .476** .755** 1 .342* .221
CR5 .332* .185 .143 .263 .294* .228 .510** .342* 1 .360*
CR6 .026 .025 -.072 .071 .294* .187 .301* .221 .360* 1
**. Correlation is significant at the 0.01 level (2-tailed).
*. Correlation is significant at the 0.05 level (2-tailed).
Table 35: Psychographic / Consulting
Correlations
Pearson Correlation
PSY1 PSY2 PSY3 PSY4 NP1 NP2 NP3 NP4
PSY1 1 .735** .707** .234** -.232 -.065 .054 .264
PSY2 .735** 1 .719** .120 -.390** -.103 -.015 .182
PSY3 .707** .719** 1 .203* -.299* -.115 -.042 .037
PSY4 .234** .120 .203* 1 .061 -.040 -.123 .175
NP1 -.232 -.390** -.299* .061 1 .545** .439** -.170
NP2 -.065 -.103 -.115 -.040 .545** 1 .838** -.087
NP3 .054 -.015 -.042 -.123 .439** .838** 1 .112
NP4 .264 .182 .037 .175 -.170 -.087 .112 1
**. Correlation is significant at the 0.01 level (2-tailed).
*. Correlation is significant at the 0.05 level (2-tailed).
Table 36: Psychographic / Reasons not to use a bot

Bachelor Thesis Annemarie Schär
ZHAW School of Management and Law 70
Correlations
Pearson Correlation
PSY1 PSY2 PSY3 PSY4 NP1 NP2 NP3 NP4
PSY1 1 .735** .707** .234** -.232 -.065 .054 .264
PSY2 .735** 1 .719** .120 -.390** -.103 -.015 .182
PSY3 .707** .719** 1 .203* -.299* -.115 -.042 .037
PSY4 .234** .120 .203* 1 .061 -.040 -.123 .175
NP1 -.232 -.390** -.299* .061 1 .545** .439** -.170
NP2 -.065 -.103 -.115 -.040 .545** 1 .838** -.087
NP3 .054 -.015 -.042 -.123 .439** .838** 1 .112
NP4 .264 .182 .037 .175 -.170 -.087 .112 1
**. Correlation is significant at the 0.01 level (2-tailed).
*. Correlation is significant at the 0.05 level (2-tailed).
Table 37: Psychographic / Reasons not to share information