Babylonia areolata (Link 1807) population in...
18
Combined effects of temperature, salinity and rearing density on growth and survival of juvenile ivory shell, Babylonia areolata (Link 1807) population in Thailand Wengang L € u 1,2 , Minghui Shen 3 , Jingqiang Fu 2 , Weidong Li 3 , Weiwei You 1,2 & Caihuan Ke 1,2 1 State Key Laboratory of Marine Environmental Science, Xiamen University, Xiamen, China 2 College of Ocean and Earth Sciences, Xiamen University, Xiamen, China 3 Tropical Marine Products Fine Breed Center, Hainan Provincial Fisheries Research Institute, Hainan, China Correspondence: C Ke, State Key Laboratory of Marine Environmental Science, Xiamen University, Xiamen, Fujian Province 361102, China. E-mail: [email protected] Abstract The ivory shell, Babylonia areolata (Link 1807), has been exploited as an important aquaculture organ- ism along the southern China coast. In order to obtain optimal culture conditions for ivory shell juvenile, the central composite rotatable design was used to estimate the combined effects of tempera- ture, salinity and rearing density on accumulated growth rate (AGR) and survival rate (SR). The results showed that the linear effects of temperature and rearing density on both growth and survival were highly significant (P < 0.01), but there was no significant effect on salinity (P > 0.05). The quadra- tic effects of temperature, salinity and rearing den- sity influenced growth significantly (P < 0.01). The quadratic effects of temperature and salinity on sur- vival of juvenile snail were significant (P < 0.01), the combined effects between the quadratic effect of temperature and the linear effect of rearing density influenced survival significantly (P < 0.01); the interactive effects of temperature, salinity and rear- ing density played a significant role in survival (P < 0.01). As can be seen from the above experi- mental results, the effects of temperature and salin- ity on growth and survival of B. areolata were strengthened with enhanced rearing density in a certain range and vice versa. By optimization using the response surface method, the optimal point was found at a temperature of 26.81°C, a salinity of 28.76 ppt and a rearing density of 527.07 ind m 2 . Under these conditions, the optimal AGR and SR were 36.84 mg day 1 and 99.99%, respectively, with a satisfaction function value of 99.71%. Keywords: Babylonia areolata, accumulated growth rate, survival rate, response surface method, optimization Introduction Babylonia areolata, in the phylum Mollusca, class Gastropoda, subclass Prosobranchia, order Neogas- tropoda and family Buccinidae, inhabits the sandy subtidal zone at depths of 4–20 m in the summer and 40–60 m in the winter (Zheng, Ke, Zhou & Li 2005), and is a very important marine economic benthic organism. In the last decade, because of its fairly high economic value, this ivory shell is recommended as an excellent candidate species for aquaculture and has recently become more heav- ily cultured. Due to intensive cultivation, uncer- tain ecological conditions and vibrio diseases, further development of the aquaculture of this spe- cies has been delayed in some provinces such as Hainan and Fujian in China and Chiengmai in Thailand. In order to culture B. areolata in additional loca- tions in China and elsewhere, it is necessary to establish technical procedures to produce sufficient juveniles in a hatchery, and to investigate the effects of exogenous factors, especially tempera- ture, salinity and rearing density, on growth and survival. However, the little information available on ivory snail is not always consistent with field observations. Research frequently focuses on cul- turing technique and seed breeding (Feng, Zhou & Li 2009). For practical considerations, it is very important to establish a system that provides the © 2016 John Wiley & Sons Ltd 1 Aquaculture Research, 2016, 1–18 doi: 10.1111/are.13000
Transcript of Babylonia areolata (Link 1807) population in...
Combined effects of temperature, salinity and rearing
density on growth and survival of juvenile ivory shell,
Babylonia areolata (Link 1807) population in Thailand
Wengang L€u1,2, Minghui Shen3, Jingqiang Fu2, Weidong Li3, Weiwei You1,2 & Caihuan Ke1,2
1State Key Laboratory of Marine Environmental Science, Xiamen University, Xiamen, China2College of Ocean and Earth Sciences, Xiamen University, Xiamen, China3Tropical Marine Products Fine Breed Center, Hainan Provincial Fisheries Research Institute, Hainan, China
Correspondence: C Ke, State Key Laboratory of Marine Environmental Science, Xiamen University, Xiamen, Fujian Province
361102, China. E-mail: [email protected]
Abstract
The ivory shell, Babylonia areolata (Link 1807), has
been exploited as an important aquaculture organ-
ism along the southern China coast. In order to
obtain optimal culture conditions for ivory shell
juvenile, the central composite rotatable design was
used to estimate the combined effects of tempera-
ture, salinity and rearing density on accumulated
growth rate (AGR) and survival rate (SR). The
results showed that the linear effects of temperature
and rearing density on both growth and survival
were highly significant (P < 0.01), but there was no
significant effect on salinity (P > 0.05). The quadra-
tic effects of temperature, salinity and rearing den-
sity influenced growth significantly (P < 0.01). The
quadratic effects of temperature and salinity on sur-
vival of juvenile snail were significant (P < 0.01),
the combined effects between the quadratic effect of
temperature and the linear effect of rearing density
influenced survival significantly (P < 0.01); the
interactive effects of temperature, salinity and rear-
ing density played a significant role in survival
(P < 0.01). As can be seen from the above experi-
mental results, the effects of temperature and salin-
ity on growth and survival of B. areolata were
strengthened with enhanced rearing density in a
certain range and vice versa. By optimization using
the response surface method, the optimal point was
found at a temperature of 26.81°C, a salinity of
28.76 ppt and a rearing density of 527.07 ind m�2.
Under these conditions, the optimal AGR and SR
were 36.84 mg day�1 and 99.99%, respectively,
with a satisfaction function value of 99.71%.
Keywords: Babylonia areolata, accumulated
growth rate, survival rate, response surface
method, optimization
Introduction
Babylonia areolata, in the phylum Mollusca, class
Gastropoda, subclass Prosobranchia, order Neogas-
tropoda and family Buccinidae, inhabits the sandy
subtidal zone at depths of 4–20 m in the summer
and 40–60 m in the winter (Zheng, Ke, Zhou & Li
2005), and is a very important marine economic
benthic organism. In the last decade, because of
its fairly high economic value, this ivory shell is
recommended as an excellent candidate species for
aquaculture and has recently become more heav-
ily cultured. Due to intensive cultivation, uncer-
tain ecological conditions and vibrio diseases,
further development of the aquaculture of this spe-
cies has been delayed in some provinces such as
Hainan and Fujian in China and Chiengmai in
Thailand.
In order to culture B. areolata in additional loca-
tions in China and elsewhere, it is necessary to
establish technical procedures to produce sufficient
juveniles in a hatchery, and to investigate the
effects of exogenous factors, especially tempera-
ture, salinity and rearing density, on growth and
survival. However, the little information available
on ivory snail is not always consistent with field
observations. Research frequently focuses on cul-
turing technique and seed breeding (Feng, Zhou &
Li 2009). For practical considerations, it is very
important to establish a system that provides the
© 2016 John Wiley & Sons Ltd 1
Aquaculture Research, 2016, 1–18 doi:10.1111/are.13000

snail with the most suitable environment for
optimal development and growth.
The temperature, salinity and rearing density are
important environmental factors that influence
growth and survival of shellfish. Wang, Liu and Yang
(2014), Wang, Zhu, Wang, Qiang, Xu and Li (2014)
indicated that temperature and salinity were two
important factors, not only because temperature and
salinity were significant factors that influenced
growth and survival of many aquatic organisms but
also because the two factors can be controlled more
easily than other environmental factors in the labo-
ratory. Temperature and salinity influence organisms
in various ways, such as food absorption and conver-
sion ability (Hutchinson & Hawkins 1992; Navarro
& Gonzalez 1998; Imsland, Foss, Gunnarsson,
Berntssen, FitzGerald, Bonga, Von Ham, Naevdal &
Stefansson 2001; Silva, Calazans, Soares, Soares
& Peixoto 2010), biological energy balance (Bricelj &
Shumway 1991; Gardner & Thompson 2001;
Imsland et al. 2001) and immune response (Gag-
naire, Frouin, Moreau, Thomas-Guyon & Renault
2006; Chen, Yang, Delaporte & Zhao 2007; Munari,
Chinellato, Matozzo, Bressan & Marin 2010). Rearing
density is widely recognized as a critical factor in
intensive aquaculture because it may affect physiol-
ogy and behaviour of reared animals (Li, Dong, Lei &
Li 2007; Velasco & Barros 2008; Li & Li 2010). In
oceans or industrial aquaculture operations, when
temperature and salinity remain constant, the stock-
ing rearing density can be the key factor that influ-
enced the growth of shellfish. High rearing density
reduced the growth rate of shellfish and increased
the death rate by influencing self-metabolism
(Velasco & Barros 2008). In contrast, a low rearing
density was unfavourable for producing high eco-
nomic benefits; therefore, an appropriate rearing den-
sity is the key to maximize economic benefits.
Many studies of environmental factors (tempera-
ture, salinity and rearing density) on development
and growth of molluscs exist (Laing 2002; Christo-
phersen & Strand 2003; Rupp & Parsons 2004; Ver-
ween, Vincx & Degraer 2007; Rico-Villa, Pouvreau
& Robert 2009). However, in these studies the effects
of environmental factors of interest were only exam-
ined singly, namely one factor was manipulated at a
time. Little is known about the effects of combined
environmental factors on growth and survival of
juvenile ivory snail. Xue, Ke, Wang, Wei and Xu
(2010) did study the combined effects of tempera-
ture and salinity on growth and survival in B. areo-
lata, but only these two factors were examined.
The combined effects of temperature, salinity and
rearing density on growth, survival and develop-
ment of marine economic organisms have been
studied for a few organisms, such as Dicentrarchus
labrax (Conides & Glamuzina 2001) and Apostichopus
japonicus (Li & Li 2010). However, there are no stud-
ies on the combined effects of temperature, salinity
and rearing density on growth and survival of
B. areolata. In the present study, central composite
rotatable design (CCRD) and the response surface
method (RSM) were used to investigate growth and
survival of juveniles of B. areolata under different
temperatures, salinities and rearing densities and to
establish model equations for growth and survival in
relation to these three factors. The objective of the
present research was to examine the synergistic
effects of temperature, salinity and rearing density,
and to determine the optimal combination of the
three factors by using the resultant model equations.
Materials and methods
Biological materials
The snails used for the experiment were F1-genera-
tion juveniles of B. areolata reproduced by wild pop-
ulation in Thailand and cultivated by Xiamen
University in Hainan province in China. The shell
height and the weight were 16.38 � 1.04 mm and
0.87 � 0.24 g respectively (Table 1). The juveniles
were delivered to the seed-breeding facility of Aqua-
tic Products Research Institute in Hainan Province
(Qionghai, China) to be bred. The pool for tempo-
rary breeding (10 m 9 1 m 9 1.2 m) was lined
with a 30-mm thick layer of sand (with particle size
of 1 � 0.02 mm). The water in the pool consisted
of running water with a flow rate of 10 m3 day�1,
and with continuous aeration. The water tempera-
ture and salinity were 23.5 � 1°C and 26.9 � 1
ppt respectively. The pH for the seawater was
8.1 � 0.5. After a temporary breeding period of
2 days, oyster was fed to the juveniles once a day in
an amount of 20% of the weight of the total juve-
niles. The temporary breeding occurred over
10 days and then the experiment commenced.
Measurement of accumulated growth rate and
survival rate
Growth and survival of the different groups of
juveniles were measured every 15 days. A random
sample of 30 juveniles was weighed on an
© 2016 John Wiley & Sons Ltd, Aquaculture Research, 1–182
Effects of T, S and D on GR and SR of snail W L€u et al. Aquaculture Research, 2016, 1–18
electronic balance with a precision of 0.01 g. The
accumulated growth rate (AGR) was the ratio of
the difference of the measured weight and initial
weight divided by the number of days. Survival
rate (SR) was the ratio of the measured survival
and the initial stocking amount. Juveniles coming
out of the shell but still alive were recorded as the
being dead. The entire experiment lasted for
60 days. The equation of AGR and SR were as fol-
lows:
SR ð%Þ ¼ survival amount
total amount� 100AGR ðmg=dÞ
¼ gLt � gL0t� t0
� 100
In the equation, t0 and t were the beginning
time and ending time of the experiment respec-
tively.
Experimental procedures
The maximum and minimum temperature were
40°C and 15°C, respectively, and the maximum
and minimum salinity were 45 ppt and 10 ppt,
respectively, and the maximum and minimum rear-
ing density were 1500 ind m�2 and 300 ind m�2
respectively. The high temperature group was
regulated and controlled by using a hard plastic
cask with a volume of 3 m3, with a 500 W stain-
less steel heating bar, electronic relay and electric
contact thermometer. The regulation range was
10–50°C, and the precision of temperature control
was �0.1°C. The low temperature was regulated
and controlled by using a small low-temperature
refrigerator (autoMAN) with a regulation range of
10–25°C and a precision of temperature control
of �0.1°C. Water salinity was manipulated by
dilution of normal sea water (<30 ppt) with
dechlorinated freshwater or by the addition of
small quantities of sea salt when salinity of >35 ppt
was required. A salinity refractometer (ATAGO)
was used to monitor salinity, with a precision of
�0.1%. Energetic, healthy and complete individu-
als from the temporarily breeding population were
placed into the experimental container in appropri-
ate experimental densities (the experimental
container was 1 m 9 1 m 9 0.75 m, the paving
particle size in the container was 0.5 mm and the
thickness of the fine white sand was 30 mm). Indi-
viduals without any obvious difference in shell
height and weight were selected and placed into
each group (P < 0.05, shown in Table 1). The
amount of dissolved oxygen, pH and light were
controlled at more than 5 mg L�1, 7.9–8.1, and
using natural light respectively. Snails were fed
oyster once every day. The sand was changed
every 10 days.
Sea water was pumped from a three-level sand
filter through a cotton filter bag and was then dis-
charged into a salinity pool after being filtrated.
Pool water with the same salinity was then sup-
plied to the barrels with differing temperature
designations. The seawater was discharged into
the experimental containers automatically when
the temperature rose to meet the requirement for
the experiment. During the experimental period,
all water flow was unidirectional. The operation
process is shown in Fig. 1.
Experiment design and data analysis
Central composite rotatable design (shown in
Table 2) was implemented, and the range of
temperature and salinity were determined by
reference to previous research and preliminary
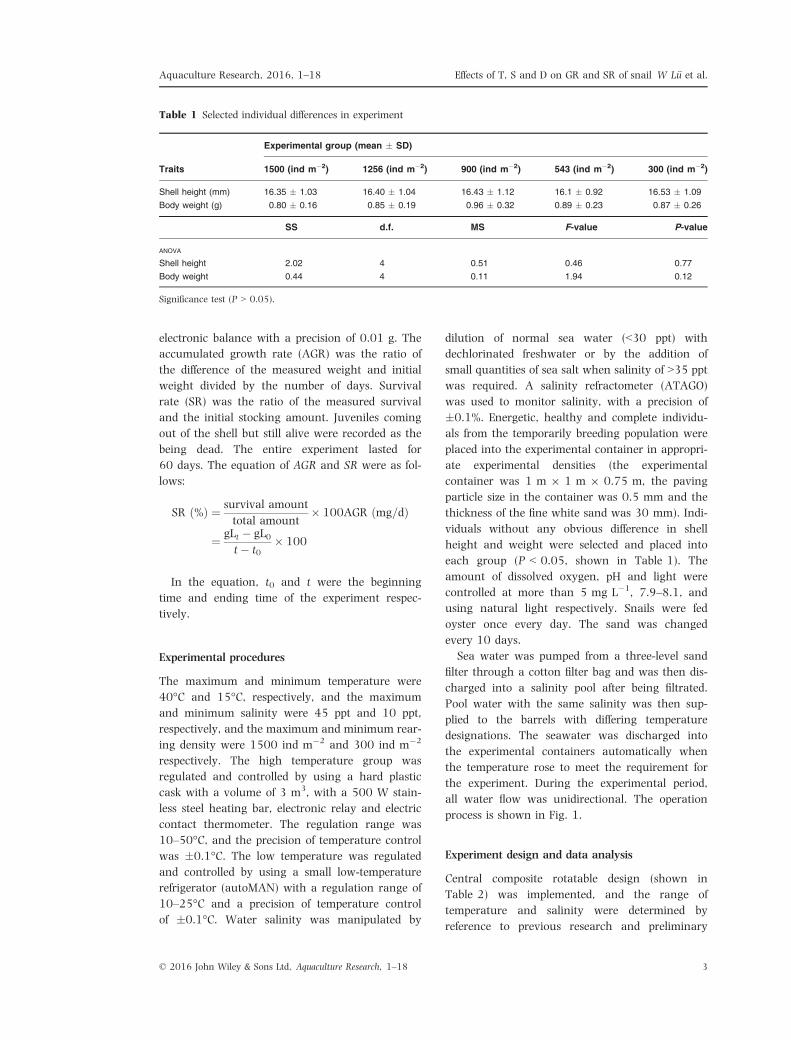
Table 1 Selected individual differences in experiment
Traits
Experimental group (mean � SD)
1500 (ind m�2) 1256 (ind m�2) 900 (ind m�2) 543 (ind m�2) 300 (ind m�2)
Shell height (mm) 16.35 � 1.03 16.40 � 1.04 16.43 � 1.12 16.1 � 0.92 16.53 � 1.09
Body weight (g) 0.80 � 0.16 0.85 � 0.19 0.96 � 0.32 0.89 � 0.23 0.87 � 0.26
SS d.f. MS F-value P-value
ANOVA
Shell height 2.02 4 0.51 0.46 0.77
Body weight 0.44 4 0.11 1.94 0.12
Significance test (P > 0.05).
© 2016 John Wiley & Sons Ltd, Aquaculture Research, 1–18 3
Aquaculture Research, 2016, 1–18 Effects of T, S and D on GR and SR of snail W L€u et al.

Level-3 sand-filter-tank
Salinity-controled tank
Temperature-controled tank
Experimental block
Drainage
PVC pipe
Figure 1 Experimental operation
process.
Table 2 Central composite circumscribed design used in response surface method studies and experimental value
Run
Cod Actual Experimental value
T S D T (°C) S (ppt) D (ind m�2) AGR (mg day�1) SR (%)
1 1 �1 1 34.93 17.09 1256.76 3.34 � 0.10 24.60 � 1.78
2 0 0 �a 27.50 27.5 300 36.71 � 3.21 99.40 � 2.26
3 �1 1 1 20.07 37.91 1256.76 2.03 � 0.04 65.84 � 2.12
4 0 0 0 27.5 27.5 900 32.77 � 1.79 95.72 � 3.45
5 0 �a 0 27.5 10 900 0.02 � 0.00 0.00 � 0.00
6 a 0 0 40 27.5 900 0.23 � 0.00 0.00 � 0.00
7 0 �a 0 27.5 10 900 0.04 � 0.00 0.00 � 0.00
8 0 0 �a 27.5 27.5 300 36.82 � 2.63 99.70 � 3.32
9 a 0 0 40.00 27.5 900 0.00 � 0.00 0.00 � 0.00
10 0 0 a 27.5 27.5 1500 11.73 � 1.58 85.40 � 4.27
11 0 a 0 27.5 45 900 0.00 � 0.00 0.00 � 0.00
12 �1 �1 1 20.07 17.09 1256.76 4.42 � 0.93 46.24 � 2.14
13 0 a 0 27.5 45 900 0.00 � 0.00 0.00 � 0.00
14 1 �1 �1 34.93 17.09 543.24 0.88 � 0.05 42.6 � 4.37
15 0 0 0 27.5 27.5 900 30.73 � 3.18 96.71 � 5.48
16 �a 0 0 15 27.5 900 0.42 � 0.02 88.41 � 4.79
17 1 �1 �1 34.93 17.09 543.24 9.98 � 0.35 37.9 � 2.41
18 �1 1 �1 20.07 37.91 543.24 27.12 � 3.79 59.23 � 4.17
19 �a 0 0 15 27.5 900 0.57 � 0.07 85.72 � 3.75
20 0 0 a 27.5 27.5 1500 13.55 � 1.89 88.90 � 3.32
21 0 0 0 27.5 27.5 900 30.20 � 2.37 94.43 � 9.28
22 0 0 0 27.5 27.5 900 31.40 � 3.67 95.87 � 4.84
23 1 1 �1 34.93 37.91 543.24 1.25 � 1.79 55.70 � 2.45
24 1 1 �1 34.93 37.91 543.24 2.06 � 0.04 45.20 � 1.94
25 �1 �1 �1 20.07 17.09 543.24 22.22 � 2.28 82.21 � 3.38
26 �1 �1 1 20.07 17.09 1256.76 3.16 � 1.02 44.63 � 7.71
27 �1 1 1 20.07 37.91 1256.76 1.65 � 0.32 69.80 � 2.49
28 1 1 1 34.93 37.91 1256.76 0.08 � 0.00 7.50 � 1.98
29 �1 1 �1 20.07 37.91 543.24 25.46 � 1.06 62.42 � 4.67
30 �1 �1 �1 20.07 17.09 543.24 25.61 � 3.27 84.80 � 5.91
31 1 1 1 34.93 37.91 1256.76 0.79 � 0.48 27.98 � 1.26
32 1 �1 1 34.93 17.09 1256.76 0.12 � 0.07 20.35 � 2.33
33 0 0 0 27.5 27.5 900 33.92 � 7.18 98.80 � 5.17
34 0 0 0 27.5 27.5 900 33.33 � 2.45 98.11 � 6.91
T, S and D represented the temperature, salinity and density respectively; AGR and SR represented the accumulated growth rate
and survival rate respectively; |a| was asterisk arm.
© 2016 John Wiley & Sons Ltd, Aquaculture Research, 1–184
Effects of T, S and D on GR and SR of snail W L€u et al. Aquaculture Research, 2016, 1–18

experimentation. The rearing density factor was
determined based on previous research and pro-
duction practical experience, without any prelimi-
nary experimentation. The selected temperature
ranged from 15 to 40°C, the salinity ranged from
10 to 45 ppt and the rearing density ranged from
300 to 1500 ind m�2. The design contained three
experimental factors, six axis points and six centre
points The code value for the central composite
was 0, the upper limit and lower limit of the code
value were 1 and �1, respectively, and the Aster-
isk arm was |1.682|. Thirty-four experimental
points in total were designed for analysis. The
experiment was set to be replicated once, so 68
group points in total were designated to be tested.
The average and standard deviation of the two
replications were to be calculated.
Analysis was performed using SPSS (V.16) soft-
ware (SPSS, Chicago, IL, USA). A stepwise regres-
sion method (Backward stepwise, introducing level
was 0.05; eliminating level was 0.1) was
employed to create a response surface model with
temperature, salinity and rearing density as inde-
pendent variables and AGR and SR as dependent
variables. The model general formula was:
Y ¼ b0 þXn
i¼1
bivi þXn
j¼1
bjjv2j þ
Xn
l¼1
blllv3l
þXn
ij
bijvij þXn
il
bilvil þXn
jl
bjlvjl
þXn
ijl
bijlvijl þ e
where Y was the response (AGR, SR or their trans-
formations); b0 was the intercept of regression
equation; bi, bj, bl���bijl were linear, quadratic and
cubic and interactive effects of temperature, salin-
ity and rearing density on AGR and SR; vi, vj andvl were coding variables of temperature (T), salin-
ity (S) and rearing density (D), respectively, and e
is random error, with the assumption that it has a
normal distribution with a mean of zero.
A variance analysis was used to confirm the
regression equation model and the significance of
each experimental factor. The coefficient of deter-
mination (R2), adjusted coefficient (Adj-R2) and
predicted coefficient (Pred-R2) were used to assess
the degree of fit of the model. Fisher’s F-test was
used to test for statistical significance. The three-
dimensional response surface diagram and the cor-
responding contour map were used to analyse the
effects of temperature, salinity and rearing density
on growth and survival of the juvenile.
Results
Modelling and significance test
The experimental data for growth and SR are pro-
vided in Table 2. Results of statistical analysis are
presented in Tables 3 and 4. The regression equa-
tions were determined to be as follows:
YAGR ¼ �141:4974þ 8:9944T � 0:0352Dþ 5:8763Sþ 1:8668TD� 8:8409TS
� 6:1283DS� 0:1981T2 � 18270D2
� 0:1020S2
YSR ¼ 357:2485� 36:6528T � 0:4174Dþ 9:1223Sþ 0:0211TDþ 0:2329TS
þ 7:7131DSþ 1:1398T2 � 0:3019S2
� 2:3306TSD� 2:7642T2D
� 0:0146T3
where T, S and D represented the temperature,
salinity and density respectively.
Coefficient estimates, including significance and
95% confidence intervals, of the model equations
generated for growth and survival are presented
Table 3 Regression coefficients, standard errors and
95% confidence intervals for the predicted model of accu-
mulated growth rate
Term Coefficient d.f. SE
95% CI
Low High
Intercept 31.95 1 1.47 28.91 34.99
T �3.45 1 0.69 �4.88 �2.03
D �6.59 1 0.69 �8.02 �5.17
S �0.35 1 0.69 �1.77 �1.08
TD 4.95 1 0.90 3.09 6.81
TS �0.68 1 0.90 �2.55 1.18
DS �0.23 1 0.90 �2.09 1.64
T2 �10.94 1 0.76 �12.51 �9.37
D2 �2.33 1 0.76 �3.90 �0.75
S2 �11.05 1 0.76 �12.62 �9.48
T, S and D represented the temperature, salinity and density
respectively; the values in the table were all coded values, and
the coefficient was estimated according to the coded value, the
final equation obtained by the actual value was as follows:
YAGR ¼ �141:4974þ 8:9944T � 0:0352Dþ 5:8763Sþ 1:8668TD� 8:8409TS� 6:1283DS� 0:1981T2
� 18270D2 � 0:1020S2
© 2016 John Wiley & Sons Ltd, Aquaculture Research, 1–18 5
Aquaculture Research, 2016, 1–18 Effects of T, S and D on GR and SR of snail W L€u et al.
in Tables 3–6. Model equations for both growth
and survival adequately represented the experi-
mental data (P < 0.0001). The linear and quadra-
tic effects of temperature and rearing density,
together with the quadratic effect of salinity and
the interactive effect of temperature and rearing
density, highly significantly contributed to the
variation in growth data (P < 0.0001). The linear
effect of salinity, the interactive effect of tempera-
ture and salinity, and the interactive effects
between salinity and rearing density were not sig-
nificant (P > 0.05).
The linear, quadratic and cubic effects of tem-
perature as well as the linear effect of rearing den-
sity and the quadratic effect of salinity on SR
statistically differed from zero (P < 0.01). The lin-
ear effect of salinity on the SR was not significant
(P > 0.05). The interaction between rearing den-
sity and salinity was highly significant (P < 0.01),
but the interactive effects of temperature and salin-
ity, and of temperature and rearing density were
not significant (P > 0.05). The interaction between
the quadratic effect of temperature and the linear
effect of rearing density was highly significant
(P < 0.01). The interaction between the three
factors of temperature, salinity and rearing density
was significant (P < 0.01).
The test for lack-of-fit of the two models was
significant (P < 0.0001). However, the square of
the lack-of-fit and pure error of the model equa-
tion were not significant (P > 0.05). In addition,
other conditions and factors as well as their inter-
action also had a slight influence. The coefficients
of determination (R2) of the model for growth and
survival were 0.9527 and 0.9890 respectively.
Adjusted coefficient (Adj-R2) and predictive coeffi-
cient (Pred-R2) were 0.9350 and 0.8986, respec-
tively, for the growth model, and were 0.9836
and 0.9686 for the survival model, respectively,
indicating that only a tiny portion of total varia-
tion could not be reflected accurately in the
model.
Influence of temperature, salinity and rearing
density on the accumulated growth rate
The factors that influenced growth significantly
were analysed by stepwise regression, which
determined the growth model. A surface analysis
was used to analyse the combined effects of
temperature, salinity and rearing density
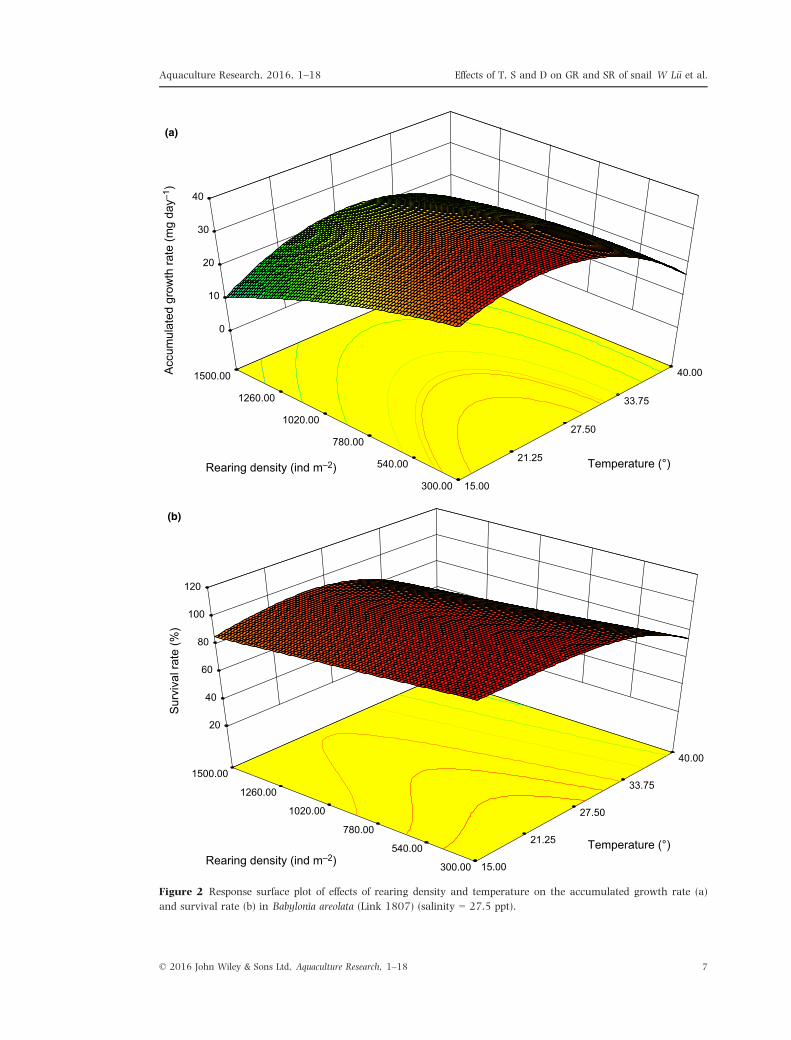
(Figs 2–4).As shown in Fig. 2a, the response surface plot
was an obvious oval, which indicated that there
was a very strong interaction between tempera-
ture and density within a certain range. When the
temperature was 21.5–27.5°C and the rearing
density was 300–780 ind m�2, the AGR was
32.25–39.90 mg day�1. When rearing density
was 300–1500 ind m�2, growth increased gradu-
ally with an increase in temperature. However,
when temperature exceeded 27.5°C, growth
tended to decline. Growth stopped at the highest
temperature. When the temperature was 15–40°C,growth declined gradually from lower to higher
rearing density. There was a gentle slope without
a peak value for the response surface, indicating
that when rearing density was within a certain
range, temperature was the important factor influ-
encing growth.
Figure 3a shows the effects of temperature and
salinity on growth of juveniles. When temperature
was 22.5–32.5°C and salinity was 24.5–32.5 ppt,
AGR was ~30 mg day�1, and the maximum
growth rate was as much as 32.5 mg day�1.
Accumulated growth rate varied with temperature
and salinity in a curvilinear fashion.
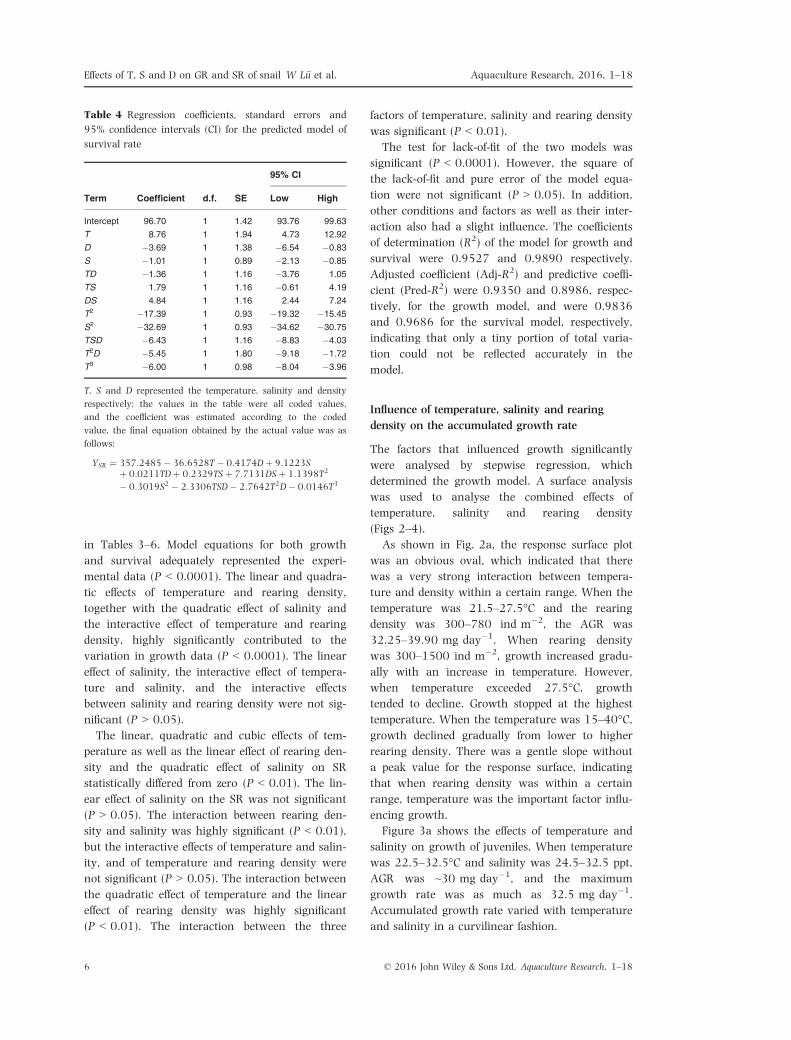
Table 4 Regression coefficients, standard errors and
95% confidence intervals (CI) for the predicted model of
survival rate
Term Coefficient d.f. SE
95% CI
Low High
Intercept 96.70 1 1.42 93.76 99.63
T 8.76 1 1.94 4.73 12.92
D �3.69 1 1.38 �6.54 �0.83
S �1.01 1 0.89 �2.13 �0.85
TD �1.36 1 1.16 �3.76 1.05
TS 1.79 1 1.16 �0.61 4.19
DS 4.84 1 1.16 2.44 7.24
T2 �17.39 1 0.93 �19.32 �15.45
S2 �32.69 1 0.93 �34.62 �30.75
TSD �6.43 1 1.16 �8.83 �4.03
T2D �5.45 1 1.80 �9.18 �1.72
T3 �6.00 1 0.98 �8.04 �3.96
T, S and D represented the temperature, salinity and density
respectively; the values in the table were all coded values,
and the coefficient was estimated according to the coded
value, the final equation obtained by the actual value was as
follows:
YSR ¼ 357:2485� 36:6528T � 0:4174Dþ 9:1223Sþ 0:0211TDþ 0:2329TSþ 7:7131DSþ 1:1398T2
� 0:3019S2 � 2:3306TSD� 2:7642T2D� 0:0146T3
© 2016 John Wiley & Sons Ltd, Aquaculture Research, 1–186
Effects of T, S and D on GR and SR of snail W L€u et al. Aquaculture Research, 2016, 1–18
300.00
540.00
780.00
1020.00
1260.00
1500.00
15.00
21.25
27.50
33.75
40.00
20
40
60
80
100
120
Sur
viva
l rat
e (%
)
(b)
300.00
540.00
780.00
1020.00
1260.00
1500.00
15.00
21.25
27.50
33.75
40.00
0
10
20
30
40
Acc
umul
ated
gro
wth
rate
(mg
day–
1 )
Rearing density (ind m–2)
Rearing density (ind m–2)
Temperature (°)
Temperature (°)
(a)
Figure 2 Response surface plot of effects of rearing density and temperature on the accumulated growth rate (a)
and survival rate (b) in Babylonia areolata (Link 1807) (salinity = 27.5 ppt).
© 2016 John Wiley & Sons Ltd, Aquaculture Research, 1–18 7
Aquaculture Research, 2016, 1–18 Effects of T, S and D on GR and SR of snail W L€u et al.
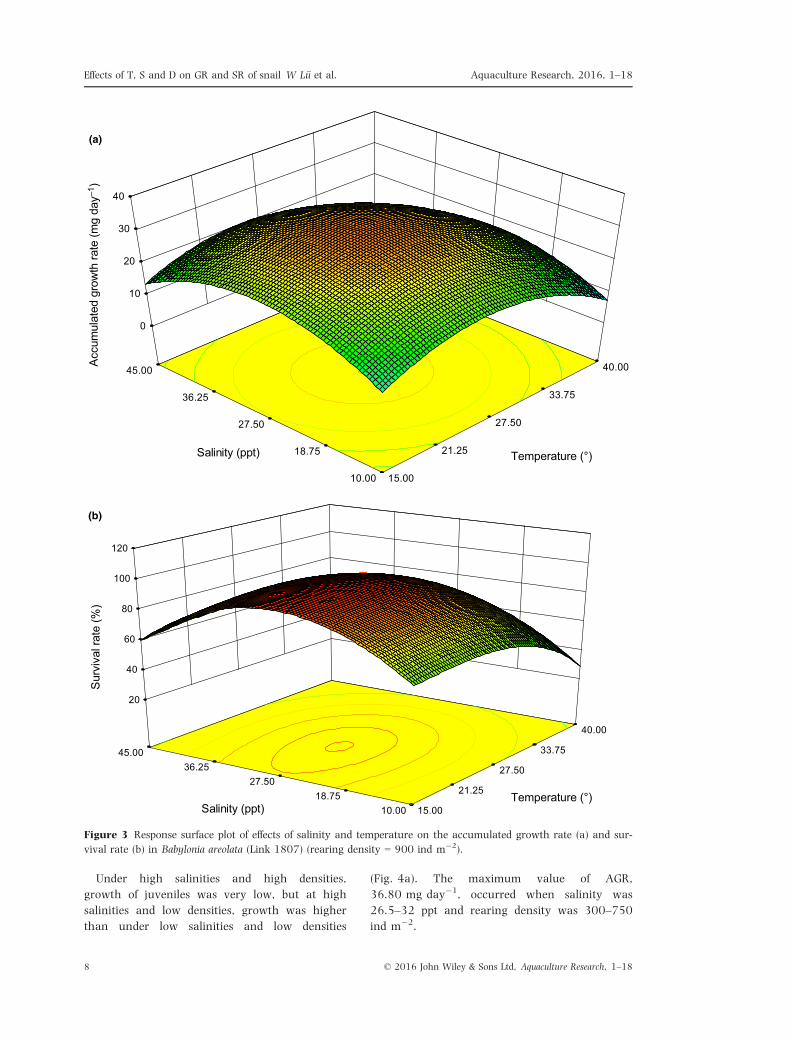
Under high salinities and high densities,
growth of juveniles was very low, but at high
salinities and low densities, growth was higher
than under low salinities and low densities
(Fig. 4a). The maximum value of AGR,
36.80 mg day�1, occurred when salinity was
26.5–32 ppt and rearing density was 300–750ind m�2.
10.00 18.75
27.50 36.25
45.00
15.00
21.25
27.50
33.75
40.00
20
40
60
80
100
120
Sur
viva
l rat
e (%
)
(b)
10.00
18.75
27.50
36.25
45.00
15.00
21.25
27.50
33.75
40.00
0
10
20
30
40
Acc
umul
ated
gro
wth
rate
(mg
day–
1 )
Salinity (ppt)
Salinity (ppt)
Temperature (°)
Temperature (°)
(a)
Figure 3 Response surface plot of effects of salinity and temperature on the accumulated growth rate (a) and sur-
vival rate (b) in Babylonia areolata (Link 1807) (rearing density = 900 ind m�2).
© 2016 John Wiley & Sons Ltd, Aquaculture Research, 1–188
Effects of T, S and D on GR and SR of snail W L€u et al. Aquaculture Research, 2016, 1–18

Influence of temperature, salinity and rearing
density on survival rate
Graphical representations of response surface are
shown in Figs 2–4b to illustrate the effects of
temperature, salinity and rearing density on
survival of juveniles.
The combined effects of temperature and rearing
density on survival are shown in Fig. 2b. The plot
had a ridged shape, and the ridge was found when
10.00
18.75
27.50
36.25
45.00
300.00 540.00
780.00 1020.00
1260.00 1500.00
20
40
60
80
100
120
Sur
viva
l rat
e (%
)
Rearing density (ind m–2) Salinity (ppt)
(b)
10.00
18.75
27.50
36.25
45.00
300.00
540.00
780.00
1020.00
1260.00
1500.00
0
10
20
30
40
Acc
umul
ated
gro
wth
rate
(mg
day
–1)
Rearing density (ind m–2) Salinity (ppt)
(a)
Figure 4 Response surface plot of effects of salinity and rearing density on the accumulated growth rate (a) and
survival rate (b) in Babylonia areolata (Link 1807) (temperature = 27.5°C).
© 2016 John Wiley & Sons Ltd, Aquaculture Research, 1–18 9
Aquaculture Research, 2016, 1–18 Effects of T, S and D on GR and SR of snail W L€u et al.

temperature was ~27.5°C, and the rearing density
was 300–1000 ind m�2, with the highest value
being up to 99.6% or even 100%. When the tem-
perature was 15–30°C and rearing density was
300–1500 ind m�2, the shape of the survival sur-
face was approximately planar, indicating B. areo-
lata with different rearing densities could survive
in this temperature range. However, when the
temperature exceeded 30°C, no matter the rearing
density, SR declined, indicating that temperature
played a more important role on survival than
rearing density.
Figure 3b illustrates the effects of salinity and
temperature on SR. The plot was semi-circular,
indicating that there was no interaction in the
integrated effects of temperature and salinity on
survival. For salinity ranges from 25 to 30 ppt,
and temperature ranges from 24.5 to 29.5°C, thehighest survival point reached 97.92%.
In Fig. 4b, the response surface plot was an oval,
which indicated that the effect of the density and
salinity on survival was obvious. In addition, there
were interactive effects. When temperature was
25–30°C, and rearing density was 300–800 ind m�2,
SR was ~97.17%, and the maximum SR could be
up to 99.99%. When the rearing density was in
a certain range and the salinity extended from
the lower point to the higher point, there was a
peak value and the peak value was 25–30 ppt.
However, when the salinity remained in a certain
range, and rearing density increased gradually
from the lower point to the higher point; the plot
had as a gentle slope with no peak value. The
change in SR was small, indicating that the effects
of rearing density on survival varied with salinity.
Optimization
According to the growth and survival models, the
two factor conditions (where the central composite
of one variable remained constant and the other
two variables were optimized) and three factor
conditions were optimized. The optimized results
are found in Table 7.
The optimization theory of Montgomery (2005)
was used to optimize experimental conditions,
growth and survival models were simultaneously
optimized. For the combination of a temperature of
26.89°C, a salinity of 28.27 ppt and a rearing
density of 605.9 ind m�2, the maximum value
of the AGR was 37.21 mg day�1 and the desir-
ability function value was 98.43%. When the
temperature, salinity and rearing density were
26.32°C, 28.14 ppt and 624.04 ind m�2, respec-
tively, the SR was to 99.79%, with a desirability
function value of 99.20%. By optimizing the RSM,
the optimal point was found at a temperature of
26.81°C, a salinity of 28.76 ppt and a rearing
density of 527.07 ind m�2. Under these condi-
tions, the optimal AGR and survival were
36.84 mg day�1 and 99.99%, respectively, with a
desirability value of 99.71%.
Discussion
The linear effects of temperature, salinity and
rearing density
From this study, it is clear that the linear and
quadratic effects and even the cubic effect (for SR)
of the temperature were significant, which indi-
cated that temperature was the most important
factor for growth and survival of juveniles
(Tables 5 and 6). Meanwhile, the analysis of the
models demonstrated that temperature, salinity
and rearing density all in some extent affect the
growth and survival of juveniles. Our experiment
indicated that growth rate of juveniles was propor-
tional to temperature within certain range. How-
ever, when temperature was more than some
threshold, the AGR had an obvious negative corre-
lation with temperature. These results are consis-
tent with conclusions from another study on the
Table 5 Analysis of variance table for the quadratic
model of the response, accumulated growth rate
Source SS d.f. MS F-value P-value
Model 6313.61 9 701.51 53.71 <0.0001
T 325.83 1 325.83 24.95 <0.0001
D 1187.01 1 1187.01 90.89 <0.0001
S 3.26 1 3.26 0.25 0.6217
TD 392.04 1 392.04 30.02 <0.0001
TS 7.48 1 7.48 0.57 0.4565
DS 0.83 1 0.83 0.063 0.8033
T2 2700.51 1 2700.51 206.78 <0.0001
D2 121.92 1 121.92 9.34 0.0054
S2 2751.35 1 2751.35 210.67 <0.0001
Residual 313.44 24 13.06
Lack-of-fit 245.50 5 49.10 13.73 <0.0001
Pure error 67.94 19 3.58
Total 6627.06 33
T, S and D represented the temperature, salinity and
density respectively; R2 = 0.9527, Adj-R2 = 0.9350, Pred-
R2 = 0.8986.
© 2016 John Wiley & Sons Ltd, Aquaculture Research, 1–1810
Effects of T, S and D on GR and SR of snail W L€u et al. Aquaculture Research, 2016, 1–18

effects of temperature and salinity on growth and
survival of B. areolata (Xue et al. 2010). Similar
results have been found in other studies of ontoge-
nesis, growth and survival of other molluscs,
including Pecten maximus (Chauvaud, Thouzeau &
Paulet 1998; Laing 2000) and Ruditapes philip-
pinarum (Munari, Matozzo & Marin 2011).
Temperature had a significant impact on growth
and survival of B. areolata in a curvilinear fashion,
especially for the effect of high temperature on sur-
vival (Tables 3 and 4). Some researchers posited
high temperature would cause larvae to consume
more energy and decline in resistance to infection,
resulting in a mass propagation of pathogenic bac-
teria. Le, Renault and G�erard (1996) studied the
transmission of infection of viruses in the body of
oyster larvae, and found that 80–90% of oyster
larvae died when temperature was 25–26°Cinstead of 22–23°C, and that an increase in envi-
ronmental temperature would cause the viral
infection to become dominant. Some studies have
reported that high temperature led to a decline of
the immune capability of shellfish. Hegaret, Wik-
fors, Soudant, Delaporte, Alix, Smith, Dixon,
Quere, Le Coz, Paillard, Moal and Samain (2004)
found that an increase in temperature caused
ecphysesis and a decline in the phagocytic capac-
ity and polymerization ability of the haemocyte,
resulting in a loss of immune capability in Cras-
sostrea virginica. Chen et al. (2007) reported that
Chlamys farreri had different immunological reac-
tions to widely different temperatures. When tem-
perature was 28°C, number of cells after 72 h
with phagocytic function in the haemolymph in
the body of the shellfish declined, and activity of
acid phosphatase was reduced. No change
occurred at 11°C, indicating that the immune
Table 7 Model optimized the best combination of factors for two response
Optimal type Factor number Response Optimal value
Optimal point 95% CI
DesirabilityT S D Low High
Single optimization 2 AGR 29.23 26.37 27.39 900 27.21 35.24 99.12
SR 97.92 25.29 27.56 900 94.68 100.63 93.60
AGR 30.80 27.20 27.5 637.90 32.35 38.57 98.03
SR 99.90 27.5 27.5 300 97.23 108.53 100
AGR 36.28 27.5 29.21 441.61 33.29 39.27 99.35
SR 99.90 27.5 27.5 300 94.99 104.40 100
3 AGR 37.21 26.89 28.27 605.90 34.67 40.41 98.43
SR 99.79 26.32 28.14 624.04 95.96 104.90 99.20
Simultaneous optimization 2 AGR 30.21 26.03 27.50 900 29.19 35.22 95
SR 97.77 94.79 100.78
AGR 38.98 26.88 27.5 415.30 35.65 42.30 100
SR 99.80 98.69 108.09
AGR 36.63 27.5 27.49 394.55 33.37 39.88 99.8
SR 99.92 96.92 106.90
3 AGR 36.84 26.81 28.76 527.07 33.91 39.71 99.71
SR 99.99 96.47 105.24
T, S and D represented the temperature, salinity and density respectively; AGR and SR represented the accumulated growth rate
and survival rate respectively; Units in the table: AGR (mg day�1), SR (%), T (°C), S (ppt), D (ind m�2), Desirability (%).
Table 6 Analysis of variance table for the quadratic
model of the response, survival rate
Source SS d.f. MS F-value P-value
Model 42 575.19 11 3870.47 180.38 <0.0001
T 435.87 1 435.87 20.31 0.0002
D 153.76 1 1573.76 7.17 0.0138
S 27.71 1 27.71 1.29 0.2680
TD 29.40 1 29.40 1.37 0.2543
TS 51.30 1 51.30 2.39 0.1363
DS 374.91 1 374.91 17.47 0.0004
T2 7468.19 1 7468.19 348.06 <0.0001
S2 26 394.03 1 26 394.03 1230.10 <0.0001
TSD 661.65 1 661.65 30.84 <0.0001
T2D 196.69 1 196.69 9.17 0.0062
T3 797.85 1 797.85 37.18 <0.0001
Residual 472.05 24 21.46
Lack-of-fit 352.24 5 117.41 18.62 <0.0001
Pure error 119.81 19 6.31
Total 43 047.24 33
T, S and D represented the temperature, salinity and
density respectively; R2 = 0.9890, Adj-R2 = 0.9836, Pred-
R2 = 0.9686.
© 2016 John Wiley & Sons Ltd, Aquaculture Research, 1–18 11
Aquaculture Research, 2016, 1–18 Effects of T, S and D on GR and SR of snail W L€u et al.

capability of C. farreri declined at high tempera-
ture, while the shellfish displayed low temperature
resistance.
Salinity is usually considered a ‘masking factor’
in aquaculture (Claireaux & Lagardere 1999; Con-
ides & Glamuzina 2001), and it affects growth and
survival of marine spat. Numerous studies have
evaluated the effects of salinity on the performance
of univalve spat (Cheung & Lam 1995; Nielsen &
Gosselin 2011; Montory, Chaparro, Pechenik, Die-
derich & Cubillos 2014; Zhang, Cheung & Shin
2014). Different molluscs have different suitable
salinity ranges for growth and survival in an
otherwise equivalent environment. Best spat
growth and maximum survival of Saccostrea glom-
erata were found at a salinity of 35 ppt and a tem-
perature of 30°C, and a salinity of 30 ppt and a
temperature of 23°C respectively (Dove & O’Con-
nor 2007). Irrespective of temperature, high SR of
juveniles of the pearl oyster, Pinctada imbricate,
was found at salinities of 32 and 35 ppt (O’Connor
& Lawler 2004). Condition index was not affected
by salinity of 26–30 ppt at any of the tempera-
tures tested in P. maximus (Ian Laing 2002). How-
ever, molluscs of the same species found in
different populations can become acclimatized to
different saline environments. The Little Point and
Lowe’s Cove are centres of oyster culture in the
Damariscotta River estuary in Maine. Salinity was
slightly higher at Lowe’s Cove (32 � 2 ppt) than
at Little Point (30 � 3 ppt), but the cumulative
mortality of Ostrea edulis was greater (45.8%) at
Little Point (where the salinity range was wider)
than at Lowe’s Cove (26.7%, where the salinity
range was narrower) (Carnegie & Barber 2001).
In our experiment, growth and survival of B. areo-
lata juveniles increased with increased salinity
when salinity ranged from 15 to 32 ppt and tem-
perature was within a suitable range. Maximum
growth and survival for B. areolata was obtained
at salinities of 24–31 ppt; in contrast, optimal
salinity for growth and survival of B. areolata (pop-
ulation in Hainan) was 26–30 ppt (Xue et al.
2010). Natural habitats of B. areolata (population
in Thailand) may occasionally be subjected to
lower salinity conditions due to increased freshwa-
ter input from the Mae Ping River and from land
runoff following heavy rainfall. However, B. areo-
lata is mainly distributed near Hainan Island in
the South China sea and the salinity range is nar-
rower than Chiengmai in Thailand South sea
(Zhao, Liu & Fu 2012).
The mechanism for the effect of salinity is not
entirely clear. There are two ways for animals to
endure changing saline concentrations in external
environments (P�equeux, Vallota & Gilles 1979;
P�equeux, Bianchini & Gilles 1996). Animals can
be osmoconformers. However, osmoconformers do
not adjust osmotic pressure well, since the osmotic
pressure of the bodily fluid is similar to that of the
external environment (P�equeux et al. 1996).
When ambient salinity increases, the weight of the
animals will decrease due to dehydration; when
the salinity decreases, their weight will increase
due to osmosis. Lange (1970) demonstrated that
isosmotic intracellular regulation was incomplete
in the scallop Pecten septemradiatus Mueller, lead-
ing to an increase in volume of muscle tissue with
a decrease in sea water salinity. In our study,
growth and survival of juvenile B. areolata dramat-
ically decreased with salinity when salinity was
below ~20 ppt, and both temperature and rearing
density were within a suitable range. However,
juveniles can survive for a long time in a higher
saline environment (~32–38 ppt). Carregosa, Fig-
ueira, Gil, Pereira, Pinto, Soares and Freitas
(2014) found that Venerupis philippinarum had
high mortality at lower salinities (0 and 7ppt), but
tolerated high salinities (35 and 42 ppt). A decline
in growth and survival at low salinities has been
found in other molluscs including Argopecten
prupruatus (Navarro & Gonzalez 1998), Venerupis
philippinarum (Carregosa et al. 2014) and P. max-
imus (Ian Laing 2002). As most marine inverte-
brates have a changing osmotic pressure,
gastropods have a slightly lower osmotic pressure
in bodily fluids than that of the seawater (Robert-
son 1964). Some gastropods therefore can adjust
to living in higher saline conditions. Osmoregula-
tors, such as Pleuronectiformes, Mugil, Gobius, Ory-
zias and other hard-bone fish, are able to live
varied salinities, while maintaining a constant
bodily fluid concentration.
Rearing density factor, a husbandry parameter,
plays an important role in ivory snail aquaculture.
Rearing density had significant impacts on growth
and survival of B. areolata in a curvilinear (nearly
linear) fashion (Tables 5 and 6, P < 0.01). Growth
and survival was relatively stable before reaching
the optimal rearing density (~600 ind m�2), but
gradually declined with increasing rearing density
when temperature and salinity were within a suit-
able range. The minimum values for growth
and survival of juveniles were found at a rearing
© 2016 John Wiley & Sons Ltd, Aquaculture Research, 1–1812
Effects of T, S and D on GR and SR of snail W L€u et al. Aquaculture Research, 2016, 1–18

density of 1500 ind m�2 (maximum value in this
experimental design). However, Chaitanawisuti
and Kritsanapuntu (1998) reported that growth,
in both shell length and body weight, and survival
of juvenile B. areolata were not affected by stock-
ing rearing density using component experimental
design (50, 100, 150 and 200 ind m�2). The dif-
fering results can be explained in two ways. First,
there are differences between stocks and cultiva-
tion sites. Next, the range of rearing densities was
very narrow in the experiment of Chaitanawisuti
and Kritsanapuntu (1998). MacDonald (1988)
reported that high larval densities led to decreases
in ingestion rates, oxygen consumption and
growth efficiency. Conides and Glamuzina (2001)
found that overcrowding of hatched Dicentrarchus
labrax larvae might cause a rapid decrease in
available dissolved oxygen and subsequent
increased larval mortality. Growth and survival
larval Apostichopus japonicus were limited by
higher rearing density in laboratory and field
investigations (Li & Li 2010). The negative effects
of high rearing density on growth and survival of
economic aquaculture animals suggests there is
rearing density-dependent intraspecific competition
for space and food (Parsons & Dadswell 1992;
Foster & Stiven 1996; Huchette, Koh & Day
2003; Yan, Zhang & Yang 2006; Raghavan &
Gopinathan 2008; Velasco & Barros 2008). Water
quality is important for growth and survival of
B. areolata. Reduced growth and survival at higher
rearing densities may be attributable to a deterio-
ration of water quality (De Blok1972; Kinne1976;
Raghavan & Gopinathan 2008). B. areolata is an
opportunistic scavenger, and dead fresh or decom-
posed organisms can serve as food. Therefore,
excretory products are mostly composed of
nitrogenous compounds, largely ammonia, which
is the major component of the protein catabolism
(De Blok 1972; Colt & Armstrong 1981). Ammo-
nia is usually identified as a toxic metabolite
beyond a certain threshold, and increases with
increased rearing density. Thus, higher rearing
densities are adverse for B. areolata aquaculture.
The phenomena of residual feeds, increased patho-
genic bacteria and excessive energy expenditure
for cultured marine animals may occur in condi-
tions of high rearing density (Loosanoff & Davis
1963; Mgaya & Mercer 1995; Capinpin, Toledo,
Encena & Doi 1999; Liu, Dong, Tang, Zhang &
Xiang 2006; Liu, Gurney-Smith, Beerens & Pearce
2010).
The quadratic effects of temperature, salinity and
rearing density
The model equation for AGR established by CCRD
and stepwise regression was used to perform a
variance analysis of the various coefficients, indi-
cating that the quadratic effects of the tempera-
ture, salinity and rearing density were significant
(shown in Table 5, P < 0.01). There was, thus, a
peak value that existed for the effects of these
three factors on the AGR. The quadratic effects of
temperature and salinity on the survival of juve-
niles were highly significant except for the effect of
rearing density. The cubic effect of density and the
interactive effect between the three factors (tem-
perature, salinity and rearing density) were signifi-
cant. This means that rearing density, salinity and
temperature act on survival synergistically. Tem-
perature and salinity may modify the effect of rear-
ing density and change the suitable rearing
density range for metabolism, energy budgets and
oxygen expenditure of B. areolata. Likewise, rear-
ing density can modify the effects of temperature
and salinity (Lough & Gonor 1973).
The synergistic effect of temperature, salinity and
rearing density
The model of AGR and the response surface
obtained using the equation indicated that when
rearing density level was in the experimental
range (300–900 ind m�2), temperature and salin-
ity affected the outcome of the experiment, and
there was no obvious interaction between them in
the experimental range. Xue et al. (2010) found
that there was an interaction between temperature
and salinity on growth of B. areolata under range
of temperature from 26 to 30°C and salinity range
from 26 to 30 ppt. Reasons for the contrasting
results were follows: (1) This research studies the
effects of temperature and salinity on the growth
and survival of juvenile babylon under different
rearing density. However, in the research of XUE,
it studies the effects of temperature and salinity on
the growth and survival of juvenile spotted baby-
lon under the same rearing density (400 ind m�2).
(2) As to the shell length and weight, the juvenile
used by this study (shell length:
16.38 � 1.04 mm, body weight: 0.87 � 0.24 g)
is larger than that of Xue study (shell length:
9.77 � 0.73 mm, body weight: 0.17 � 0.26 g).
(3) In this study, the parent of B. areolata was
© 2016 John Wiley & Sons Ltd, Aquaculture Research, 1–18 13
Aquaculture Research, 2016, 1–18 Effects of T, S and D on GR and SR of snail W L€u et al.

introduced from Thailand. However, the objects of
Xue study are aquaculture species of Xiamen,
China. (4) The research cycles of the two studies
are different, the experimental cycle of Xue study
is 42 days and that of this research is 60 days.
When considering the effect of different rearing
densities and salinities on growth, we found that
there was a strong interaction between tempera-
ture and rearing density, and that the interaction
had covered the synergistic effect of temperature
and salinity to a certain extent. Castagne and
Chanley (1973) thought that in most cases, tem-
perature mainly influenced the reaction speed of
the organism to salinity, but could not change the
tolerance limit to salinity. Only when temperature
and/or salinity approached the limits of its range,
the composite influence of the temperature and
salinity would show an obvious correlation. When
one of them was in the tolerable range, no obvious
interaction occurred.
There was a strong interaction between temper-
ature and rearing density in the model (P < 0.01).
Within a certain temperature and rearing density
range, when the temperature increased gradually
and the rearing density declined gradually, the
AGR increased gradually. But when the tempera-
ture and rearing density rose in the same direc-
tion, the AGR declined gradually. Yang, Zheng
and Li (2008) reported that when the temperature
was 34°C, growth of B. areolata was seriously
affected, and when rearing density increased or
the quantity of exchanged water declined, mass
mortality occurred. The reasons why a decline in
growth of the AGR was caused by high tempera-
ture and high rearing density might be as follows:
(1) Generally, B. areolata perch in the sand layer
when feeding, however, if rearing density was too
high, there would not be enough space in the
crowded sand layer, which increases the probabil-
ity of physical collision and associated damage,
and the healing process would slow growth rate
(Foster & Stiven 1996; Huchette et al. 2003; Yan
et al. 2006; Raghavan & Gopinathan 2008; Krit-
sanapuntu, Chaitanawisuti, Santhaweesuk & Nat-
sukari 2009). (2) If temperature and rearing
densities were high, a change in the physicochemi-
cal properties of water, and an associated decline
in water quality, in the breeding tank would
occur. Kritsanapuntu, Chaitanawisuti, San-
thaweesuk and Natsukari (2006) stated that if
breeding occurred at high rearing densities, meta-
bolism would increase and ammonia and nitrite
concentration would increase, leading to a decline
in the water quality. Concentrations of NH3
increase with rising temperatures and pH and
decrease with elevated salinity (Downing & Mer-
kens 1955). Huchette et al. (2003) examined rear-
ing density and growth in H. rubra. They found
differences in ammonia levels between stocking
densities, and a decreased growth rate with varia-
tion in water quality in the bottom of tanks. How-
ever, no study has examined the effects of
ammonia, temperature and rearing density on
B. areolata, though some have examined the effects
of ammonia, salinity, rearing density and tempera-
ture on gastropods (Patterson, Edward & Ayyak-
kannu 1996; Cheung 1997; Basuyaux & Mathieu
1999; Huchette et al. 2003; Chaparro, Montory,
Pechenik, Cubillos, Navarro & Osores 2011; Cha-
parro, Segura, Osores, Pechenik, Pardo & Cubillos
2014). (3) Higher rearing density can change the
physical and chemical composition of the organ-
isms. Tolussi, Hilsdorf, Caneppele and Moreira
(2010) reported that rearing density would influ-
ence the lipid metabolism of fish, and content of
saturated fatty acids and fats would decrease with
high rearing density. High temperatures and rear-
ing densities would promote the activity of pro-
teins in the body and generate immune responses;
thus growth would decrease.
In the model for SR, the interactive effects of
salinity and rearing density were significant
(P < 0.01). When salinity and rearing density
increased in the same direction, SR would tend to
decrease. When salinity was near its maximum
value, SR decreased more dramatically, even
trending to zero. With an increase in salinity,
specific alkalinity would decline, resulting in an
imbalance of the carbonate system, and causing
an increase in calcium carbonate precipitation in
the seawater and a lack in the free calcium ion
(Jiang, Tyrrell, Hydes, Dai & Hartman 2014). Cal-
cium is a critical element in shelled molluscs. Cal-
cium is also important in muscle contraction,
neural signal conduction, hormone secretion and
osmotic regulation (Coote, Hone, Kenyon &
Maguire 1996; Chaitanawisuti, Sungsirin & Piyati-
ratitivorakul 2010; Ding, Chen, Sui & Wang
2010). Rearing density can influence the shell
shape of molluscs. In our study, there was a signif-
icant interaction between temperature, salinity
and rearing density on survival. When tempera-
ture was within a suitable range, the maximum
SR that varied with different salinities depended on
© 2016 John Wiley & Sons Ltd, Aquaculture Research, 1–1814
Effects of T, S and D on GR and SR of snail W L€u et al. Aquaculture Research, 2016, 1–18

rearing density. In the same way, when salinity
was fixed at ~29 ppt, the maximum SR that varied
with different temperature depended upon rearing
density and vice versa. The synergistic effects of
three factors (temperature, salinity and rearing
density) on survival of B. areolata may be caused
by the characteristics of the species and should be
studied in further research.
Model establishment and optimization
Central composite rotatable design was used in
this study. The continuous variable surface growth
and survival models of B. areolata were established
using the RSM (Montgomery 2005; Wang, Liu
et al. 2014; Wang, Zhu et al. 2014). The goodness
of fit for model equations of AGR (R2 = 0.9527;
Adj-R2 = 0.9350; Pre-R2 = 0.8986) and SR
(R2 = 0.9890; Adj-R2 = 0.9836; Pre-R2 = 0.9686)
illustrates the adequacy of two models. By opti-
mization of the RSM, the optimal point was found
at a temperature of 26.81°C, a salinity of 28.76
ppt and a rearing density of 527.07 ind m�2.
Under these conditions, the optimal AGR and SR
were 36.84 mg day�1 and 99.99%, respectively,
with a satisfaction function value 99.71%. In fact,
the growth and survival of B. areolata might as
well be affected by many other factors except for
these three factors involved in this paper, and
within a certain range, a strong interaction may
exist among these factors. Because the relationship
among the various factors was complex, and some
factors are not easily manipulated experimentally,
more factors related to the growth and survival of
B. areolata should be studied in the future.
Acknowledgments
This study was funded by the Earmarked Fund for
Modern Agro-industry Technology Research Sys-
tem (no. CARS-48).
References
Basuyaux O. & Mathieu M. (1999) Inorganic nitrogen
and its effect on growth of the abalone Haliotis tubercu-
lata Linnaeus and the sea urchin Paracentrotus lividus
Lamarck. Aquaculture 174, 95–107.
Bricelj V.M. & Shumway S.E. (1991) Physiology: energy
acquisition and utilization. In: Scallops Biology, Ecology
and Aquaculture, Vol. 3 (ed. by S.E. Shumway), pp.
05–337. Elsevier, Amsterdam, the Netherlands.
Capinpin E.C., Toledo J.D., Encena V.C. & Doi M. (1999)
Rearing density dependent growth of the tropical aba-
lone Haliotis asinina in cage culture. Aquaculture 171,
227–235.
Carnegie R.B. & Barber B.J. (2001) Growth and mortality
of Ostrea edulis at two sites on the Damariscotta River
estuary, Maine, USA. Journal of the World Aquaculture
Society 32, 221–227.
Carregosa V., Figueira E., Gil A.M., Pereira S., Pinto J.,
Soares A. & Freitas R. (2014) Tolerance of Venerupis
philippinarum to salinity: osmotic and metabolic
aspects. Comparative Biochemistry and Physiology a-
Molecular & Integrative Physiology 171, 36–43.
Castagne M. & Chanley P. (1973) Salinity tolerance of
some marine bivalves from inshore and estuarine envi-
ronments in virginia waters on the western Mid-Atlan-
tic coast. Malaclogia 12, 47–96.
Chaitanawisuti N. & Kritsanapuntu A. (1998) Growth
and survival of hatchery-reared juvenile spotted Baby-
lon, Babylonia areolata Link 1807 (Neogastropoda: Buc-
cinidae), in four nursery culture conditions. Journal of
Shellfish Research 17, 85–88.
Chaitanawisuti N., Sungsirin T. & Piyatiratitivorakul S.
(2010) Effects of dietary calcium and phosphorus sup-
plementation on the growth performance of juvenile
spotted Babylonia areolata culture in a recirculating cul-
ture system. Aquaculture International 18, 303–313.
Chaparro O.R., Montory J.A., Pechenik J.A., Cubillos
V.M., Navarro J.M. & Osores S.J. (2011) Ammonia
accumulation in the brood chamber of the estuarine
gastropod Crepipatella dilatata: how big a problem for
mothers and brooded embryos? Journal of Experimental
Marine Biology and Ecology 410, 29–38.
Chaparro O.R., Segura C.J., Osores S.J.A., Pechenik J.A.,
Pardo L.M. & Cubillos V.M. (2014) Consequences of
maternal isolation from salinity stress for brooded
embryos and future juveniles in the estuarine direct-
developing gastropod Crepipatella dilatata. Marine Biol-
ogy 161, 619–629.
Chauvaud L., Thouzeau G. & Paulet Y.M. (1998) Effects
of environmental factors on the daily growth rate of
Pecten maximus juveniles in the Bay of Brest (France).
Journal of Experimental Marine Biology and Ecology 227,
83–111.
Chen M.Y., Yang H.S., Delaporte M. & Zhao S.J. (2007)
Immune condition of Chlamys farreri in response to acute
temperature challenge. Aquaculture 271, 479–487.
Cheung S.G. (1997) Physiological and behavioural
responses of the intertidal scavenging gastropod Nas-
sarius festivus to salinity changes. Marine Biology 129,
301–307.
Cheung S.G. & Lam S.W. (1995) Effect of salinity, tem-
perature and acclimation on oxygen consumption of
Nassarius festivus (Powys, 1835) (Gastropoda: Nassari-
idae). Comparative Biochemistry and Physiology a-Phy-
siology 111, 625–631.
© 2016 John Wiley & Sons Ltd, Aquaculture Research, 1–18 15
Aquaculture Research, 2016, 1–18 Effects of T, S and D on GR and SR of snail W L€u et al.
Christophersen G. & Strand O. (2003) Effect of reduced
salinity on the great scallop (Pecten maximus) spat at
two rearing temperatures. Aquaculture 215, 79–92.
Claireaux G. & Lagardere J.P. (1999) Influence of temper-
ature, oxygen and salinity on the metabolism of the
European sea bass. Journal of Sea Research 42, 157–
168.
Colt J.E. & Armstrong D.A. (1981) Nitrogen toxicity to
crustaceans, fish, and mollusks. Bioengineering Sympo-
sium for Fish Culture 1, 34–47.
Conides A.J. & Glamuzina B. (2001) Study on the effects
of rearing density, temperature and salinity on hatch-
ing performance of the European sea bass, Dicentrar-
chus labrax (Linnaeus, 1758). Aquaculture International
9, 217–224.
Coote T.A., Hone P.W., Kenyon R. & Maguire G.B.
(1996) The effect of different combinations of dietary
calcium and phosphorus on the growth of juvenile
Haliotis laevigata. Aquaculture 145, 267–279.
De Blok J.W. (1972) Fish and invertebrate culture. Water
management in closed systems: (1970), S.H. Spotte.
John Wiley & Sons Inc., New York, London, Sydney,
Toronto, xiv + 145 + 29 ills., £4.25. Aquaculture 1,
233–234.
Ding F., Chen M., Sui N. & Wang B.S. (2010) Ca2+ sig-
nificantly enhanced development and salt-secretion
rate of salt glands of Limonium bicolor under NaCl
treatment. South African Journal of Botany 76, 95–101.
Dove M.C. & O’Connor W.A. (2007) Salinity and temper-
ature tolerance of Sydney rock oysters Saccostrea glom-
erata during early ontogeny. Journal of Shellfish
Research 26, 939–947.
Downing K.M. & Merkens J.C. (1955) The influence of
dissolved oxygen concentration on the toxicity of
unionised ammonia to rainbow trout (Salmo gairdnerii
Richardson). Annals of Applied Biology 43, 243–246.
Feng Y.Q., Zhou Y.C. & Li F.Y. (2009) Technology for
Large-scale breeding of spiral shell Babylonia areolata.
Fisheries Science of China 28, 209–213.
Foster B.A. & Stiven A.E. (1996) Experimental effects of
rearing density and food on growth and mortality of
the southern Appalachian land gastropod, Mesodon
normalis (Pilsbry). American Midland Naturalist 136,
300–314.
Gagnaire B., Frouin H., Moreau K., Thomas-Guyon H. &
Renault T. (2006) Effects of temperature and salinity
on haemocyte activities of the Pacific oyster, Cras-
sostrea gigas (Thunberg). Fish & Shellfish Immunology
20, 536–547.
Gardner J.P.A. & Thompson R.J. (2001) The effects of
coastal and estuarine conditions on the physiology and
survivorship of the mussels Mytilus edulis, M-trossulus
and their hybrids. Journal of Experimental Marine Biol-
ogy and Ecology 265, 119–140.
Hegaret H., Wikfors G.H., Soudant P., Delaporte M., Alix
J.H., Smith B.C., Dixon M.S., Quere C., Le Coz J.R.,
Paillard C., Moal J. & Samain J.F. (2004) Immunologi-
cal competence of eastern oysters, Crassostrea virginica,
fed different microalgal diets and challenged with a
temperature elevation. Aquaculture 234, 541–560.
Huchette S.M.H., Koh C.S. & Day R.W. (2003) Growth of
juvenile blacklip abalone (Haliotis rubra) in aquaculture
tanks: effects of rearing density and ammonia. Aquacul-
ture 219, 457–470.
Hutchinson S. & Hawkins L.E. (1992) Quantification of
the physiological responses of the European flat oyster
Ostrea edulis to temperature and salinity. Journal of
Molluscan Studies 58, 215–226.
Imsland A.K., Foss A., Gunnarsson S., Berntssen M.H.G.,
FitzGerald R., Bonga S.W., Von Ham E., Naevdal C. &
Stefansson S.O. (2001) The interaction of temperature
and salinity on growth and food conversion in juvenile
turbot (Scophthalmus maximus). Aquaculture 198, 353–
367.
Jiang Z.P., Tyrrell T., Hydes D.J., Dai M.H. & Hartman
S.E. (2014) Variability of alkalinity and the alkalinity-
salinity relationship in the tropical and subtropical sur-
face ocean. Global Biogeochemical Cycles 28, 729–742.
Kinne O. (1976) Marine Ecology, Vol. 3, pp. 1293. Wiley,
London, UK.
Kritsanapuntu S., Chaitanawisuti N., Santhaweesuk W. &
Natsukari S.Y. (2006) Combined effects of water
exchange regimes and calcium carbonate additions on
growth and survival of hatchery-reared juvenile spotted
babylon (Babylonia areolata Link 1807) in recirculating
grow-out system. Aquaculture Research 37, 664–670.
Kritsanapuntu S., Chaitanawisuti N., Santhaweesuk W.
& Natsukari Y. (2009) Effects of stocking rearing den-
sity and water exchange regimes on growth and sur-
vival of juvenile spotted babylon, Babylona areolata
(Link), cultured in experimental earthen ponds. Aqua-
culture Research 40, 337–343.
Laing I. (2000) Effect of temperature and ration on
growth and condition of king scallop (Pecten maximus)
spat. Aquaculture 183, 325–334.
Laing I. (2002) Effect of salinity on growth and survival
of king scallop spat (Pecten maximus). Aquaculture 205,
171–181.
Lange R. (1970) Isosmotic intracellular regulation and
euryhalinity in marine bivalves. Journal of Experimental
Marine Biology and Ecology 5, 170–179.
Le D.R., Renault T. & G�erard A. (1996) Effect of tempera-
ture on herpes-like virus detection among hatchery-
reared larval Pacific oyster Crassostre agigas. Diseases of
Aquatic Organisms 24, 149–157.
Li L. & Li Q. (2010) Effects of stocking rearing density,
temperature, and salinity on larval survival and
growth of the red race of the sea cucumber Aposticho-
pus japonicus (Selenka). Aquaculture International 18,
447–460.
Li X.D., Dong S.L., Lei Y.Z. & Li Y.G. (2007) The effect of
stocking rearing density of Chinese mitten crab Eri-
© 2016 John Wiley & Sons Ltd, Aquaculture Research, 1–1816
Effects of T, S and D on GR and SR of snail W L€u et al. Aquaculture Research, 2016, 1–18
ocheir sinensis on rice and crab seed yields in rice-crab
culture systems. Aquaculture 273, 487–493.
Liu B.Z., Dong B., Tang B.J., Zhang T. & Xiang J.J.
(2006) Effect of stocking rearing density on growth,
settlement and survival of clam larvae, Meretrix mere-
trix. Aquaculture 258, 344–349.
Liu W., Gurney-Smith H., Beerens A. & Pearce C.M.
(2010) Effects of stocking rearing density, algal rearing
density, and temperature on growth and survival of
larvae of the basket cockle, Clinocardium nuttallii. Aqua-
culture 299, 99–105.
Loosanoff V.L. & Davis H.C. (1963) Rearing of bivalve
mollusks. In: Advances in Marine Biology (ed. by F.S.
Russell), pp. 1–136. Academic Press, New York, NY,
USA.
Lough R.G. & Gonor J.J. (1973) A response-surface
approach to the combined effects of temperature and
salinity on the larval development of Adula californien-
sis (Pelecypoda: Mytilidae). I. survival and growth of
three and fifteen-day old larvae. Marine Biology 22,
241–250.
MacDonald B.A. (1988) Physiological energetics of japa-
nese scallop Patinopecten yessoensis larvae. Journal of
Experimental Marine Biology and Ecology 120, 155–
170.
Mgaya Y.D. & Mercer J.P. (1995) The effects of size grad-
ing and stocking rearing density on growth perfor-
mance of juvenile abalone, Haliotis tuberculata
Linnaeus. Aquaculture 136, 297–312.
Montgomery D.C. (2005) Design and Analysis of Experi-
ments (6th edn), pp. 231–258. John Wiley & Sons,
New York, USA.
Montory J.A., Chaparro O.R., Pechenik J.A., Diederich
C.M. & Cubillos V.M. (2014) Impact of short-term
salinity stress on larval development of the marine gas-
tropod Crepipatella fecunda (Calyptraeidae). Journal of
Experimental Marine Biology and Ecology 458, 39–45.
Munari M., Chinellato A., Matozzo V., Bressan M. &
Marin M.G. (2010) Combined effects of temperature,
salinity and pH on immune parameters in the clam
Chamelea gallina. Comparative Biochemistry and Physiol-
ogy a-Molecular & Integrative Physiology 157, S19–S19.
Munari M., Matozzo V. & Marin M.G. (2011) Combined
effects of temperature and salinity on functional
responses of haemocytes and survival in air of the
clam Ruditapes philippinarum. Fish & Shellfish Immunol-
ogy 30, 1024–1030.
Navarro J.M. & Gonzalez C.M. (1998) Physiological
responses of the Chilean scallop Argopecten purpuratus
to decreasing salinities. Aquaculture 167, 315–327.
Nielsen T.V. & Gosselin L.A. (2011) Can a scavenger
benefit from environmental stress? Role of salinity
stress and abundance of preferred food items in con-
trolling population abundance of the snail Lirabuccinum
dirum. Journal of Experimental Marine Biology and Ecol-
ogy 410, 80–86.
O’Connor W.A. & Lawler N.F. (2004) Salinity and tem-
perature tolerance of embryos and juveniles of the
pearl oyster, Pinctada imbricata Roding. Aquaculture
229, 493–506.
Parsons G.J. & Dadswell M.J. (1992) Effect of stocking
density on growth, production, and survival of the
giant scallop, Placopecten magellanicus, held in inter-
mediate suspension culture in Passamaquoddy Bay,
New Brunswick. Aquaculture 103, 191–309.
Patterson J., Edward J.K.P. & Ayyakkannu K. (1996)
Effect of salinity, starvation and feeding on ammonia
excretion of a mollusc Babylonia spirata (Neogas-
tropoda: Buccinidae). Indian Journal of Marine Sciences
25, 244–247.
P�equeux A., Vallota A.C. & Gilles R. (1979) Blood pro-
teins as related to osmoregulation in crustace. Compar-
ative Biochemistry and Physiology Part A: Physiology 64,
433–435.
P�equeux A., Bianchini A. & Gilles R. (1996) Mercury
and osmoregulation in the euryhaline crab, Eriocheir
sinensis. Comparative Biochemistry and Physiology Part
C: Pharmacology, Toxicology and Endocrinology 113,
149–155.
Raghavan G. & Gopinathan C.P. (2008) Effects of diet,
stocking rearing density and environmental factors on
growth, survival and metamorphosis of clam, Paphia
malabarica (Chemnitz) larvae (Retracted article. See vol.
39, pg. 928, 2012). Aquaculture Research 39, 928–
933.
Rico-Villa B., Pouvreau S. & Robert R. (2009) Influence
of food rearing density and temperature on ingestion,
growth and settlement of Pacific oyster larvae, Cras-
sostrea gigas. Aquaculture 287, 395–401.
Robertson J.D. (1964) Chapter 9 -Osmotic and Ionic Reg-
ulation. In: Physiology of Mollusca (ed. by K.M.W.M.
Yonge), pp. 283–311. Academic Press, New York, NY,
USA.
Rupp G.S. & Parsons G.J. (2004) Effects of salinity and
temperature on the survival and byssal attachment of
the lion’s paw scallop Nodipecten nodosus at its south-
ern distribution limit. Journal of Experimental Marine
Biology and Ecology 309, 173–198.
Silva E., Calazans N., Soares M., Soares R. & Peixoto S.
(2010) Effect of salinity on survival, growth, food con-
sumption and haemolymph osmolality of the pink
shrimp Farfantepenaeus subtilis (Perez-Farfante, 1967).
Aquaculture 306, 352–356.
Tolussi C.E., Hilsdorf A.W.S., Caneppele D. & Moreira
R.G. (2010) The effects of stocking rearing density in
physiological parameters and growth of the endan-
gered teleost species piabanha, Brycon insignis (Stein-
dachner, 1877). Aquaculture 310, 221–228.
Velasco L.A. & Barros J. (2008) Experimental larval
culture of the Caribbean scallops Argopecten nucleus
and Nodipecten nodosus. Aquaculture Research 39, 603–
618.
© 2016 John Wiley & Sons Ltd, Aquaculture Research, 1–18 17
Aquaculture Research, 2016, 1–18 Effects of T, S and D on GR and SR of snail W L€u et al.

Verween A., Vincx M. & Degraer S. (2007) The effect of
temperature and salinity on the survival of Mytilopsis
leucophaeata larvae (Mollusca, Bivalvia): the search for
environmental limits. Journal of Experimental Marine
Biology and Ecology 348, 111–120.
Wang H., Liu J.H. & Yang H.S. (2014) Effect of simultane-
ous variation in temperature and ammonia concentra-
tion on percent fertilization and hatching in Crassostrea
ariakensis. Journal of Thermal Biology 41, 43–49.
Wang H., Zhu X.W., Wang H.Z., Qiang J., Xu P. & Li
R.W. (2014) Joint effect of temperature, salinity and
pH on the percentage fertilization and hatching of Nile
tilapia (Oreochromis niloticus). Aquaculture Research 45,
259–269.
Xue M., Ke C.H., Wang D.X., Wei Y.J. & Xu Y.B. (2010)
The combined effects of temperature and salinity on
growth and survival of hatchery-reared juvenile spot-
ted Babylon, Babylonia areolata (Link 1807). Journal of
the World Aquaculture Society 41, 116–122.
Yan X.W., Zhang G.F. & Yang F. (2006) Effects of diet,
stocking rearing density, and environmental factors on
growth, survival, and metamorphosis of Manila clam
Ruditapes philippinarum larvae. Aquaculture 253, 350–
358.
Yang Z.W., Zheng Y.F. & Li Z.L. (2008) The preliminary
test in the effect of temperature on the Growth and
feeding Babylonia areolata. Chinese Journal of Fujian
Fisheries 1, 23–26.
Zhang H.Y., Cheung S.G. & Shin P.K.S. (2014) The lar-
vae of congeneric gastropods showed differential
responses to the combined effects of ocean acidifica-
tion, temperature and salinity. Marine Pollution Bulletin
79, 39–46.
Zhao B.H., Liu Y.D. & Fu B.Y. (2012) The South
China Sea salinity front spatial distribution inter–
annual variability. Marine Forecasts of China 9, 74–
83.
Zheng H.P., Ke C.H., Zhou S.Q. & Li F.X. (2005) Effects
of starvation on larval growth, survival and metamor-
phosis of Ivory shell Babylonia formosae habei Altena
et al., 1981 (Neogastropoda: Buccinidae). Aquaculture
243, 357–366.
© 2016 John Wiley & Sons Ltd, Aquaculture Research, 1–1818
Effects of T, S and D on GR and SR of snail W L€u et al. Aquaculture Research, 2016, 1–18