Baby boomers expectations of residential aged care
43
B B a a b b y y B B o o o o m m e e r r s s E E x x p p e e c c t t a a t t i i o o n n s s o o f f R R e e s s i i d d e e n n t t i i a a l l A A g g e e d d C C a a r r e e Final Report – August 2009 Dr Rodney Jilek
-
Upload
dr-rodney-jilek -
Category
Healthcare
-
view
17 -
download
1
Transcript of Baby boomers expectations of residential aged care

BBaabbyy BBoooommeerrss
EExxppeeccttaattiioonnss
ooff
RReessiiddeennttiiaall
AAggeedd CCaarree
Final Report – August 2009
Dr Rodney Jilek

Baby Boomers Expectations of Residential Aged Care – Dr Rodney Jilek - August 2009 2
Table of Contents
1. Introduction ............................................................................................................................................... 3 2. Method ....................................................................................................................................................... 5 3. Results - Demographic Data .................................................................................................................. 6 (a) Marital Status ............................................................................................................................................. 6 (b) Employment Status................................................................................................................................... 7 (c) Assets .......................................................................................................................................................... 7 (d) Superannuation ........................................................................................................................................ 8 (e) Gross Annual Income .............................................................................................................................. 8 (f) Employment Status................................................................................................................................... 9 (g) Gender ....................................................................................................................................................... 9 (h) Region of Birth ......................................................................................................................................... 10 (i) Religious Denomination ........................................................................................................................ 11 4. Results – Accommodation.................................................................................................................... 13 (a) Room Type - Preference ....................................................................................................................... 13 (b) Room Type – Basic / Extra Service / Not Acceptable..................................................................... 14 (c) Accommodation Options - Desirability.............................................................................................. 16 (d) Accommodation Options – Basic / Extra Service / Not Acceptable .......................................... 17 5. Results - Staffing ...................................................................................................................................... 18 (a) Registered Nurses (RN) – High Care - Frequency............................................................................. 18 (b) Registered Nurse (RN) – High Care - Quantity .................................................................................. 19 (c) Care Assistants / Attendants / AIN / PCA – High Care ................................................................... 19 (d) Registered Nurses – Low Care - Frequency....................................................................................... 20 (e) Registered Nurses – Low Care - Quantity .......................................................................................... 20 (f) Care Assistants / Attendants / AIN / PCA – Low Care - Quantity ................................................. 21 (g) Staffing Options - Desirability................................................................................................................ 21 (h) Staffing Options – Basic / Extra Service .............................................................................................. 22 6. Results – Recreational Activities .......................................................................................................... 23 (a) Activities Options – High Care / Nursing Home ................................................................................ 23 (b) Activities Options – Low Care / Hostel................................................................................................ 24 (c) Recreational Activity Options - Desirability ....................................................................................... 25 (d) Recreational Activity Options – Basic / Extra Service / Not Acceptable.................................... 26 7. Results - Food Services .......................................................................................................................... 27 (a) Meal Preparation Options .................................................................................................................... 27 (b) Meal Service Options - Desirability...................................................................................................... 28 (c) Meal Service Options – Basic / Extra Service / Not Acceptable .................................................. 29 8. Results – Dining Options ........................................................................................................................ 30 (a) Dining Options - Desirability.................................................................................................................. 30 (b) Dining Options – Basic / Extra Service / Not Applicable................................................................. 31 9. Results – Fee Options ............................................................................................................................. 32 (a) Maximum Daily Care Fee ..................................................................................................................... 32 (b) Maximum Extra Service ......................................................................................................................... 33 (c) Accommodation Bond - Maximum.................................................................................................... 34 (d) Commonwealth Funding...................................................................................................................... 35 10. Results – Extra Service............................................................................................................................ 37 (a) Extra Service or Standard? ................................................................................................................... 37 (b) Extra Service – Additional Staffing - Desirability................................................................................ 37 (c) Extra Service – Additional Staff - Quantity......................................................................................... 38 (d) Most Popular Extra Service Options .................................................................................................... 39 11. Results – Most Desirable Options (Top 50) ......................................................................................... 40 12. Results – Least Desirable Options (Top 50)......................................................................................... 41 13. Conclusions ............................................................................................................................................. 42

Baby Boomers Expectations of Residential Aged Care – Dr Rodney Jilek - August 2009 3
1. Introduction
The study ‘Baby Boomers Expectations of Residential Aged Care’ was undertaken to examine a
wide variety of residential aged care options and determine their desirability to 2843 individuals
born between 1946 and 1964 representing a convenience sample of the baby boomer generation.
While significant amounts of social commentary is available highlighting the expected future
impact of the baby boomer generation on Australia’s ability to provide aged care services, little
research has been undertaken to explore exactly what level of service will be expected and how
much this generation of Australians will expect to pay for these services.
To assist participants to complete the questionnaire, the following information was included to
provide context and relevant background:
Basic Daily Care Fee – the basic fee paid by all residents entering an Australian residential aged
care facility. The fee is currently $32.95 per day. The daily basic care fee goes towards paying for
staff, food, laundry, basic activities, nursing and medical care and your accommodation. The
federal government currently funds residential aged care in Australia with resident fees subsidised
up to $160 per day depending on the level of care required. In addition to the basic daily fee,
some part pensioners and self funded retirees may be required to pay additional fees based upon
their assets and income (income tested fee and accommodation charge).
Extra Service Fee – the additional daily fee paid by residents entering an extra service residential
aged care facility. The extra service fee pays for the enhanced accommodation and services
available in these facilities. Extra service fees range from $10 per day to more than $100 per day
depending on the care facility. The commonwealth government regulates the amount charged for
extra service fees.
Extra Service Facilities – a small percentage of residential aged care facilities are approved by the
commonwealth government to provide extra services. Extra services include a higher standard of
environment, a higher standard and variety of food and dining and a wider range of services.
Additional staffing is not currently an element of extra service.
Accommodation Bond – the accommodation bond is an amount payable in low care (hostel) and
extra service facilities and currently ranges from less that $100,000 to more than $1,000,000 in some
facilities. The bond is largely refundable with the aged care provider taking a set amount (the
retention) and all interest earned from the bond. The current retention amount is approximately
$17,500 in total deducted over 5 years. Accommodation bonds are not counted as assets in the
determining of pensions in Australia. The commonwealth government does not regulate the level of
bonds charged.
Registered Nurse – A nurse who has completed 3 years training at either a hospital or university and
is licensed by the Nurses and Midwives Board of NSW. High care facilities (Nursing homes) in NSW
are required to have at least 1 Registered Nurse on duty 24 hours per day. Low care facilities
(hostels) do not have to meet this requirement. As a generalisation, you could normally expect one
registered nurse per 25 to 40 residents in a high care facility.
Personal Care Assistant - (otherwise commonly known as a personal carer, PCA, Assistant Nurse or
AIN) a nurse who may have completed training to the level of certificate 3 at TAFE or through a
training provider but this is not a current requirement. This level of staff generally provides the
majority of care and personal services in residential aged care. As a generalisation, you could
normally expect one care assistant per 8 to 10 residents in high care facilities (nursing homes). Low
care facilities (hostels) have significantly less staff than a nursing home.
High Care (Nursing Home) – a long term care facility providing 24 hour care and services to
residents requiring extensive staff assistance to complete activities of daily living. In NSW a nursing
home must have a Registered Nurse on duty at all times. Nursing homes may provide single room
accommodation with ensuite bathroom but can have more than 4 people sharing the one room.
Shared bathrooms (similar to a public toilet layout) may be provided.
Low Care (Hostel) – a long term care facility usually providing 24 hour care and services (although
at night this may be by an ‘on call’ position) to resident requiring a lower level of care. Generally,
hostel residents are able to complete some activities of daily living independently or only with

Baby Boomers Expectations of Residential Aged Care – Dr Rodney Jilek - August 2009 4
minimal assistance from staff. Accommodation is usually single rooms with ensuite bathroom
although some facilities with shared bathrooms remain.
Activities of Daily Living (ADL’s) – showering, dressing, toileting, feeding, social/recreational activities
etc
Food Types:
(a) Cooked on site – either chef or cook prepare meals in an onsite kitchen at the facility
(b) Cook Chill – meals are prepared at a bulk kitchen off site and are transported and
reheated at the facility before serving. Cook chill meals are commonly served in NSW Public
Hospitals and are becoming more common in residential aged care services
It is expected that this research will articulate:
• The services that are regarded as highly desirable
• The services that are regarded as essential or basic entry level
• The services that are viewed as having little value
• Views with regard to “user pays” and extra service residential aged care
• The amount deemed acceptable to pay for these services
• The amount of accommodation bond deemed appropriate
The study was approved by the Human Research Ethics Committee of St Vincent’s Hospital
Darlinghurst in line with National Health & Medical Research Council guidelines and undertaken
between November 2008 and March 2009 through the completion of a questionnaire and analysis
of gathered data.
The researcher would like to acknowledge and thank the following organisations and aged care
facilities for their contribution to and assistance with this research project:
Aged & Community Services NSW/ACT
Anglican Care
Baby Boomers of New Zealand and Australia
Catholic Care of the Aged Port Macquarie
Catholic Healthcare
Commonwealth Respite and Carelink Centre Community Services Orana
Cooinda Aged People’s Homes
Illawarra Retirement Trust
Lithgow District Aged Peoples Homes Association
Mid Richmond Residents Village
Presbyterian Aged Care
Senior Agency Australia
St Basils Homes – Sr Dorothea Village
St Vincents Hospital, Darlinghurst – Research Office
Stroud Community Lodge Inc
Tanderra Lithgow Inc
The Department of Health & Ageing – Policy and Evaluation Branch
Timbrebongie House Association
United Protestant Association - Community Care
UnitingCare Ageing NSW/ACT – Mayflower Village
University of the 3rd Age (NSW)

Baby Boomers Expectations of Residential Aged Care – Dr Rodney Jilek - August 2009 5
2. Method
The study was based on a questionnaire developed by the researcher exploring a range of
residential aged care options, financial indicators and demographic data. The questionnaire was
promoted by Aged and Community Services (NSW & ACT), three ‘baby boomer’ community
groups / websites and by the researcher through industry and employment contacts. Both for profit
and not for profit aged care facilities and peak bodies were invited to participate. It is noted that
all the large for profit providers invited (including their peak body) either declined to respond or
chose not to participate.
Individual participants were provided with questionnaires and consent forms following initial
contact with the researcher.
The questionnaire included over 300 possible residential aged care options covering staffing,
environment, recreational activities, financial arrangements, food and dining and required
participants to:
(a) Rank each option from 1 to 5 (least desirable to most desirable);
(b) Determine whether each option was deemed to be basic (for all residents at no additional
cost), extra service (for only those who paid additional fees) or unacceptable (or
completely undesirable)
(c) Answer a number of demographic questions
Eligibility criteria included:
• All participants were required to give informed consent
• No participants could be currently receiving care from Catholic Healthcare
• No participants could be directly supervised by the principal researcher
• All participants must have been born between 1946 and 1964
• All participants must be residents of New South Wales
• All questionnaires were required to be accompanied by a signed consent form

Baby Boomers Expectations of Residential Aged Care – Dr Rodney Jilek - August 2009 6
3. Results - Demographic Data
Two thousand eight hundred and forty three baby boomers participated in the study with all
participants being born between 1948 and 1964. Each participant was a resident of New South
Wales and while a number of questionnaires were returned by individuals living outside the state,
these were not included in the data. The geographic spread of participants covered all area
health service regions across NSW.
The data revealed:
• Two thousand one hundred and one participants were female (74%) while the
remaining seven hundred and forty two were male (26%)
• Each of the birth years between 1948 and 1964 were represented
• The majority were still employed in a full time capacity (65%)
• Most owned their own home (85%)
• Over 40% were contributing privately to superannuation although 44% reported less than
$50,000 in super
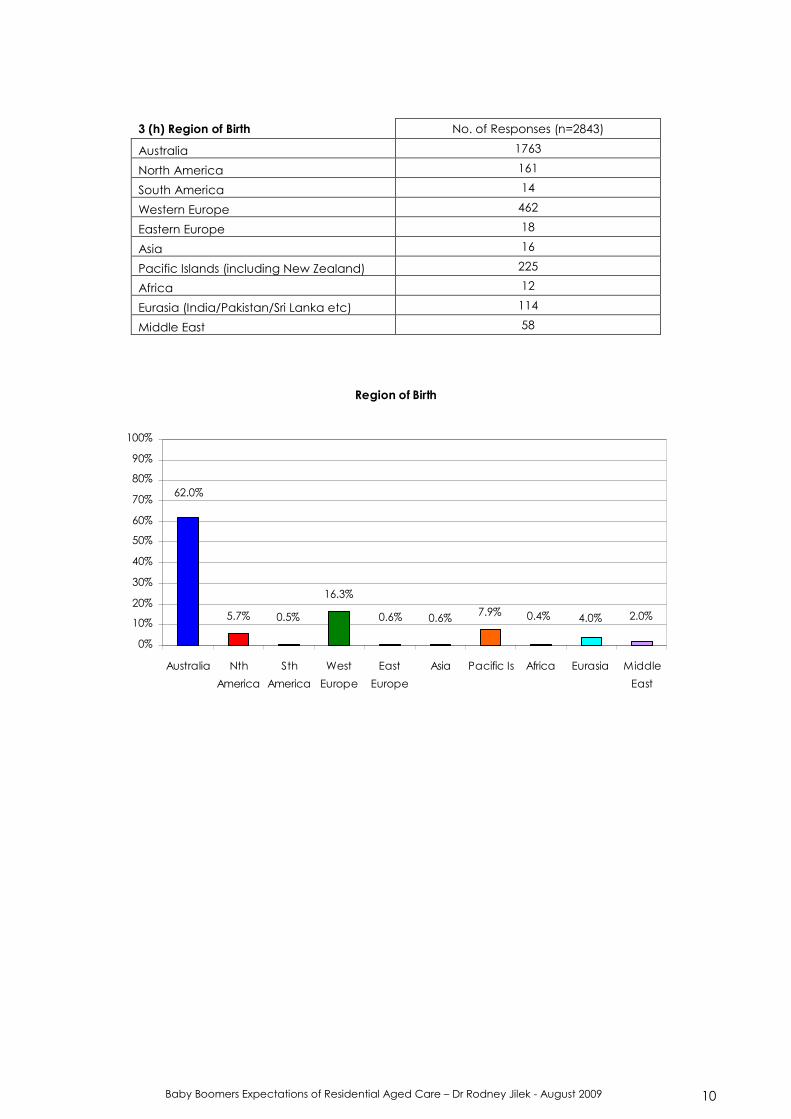
• All major world geographic areas were represented in terms of region of birth but 62% of
participants identified as being born in Australia
• Sixteen different religious denominations were identified although 74.5% of participants
identified as either Catholic, Anglican or Presbyterian
3 (a) Marital Status No. of Responses (n=2843)
Married 2154
Single 129
Widow / Widower 43
Divorced 499
Separated 18
Marital Status
1.5% 0.6%
17.6%
4.5%
75.8%
0%
10%
20%
30%
40%
50%
60%
70%
80%
90%
100%
Married Single Widow / Widower Divorced Separated

Baby Boomers Expectations of Residential Aged Care – Dr Rodney Jilek - August 2009 7
Employment Status
2% 3%
22%
3%
65%
6%
0%
10%
20%
30%
40%
50%
60%
70%
80%
90%
100%
Full Pensioner Part Pensioner Self funded
retiree
Working - Part
Time
Working - Full
Time
Working -
Casual
3 (c) Assets No. of Responses (n=2843)
Own current home 2412
Rent current home 302
Contributing privately to superannuation 1163
Assets
11%
41%
85%
0%
10%
20%
30%
40%
50%
60%
70%
80%
90%
100%
Own current home Rent current home Contributing privately to
Superannuation
3 (b) Employment Status No. of Responses (n=2843)
Full Pensioner 63
Part Pensioner 80
Self Funded Retiree 165
Working - Part Time 618
Working - Full Time 1835
Working - Casual 82

Baby Boomers Expectations of Residential Aged Care – Dr Rodney Jilek - August 2009 8
Superannuation
11%6%
28%
6%5%
19%
25%
0%
10%
20%
30%
40%
50%
60%
70%
80%
90%
100%
Less than
$30K
$30 - $50K $50 - $75K $75 - $100K $100 - $150K $150 - $300K More than
$300K
Gross Annual Income
3%
18%13%19%
27%
19%
0%
10%
20%
30%
40%
50%
60%
70%
80%
90%
100%
Less than $30K $30 - $50K $50 - $75K $75 - $100K $100 - $150K More than
$150K
3 (d) Superannuation No. of Responses (n=2843)
Less than $30K 707
$30 - $50K 534
$50 - $75K 155
$75 - $100K 163
$100 - $150K 806
$150 - $300K 157
More than $300K 321
3 (e) Gross Annual Income No. of Responses (n=2843)
Less than $30K 552
$30 - $50K 770
$50 - $75K 541
$75 - $100K 382
$100 - $150K 512
More than $150K 86

Baby Boomers Expectations of Residential Aged Care – Dr Rodney Jilek - August 2009 9
3 (f) Employment Status No. of Responses (n=2843)
Aged Pension 61
Veterans Affairs Pension 82
Full Pensioner 63
Part Pensioner 80
Self funded retiree 165
Working - Part Time 618
Working - Full Time 1835
Working - Casual 82
Employment Status
3%6%
65%
3%2%
22%
0%
10%
20%
30%
40%
50%
60%
70%
80%
90%
100%
Full Pensioner Part Pensioner Self funded
retiree
Working - Part
Time
Working - Full
Time
Working -
Casual
3 (g) Gender No. of Responses (n=2843)
Male 742
Female 2101
Gender
74%
26%
0%
10%
20%
30%
40%
50%
60%
70%
80%
90%
100%
Male Female
Baby Boomers Expectations of Residential Aged Care – Dr Rodney Jilek - August 2009 10
3 (h) Region of Birth No. of Responses (n=2843)
Australia 1763
North America 161
South America 14
Western Europe 462
Eastern Europe 18
Asia 16
Pacific Islands (including New Zealand) 225
Africa 12
Eurasia (India/Pakistan/Sri Lanka etc) 114
Middle East 58
Region of Birth
5.7%
16.3%
7.9% 2.0%4.0%0.4%0.6%0.6%0.5%
62.0%
0%
10%
20%
30%
40%
50%
60%
70%
80%
90%
100%
Australia Nth
America
Sth
America
West
Europe
East
Europe
Asia Pacific Is Africa Eurasia Middle
East

Baby Boomers Expectations of Residential Aged Care – Dr Rodney Jilek - August 2009 11
3 (i) Religious Denomination No. of Responses (n=2843)
Catholic 794
Presbyterian 616
Anglican 707
Orthodox 27
Mormon 4
Seventh Day Adventist 36
Brethren 3
Hillsong / Evangelistic 254
Jewish 13
Hindu 13
Muslim 21
Sikh 3
Buddhist 17
Jehovah’s Witness 23
Not Religious 103
Uniting Church 209
Religious Denomination
0.8%0.6%0.1%0.7%0.5%0.5%0.1%1.3%0.1%0.9%
27.9%
21.7%
24.9%
8.9% 3.6% 7.4%
0%
10%
20%
30%
40%
50%
60%
70%
80%
90%
100%
Catholic
Presbyteria
n
Anglican
Orthodox
Morm
on
Seventh Day Adventist
Brethren
Hillsong / Evangelistic
Jewish
Hindu
Muslim
Sikh
Buddhist
Jehovahs Witness
Not religious
Uniting Church
Baby Boomers Expectations of Residential Aged Care – Dr Rodney Jilek - August 2009 12
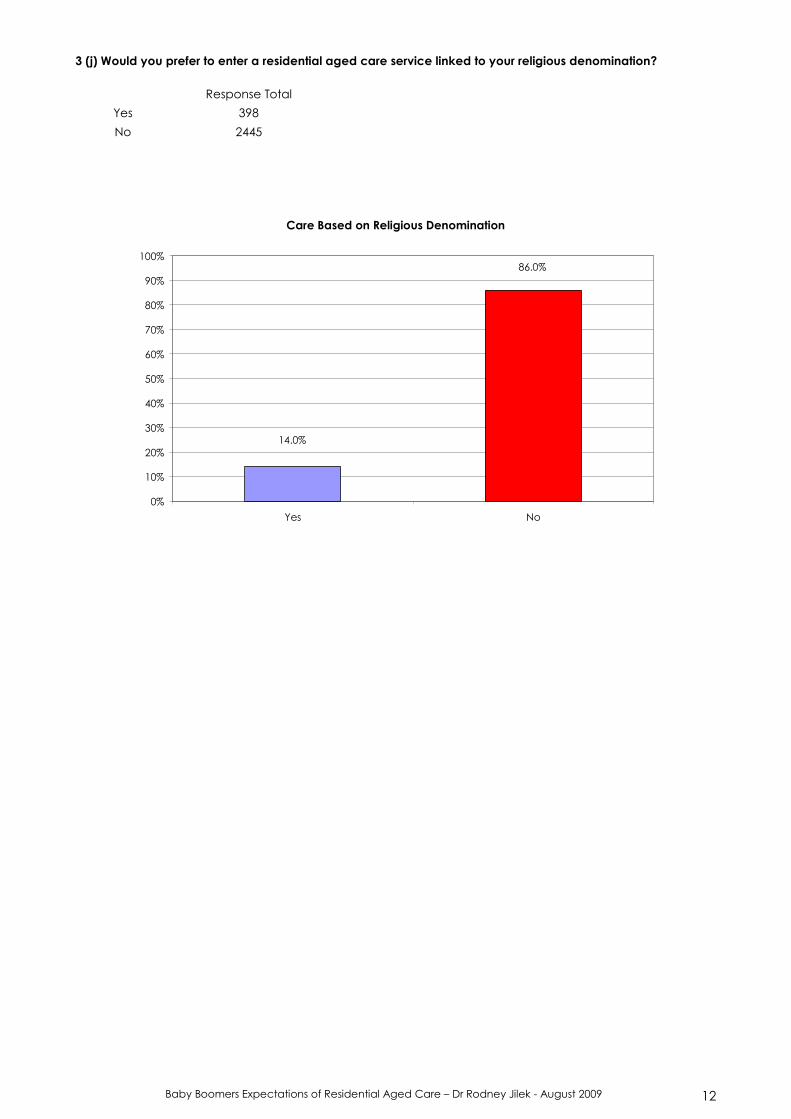
3 (j) Would you prefer to enter a residential aged care service linked to your religious denomination?
Response Total
Yes 398
No 2445
Care Based on Religious Denomination
86.0%
14.0%
0%
10%
20%
30%
40%
50%
60%
70%
80%
90%
100%
Yes No

Baby Boomers Expectations of Residential Aged Care – Dr Rodney Jilek - August 2009 13
4. Results – Accommodation
The participants were evenly split between their preference for a single room or one bedroom
apartment but readily articulated their preferences when it came to identifying what was
considered basic (89.2% indicated a single room) and what was not acceptable (94.6% indicated
a triple share room / 70% indicated a twin share room).
Analysis of the desirability data revealed that the accommodation options ranked consistently
highly desirable (58% on average ranked the options either very desired or most desired) indicating
that quality accommodation was important to this cohort.
4 (a) Room Type - Preference No. of Responses (n=2843)
Single Room 1155
Twin Share Room 77
Triple Share Room 0
Studio Apartment 462
One Bedroom Apartment 1149
Room Type - Preference
40.6%
0.0%
16.3%
40.4%
2.7%
0%
5%
10%
15%
20%
25%
30%
35%
40%
45%
Single Room Twin Share Room Triple Share Room Studio Apartment One Bedroom
Apartment

Baby Boomers Expectations of Residential Aged Care – Dr Rodney Jilek - August 2009 14
Room Type - Basic
89.2%
29.7%
13.5%
37.8%
5.4%
0%
10%
20%
30%
40%
50%
60%
70%
80%
90%
100%
Single Room Twin Share Room Triple Share Room Studio Apartment One Bedroom
Apartment
Room Type - Not Acceptable
10.8%
13.5%
94.6%
70.3%
8.1%
0%
10%
20%
30%
40%
50%
60%
70%
80%
90%
100%
Single Room Twin Share Room Triple Share Room Studio Apartment One Bedroom
Apartment
4 (b) Room Type – Basic / Extra
Service / Not Acceptable Basic Extra Service Not Acceptable
Single Room 2535 77 231
Twin Share Room 845 0 1998
Triple Share Room 154 0 2689
Studio Apartment 1076 1460 307
One Bedroom Apartment 384 2075 384

Baby Boomers Expectations of Residential Aged Care – Dr Rodney Jilek - August 2009 15
Room Type - Extra Service
0.0% 0.0%
73.0%
51.4%
2.7%
0%
10%
20%
30%
40%
50%
60%
70%
80%
90%
100%
Single Room Twin Share Room Triple Share Room Studio Apartment One Bedroom
Apartment

Baby Boomers Expectations of Residential Aged Care – Dr Rodney Jilek - August 2009 16
4 (c) Accommodation Options - Desirability Least
Desired
Slightly
Desired
Moderately
Desirable
Very
Desirable
Most
Desirable
Inter - connecting rooms for couples 5.4% 2.7% 13.5% 29.7% 48.6%
Ensuite bathroom 0.0% 0.0% 2.7% 18.9% 78.4%
Shared bathroom 81.1% 8.1% 10.8% 0.0% 0.0%
Kitchenette 8.1% 13.5% 21.6% 29.7% 27.0%
Lounge area in room 2.7% 8.1% 8.1% 45.9% 35.1%
Air conditioning - reverse cycle 0.0% 0.0% 5.4% 29.7% 64.9%
Heating only 43.2% 8.1% 29.7% 10.8% 8.1%
Ceiling fans only 40.5% 5.4% 37.8% 10.8% 5.4%
Carpet in room 10.8% 16.2% 24.3% 21.6% 27.0%
Carpet throughout care facility 16.2% 16.2% 43.2% 5.4% 18.9%
Vinyl flooring 8.1% 8.1% 48.6% 24.3% 10.8%
Library 0.0% 0.0% 29.7% 21.6% 48.6%
Computer room 5.4% 5.4% 21.6% 40.5% 27.0%
Movie theatre 8.1% 10.8% 35.1% 35.1% 10.8%
Chapel / Church / Sacred Space 2.7% 10.8% 21.6% 29.7% 35.1%
Communal lounge room 2.7% 0.0% 21.6% 27.0% 48.6%
Communal dining room 2.7% 0.0% 21.6% 35.1% 40.5%
Private dining room for entertaining / guests 8.1% 18.9% 24.3% 27.0% 21.6%
Quiet Room / Relaxation area 0.0% 0.0% 13.5% 35.1% 51.4%
Swimming pool - outdoor 27.0% 16.2% 29.7% 13.5% 13.5%
Swimming pool - indoor 5.4% 16.2% 27.0% 24.3% 27.0%
Games Room (snooker table / card table) 0.0% 0.0% 27.0% 48.6% 24.3%
Televisions in room 0.0% 0.0% 8.1% 24.3% 67.6%
DVD player in room 2.7% 2.7% 24.3% 18.9% 51.4%
Computer / Internet access in room 8.1% 5.4% 24.3% 10.8% 51.4%
Telephone in room 2.7% 0.0% 2.7% 13.5% 81.1%
Normal bath available 8.1% 16.2% 32.4% 21.6% 21.6%
Spa bath available 13.5% 21.6% 45.9% 13.5% 5.4%
Recliner chairs in room 2.7% 0.0% 21.6% 29.7% 45.9%
Electric bed 5.4% 10.8% 16.2% 37.8% 29.7%
Single bed 45.9% 13.5% 21.6% 5.4% 13.5%
King single bed 24.3% 24.3% 24.3% 13.5% 13.5%
Double bed 29.7% 10.8% 24.3% 18.9% 16.2%
Queen bed 18.9% 16.2% 24.3% 8.1% 32.4%
Eco-friendly environment 0.0% 5.4% 10.8% 40.5% 43.2%
Least
Desired %
Slightly
Desired %
Moderately
Desired %
Very
Desired %
Most
Desired %
Mode 0 0% 0 0% 667 23.5% 845 32% 768 27%
Median 154 5.4% 231 8.3% 692 24.3% 692 26% 768 27%
Mean 358 12.6% 237 8.1% 650 22.9% 667 26% 931 32%
Baby Boomers Expectations of Residential Aged Care – Dr Rodney Jilek - August 2009 17
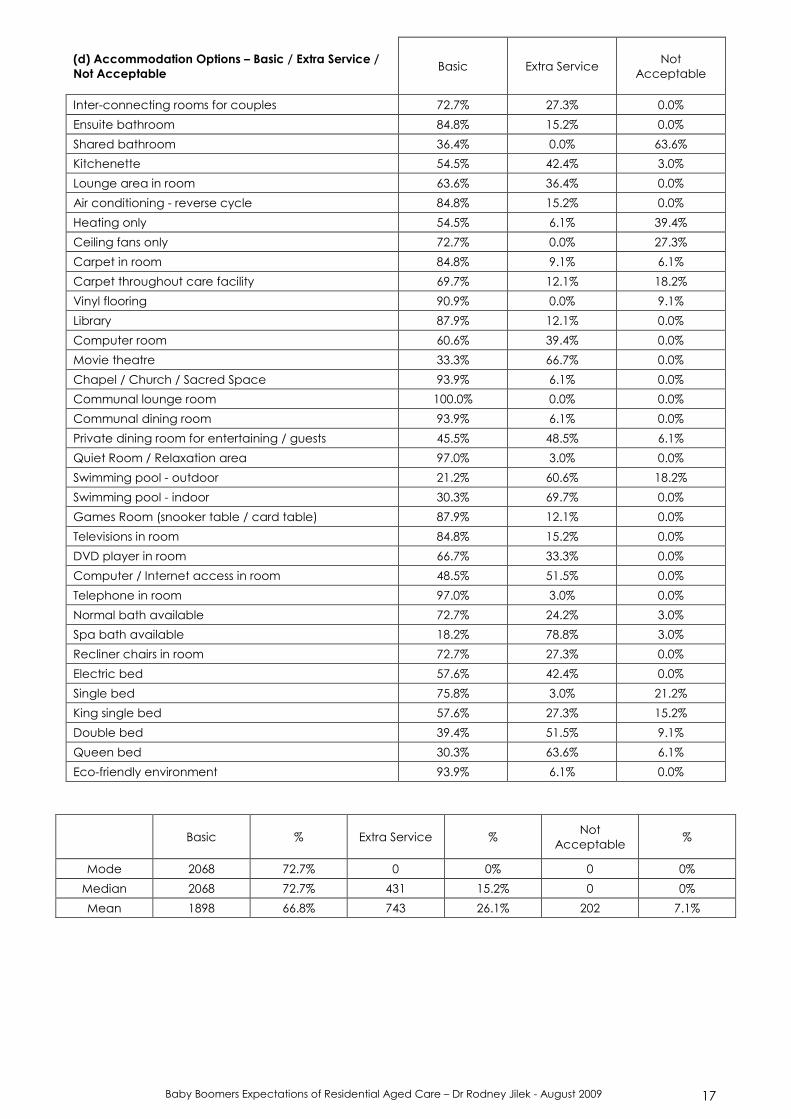
(d) Accommodation Options – Basic / Extra Service /
Not Acceptable Basic Extra Service
Not
Acceptable
Inter-connecting rooms for couples 72.7% 27.3% 0.0%
Ensuite bathroom 84.8% 15.2% 0.0%
Shared bathroom 36.4% 0.0% 63.6%
Kitchenette 54.5% 42.4% 3.0%
Lounge area in room 63.6% 36.4% 0.0%
Air conditioning - reverse cycle 84.8% 15.2% 0.0%
Heating only 54.5% 6.1% 39.4%
Ceiling fans only 72.7% 0.0% 27.3%
Carpet in room 84.8% 9.1% 6.1%
Carpet throughout care facility 69.7% 12.1% 18.2%
Vinyl flooring 90.9% 0.0% 9.1%
Library 87.9% 12.1% 0.0%
Computer room 60.6% 39.4% 0.0%
Movie theatre 33.3% 66.7% 0.0%
Chapel / Church / Sacred Space 93.9% 6.1% 0.0%
Communal lounge room 100.0% 0.0% 0.0%
Communal dining room 93.9% 6.1% 0.0%
Private dining room for entertaining / guests 45.5% 48.5% 6.1%
Quiet Room / Relaxation area 97.0% 3.0% 0.0%
Swimming pool - outdoor 21.2% 60.6% 18.2%
Swimming pool - indoor 30.3% 69.7% 0.0%
Games Room (snooker table / card table) 87.9% 12.1% 0.0%
Televisions in room 84.8% 15.2% 0.0%
DVD player in room 66.7% 33.3% 0.0%
Computer / Internet access in room 48.5% 51.5% 0.0%
Telephone in room 97.0% 3.0% 0.0%
Normal bath available 72.7% 24.2% 3.0%
Spa bath available 18.2% 78.8% 3.0%
Recliner chairs in room 72.7% 27.3% 0.0%
Electric bed 57.6% 42.4% 0.0%
Single bed 75.8% 3.0% 21.2%
King single bed 57.6% 27.3% 15.2%
Double bed 39.4% 51.5% 9.1%
Queen bed 30.3% 63.6% 6.1%
Eco-friendly environment 93.9% 6.1% 0.0%
Basic % Extra Service % Not
Acceptable %
Mode 2068 72.7% 0 0% 0 0%
Median 2068 72.7% 431 15.2% 0 0%
Mean 1898 66.8% 743 26.1% 202 7.1%

Baby Boomers Expectations of Residential Aged Care – Dr Rodney Jilek - August 2009 18
5. Results - Staffing
Expectations surrounding the levels and type of staffing were in generally elevated in terms of
standard high and low care but considerably elevated in the area of extra service (discussed
further in section x)
Expectation in terms of Registered Nurses matched current legislation in NSW for high care
(Registered Nurse on duty 24 hours per day) although expectation in terms of ratio was deemed
high with 70.3% of participants wanting 1 Registered Nurse for 20 or less residents.
Low care Registered Nurse expectations were considerably lower with 86.5% of participants stating
a Registered Nurse less than 24 hours per day was acceptable although even this is well beyond
the current levels of attendance for many low care services.
Care attendant expectations were much more closely aligned to current industry norms with 81.4%
of participants considering one Care Attendant to between 5 and 10 residents in high care
acceptable and 55% of participants considering one Care Attendant to between 30 and 40
residents in low care acceptable.
Analysis of the desirability data revealed that the staffing options ranked consistently highly
desirable (89.2% on average ranked the options as moderately desirable or higher) indicating that
access to a breadth of specialist staff was important to this cohort. It is also noted that on average
58.5% of participants found specialist care services a basic level for residential aged care.
5 (a) Registered Nurses (RN) – High Care - Frequency No. of Responses (n=2843)
24 hours per day 2612
Daily but not 24 hours per day 231
Three times per week 0
On call only 0
Registered Nursing Options - High Care
91.9%
0.0% 0.0%
8.1%
0%
10%
20%
30%
40%
50%
60%
70%
80%
90%
100%
24 hours per day Daily but not 24 hours
per day
Three times per week On call only

Baby Boomers Expectations of Residential Aged Care – Dr Rodney Jilek - August 2009 19
Registered Nurse - High Care
2.6% 2.7%
10.8%
24.4%
8.0%
37.9%
8.1%5.4%
0%
10%
20%
30%
40%
50%
60%
70%
80%
90%
100%
1 per 100 1per 60 1 per 40 1 per 30 1 per 25 1 per 20 1 per 15 1 per 10
5 (c) Care Assistants /
Attendants / AIN / PCA – High
Care
No. of Responses
(n=2843)
No. of Responses
(n=2843)
1 per 30 residents 11 1 per 6 residents 616
1 per 20 residents 9 1 per 5 residents 927
1 per15 residents 55 1 per 4 residents 154
1 per 10 residents 308 1 per 3 residents 286
1 per 8 residents 462 1 per 2 residents 13
1 for every resident 2
Care Attendant - High Care
0.4% 0.3%
10.8% 10.1%
0.5% 0.1%
5.4%
32.6%
21.7%
16.3%
1.9%
0%
10%
20%
30%
40%
50%
60%
70%
80%
90%
100%
1 PCA
per 30
1 PCA
per 20
1 PCA
per 15
1 PCA
per 10
1 PCA
per 8
1 PCA
per 6
1 PCA
per 5
1 PCA
per 4
1 PCA
per 3
1 PCA
per 2
1 PCA
per
resident
5 (b) Registered Nurse (RN) – High Care - Quantity No. of Responses (n=2843)
1 RN per 100 residents 73
1RN per 60 residents 154
1 RN per 40 residents 78
1 RN per 30 residents 231
1 RN per 25 residents 307
1 RN per 20 residents 1078
1 RN per 15 residents 227
1 RN per 10 residents 695

Baby Boomers Expectations of Residential Aged Care – Dr Rodney Jilek - August 2009 20
5 (d) Registered Nurses – Low Care - Frequency No. of Responses (n=2843)
24 hours per day 384
Daily but not 24 hours per day 1537
Three times per week 459
On call only 463
Registered Nurse - Low Care
16.3%16.1%
54.1%
13.5%
0%
10%
20%
30%
40%
50%
60%
70%
80%
90%
100%
24 hours per day Daily but not 24 hours
per day
Three times per week On call only
5 (e) Registered Nurses –
Low Care - Quantity No. of Responses (n=2843) No. of Responses (n=2843)
1 RN per 100 residents 286 1 RN per 25 residents 347
1RN per 60 residents 385 1 RN per 20 residents 208
1 RN per 40 residents 798 1 RN per 15 residents 41
1 RN per 30 residents 766 1 RN per 10 residents 12
Registered Nurse - Low Care
12.2%
1.4% 0.5%
7.3%
26.9%28.1%
13.5%
10.1%
0%
10%
20%
30%
40%
50%
60%
70%
80%
90%
100%
1 per 100 1per 60 1 per 40 1 per 30 1 per 25 1 per 20 1 per 15 1 per 10

Baby Boomers Expectations of Residential Aged Care – Dr Rodney Jilek - August 2009 21
5 (f) Care Assistants /
Attendants / AIN / PCA –
Low Care - Quantity
No. of Responses (n=2843)
No. of Responses (n=2843)
1 PCA per 30 residents 154 1 PCA per 5 residents 33
1 PCA per 20 residents 616 1 PCA per 4 residents 0
1 PCA per 15 residents 539 1 PCA per 3 residents 0
1 PCA per10 residents 847 1 PCA per 2 residents 0
1 PCA per 8 residents 610 1 PCA per resident 0
1 PCA per 6 residents 44
Care Attendant - Low Care
1.5% 1.2% 0.0% 0.0% 0.0% 0.0%
21.5%
29.8%
19.0%
21.7%
5.4%
0%
10%
20%
30%
40%
50%
60%
70%
80%
90%
100%
1 PCA
per 30
1 PCA
per 20
1 PCA
per 15
1 PCA
per 10
1 PCA
per 8
1 PCA
per 6
1 PCA
per 5
1 PCA
per 4
1 PCA
per 3
1 PCA
per 2
1 PCA
per
resident
5 (g) Staffing Options - Desirability Least
Desired
Slightly
Desired
Moderately
Desired
Very
Desired
Most
Desired
Dementia Care specialist nurse available 0.0% 2.7% 10.8% 35.1% 51.4%
Palliative / End of Life Care specialist nurse available 0.0% 0.0% 8.1% 32.4% 59.5%
Physical Therapy / Rehabilitation specialist nurse available 2.7% 0.0% 18.9% 32.4% 45.9%
Mental Health specialist nurse available 2.7% 2.7% 27.0% 37.8% 29.7%
Dietitian & Nutrition Support 0.0% 2.7% 29.7% 40.5% 27.0%
Speech Pathology 0.0% 16.2% 43.2% 27.0% 13.5%
Massage Therapy 0.0% 13.5% 48.6% 24.3% 13.5%
Aromatherapy 16.2% 16.2% 37.8% 21.6% 8.1%
Chiropractic 10.8% 8.1% 43.2% 29.7% 8.1%
Complementary Therapies (e.g. Naturopath / Acupuncture) 16.2% 21.6% 40.5% 8.1% 13.5%
Dental Services 5.4% 2.7% 16.2% 32.4% 43.2%
Diversional Therapy 0.0% 2.7% 16.2% 37.8% 43.2%
Occupational Therapy 0.0% 2.7% 32.4% 35.1% 29.7%
Physiotherapy 0.0% 2.7% 13.5% 45.9% 37.8%
Podiatry 0.0% 0.0% 21.6% 37.8% 40.5%
X-Ray Services 10.8% 8.1% 24.3% 16.2% 40.5%
Pathology Services (e.g. blood tests) 8.1% 8.1% 24.3% 27.0% 32.4%
Least
Desired %
Slightly
Desired %
Moderately
Desired %
Very
Desired %
Most
Desired %
Mode 0 0.0% 77 2.7% 1229 43.2% 922 32.4% 384 13.5%
Median 0 0.0% 77 2.7% 692 24.3% 922 32.4% 922 32.4%
Mean 122 4.3% 185 6.5% 764 26.9% 872 30.7% 899 31.6%

Baby Boomers Expectations of Residential Aged Care – Dr Rodney Jilek - August 2009 22
5 (h) Staffing Options – Basic / Extra Service Basic Extra Service Not Acceptable
Dementia Care specialist nurse available 93.8% 6.3% 0.0%
Palliative / End of Life Care specialist nurse available 93.8% 6.3% 0.0%
Physical Therapy / Rehabilitation specialist nurse available 84.4% 15.6% 0.0%
Mental Health specialist nurse available 75.0% 25.0% 0.0%
Dietitian & Nutrition Support 75.0% 25.0% 0.0%
Speech Pathology 46.9% 53.1% 0.0%
Massage Therapy 34.4% 62.5% 3.1%
Aromatherapy 25.0% 62.5% 12.5%
Chiropractic 15.6% 71.9% 12.5%
Complementary Therapies (e.g. Naturopath / Acupuncture) 15.6% 78.1% 6.3%
Dental Services 53.1% 46.9% 0.0%
Diversional Therapy 87.5% 12.5% 0.0%
Occupational Therapy 71.9% 28.1% 0.0%
Physiotherapy 71.9% 28.1% 0.0%
Podiatry 59.4% 40.6% 0.0%
X-Ray Services 34.4% 59.4% 6.3%
Pathology Services (e.g. blood tests) 56.3% 40.6% 3.1%
Basic % Extra Service % Not
Acceptable %
Mode 2665 93.8% 178 6.3% 0 0.0%
Median 1688 59.4% 1155 40.6% 0 0.0%
Mean 1662 58.5% 1108 39% 73 2.6%

Baby Boomers Expectations of Residential Aged Care – Dr Rodney Jilek - August 2009 23
6. Results – Recreational Activities
Responses regarding recreational and leisure activities for high and low care were almost identical
with the majority of participants stating daily activities were an expectation (69% and 69.5%
respectively for high and low care)
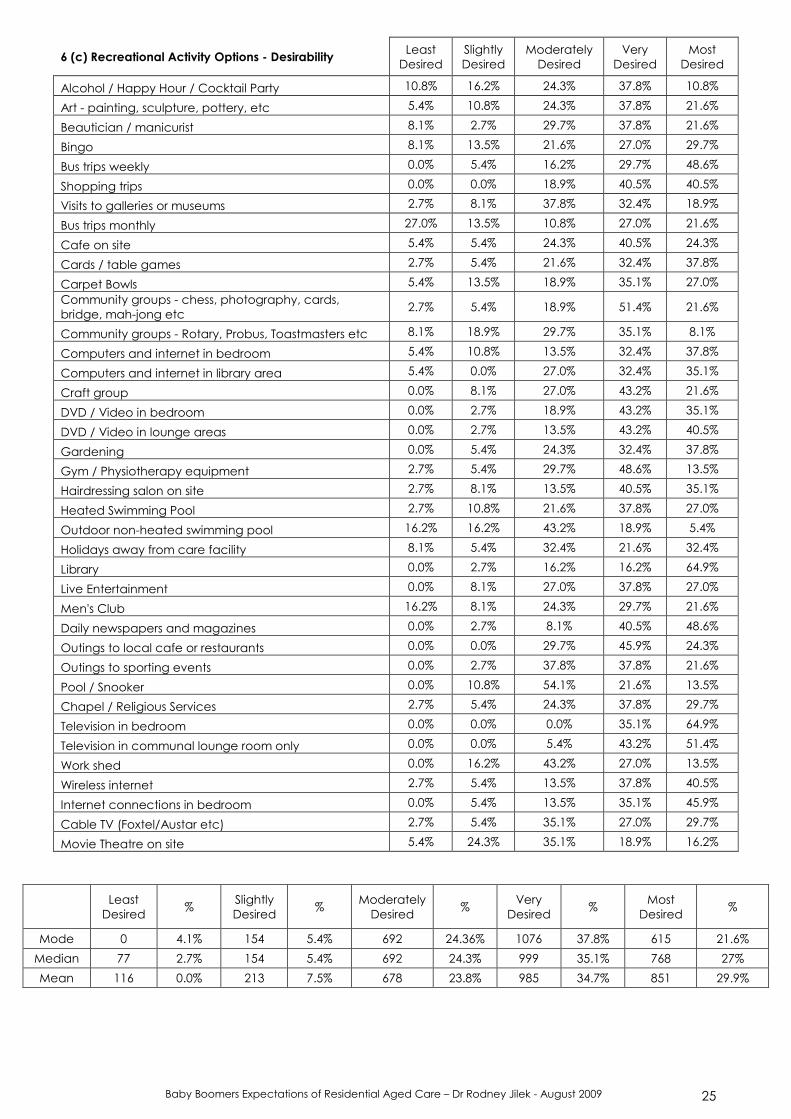
Analysis of the desirability data revealed that the recreational activities options ranked consistently
highly desirable (88.4% on average ranked the options as moderately desirable or higher)
indicating that access to a breadth of recreational activities was important to this cohort. It is also
noted that on average 63% of participants found the listed recreational activities a basic level for
residential aged care.
6 (a) Activities Options – High Care / Nursing Home No. of Responses (n=2843)
Daily 1961
Three times per week 698
Once weekly only 184
Activity Options - High Care
6.4%
24.6%
69.0%
0%
10%
20%
30%
40%
50%
60%
70%
80%
90%
100%
Daily Three times per week Once weekly only

Baby Boomers Expectations of Residential Aged Care – Dr Rodney Jilek - August 2009 24
6 (b) Activities Options – Low Care / Hostel No. of Responses (n=2843)
Daily 1975
Three times per week 783
Once weekly only 85
Activity Options - Low Care
3.0%
27.5%
69.5%
0%
10%
20%
30%
40%
50%
60%
70%
80%
90%
100%
Daily Three times per week Once weekly only
Baby Boomers Expectations of Residential Aged Care – Dr Rodney Jilek - August 2009 25
6 (c) Recreational Activity Options - Desirability Least
Desired
Slightly
Desired
Moderately
Desired
Very
Desired
Most
Desired
Alcohol / Happy Hour / Cocktail Party 10.8% 16.2% 24.3% 37.8% 10.8%
Art - painting, sculpture, pottery, etc 5.4% 10.8% 24.3% 37.8% 21.6%
Beautician / manicurist 8.1% 2.7% 29.7% 37.8% 21.6%
Bingo 8.1% 13.5% 21.6% 27.0% 29.7%
Bus trips weekly 0.0% 5.4% 16.2% 29.7% 48.6%
Shopping trips 0.0% 0.0% 18.9% 40.5% 40.5%
Visits to galleries or museums 2.7% 8.1% 37.8% 32.4% 18.9%
Bus trips monthly 27.0% 13.5% 10.8% 27.0% 21.6%
Cafe on site 5.4% 5.4% 24.3% 40.5% 24.3%
Cards / table games 2.7% 5.4% 21.6% 32.4% 37.8%
Carpet Bowls 5.4% 13.5% 18.9% 35.1% 27.0%
Community groups - chess, photography, cards,
bridge, mah-jong etc 2.7% 5.4% 18.9% 51.4% 21.6%
Community groups - Rotary, Probus, Toastmasters etc 8.1% 18.9% 29.7% 35.1% 8.1%
Computers and internet in bedroom 5.4% 10.8% 13.5% 32.4% 37.8%
Computers and internet in library area 5.4% 0.0% 27.0% 32.4% 35.1%
Craft group 0.0% 8.1% 27.0% 43.2% 21.6%
DVD / Video in bedroom 0.0% 2.7% 18.9% 43.2% 35.1%
DVD / Video in lounge areas 0.0% 2.7% 13.5% 43.2% 40.5%
Gardening 0.0% 5.4% 24.3% 32.4% 37.8%
Gym / Physiotherapy equipment 2.7% 5.4% 29.7% 48.6% 13.5%
Hairdressing salon on site 2.7% 8.1% 13.5% 40.5% 35.1%
Heated Swimming Pool 2.7% 10.8% 21.6% 37.8% 27.0%
Outdoor non-heated swimming pool 16.2% 16.2% 43.2% 18.9% 5.4%
Holidays away from care facility 8.1% 5.4% 32.4% 21.6% 32.4%
Library 0.0% 2.7% 16.2% 16.2% 64.9%
Live Entertainment 0.0% 8.1% 27.0% 37.8% 27.0%
Men's Club 16.2% 8.1% 24.3% 29.7% 21.6%
Daily newspapers and magazines 0.0% 2.7% 8.1% 40.5% 48.6%
Outings to local cafe or restaurants 0.0% 0.0% 29.7% 45.9% 24.3%
Outings to sporting events 0.0% 2.7% 37.8% 37.8% 21.6%
Pool / Snooker 0.0% 10.8% 54.1% 21.6% 13.5%
Chapel / Religious Services 2.7% 5.4% 24.3% 37.8% 29.7%
Television in bedroom 0.0% 0.0% 0.0% 35.1% 64.9%
Television in communal lounge room only 0.0% 0.0% 5.4% 43.2% 51.4%
Work shed 0.0% 16.2% 43.2% 27.0% 13.5%
Wireless internet 2.7% 5.4% 13.5% 37.8% 40.5%
Internet connections in bedroom 0.0% 5.4% 13.5% 35.1% 45.9%
Cable TV (Foxtel/Austar etc) 2.7% 5.4% 35.1% 27.0% 29.7%
Movie Theatre on site 5.4% 24.3% 35.1% 18.9% 16.2%
Least
Desired %
Slightly
Desired %
Moderately
Desired %
Very
Desired %
Most
Desired %
Mode 0 4.1% 154 5.4% 692 24.36% 1076 37.8% 615 21.6%
Median 77 2.7% 154 5.4% 692 24.3% 999 35.1% 768 27%
Mean 116 0.0% 213 7.5% 678 23.8% 985 34.7% 851 29.9%

Baby Boomers Expectations of Residential Aged Care – Dr Rodney Jilek - August 2009 26
6 (d) Recreational Activity Options – Basic / Extra Service / Not
Acceptable Basic
Extra
Service
Not
Acceptable
Alcohol / Happy Hour / Cocktail Party 58.8% 35.3% 5.9%
Art - painting, sculpture, pottery, etc 64.7% 32.4% 2.9%
Beautician / manicurist 41.2% 55.9% 2.9%
Bingo 88.2% 11.8% 0.0%
Bus trips weekly 76.5% 23.5% 0.0%
Shopping trips 82.4% 17.6% 0.0%
Visits to galleries or museums 35.3% 61.8% 2.9%
Bus trips monthly 64.7% 14.7% 20.6%
Cafe on site 47.1% 50.0% 2.9%
Cards / table games 100.0% 0.0% 0.0%
Carpet Bowls 91.2% 8.8% 0.0%
Community groups - chess, photography, cards, bridge,
mah-jong etc 91.2% 8.8% 0.0%
Community groups - Rotary, Probus, Toastmasters etc 50.0% 47.1% 2.9%
Computers and internet in bedroom 38.2% 61.8% 0.0%
Computers and internet in library area 82.4% 14.7% 2.9%
Craft group 91.2% 8.8% 0.0%
DVD / Video in bedroom 70.6% 29.4% 0.0%
DVD / Video in lounge areas 94.1% 2.9% 2.9%
Gardening 100.0% 0.0% 0.0%
Gym / Physiotherapy equipment 55.9% 44.1% 0.0%
Hairdressing salon on site 44.1% 55.9% 0.0%
Heated Swimming Pool 47.1% 52.9% 0.0%
Outdoor non-heated swimming pool 32.4% 52.9% 14.7%
Holidays away from care facility 20.6% 70.6% 8.8%
Library 88.2% 11.8% 0.0%
Live Entertainment 47.1% 52.9% 0.0%
Men's Club 70.6% 20.6% 8.8%
Daily newspapers and magazines 58.8% 41.2% 0.0%
Outings to local cafe or restaurants 35.3% 64.7% 0.0%
Outings to sporting events 26.5% 73.5% 0.0%
Pool / Snooker 85.3% 14.7% 0.0%
Chapel / Religious Services 97.1% 2.9% 0.0%
Television in bedroom 94.1% 5.9% 0.0%
Television in communal lounge room only 100.0% 0.0% 0.0%
Work shed 55.9% 41.2% 2.9%
Wireless internet 44.1% 52.9% 2.9%
Internet connections in bedroom 55.9% 44.1% 0.0%
Cable TV (Foxtel/Austar etc) 11.8% 88.2% 0.0%
Movie Theatre on site 17.6% 76.5% 5.9%
Basic % Extra Service % Not
Acceptable %
Mode 1338 47.1% 1505 52.9% 0 0.0%
Median 1672 58.8% 1003 35.3% 0 0.0%
Mean 1790 63.0% 986 34.7% 66 2.3%

Baby Boomers Expectations of Residential Aged Care – Dr Rodney Jilek - August 2009 27
7. Results - Food Services
Food service expectations were considered to be the furthest from current trends with aged care
(and healthcare in general) moving towards the widespread use of cook chill meals. The results of
this study are particularly significant to the not for profit aged care sector which not only widely
uses cook chill meals but also represents some of the largest providers of this type of food service in
NSW.
An overwhelming 99.2% of participants indicated an expectation that meals would be prepared
fresh onsite by either a qualified chef (33.1%) or a cook (66.1%). Only 23 participants (0.8%)
indicated cook chill meals were their preferred food service model.
Analysis of the desirability data revealed that 67.6% of participants rated cook chill meals as least
desirable. In terms of basic, extra service or unacceptable, cook chill meals were rated
unacceptable by 58.8% of participants.
Analysis of the 39 food options indicated that there was a much more even distribution of
desirability from least desired to most desired reflecting the varied tastes of the participant group.
It is also noted however that on average 68.7% of participants found the listed food options to be a
basic level for residential aged care (modal response 91.4%). This is of significance as a number of
the options are currently included in the commonwealth’s extra service application form reflecting
a view that they are not considered basic options.
7 (a) Meal Preparation Options No. of Responses (n=2843)
Qualified Chef on site 941
Cook prepared meals on site 1879
Cook - Chill meals 23
Food Service Options
0.8%
33.1%
66.1%
0%
10%
20%
30%
40%
50%
60%
70%
80%
90%
100%
Qualified Chef on site Cook prepared meals on site Cook - Chill meals

Baby Boomers Expectations of Residential Aged Care – Dr Rodney Jilek - August 2009 28
Least
Desired %
Slightly
Desired %
Moderately
Desired %
Very
Desired %
Most
Desired %
Mode 538 18.9% 461 16.2% 615 21.6% 461 16.2% 461 16.2%
Median 384 13.5% 384 13.5% 615 21.6% 615 21.6% 692 24.3%
Mean 438 15.4% 386 13.6% 633 22.3% 617 21.7% 768 27.0%
7 (b) Meal Service Options - Desirability Least
Desired
Slightly
Desired
Moderately
Desired
Very
Desired
Most
Desired
Alcohol with meals - beer and wine 13.5% 24.3% 21.6% 21.6% 18.9%
24 hour room service available 18.9% 27.0% 21.6% 16.2% 16.2%
Hot breakfast daily 24.3% 16.2% 21.6% 16.2% 21.6%
Hot breakfast three times per week 27.0% 16.2% 35.1% 16.2% 5.4%
Hot breakfast weekly 27.0% 18.9% 16.2% 16.2% 21.6%
Continental breakfast 24.3% 5.4% 13.5% 21.6% 35.1%
Smorgasbord or multiple options for Breakfast 16.2% 5.4% 37.8% 16.2% 24.3%
Room service breakfast 32.4% 10.8% 18.9% 13.5% 24.3%
Hot meal for midday meal 10.8% 8.1% 27.0% 13.5% 40.5%
Sandwiches for midday meal 18.9% 16.2% 29.7% 24.3% 10.8%
Smorgasbord or multiple options for midday meal 13.5% 8.1% 13.5% 32.4% 32.4%
Dessert with midday meal 16.2% 8.1% 21.6% 21.6% 32.4%
Hot meal for evening midday meal 2.7% 18.9% 21.6% 29.7% 27.0%
Smorgasbord or multiple options for evening meal 21.6% 5.4% 10.8% 27.0% 35.1%
Soup with evening meal 21.6% 16.2% 18.9% 21.6% 21.6%
Sandwiches for evening meal 35.1% 24.3% 5.4% 18.9% 16.2%
Dessert with evening meal 8.1% 13.5% 37.8% 21.6% 18.9%
Vegetarian options 10.8% 13.5% 27.0% 18.9% 29.7%
Vegan options 16.2% 18.9% 21.6% 16.2% 27.0%
Low fat options 5.4% 8.1% 16.2% 27.0% 43.2%
Medical diets (e.g. diabetic / low salt / high fibre) 0.0% 5.4% 5.4% 21.6% 67.6%
Cultural diets (Kosher / Halal etc) 18.9% 8.1% 27.0% 16.2% 29.7%
Cordial 24.3% 18.9% 35.1% 8.1% 13.5%
Chilled Water 0.0% 0.0% 13.5% 32.4% 54.1%
Fruit Juice or Vegetable Juice 0.0% 0.0% 21.6% 27.0% 51.4%
Soft Drink 13.5% 13.5% 43.2% 13.5% 16.2%
Mixed drinks (e.g. lemon lime & bitters etc) 5.4% 18.9% 45.9% 16.2% 13.5%
Red Wine, White Wine, Beer 8.1% 21.6% 29.7% 24.3% 16.2%
Spirits (e.g. Scotch Whisky / Bourbon / Vodka etc) 18.9% 27.0% 27.0% 10.8% 16.2%
Freshly prepared cakes for morning / afternoon tea 8.1% 10.8% 21.6% 43.2% 16.2%
Savoury / Sweet biscuits for morning / afternoon tea 2.7% 16.2% 29.7% 24.3% 27.0%
Sandwiches for morning / afternoon tea 27.0% 29.7% 16.2% 18.9% 8.1%
Special event catering available (birthday,
anniversary celebration etc) 2.7% 2.7% 18.9% 35.1% 40.5%
Fresh fruit available 24 hours 0.0% 0.0% 8.1% 32.4% 59.5%
Qualified chef onsite to prepare meals 5.4% 27.0% 16.2% 18.9% 32.4%
Cook onsite to prepare meals 2.7% 2.7% 16.2% 45.9% 32.4%
Cook-Chill meals (prepared off site and reheated
onsite) 67.6% 16.2% 10.8% 2.7% 2.7%

Baby Boomers Expectations of Residential Aged Care – Dr Rodney Jilek - August 2009 29
Basic % Extra Service % Not
Acceptable %
Mode 2676 94.1% 84 2.9% 0 0.0%
Median 2174 76.5% 334 11.8% 167 5.9%
Mean 1953 68.7% 651 22.9% 240 8.4%
7 (c) Meal Service Options – Basic / Extra Service / Not Acceptable Basic Extra
Service
Not
Acceptable
Alcohol with meals - beer and wine 35.3% 58.8% 5.9%
24 hour room service available 8.8% 79.4% 11.8%
Hot breakfast daily 64.7% 35.3% 0.0%
Hot breakfast three times per week 64.7% 20.6% 14.7%
Hot breakfast weekly 70.6% 2.9% 26.5%
Continental breakfast 79.4% 2.9% 17.6%
Smorgasbord or multiple options for Breakfast 52.9% 29.4% 17.6%
Room service breakfast 44.1% 41.2% 14.7%
Hot meal for midday meal 94.1% 2.9% 2.9%
Sandwiches for midday meal 82.4% 0.0% 17.6%
Smorgasbord or multiple options for midday meal 44.1% 50.0% 5.9%
Dessert with midday meal 88.2% 8.8% 2.9%
Hot meal for evening midday meal 88.2% 8.8% 2.9%
Smorgasbord or multiple options for evening meal 41.2% 44.1% 14.7%
Soup with evening meal 85.3% 8.8% 5.9%
Sandwiches for evening meal 73.5% 2.9% 23.5%
Dessert with evening meal 88.2% 11.8% 0.0%
Vegetarian options 91.2% 8.8% 0.0%
Vegan options 85.3% 14.7% 0.0%
Low fat options 97.1% 2.9% 0.0%
Medical diets (e.g. diabetic / low salt / high fibre) 94.1% 5.9% 0.0%
Cultural diets (Kosher / Halal etc) 76.5% 14.7% 8.8%
Cordial 85.3% 5.9% 8.8%
Chilled Water 97.1% 2.9% 0.0%
Fruit Juice or Vegetable Juice 94.1% 5.9% 0.0%
Soft Drink 73.5% 17.6% 8.8%
Mixed drinks (e.g. lemon lime & bitters etc) 50.0% 47.1% 2.9%
Red Wine, White Wine, Beer 29.4% 64.7% 5.9%
Spirits (e.g. Scotch Whisky / Bourbon / Vodka etc) 5.9% 82.4% 11.8%
Freshly prepared cakes for morning / afternoon tea 82.4% 17.6% 0.0%
Savoury / Sweet biscuits for morning / afternoon tea 91.2% 8.8% 0.0%
Sandwiches for morning / afternoon tea 52.9% 32.4% 14.7%
Special event catering available (birthday, anniversary celebration etc) 55.9% 41.2% 2.9%
Fresh fruit available 24 hours 94.1% 5.9% 0.0%
Qualified chef onsite to prepare meals 41.2% 55.9% 2.9%
Cook onsite to prepare meals 97.1% 2.9% 0.0%
Cook-Chill meals (prepared off site and reheated onsite) 41.2% 0.0% 58.8%

Baby Boomers Expectations of Residential Aged Care – Dr Rodney Jilek - August 2009 30
8. Results – Dining Options
8 (a) Dining Options - Desirability Least
Desired
Slightly
Desired
Moderately
Desired
Very
Desired
Most
Desired
Meals served in a central dining room 2.7% 5.4% 24.3% 45.9% 21.6%
Meals available in room 2.7% 8.1% 29.7% 27.0% 32.4%
Alfresco dining available 13.5% 16.2% 16.2% 27.0% 27.0%
Special event menus available (birthdays etc) 5.4% 10.8% 16.2% 29.7% 37.8%
Cultural menus available 10.8% 5.4% 18.9% 40.5% 24.3%
Set Menu available 10.8% 5.4% 40.5% 21.6% 21.6%
A la carte menu (selection from multiple items) 10.8% 8.1% 13.5% 35.1% 32.4%
Menu selection the day before dining 2.7% 13.5% 21.6% 29.7% 32.4%
Restaurant style atmosphere / ambience 5.4% 13.5% 21.6% 29.7% 29.7%
Background music during dining 8.1% 21.6% 24.3% 21.6% 24.3%
Waiter service 16.2% 27.0% 21.6% 16.2% 18.9%
Self service smorgasbord style dining 21.6% 13.5% 24.3% 27.0% 13.5%
Fine china and glassware 10.8% 24.3% 29.7% 21.6% 13.5%
Linen tablecloths 13.5% 10.8% 35.1% 21.6% 18.9%
Paper tablecloths 45.9% 10.8% 29.7% 5.4% 8.1%
Standard crockery and glassware 5.4% 8.1% 32.4% 32.4% 21.6%
Room service available breakfast 10.8% 13.5% 29.7% 18.9% 27.0%
Room service available midday meal 10.8% 16.2% 35.1% 13.5% 24.3%
Room service available evening meal 8.1% 18.9% 29.7% 13.5% 29.7%
Room service available 24 hours per day 27.0% 27.0% 32.4% 0.0% 13.5%
Private dining available for small groups / guests 2.7% 16.2% 43.2% 16.2% 21.6%
Takeaway meals available (Chinese / pizza etc) 8.1% 16.2% 37.8% 24.3% 13.5%
Cafe available on site 8.1% 16.2% 21.6% 24.3% 29.7%
Linen serviettes 10.8% 32.4% 21.6% 21.6% 13.5%
Paper serviettes 10.8% 8.1% 32.4% 29.7% 18.9%
Themed menu days (Christmas in July etc) 2.7% 2.7% 13.5% 37.8% 43.2%
Traditional Christmas Day lunch 0.0% 8.1% 10.8% 32.4% 48.6%
Least
Desired %
Slightly
Desired %
Moderately
Desired %
Very
Desired %
Most
Desired %
Mode 307 10.8% 231 8.1% 845 29.7% 615 21.6% 384 13.5%
Median 307 10.8% 384 13.5% 692 24.3% 692 24.3% 692 24.3%
Mean 302 10.6% 398 14.0% 746 26.2% 700 24.6% 697 24.5%

Baby Boomers Expectations of Residential Aged Care – Dr Rodney Jilek - August 2009 31
8 (b) Dining Options – Basic / Extra Service / Not Applicable Basic Extra
Service
Not
Acceptable
Meals served in a central dining room 97.1% 0.0% 2.9%
Meals available in room 67.6% 32.4% 0.0%
Alfresco dining available 58.8% 32.4% 8.8%
Special event menus available (birthdays etc) 58.8% 38.2% 2.9%
Cultural menus available 76.5% 23.5% 0.0%
Set Menu available 94.1% 0.0% 5.9%
A la carte menu (selection from multiple items) 41.2% 47.1% 11.8%
Menu selection the day before dining 88.2% 2.9% 8.8%
Restaurant style atmosphere / ambience 52.9% 41.2% 5.9%
Background music during dining 82.4% 11.8% 5.9%
Waiter service 32.4% 52.9% 14.7%
Self service smorgasbord style dining 64.7% 17.6% 17.6%
Fine china and glassware 41.2% 52.9% 5.9%
Linen tablecloths 64.7% 32.4% 2.9%
Paper tablecloths 55.9% 2.9% 41.2%
Standard crockery and glassware 100.0% 0.0% 0.0%
Room service available breakfast 50.0% 44.1% 5.9%
Room service available midday meal 38.2% 55.9% 5.9%
Room service available evening meal 41.2% 52.9% 5.9%
Room service available 24 hours per day 11.8% 73.5% 14.7%
Private dining available for small groups / guests 17.6% 79.4% 2.9%
Takeaway meals available (Chinese / pizza etc) 29.4% 67.6% 2.9%
Cafe available on site 41.2% 55.9% 2.9%
Linen serviettes 41.2% 52.9% 5.9%
Paper serviettes 91.2% 2.9% 5.9%
Themed menu days(Christmas in July etc) 85.3% 14.7% 0.0%
Traditional Christmas Day lunch 91.2% 2.9% 5.9%
Basic % Extra Service % Not
Acceptable %
Mode 1171 41.2% 84 2.9% 167 5.9%
Median 1672 58.8% 920 32.4% 167 5.9%
Mean 1700 59.8% 938 33.0% 204 7.2%

Baby Boomers Expectations of Residential Aged Care – Dr Rodney Jilek - August 2009 32
9. Results – Fee Options
The results indicate that while there may be a concentration of expectation at the lower levels of
fees, there is also a spread of participants willing to pay at all fee levels to varying degrees.
Similarly with accommodation bonds, participant responses were spread across all levels from
below $100,000 up to $1,000,000. This result should provide some comfort to aged care providers
planning on expanding into the aged care arenas where accommodation bonds are permitted.
Expectations surrounding government contributions were in line with current practice with 71% of
participants citing an expected government contribution of between 50% and 70% of total costs.
70% of participants stated they would consider paying a higher accommodation bond if they
would then receive the aged pension and similarly 71% of participants stated they would consider
paying a higher bond if the daily fees were lowered. Only 38% of participants stated they would
prefer a higher daily fee in lieu of no accommodation bond.
9 (a) Maximum Daily Care Fee No. of Responses (n=2843)
$30 - $35 270
$35 - $40 332
$40 - $45 732
$45 - $50 331
$50 - $55 385
$55 - $60 384
$60 - $65 116
$65 - $70 77
$70 - $75 23
$75 - $80 31
$80 - $90 9
$90 - $100 153
Maximum Daily Care Fee
11.7% 11.6%
0.8% 1.1% 0.3%
5.4%2.7%4.1%
13.5%13.5%
25.7%
9.5%
0%
10%
20%
30%
40%
50%
60%
70%
80%
90%
100%
$30 -
$35
$35 -
$40
$40 -
$45
$45 -
$50
$50 -
$55
$55 -
$60
$60 -
$65
$65 -
$70
$70 -
$75
$75 -
$80
$80 -
$90
$90 -
$100

Baby Boomers Expectations of Residential Aged Care – Dr Rodney Jilek - August 2009 33
9 (b) Maximum Extra Service No. of Responses (n=2843)
Less than $30 595
$30 - $35 44
$35 - $40 231
$40 - $45 77
$45 - $50 412
$50 - $55 408
$55 - $60 154
$60 - $65 203
$65 - $70 155
$70 - $75 87
$75 - $80 33
$80 - $90 38
$90 - $100 406
Maximum Extra Service Fee
20.9%
1.5% 2.7% 1.2% 1.3%
14.3%
3.1%5.5%7.1%5.4%
14.4%14.5%
8.1%
0%
10%
20%
30%
40%
50%
60%
70%
80%
90%
100%
Less
than
$30
$30 -
$35
$35 -
$40
$40 -
$45
$45 -
$50
$50 -
$55
$55 -
$60
$60 -
$65
$65 -
$70
$70 -
$75
$75 -
$80
$80 -
$90
$90 -
$100

Baby Boomers Expectations of Residential Aged Care – Dr Rodney Jilek - August 2009 34
9 (c) Accommodation Bond - Maximum No. of Responses (n=2843)
Less than $100K 453
$100 - $150K 442
$150 - $200K 537
$200 - $300K 528
$300 - $400K 346
$400 - $500K 154
$500 - $600K 152
$600 - $700K 115
$700 - $800K 0
$800 - $900K 39
$900 - $1MILL 77
More than $1MILL 0
Maximum Accommodation Bond
12.2%
0.0% 1.4% 0.0%
2.7%4.0%5.3%5.4%
18.6%18.9%15.5%15.9%
0%
10%
20%
30%
40%
50%
60%
70%
80%
90%
100%
Less
than
$100K
$100 -
$150K
$150 -
$200K
$200 -
$300K
$300 -
$400K
$400 -
$500K
$500 -
$600K
$600 -
$700K
$700 -
$800K
$800 -
$900K
$900 -
$1MILL
More
than
$1MILL

Baby Boomers Expectations of Residential Aged Care – Dr Rodney Jilek - August 2009 35
9 (d) Commonwealth Funding No. of Responses (n=2843)
10% 3
20% 5
30% 77
40% 399
50% 616
60% 639
70% 755
80% 116
90% 231
100% 2
Expected Commonwealth Contribution
0.1% 0.2%2.7%
21.7% 22.5%
0.1%
8.1%4.1%
26.6%
14.0%
0%
10%
20%
30%
40%
50%
60%
70%
80%
90%
100%
10
percent
20
percent
30
percent
40
percent
50
percent
60
percent
70
percent
80
percent
90
percent
100
percent
9 (e) Would you consider paying a higher
accommodation bond amount if you were then able to
receive the aged pension?
No. of Responses (n=2843)
Yes 1999
No 844
Higher Bond = Pension
70.3%
29.7%
0%
10%
20%
30%
40%
50%
60%
70%
80%
90%
100%
Yes No

Baby Boomers Expectations of Residential Aged Care – Dr Rodney Jilek - August 2009 36
9 (f) Would you pay a higher accommodation bond
amount if you were able to lower your daily fees? No. of Responses (n=2843)
Yes 2019
No 824
Higher Accommodation Bond = Lower Fees
71.0%
29.0%
0%
10%
20%
30%
40%
50%
60%
70%
80%
90%
100%
Yes No
9 (g) Would you prefer to pay higher daily fees and not
pay a lump sum accommodation bond? No. of Responses (n=2843)
Yes 1071
No 1772
Higher Daily Fees = No Accommodation Bond
62.3%
37.7%
0%
10%
20%
30%
40%
50%
60%
70%
80%
90%
100%
Yes No

Baby Boomers Expectations of Residential Aged Care – Dr Rodney Jilek - August 2009 37
10. Results – Extra Service
10 (a) Extra Service or Standard? No. of Responses (n=2843)
Would you consider extra service aged care instead of standard aged care?
Yes 1514
No 1329
Would Consider Extra Service
53.3%
46.7%
0%
10%
20%
30%
40%
50%
60%
70%
80%
90%
100%
Yes No
10 (b) Extra Service – Additional Staffing Desirability No. of Responses (n=2843)
Additional levels of staffing are NOT currently a feature of a feature of
extra service facilities - how much do you value additional levels of
staffing?
Not Desired 0
Slightly Desired 4
Moderately Desired 349
Very Desired 2157
Most Desired 333
Extra Service = Extra Staff
0.0% 0.1%
12.3% 11.7%
75.9%
0%
10%
20%
30%
40%
50%
60%
70%
80%
90%
100%
Not Desired Slightly Desired Moderately
Desired
Very Desired Most Desired

Baby Boomers Expectations of Residential Aged Care – Dr Rodney Jilek - August 2009 38
10 (c) Extra Service – Additional Staff Quantity No. of Responses (n=2843)
What percentage would reflect the amount of additional staff you would expect in an extra service facility?
No extra 0
10% 314
25% 1677
50% 468
75% 307
100% 77
Extra Service = Extra Staff
0.0%
11.0%
59.0%
10.8%
2.7%
16.5%
0%
10%
20%
30%
40%
50%
60%
70%
80%
90%
100%
No extra 10 percent 25 percent 50 percent 75 percent 100 percent

Baby Boomers Expectations of Residential Aged Care – Dr Rodney Jilek - August 2009 39
10 (d) Most Popular Extra Service Options Response Rate
Additional Staff 99.9%
Cable TV (Foxtel/Austar etc) 88.2%
Spirits (e.g. Scotch Whisky / Bourbon / Vodka etc) 82.4%
24 hour room service available 79.4%
Private dining available for small groups / guests 79.4%
Spa bath available 78.8%
Complementary Therapies (e.g. Naturopath / Acupuncture) 78.1%
Movie Theatre on site 76.5%
Outings to sporting events 73.5%
Room service available 24 hours per day 73.5%
One bedroom Apartment 73.0%
Chiropractic 71.9%
Holidays away from care facility 70.6%
Swimming pool - indoor 69.7%
Takeaway meals available (Chinese / pizza etc) 67.6%
Movie theatre 66.7%
Outings to local cafe or restaurants 64.7%
Red Wine, White Wine, Beer 64.7%
Queen bed 63.6%
Massage Therapy 62.5%
Aromatherapy 62.5%
Visits to galleries or museums 61.8%
Computers and internet in bedroom 61.8%
Swimming pool - outdoor 60.6%
X-Ray Services 59.4%
Alcohol with meals - beer and wine 58.8%
Beautician / manicurist 55.9%
Hairdressing salon on site 55.9%
Qualified chef onsite to prepare meals 55.9%
Room service available midday meal 55.9%
Cafe available on site 55.9%
Speech Pathology 53.1%
Heated Swimming Pool 52.9%
Outdoor non-heated swimming pool 52.9%
Live Entertainment 52.9%
Wireless internet 52.9%
Waiter service 52.9%
Fine china and glassware 52.9%
Room service available evening meal 52.9%
Linen serviettes 52.9%
Computer / Internet access in room 51.5%
Double bed 51.5%
Studio Apartment 51.4%
Cafe on site 50.0%
Smorgasbord or multiple options for midday meal 50.0%

Baby Boomers Expectations of Residential Aged Care – Dr Rodney Jilek - August 2009 40
11. Results – Most Desirable Options (Top 50)
Telephone in room 81.1%
Ensuite bathroom 78.4%
Medical diets (e.g. diabetic / low salt / high fibre) 67.6%
Televisions in room 67.6%
Air conditioning - reverse cycle 64.9%
Library 64.9%
Television in bedroom 64.9%
Fresh fruit available 24 hours 59.5%
Palliative / End of Life Care specialist nurse available 59.5%
Chilled Water 54.1%
Fruit Juice or Vegetable Juice 51.4%
Quiet Room / Relaxation area 51.4%
DVD player in room 51.4%
Computer / Internet access in room 51.4%
Dementia Care specialist nurse available 51.4%
Television in communal lounge room only 51.4%
Traditional Christmas Day lunch 48.6%
Inter-connecting rooms for couples 48.6%
Library 48.6%
Communal lounge room 48.6%
Bus trips weekly 48.6%
Daily newspapers and magazines 48.6%
Recliner chairs in room 45.9%
Physical Therapy / Rehabilitation specialist nurse available 45.9%
Internet connections in bedroom 45.9%
Low fat options 43.2%
Themed menu days(Christmas in July etc) 43.2%
Eco-friendly environment 43.2%
Dental Services 43.2%
Diversional Therapy 43.2%
Hot meal for midday meal 40.5%
Special event catering available (birthday, anniversary celebration etc) 40.5%
Communal dining room 40.5%
Podiatry 40.5%
X-Ray Services 40.5%
Shopping trips 40.5%
DVD / Video in lounge areas 40.5%
Wireless internet 40.5%
Special event menus available (birthdays etc) 37.8%
Physiotherapy 37.8%
Cards / table games 37.8%
Computers and internet in bedroom 37.8%
Gardening 37.8%
Continental breakfast 35.1%
Smorgasbord or multiple options for evening meal 35.1%
Lounge area in room 35.1%
Chapel / Church / Sacred Space 35.1%
Computers and internet in library area 35.1%
DVD / Video in bedroom 35.1%
Hairdressing salon on site 35.1%

Baby Boomers Expectations of Residential Aged Care – Dr Rodney Jilek - August 2009 41
12. Results – Least Desirable Options (Top 50)
Shared bathroom 81.1%
Cook-Chill meals (prepared off site and reheated onsite) 67.6%
Paper tablecloths 45.9%
Single bed 45.9%
Heating only 43.2%
Ceiling fans only 40.5%
Sandwiches for evening meal 35.1%
Room service breakfast 32.4%
Double bed 29.7%
Hot breakfast three times per week 27.0%
Hot breakfast weekly 27.0%
Sandwiches for morning / afternoon tea 27.0%
Room service available 24 hours per day 27.0%
Swimming pool - outdoor 27.0%
Bus trips monthly 27.0%
Hot breakfast daily 24.3%
Continental breakfast 24.3%
Cordial 24.3%
King single bed 24.3%
Smorgasbord or multiple options for evening meal 21.6%
Soup with evening meal 21.6%
Self service smorgasbord style dining 21.6%
24 hour room service available 18.9%
Sandwiches for midday meal 18.9%
Cultural diets (Kosher / Halal etc) 18.9%
Spirits (e.g. Scotch Whisky / Bourbon / Vodka etc) 18.9%
Queen bed 18.9%
Smorgasbord or multiple options for Breakfast 16.2%
Dessert with midday meal 16.2%
Vegan options 16.2%
Waiter service 16.2%
Carpet throughout care facility 16.2%
Aromatherapy 16.2%
Complementary Therapies (e.g. Naturopath / Acupuncture) 16.2%
Outdoor non-heated swimming pool 16.2%
Men's Club 16.2%
Alcohol with meals - beer and wine 13.5%
Smorgasbord or multiple options for midday meal 13.5%
Soft Drink 13.5%
Alfresco dining available 13.5%
Linen tablecloths 13.5%
Spa bath available 13.5%
Hot meal for midday meal 10.8%
Vegetarian options 10.8%
Cultural menus available 10.8%
Set Menu available 10.8%
A la carte menu (selection from multiple items) 10.8%
Fine china and glassware 10.8%
Room service available breakfast 10.8%
Room service available midday meal 10.8%

Baby Boomers Expectations of Residential Aged Care – Dr Rodney Jilek - August 2009 42
13. Conclusions
Baby boomers will represent the most articulate and discerning aged care consumers ever
experienced by the aged care sector. This is already being felt by aged care providers through the
involvement of the baby boomer children of current residents. This impact will only increase as
more baby boomers become direct consumers of aged care services.
To simply say that baby boomers will not access residential aged care services is erroneous and
unachievable – very few people actively plan for admission to an aged care facility and fewer still
actually want to be there. In terms of supply, the commonwealth government and aged care
providers need to start planning now for the increase in numbers from this generational group. Even
if the current trends of aged care admissions continue without rise (currently approximately12% of
the 70 year + population enter residential aged care – approx 226,500 people in 2008 - both respite
and permanent) the resultant residential aged care admission pressure will exceed 480,000 in 2022.
The participants of this study were able to effectively identify the desirability of over 300 options and
provided clear data representing their expectations of residential aged care. An important point
for the not for profit sector was the move away from the religious denomination loyalty shown by
current aged care consumers to a loyalty based upon cost, options available and value for
money.
The participants articulated a willingness to pay for their aged care services although their ability to
pay may be questioned given the meagre savings accumulated in superannuation by many of the
participants. This disparity will need to be acknowledged and addressed by both the generation
themselves and the commonwealth government.
Similarly with accommodation bonds, participant responses were spread across all levels from
below $100,000 up to $1,000,000. This result should provide some comfort to aged care providers
planning on expanding into the aged care arenas where accommodation bonds are permitted
such as extra service.
Expectations surrounding government contributions were in line with current practice with 71% of
participants citing an expected government contribution of between 50% and 70% of total costs.
70% of participants stated they would consider paying a higher accommodation bond if they
would then receive the aged pension and similarly 71% of participants stated they would consider
paying a higher bond if the daily fees were lowered. Only 38% of participants stated they would
prefer a higher daily fee in lieu of paying no accommodation bond.
While many of the expected options are already in place within the aged care sector, a number of
areas of expectation clearly exceeded the current standards, particularly in the area of staffing
levels. Additional staffing as a demonstrative option of extra service aged care was clearly an
expectation with 99.9% of participants indicating additional staff was moderately desirable, very
desirable or their most desirable option. The most commonly selected percentage of additional
staff was 25% with almost 60% of participants selecting this level of extra staff. Additional staffing
was only explored as an extra service option to determine whether the current extra service format
provided by the Department of Health & Ageing accurately reflected consumer demand.
Additional staffing in standard residential aged care was not examined due to the lack of
consistency across the industry and the absence of comparable data. It is expected that similar
expectations would have been highlighted if additional staffing in standard residential aged care
had been examined.
This disparity in expectation needs to be addressed through education by both the commonwealth
government, aged care providers and peak bodies to ensure that future residents clearly
understand the financial and workforce constraints of the sector and the resultant restriction on
staffing levels. If community education is not successful and this level of expectation continues, a
major review of funding will be required to meet the staffing expectations of this generational
group.
Both mandatory staffing levels set by the Department of Health and Ageing or public
benchmarking of staffing levels should be considered to provide the general public and Aged
Care Standards and Accreditation Agency with greater transparency and a context within which
to accurately assess ‘appropriate’ staffing levels.

Baby Boomers Expectations of Residential Aged Care – Dr Rodney Jilek - August 2009 43
Mandatory staffing levels and/or ratios have long been discussed across the industry with the
common perception being that this will never become a reality due to the reluctance of the
Department of Health and Ageing (i.e. commonwealth government) to fund higher (appropriate)
levels of staff. The current accreditation standards fail to appropriately assess whether staffing in a
facility is adequate due to the subjectivity of the accreditation process, a lack of an objective
standard and no available evidence based staffing ratios.
The matching of staffing levels to resident care need and the matching of funding levels directly
related to the real cost of staffing must be addressed as a priority to ensure appropriate levels and
mix of staffing are provided and the staffing expectations of this generation can be effectively
managed in a context of providing world class aged care. A number of aged care providers use
their own internally developed staffing ratios and tools but the accuracy and effectiveness of such
tools cannot be assessed and are inconsistent across providers.
For the not for profit religious sector, two major finding were highlighted that may have a future
negative impact on this particular group of providers:
• The reluctance of this generational group to choose aged care based upon religious
denomination or affiliation. This differs significantly from the current generation of aged
care residents who are overtly drawn towards a provider because of a long standing
religious affiliation. 86% of participants indicated they would not choose a care provider
based upon religious denomination.
• The overwhelming rejection of cook-chill meals. As the not for profit sector is both a
large scale producer and consumer of this type of food service, this may have a
significant negative impact on services choosing to continue cook-chill meal service to
this generational group. A considerable shift in public opinion needs to be achieved
through education and an increase in food quality if this type of food service is to
continue. This is not assisted by the linkages to perceptions of public hospital food
services which have a notoriously negative reputation with the general public.
A final conclusion drawn from the completion of this study is related to the aged care industry’s
willingness (or absence of) to openly embrace research as a tool to explore emerging trends, build
evidence based practice and thus improve the lives of residents and the performance of individual
facilities. The residential aged care organisations that chose to participate represented less than
10% of those invited, with some individual homes choosing to participate when the organisation
had declined thus making research participation dependant on individual managers of services
with no priority assigned by the overarching organisation. Without robust examination of practices
and evidence based exploration of new ideas, the aged care sector will fail to meet the needs
and expectations of our stakeholders and continue to feature predominately in the negative
perceptions of the general public.
The researcher would like to again thank the participating organisations and more importantly the
2,843 baby boomers that most generously gave their time and provided their opinions and
expectations.
It is hoped that this research will provide valuable data to aged care providers and the
Department of Health and Ageing for strategic planning processes and policy development.
Further widespread research and discussion is required to ensure the aged care sector, in
partnership with the Department of Health and Ageing, is able to move to meet the needs and
expectations of the baby boomer generation in Australia in a planned and evidence based
manner.