BABOK® v3 Demystified Webinar Seriesfhyzics.com/images/Financial-Analysis.pdf · BABOK® v3...
24
BABOK® v3 Demystified Webinar Series Chapter: Chennai IIBA® Chapter Date & Time: 19-Jan-17 | 6:30 to 7:30 PM IST Topic: Financial Analysis Presenter: Jegan Jayabal, MBA
Transcript of BABOK® v3 Demystified Webinar Seriesfhyzics.com/images/Financial-Analysis.pdf · BABOK® v3...
BABOK® v3 Demystified Webinar Series
Chapter: Chennai IIBA® Chapter
Date & Time: 19-Jan-17 | 6:30 to 7:30 PM IST
Topic: Financial Analysis
Presenter: Jegan Jayabal, MBA

2
Financial Analysis
• Financial analysis is used to understand the financial aspects of an investment, a solution, or a solution approach
• Financial analysis is the assessment of the expected financial viability, stability, and benefit realization of an investment option
• Financial analysis results of one investment option with that of other possible investments to make decisions about which change initiatives to support

3
Financial Analysis • Business analysts use financial analysis to make a solution
recommendation for an investment in a specific change initiative by comparing one solution or solution approach to others, based on analysis of the:
• Initial cost and the time frame in which those costs are incurred
• Expected financial benefits and the time frame in which they will be incurred
• On going costs of using the solution and supporting the solution
• Risks associated with the change initiative, and
• Ongoing risks to business value of using that solution.
4
Elements: Cost of the Change
• The cost of a change includes the expected cost of building or acquiring the solution components and the expected costs of transitioning the enterprise from the current state to the future state.
• This could include the costs associated with changing equipment and software, facilities, staff and other resources, buying out existing contracts, subsidies, penalties, converting data, training, communicating the change, and managing the roll out.
• These costs may be shared between organizations within the enterprise.

5
Elements: Total Cost of Ownership(TCO)
• The total cost of ownership (TCO) is the cost to acquire a solution, the cost of using the solution, and the cost of supporting the solution for the foreseeable future, combined to help understand the potential value of a solution
• In the case of equipment and facilities, there is often a generally agreed to life expectancy
• Some organizations assume a standard time period (for example, three to five years) to understand the costs of ownership of intangibles like processes and software
6
Elements: Value Realization
• Value is typically realized over time
• The planned value could be expressed on an annual basis, or could be expressed as a cumulative value over a specific time period

7
Elements: Cost-Benefit Analysis
• Cost-benefit analysis (sometimes called benefit-cost analysis) is a prediction of the expected total benefits minus the expected total costs, resulting in an expected net benefit (the planned business value)
• The costs and benefits will often be estimated based on those assumptions, and the estimating methodology should be described so that it can be reviewed and adjusted if necessary
• The time period of a cost-benefit analysis should look far enough into the future that the solution is in full use, and the planned value is being realized

8
Example

9
Elements: Financial Calculations
• Organizations use a combination of standard financial calculations to understand different perspectives about when and how different investments deliver value
• Financial software, including spread sheets, typically provide pre-programmed functions to correctly perform these financial calculations
• Return on Investment
• Discount Rate
• Present Value
• Net Present Value
• Payback Period

10
Return on Investment
• The return on investment (ROI) of a planned change is expressed as a percentage measuring the net benefits divided by the cost of the change
• One change initiative, solution, or solution approach may be compared to that of others to determine which one provides the greater overall return relative to the amount of the investment
• The formula to calculate ROI is:
Return on Investment = (Total Benefits – Cost of the Investment) / Cost of the Investment

11
Example
• Your Investment to buy a car was ₹1000
• You sell the car at ₹1500
• Net Profit = (₹1500 - ₹1000) = ₹500
• ROI = ₹500/₹1000 = 50%

12
Discount Rate
• The discount rate is the assumed interest rate used in present value calculations. In general, this is similar to the interest rate that the organization would expect to earn if it invested its money elsewhere
• Many organizations use a standard discount rate, usually determined by its finance officers, to evaluate potential investments such as change initiatives using the same assumptions about expected interest rates
• Sometimes a larger discount rate is used for time periods that are more than a few years into the future to reflect greater uncertainty and risk

13
Present Value
• Different solutions and different solution approaches could realize benefits at different rates and over a different time
• To objectively compare the effects of these different rates and time periods, the benefits are calculated in terms of present-day value
• Sometimes a larger discount rate is used for time periods that are more than a few years into the future to reflect greater uncertainty and risk
• The formula to calculate present value is:
Present Value = Sum of (Net Benefits in that period / (1 + Discount Rate for that period)) for all periods in the cost-benefit analysis
14
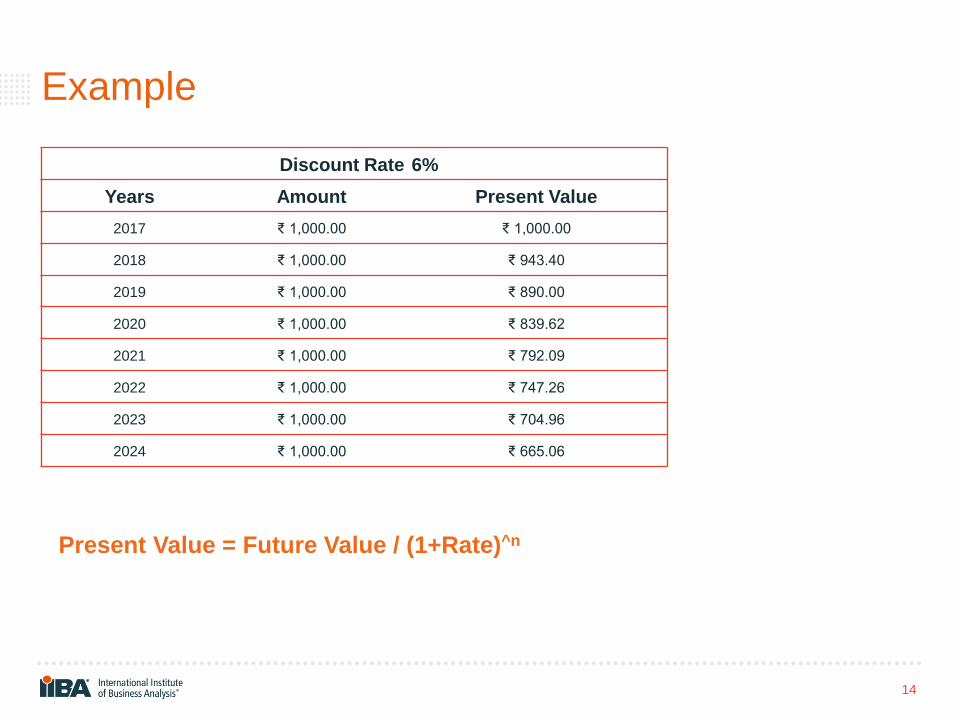
Example
Discount Rate 6%
Years Amount Present Value
2017 ₹ 1,000.00 ₹ 1,000.00
2018 ₹ 1,000.00 ₹ 943.40
2019 ₹ 1,000.00 ₹ 890.00
2020 ₹ 1,000.00 ₹ 839.62
2021 ₹ 1,000.00 ₹ 792.09
2022 ₹ 1,000.00 ₹ 747.26
2023 ₹ 1,000.00 ₹ 704.96
2024 ₹ 1,000.00 ₹ 665.06
Present Value = Future Value / (1+Rate)^n
15
Net Present Value
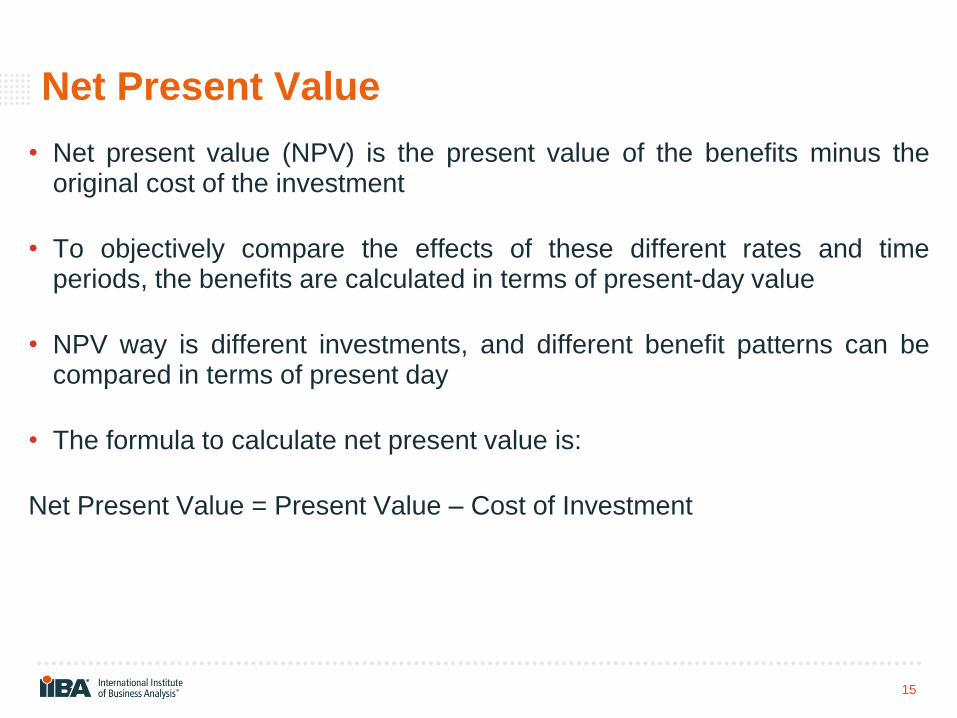
• Net present value (NPV) is the present value of the benefits minus the original cost of the investment
• To objectively compare the effects of these different rates and time periods, the benefits are calculated in terms of present-day value
• NPV way is different investments, and different benefit patterns can be compared in terms of present day
• The formula to calculate net present value is:
Net Present Value = Present Value – Cost of Investment

16
Example
17
Payback Period
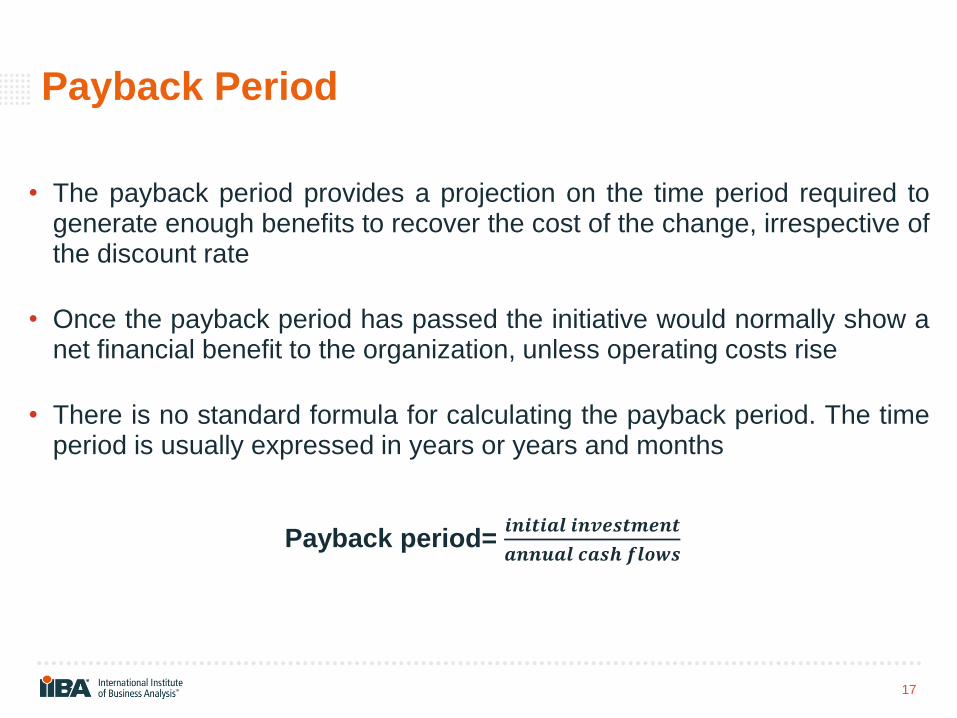
• The payback period provides a projection on the time period required to generate enough benefits to recover the cost of the change, irrespective of the discount rate
• Once the payback period has passed the initiative would normally show a net financial benefit to the organization, unless operating costs rise
• There is no standard formula for calculating the payback period. The time period is usually expressed in years or years and months
Payback period= 𝒊𝒏𝒊𝒕𝒊𝒂𝒍 𝒊𝒏𝒗𝒆𝒔𝒕𝒎𝒆𝒏𝒕
𝒂𝒏𝒏𝒖𝒂𝒍 𝒄𝒂𝒔𝒉 𝒇𝒍𝒐𝒘𝒔

18
Example
Givens 0 1 2 3 4 5
1. Initial investment (15,000,000)
2. Net opening
cash flows 2,000,000 4,000,000 5,000,000 8,000,000 16,000,000
Solution:
Givens 0 1 2 3 4 5
A. Initial
investment [Given 1] (15,000,000)
B. Net opening
cash flows [Given 2] 2,000,000 4,000,000 5,000,000 8,000,000 16,000,000
C. Cumulative
Cash Flows (a)
(15,000,000)
(13,000,000) (9,000,000) (4,000,000) 4,000,000 20,000,000
Payback = year 3.5
19
Strengths
• Financial analysis allows executive decision makers to objectively compare very different investments from different perspectives
• Assumptions and estimates built into the benefits and costs, and into the financial calculations, are clearly stated so that they may be challenged or approved
• It reduces the uncertainty of a change or solution by requiring the identification and analysis of factors that will influence the investment
• If the context, business need, or stakeholder needs change during a change initiative, it allows the business analyst to objectively re-evaluate the recommended solution
20
Limitations
• Some costs and benefits are difficult to quantify financially
• Because financial analysis is forward looking, there will always be some uncertainty about expected costs and benefits
• Positive financial numbers may give a false sense of security —they may not provide all the information required to understand an initiative

21
About Fhyzics
Fhyzics, a leader in Business Analysis Services and Training, is an Endorsed Education Provider [EEPTM] of International Institute of
Business Analysis [IIBA®], Canada.
www.fhyzics.com
For more details about our course, please speak to Bharathi at +91-900-305-9000

22
Next Webinar: Mind Mapping
23-Feb-2017 [Thursday]

23

24
Thank You Webinar Platform Compliments from
Fhyzics Business Consultants Private Limited
Presented By
Mr. Jegan Jayabal, MBA
Assistant Vice President [Training]


![BABOK® V3 Perspectives: What are they? - aspe-sdlc.com · BABOK® V3 Perspectives: What are they? Eugenia [Gina] Schmidt, PMP CBAP PBA Fraser Michigan ... As described in the BABOK®](https://static.fdocuments.net/doc/165x107/5ac59f0b7f8b9a5c558d79ce/babok-v3-perspectives-what-are-they-aspe-sdlc-v3-perspectives-what-are-they.jpg)