B3 record keeping
30
On-Farm Record Keeping If it’s not measures it’s not managed ACORN 2016 Ironwood Organics
-
Upload
acornorganic -
Category
Business
-
view
28 -
download
4
Transcript of B3 record keeping

On-Farm Record Keeping
If it’s not measuresit’s not managed
ACORN 2016Ironwood Organics

Historical Look Back• Starts with sharing memories and methods• History is based on it, it is our ‘knowledge
base’• All living things carry a ‘memory’ of the
past• Human records represent collective
learning:– first in oral tradition, then mnemonics, then art, epic
poems, written texts, and wiki’s

Why Keep Records• Compliance• Financial• Cost of production• Traceability• Too much to remember• Long time frames• Knowledge capital of the farm• Form the basis for analysis and management

A management question• Ultimately it is about management• If it’s not measured, it’s not managed• The success of management is tied to
success of measurement• But if your not going to manage, why
measure – just another overhead• Move towards organizational maturity• If it didn’t happen twice,
it didn’t really happenAssess
Change / Modify
Measure

Types of Records• Assets / Inventory• Activities• Financial• Spatial / Maps• Certification /Accreditation / Memberships • Observations• Contacts• Breeding (plant / animal)…….
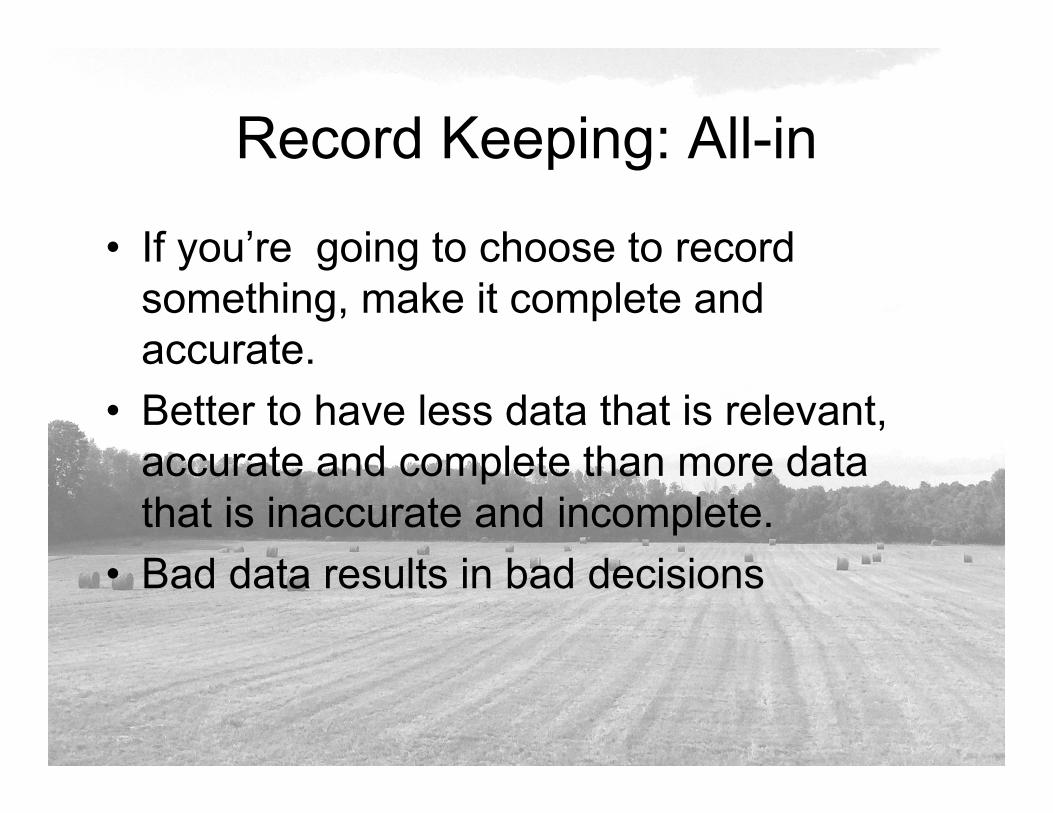
Record Keeping: All-in
• If you’re going to choose to record something, make it complete and accurate.
• Better to have less data that is relevant, accurate and complete than more data that is inaccurate and incomplete.
• Bad data results in bad decisions

What is appropriate data• Mandatory recording keeps you in compliance• Optional record keeping is based on your
questions• Incomplete or inaccurate records can be very
costly• Work backwards from your questions
– What are my questions?– What do I need to answer that question over what
time period?– Where can I get that data from?– What do I need to record?

Possible questions• Which crops take the most man hours, tractor hours?• What equipment isn’t being used to its potential?• What is costing me too much to maintain?• Is preventative maintenance paying off?• Which implement is being used the most – replace for a
‘better one’?• What is the crop history for a certain field?• What is the grow history for a certain crop?• What is the max/min/mean rainfall for the last 5 years?• Which crops were most profitable from a labour
perspective?• Which crop varieties performed best in a drought year?

Moving from Lists to Insights• Basic level is a series of lists or inventories
– List of equipment– List of fields– List of crops for the year– List of field activities
• Linking lists provide a ‘view’ from a different perspective
• Stand on the ‘entity’ and look at the ‘attributes’

Entities and Attributes• Ones person’s entity is another person’s
attributes.• The same ‘thing’ can mean something
different to different people.• How do we model the vast array of ‘things’
on a farm operation, and the relationship between and among those things, over time?
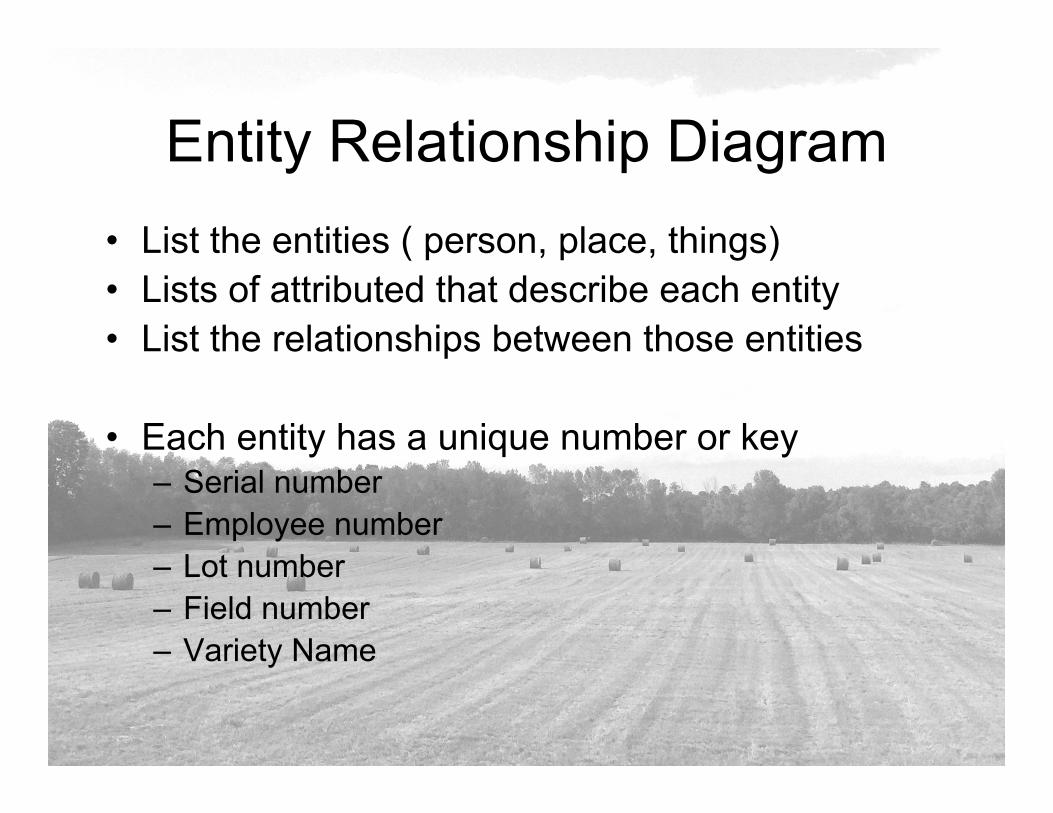
Entity Relationship Diagram• List the entities ( person, place, things)• Lists of attributed that describe each entity• List the relationships between those entities
• Each entity has a unique number or key– Serial number– Employee number– Lot number– Field number– Variety Name


Data Model

Data Model with Attributes

How much fuel did it take to grow that crop?
1122
33
44
55

Mapping
• Most events have a space and a time• Spatial data (where) can be characterized
as points, lines or polygons• Points have a location ( e.g. well head)• Lines have bearing and distance ( e.g.
fence line)• Polygons have perimeters and areas (e.g.
field or green house)

1st record of the farm
• 1867 Survey• 1 building• Owner: Mrs Johnson• A river headwater
W4 14.6
E2 7W2 11.5
E1 5
W5 7.5
W1 7.3
E5 6.5
E4 6.5
E3 6.3
W7 4
W6 4
WO 74.5
W3 3.6
E3H 1.8
GF 1
W0 1.1
SBC 4.1 SBE 3.6
SBW 3.7
E4H 0.2
W3O 0
BA 0
0 70 140 210 28035Meters ³1 centimeter = 50 meters
W4 14.6
E2 7W2 11.5
E1 5
W5 7.5
W1 7.3
E5 6.5
E4 6.5
E3 6.3
W7 4
W6 4
WO 74.5
W3 3.6
E3H 1.8
GF 1
W0 1.1
SBC 4.1 SBE 3.6
SBW 3.7
E4H 0.2
W3O 0
BA 0
õôó
õôóõôóõôó
õôó
õôó
õôóõôóõôóõôóõôóõôóõôó
õôó
õôó
õôóõôóõôóõôóõôó
õôó
õôóõôóõôó
õôóõôóõôóõôóõôó
õôó
õôó
õôóõôó
õôóõôóõôóõôó
õôó
õôó
õôóõôóõôóõôóõôó
õôóõôóõôó
õôóõôóõôó
õôó
õôóõôóõôó
õôóõôó
õôó
õôóõôóõôó
õôóõôó
õôó
õôó
õôó
õôó
õôóõôó
õôó
õôó
õôó
õôóõôóõôó
õôó
õôó
õôóõôóõôó
õôóõôó
õôóõôó
õôó
õôó
õôó
õôó
õôó
õôó
W301
E208
W703
W704
E211E210
E209E207
E206E205E204E203
E201E312
E311E310E309
E308
E307
E306
E305E304
E303
E302
E301
E411
E410E409
E408E407E406
E405
E404E403
E402E401E512
E511E510E509
E508
E507E506E505
E504E503
E501W702
W701
W609
W608W607
W606
W605
W604W603W602W601
W515 W514W513
W512
W510W509W508 W507
W506W505W504W503W502
W501
W405
W409W408
W402
W401
W304
W303W302
W201
W4 14.6
E2 7W2 11.5
E1 5
W5 7.5
W1 7.3
E5 6.5
E4 6.5
E3 6.3
W7 4
W6 4
WO 74.5
W3 3.6
E3H 1.8
GF 1
W0 1.1
SBC 4.1 SBE 3.6
SBW 3.7
E4H 0.2
W3O 0
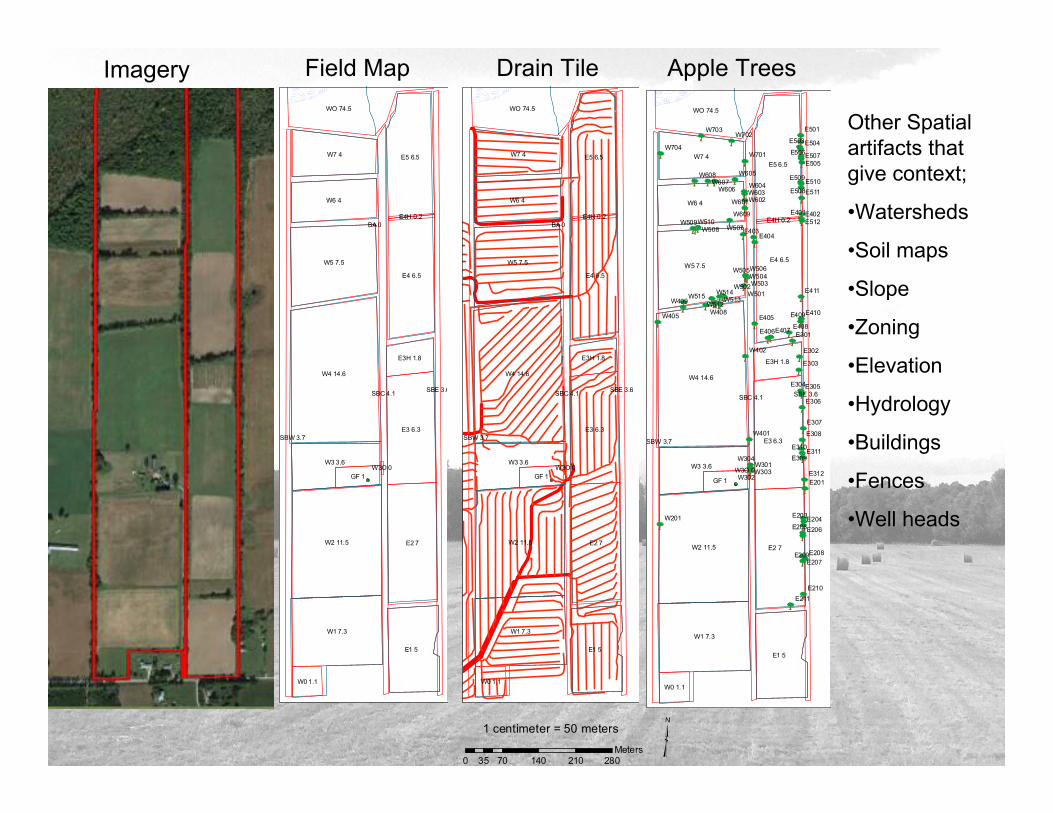
Other Spatial artifacts that give context;
•Watersheds
•Soil maps
•Slope
•Zoning
•Elevation
•Hydrology
•Buildings
•Fences
•Well heads
Imagery Field Map Drain Tile Apple Trees

Work Flow• Initial design and data population
– Do your compliance lists– Ask your questions– Build your reference data sets– Set your primary keys
• On-going data population– Field capture - real time– Clean up and record in permanent log book - weekly– Data entry to digital file – at least 1 pre quarter

Example of List Reporting

Field Activity

Litres of Fuel by Tractor by Year
Summary of Man Hours and Tractor Hours
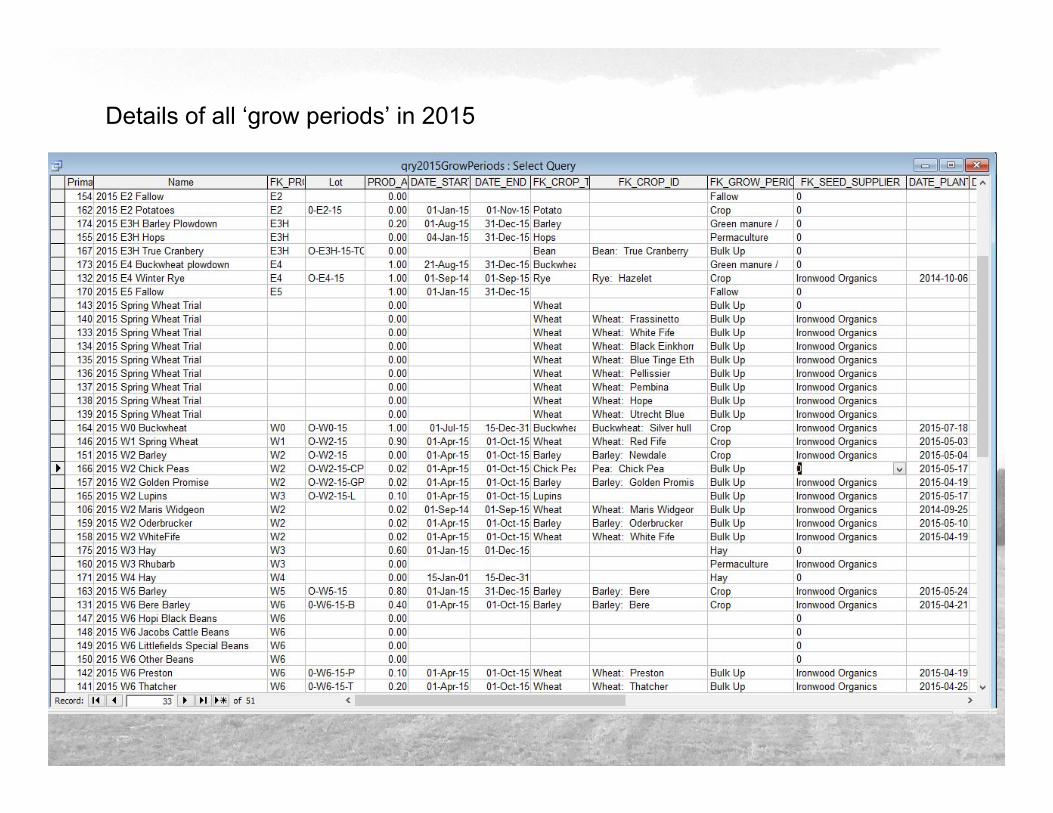
Details of all ‘grow periods’ in 2015

Summary of Activities in W7 Since Inception

Detail and Summary Maintenance Logs

Back to the beginning• Store only the data you have to or data that will
answer your questions.• If you store it, make it complete and accurate.• Do your analysis for prior year(s)
– What was profitable?– More maintenance?– Sell / acquire equipment?– Crop / climate performance?– Grow less and do more value add?– Increase crop diversity?

If it’s not measured its not managed.