B2B Park and Ride Pre-Feasibility Study
27
Report B2B Park and Ride Pre-Feasibility Study Prepared for NZ Transport Agency - Bay of Plenty By (Beca) 28 October 2016 © Beca 2016 (unless Beca has expressly agreed otherwise with the Client in writing). This report has been prepared by Beca on the specific instructions of our Client. It is solely for our Client’s use for the purpose for which it is intended in accordance with the agreed scope of work. Any use or reliance by any person contrary to the above, to which Beca has not given its prior written consent, is at that person's own risk.
Transcript of B2B Park and Ride Pre-Feasibility Study
Report
B2B Park and Ride Pre-Feasibility Study
Prepared for NZ Transport Agency - Bay of Plenty
By (Beca)
28 October 2016
© Beca 2016 (unless Beca has expressly agreed otherwise with the Client in writing).
This report has been prepared by Beca on the specific instructions of our Client. It is solely
for our Client’s use for the purpose for which it is intended in accordance with the agreed
scope of work. Any use or reliance by any person contrary to the above, to which Beca has
not given its prior written consent, is at that person's own risk.
B2B Park and Ride Pre-Feasibility Study
Beca // 28 October 2016
3934241 // NZ1-12919054-16 0.16
Revision History
Revision Nº Prepared By Description Date
A Alex Jeffcoat Draft for client comment 19 August 2016
B Craig Richards Final Report 28 October 2016
Document Acceptance
Action Name Signed Date
Prepared by Alex Jeffcoat
18.8.16
Reviewed by Craig Richards
19.8.16
Approved by Andy Lightowler & Tim Haig
22.8.16
on behalf of
B2B Park and Ride Pre-Feasibility Study
Beca // 28 October 2016 // Page 1
3934241 // NZ1-12919054-16 0.16
Table of Contents
1 Introduction .......................................................................................................... 2
1.1 Purpose ....................................................................................................................... 2
1.2 Limitations of this Study ............................................................................................... 2
2 Key Success Factors of Park and Ride .............................................................. 3
2.1 What is Park and Ride? ............................................................................................... 3
2.2 Key Success Factors for Park and Ride ...................................................................... 3
3 Potential Park and Ride Locations ..................................................................... 5
3.1 Potential Park and Ride Sites ...................................................................................... 5
4 Potential Bus Routes between the Sites and the CBD .................................... 10
5 Park and Ride Bus Route Travel Times ............................................................ 12
5.1 Park and Ride Site Access Times ............................................................................. 12
5.2 Park and Ride Site to CBD Travel Times .................................................................. 12
6 Potential Bus Priority Measures ....................................................................... 14
6.1 Planned Future Bus Priority Measures ...................................................................... 14
6.2 Potential Additional Improvements ............................................................................ 14
6.3 Summary of Additional Priority Measures ................................................................. 17
7 Park and Ride Service Operational Considerations ........................................ 18
7.1 Existing Bus Service Patronage ................................................................................ 18
7.2 Potential Park and Ride Passengers ......................................................................... 18
7.3 Bus Service Frequencies ........................................................................................... 19
7.4 Charges ..................................................................................................................... 19
7.5 Operational Costs ...................................................................................................... 20
8 Alternative Options ............................................................................................ 21
8.1 HOV Lane Opportunities ........................................................................................... 21
8.2 Utilising the East Coast Main Trunk Railway Line ..................................................... 22
9 Summary and Conclusions ............................................................................... 24
B2B Park and Ride Pre-Feasibility Study
Beca // 28 October 2016 // Page 2
3934241 // NZ1-12919054-16 0.16
1 Introduction
1.1 Purpose
This report outlines the findings of a pre-feasibility study of Park and Ride (P&R) options undertaken
by Beca Ltd (Beca) on behalf of the New Zealand Transport Agency (the Transport Agency).
The study has investigated the potential role P&R could play in providing additional choice for
people travelling on State Highway 2 (SH2) east of Tauranga during (and potentially after)
construction of the Baypark to Bayfair (B2B) link upgrade project.
The B2B project will replace the existing at grade roundabouts at the SH2 / Maunganui Road and
SH29 / SH2 intersections with grade separated interchanges. Construction is expected to impact on
travel times through the site from early 2018 for a period of approximately three and a half years
(the duration will be confirmed once a contractor has been appointed).
As part of the B2B Principals Requirements, contractors must target a maximum of five minutes
additional delay to commuters on SH2 during peak periods on a typical working day. There is
potential for a P&R service to reduce the overall number of vehicles travelling through the worksite
(by achieving mode shift to buses).
The main aim of the study is to consider the likely effectiveness of a P&R bus service between a
dedicated parking area identified by the Transport Agency (located east of the B2B construction
area) and Tauranga CBD. Additionally, consideration needs to be given to providing High
Occupancy Vehicle (HOV) lanes as an alternative to a P&R service to increase capacity for vehicles
with two or more (T2) or three or more (T3) occupants.
This study has specifically excluded identifying any Bus or HOV priority measures within the B2B
construction area, as any such measures would need to be identified by the contractor as part of
the construction temporary traffic management plan (TMP). Comment is however provided on the
amount of travel time saving that would need to be achieved through the construction site to
adequately contribute to the P&R service.
This report is set out in the following structure:
Chapter 1 - Key success factors of P&R,
Chapter 2 - Potential P&R locations,
Chapter 3 - Potential bus routes,
Chapter 4 - Base travel time analysis,
Chapter 5 - Potential bus priority measures (travel time savings),
Chapter 6 - Operational considerations (patronage, cost etc.),
Chapter 7 - Alternative options (HOV, rail),
Chapter 8 - Summary and conclusions.
1.2 Limitations of this Study
The following limitations apply to this analysis:
No formal consultation has occurred with any of the potentially external parties identified in this
report, and
The potential bus priority measures identified in this report as being needed to support a P&R
service are based on high level assessment at this stage and would need further investigation to
confirm feasibility, cost and benefit if a P&R / HOV service is pursued further.

B2B Park and Ride Pre-Feasibility Study
Beca // 28 October 2016 // Page 3
3934241 // NZ1-12919054-16 0.16
2 Key Success Factors of Park and Ride
2.1 What is Park and Ride?
A P&R facility essentially involves the provision of car parking outside the central area of the city
and public transport services linking those car parks with the central city area or another key
destination. P&R may be regarded as an extension of central area parking provision – with the
parking facility being outside the central area rather than within it, and linked to the central area with
a good public transport system/service.
P&R attempts to combine the benefits of both car use and public transport use into an efficient and
effective system. It can play a key role in converting commuter car trips, which would otherwise add
to congested roads, to public transport for part of the journey. If the congestion can be bypassed by
priority measures such as bus lanes, this makes public transport trips faster than driving.
Many factors influence the success of a P&R service, through the generation of P&R demand.
Some of the factors relate to the quality of the public transport service being supplied at the site;
particularly frequency and travel time/fare to major destinations relative to car travel. Other factors
relate to site facilities such as whether the site is paved or patrolled, or the number of car parks.
Characteristics relating to the catchment population are also important as this provides the overall
market potential. If this is small then any P&R facility will not be successful.
2.2 Key Success Factors for Park and Ride
Based on published evidence, P&R services work best in the following cases:
A major concentrated commuter destination with high parking charges and/or significant
congestion. In Tauranga’s transport market, which is characterised by high car ownership and
use, a P&R is only likely to be an attractive alternative to driving by car if it is cheaper and
quicker. A P&R avoids parking costs at the destination end of the trip, while traffic congestion, if
bypassed by bus lanes, makes public transport trips faster than driving.
Direct, frequent, and fast public transport service from the P&R site to the main commuter
destination. This service must be very good during the peak period. During the midday and
evening, adequate services must be available so that there is a way to get back to the car if the
customer must leave work late or early.
The high demand for Auckland’s Northern Busway P&R facilities demonstrates that role, with trips
on the busway taking approximately half the travel time than by car at peak times and Auckland
CBD car parking costs and congestion being relatively high (parking in the CBD can cost between
$15 and $25 per day depending on arrival time, lease options etc. A two zone fare by public
transport costs $3.10 each way). Surveys of Northern Express passengers who P&R, undertaken
prior to the opening of the full busway, show that in 2007 43% of respondents used to make their
journey by private vehicle.
It is difficult to indicate the ‘potential’ mode shift/improvements which could be achieved without
more detailed analysis/modelling. Nevertheless, some evidence from overseas indicates:
Results for prior mode trips from an analysis of 69 European (including UK) P&R sites showed
broadly similar results to UK-only surveys: on average 70% were car (driver), 23% were PT (but
including some active mode users and informal P&R users) (Zijlstra et al 2013).
One study of prior modes for USA schemes found that, on average over nine cities, prior modes
were driver alone 52%, car pool 13%, public transport 21% (Hamer 2009).

B2B Park and Ride Pre-Feasibility Study
Beca // 28 October 2016 // Page 4
3934241 // NZ1-12919054-16 0.16
The key success factors for a P&R service are therefore:
CBD parking shortage and resultant high parking prices,
Traffic congestion on routes feeding CBD,
Good quality public transport services (<15minutes headway between services),
Sufficient population catchment near P&R site / travel demand between the site and service
destination.
B2B Park and Ride Pre-Feasibility Study
Beca // 28 October 2016 // Page 5
3934241 // NZ1-12919054-16 0.16
3 Potential Park and Ride Locations
3.1 Potential Park and Ride Sites
3.1.1 Baypark Stadium
Baypark Stadium (Baypark) provides a clear opportunity for be used as a P&R site. There are
currently a large number of car parking spaces within the site not typically used on weekdays, the
site is accessible a short distance from SH2 and SH29 and the site can be accessed prior to the
reaching the B2B construction area (when travelling north), so cars travelling to the site should not
be delayed by construction effects.
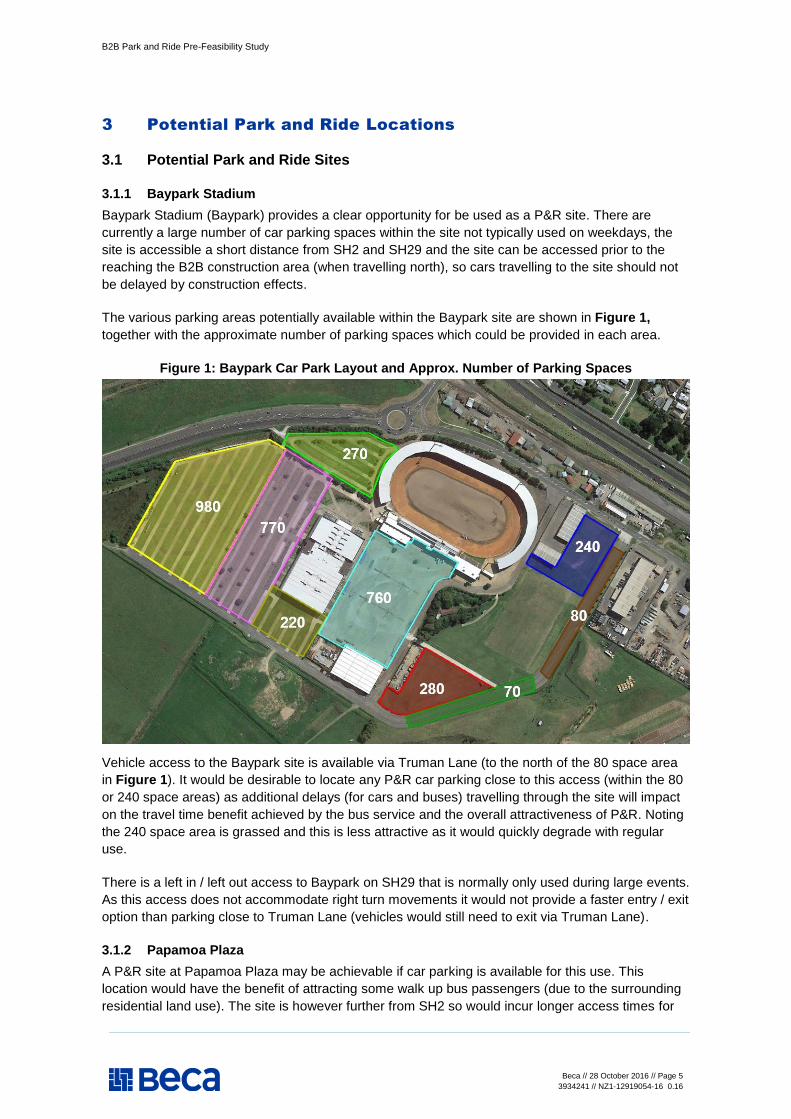
The various parking areas potentially available within the Baypark site are shown in Figure 1,
together with the approximate number of parking spaces which could be provided in each area.
Figure 1: Baypark Car Park Layout and Approx. Number of Parking Spaces
Vehicle access to the Baypark site is available via Truman Lane (to the north of the 80 space area
in Figure 1). It would be desirable to locate any P&R car parking close to this access (within the 80
or 240 space areas) as additional delays (for cars and buses) travelling through the site will impact
on the travel time benefit achieved by the bus service and the overall attractiveness of P&R. Noting
the 240 space area is grassed and this is less attractive as it would quickly degrade with regular
use.
There is a left in / left out access to Baypark on SH29 that is normally only used during large events.
As this access does not accommodate right turn movements it would not provide a faster entry / exit
option than parking close to Truman Lane (vehicles would still need to exit via Truman Lane).
3.1.2 Papamoa Plaza
A P&R site at Papamoa Plaza may be achievable if car parking is available for this use. This
location would have the benefit of attracting some walk up bus passengers (due to the surrounding
residential land use). The site is however further from SH2 so would incur longer access times for
B2B Park and Ride Pre-Feasibility Study
Beca // 28 October 2016 // Page 6
3934241 // NZ1-12919054-16 0.16
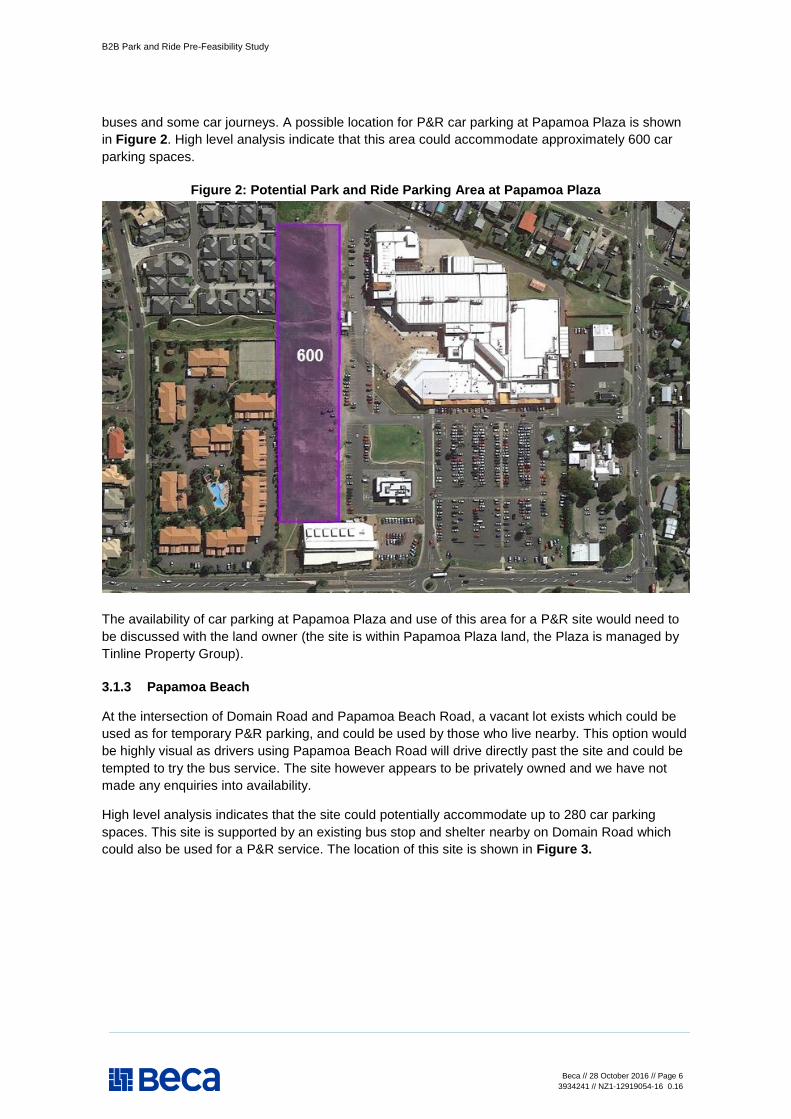
buses and some car journeys. A possible location for P&R car parking at Papamoa Plaza is shown
in Figure 2. High level analysis indicate that this area could accommodate approximately 600 car
parking spaces.
Figure 2: Potential Park and Ride Parking Area at Papamoa Plaza
The availability of car parking at Papamoa Plaza and use of this area for a P&R site would need to
be discussed with the land owner (the site is within Papamoa Plaza land, the Plaza is managed by
Tinline Property Group).
3.1.3 Papamoa Beach
At the intersection of Domain Road and Papamoa Beach Road, a vacant lot exists which could be
used as for temporary P&R parking, and could be used by those who live nearby. This option would
be highly visual as drivers using Papamoa Beach Road will drive directly past the site and could be
tempted to try the bus service. The site however appears to be privately owned and we have not
made any enquiries into availability.
High level analysis indicates that the site could potentially accommodate up to 280 car parking
spaces. This site is supported by an existing bus stop and shelter nearby on Domain Road which
could also be used for a P&R service. The location of this site is shown in Figure 3.

B2B Park and Ride Pre-Feasibility Study
Beca // 28 October 2016 // Page 7
3934241 // NZ1-12919054-16 0.16
Figure 3: Potential location for Papamoa Beach Park and Ride
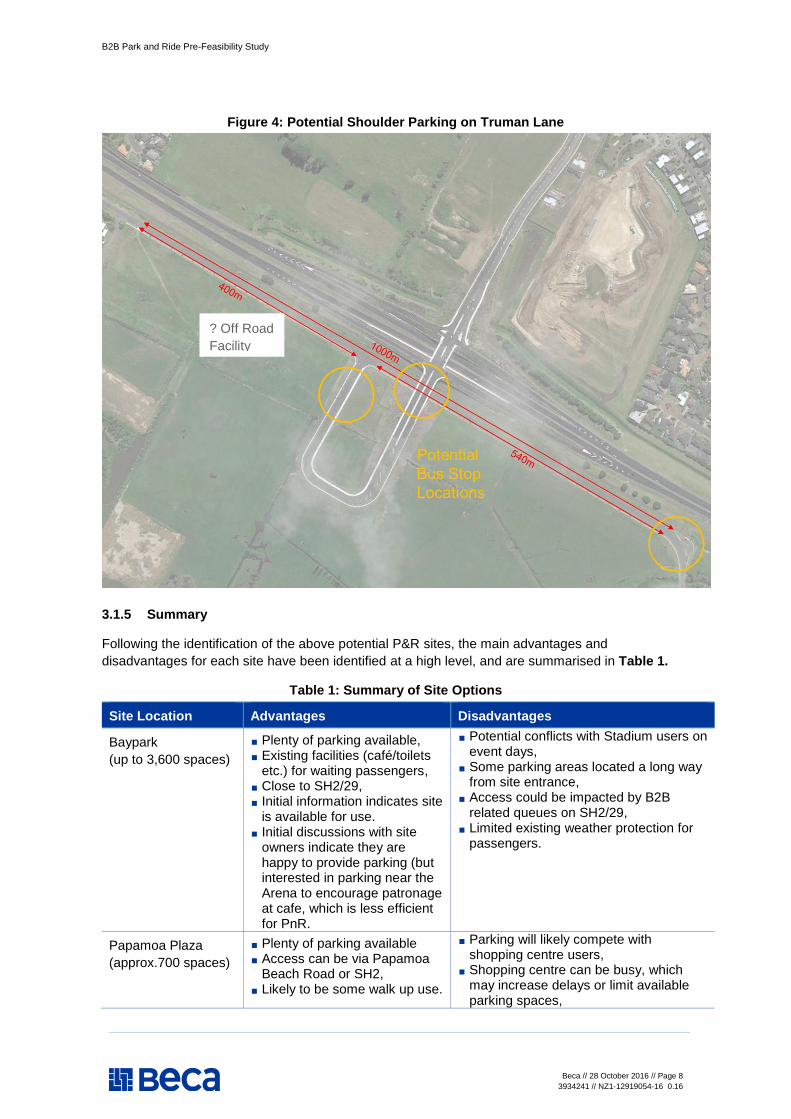
3.1.4 Truman Lane Interchange
This location would utilise the existing shoulder along both sides of Truman Lane, a sealed wide
road with low traffic volumes and good infrastructure. The location is close to SH2 which would
ensure limited delays for drivers travelling to/from the expressway. As parking could occur within the
road reserve, implementation would be much simpler than involving Baypark or a private land
owner. This option may however require bus users to walk for some distance to access a bus,
depending on the location of bus stops and where a passenger has parked (due to the elongated
nature of kerbside parking). Alternatively an off road car park could be provided close to the
interchange but this would require landowner approval and possibly incur some construction costs.
The potential kerbside parking area on Truman Lane of approximately 1,940m could potentially
provide over 300 parking spaces. Due to the linear nature of the road, it is likely that some
passengers may be required to walk up to 400m to access bus stops, however this could be
reduced by adding additional stops.
B2B Park and Ride Pre-Feasibility Study
Beca // 28 October 2016 // Page 8
3934241 // NZ1-12919054-16 0.16
Figure 4: Potential Shoulder Parking on Truman Lane
3.1.5 Summary
Following the identification of the above potential P&R sites, the main advantages and
disadvantages for each site have been identified at a high level, and are summarised in Table 1.
Table 1: Summary of Site Options
Site Location Advantages Disadvantages
Baypark
(up to 3,600 spaces) Plenty of parking available,
Existing facilities (café/toilets etc.) for waiting passengers,
Close to SH2/29,
Initial information indicates site is available for use.
Initial discussions with site owners indicate they are happy to provide parking (but interested in parking near the Arena to encourage patronage at cafe, which is less efficient for PnR.
Potential conflicts with Stadium users on event days,
Some parking areas located a long way from site entrance,
Access could be impacted by B2B related queues on SH2/29,
Limited existing weather protection for passengers.
Papamoa Plaza
(approx.700 spaces) Plenty of parking available
Access can be via Papamoa Beach Road or SH2,
Likely to be some walk up use.
Parking will likely compete with shopping centre users,
Shopping centre can be busy, which may increase delays or limit available parking spaces,
? Off Road
Facility

B2B Park and Ride Pre-Feasibility Study
Beca // 28 October 2016 // Page 9
3934241 // NZ1-12919054-16 0.16
It is currently unknown if land owner will accept parking on site,
Further from SH2 than Baypark.
Papamoa Beach
Road/Domain Road
(Approx. 340 spaces)
Simple and direct route along Ocean Beach Road,
Highly visible location may encourage drivers to try the service,
Likely to be some walk up use.
May be a popular parking space during summer months,
Unknown ownership / availability
Unknown if ground conditions are suitable for car parking.
Truman Lane
(Approx. 320 spaces) Close to SH2 so minor
additional travel times.
Existing formed infrastructure.
Land in public ownership and available.
Bridge provides a form of weather protection.
Passengers may have a long walk to/ from cars,
The more parking demand, the further some may need to walk.
Previous consultation indicates potential opposition from local iwi
B2B Park and Ride Pre-Feasibility Study
Beca // 28 October 2016 // Page 10
3934241 // NZ1-12919054-16 0.16
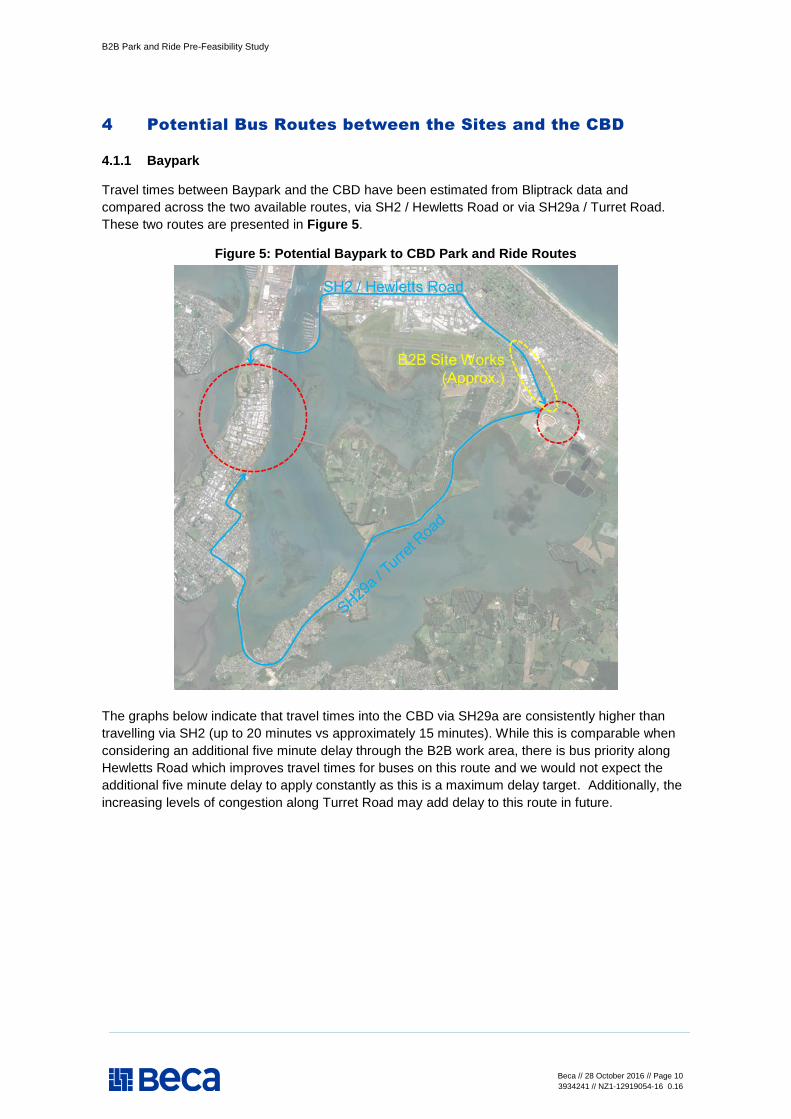
4 Potential Bus Routes between the Sites and the CBD
4.1.1 Baypark
Travel times between Baypark and the CBD have been estimated from Bliptrack data and
compared across the two available routes, via SH2 / Hewletts Road or via SH29a / Turret Road.
These two routes are presented in Figure 5.
Figure 5: Potential Baypark to CBD Park and Ride Routes
The graphs below indicate that travel times into the CBD via SH29a are consistently higher than
travelling via SH2 (up to 20 minutes vs approximately 15 minutes). While this is comparable when
considering an additional five minute delay through the B2B work area, there is bus priority along
Hewletts Road which improves travel times for buses on this route and we would not expect the
additional five minute delay to apply constantly as this is a maximum delay target. Additionally, the
increasing levels of congestion along Turret Road may add delay to this route in future.

B2B Park and Ride Pre-Feasibility Study
Beca // 28 October 2016 // Page 11
3934241 // NZ1-12919054-16 0.16
Figure 6: SH2 / SH29a Comparison
4.1.2 Papamoa
From Papamoa (Plaza or Domain) travel times to the CBD via Ocean Beach Road are consistently
shorter than travelling via SH2 (Figure 7).
Figure 7: Papamoa – CBD via SH2 or Ocean Beach Road
B2B Park and Ride Pre-Feasibility Study
Beca // 28 October 2016 // Page 12
3934241 // NZ1-12919054-16 0.16
5 Park and Ride Bus Route Travel Times
This chapter identifies the likely travel times along the recommended routes between the potential
P&R sites and the CBD, assuming no new bus/HOV priority measures at this stage.
5.1 Park and Ride Site Access Times
There will be some delay imposed on P&R users due to the need for travellers to access the P&R
site, park their vehicle and then wait to board a bus before travelling by bus from the site.
We have assessed additional travel times to/from the P&R site options via a floating car survey
(using a GPS tracker), the findings being:
It takes four minutes to travel from SH2 to the Baypark car park in front of the arena
It takes two minutes to travel from SH2 to the Baypark car park near the Truman Lane entrance
It takes four minutes to travel to Papamoa Plaza and the Papamoa Domain from SH2.
It takes two minutes to travel between SH2 and Truman Lane (Sandhurst Drive site).
The above travel times will be the same for bus travel back to the State Highway, although from
Papamoa the bus would likely travel via Ocean Beach Road based on the travel times in Figure 7.
Once a user has parked their vehicle it is likely they will need to wait for a bus to arrive before
departing. Waiting time is typically estimated to be half of frequency, so if the bus service is
operating every ten minutes the average wait time will be five minutes.
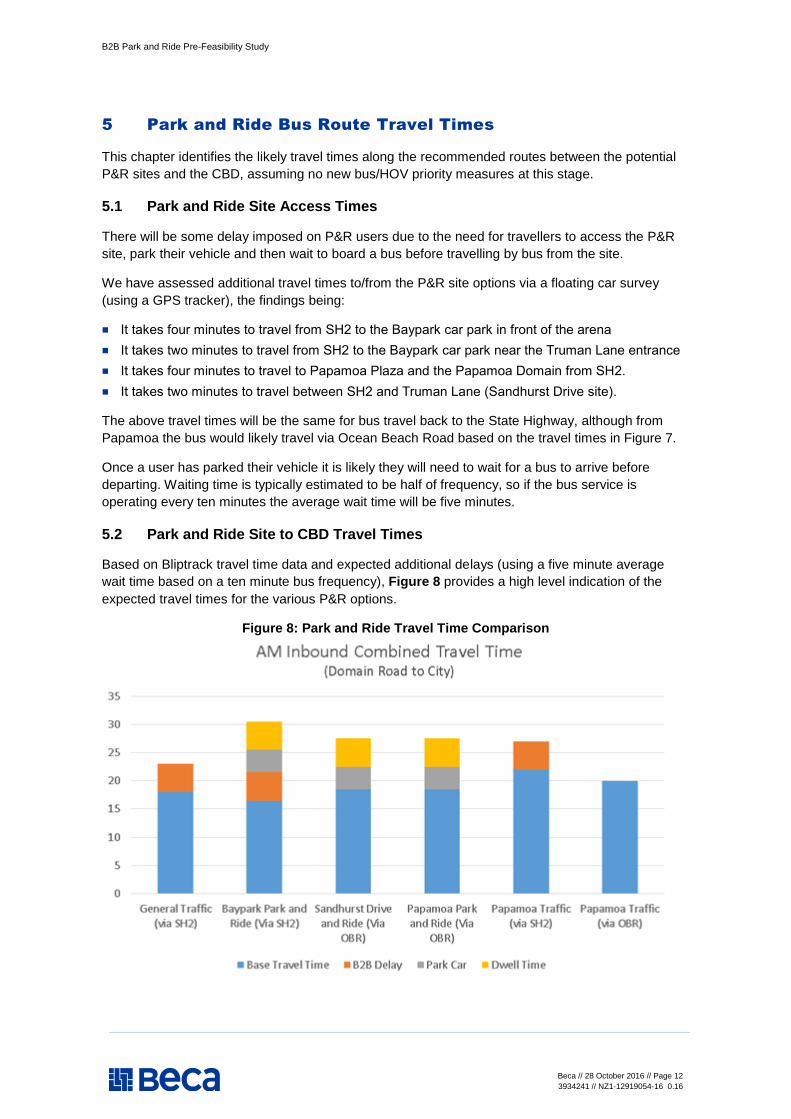
5.2 Park and Ride Site to CBD Travel Times
Based on Bliptrack travel time data and expected additional delays (using a five minute average
wait time based on a ten minute bus frequency), Figure 8 provides a high level indication of the
expected travel times for the various P&R options.
Figure 8: Park and Ride Travel Time Comparison

B2B Park and Ride Pre-Feasibility Study
Beca // 28 October 2016 // Page 13
3934241 // NZ1-12919054-16 0.16
It is clear from Figure 8 that without additional bus priority measures P&R travellers will have a
significant time disadvantage compared to motorists who stay in their vehicles and travel through
the B2B site to the CBD.
To be comparable or better than the status quo, (i.e. sitting in traffic) P&R traffic using the Baypark
or Truman Lane site will only be attractive if time savings of at more than five minutes can be
achieved for buses by bus priority measures. Park and ride traffic from Papamoa would need to be
supported by approximately seven minutes of additional bus priority time savings.

B2B Park and Ride Pre-Feasibility Study
Beca // 28 October 2016 // Page 14
3934241 // NZ1-12919054-16 0.16
6 Potential Bus Priority Measures
6.1 Planned Future Bus Priority Measures
The project team are aware of Transport Agency plans to implement bus priority improvements
along Hewletts Road in the near future, including:
Extending the existing westbound bus lane (that terminates prior to Totara Street) to the 3 to 2
merge west of Tasman Quay by approximately 450m,
Starting the eastbound bus lane before the Totara Street intersection (rather than after) by
approximately 250m,
Converting the existing left hand short lane at the Marina entrance to a bus lane (approximately
200m in length).
In addition to the above bus priority improvements, there is also a proposal to provide an additional
right turn lane out of Jean Batten Drive which will enable more green time to be given to through
traffic on Hewletts Road.
The measures are expected to provide a travel time saving of 20 to 30 seconds on average for bus
users each way along Hewletts Road.
All of the above improvements are expected to be in place by the start of B2B construction.
6.2 Potential Additional Improvements
Further to the above improvements, a number of potential bus priority measures have been
identified that may provide further travel time savings for a P&R service. At this stage these
concepts are indicative only and would require further investigations to determine feasibility and
cost should the upgrades be considered further.
6.2.1 Maunganui Road
Conversion of the existing shoulder on Maunganui Road (Southbound) between Golf Road and
Spur Avenue to a weekday peak hour clearway, with shoulder bus running during the hours of
operation. Some widening of the shoulder may be necessary in areas, or the bus lane
terminated. This potential bus lane could be as long as 400m, which could save approximately
20-30 seconds of travel time per bus (outbound only) during congested periods.
If this clearway / bus priority can be provided for a further 1km between Spur Ave and the start of
B2B construction works, this could provide a further 60-70 seconds of bus priority per direction.
Conversion of the inbound shoulder approaching the Tauranga Marina entrance intersection to
allow an uninterrupted bus bypass of the intersection. This would allow buses to completely
bypass the red light which can last for up to 20 seconds. A visualisation of this concept is shown
in Figure 9.

B2B Park and Ride Pre-Feasibility Study
Beca // 28 October 2016 // Page 15
3934241 // NZ1-12919054-16 0.16
Figure 9: Potential Bus Priority at Marina Entrance
6.2.2 Tauranga City Centre
Any P&R service is likely to terminate at the existing bus interchange on Willow Street, as the
existing infrastructure supports buses and waiting passengers and because this area is well known
as a CBD bus interchange. Three options have been identified as potential routes for buses
accessing the CBD from the Harbour Bridge.
To SH2 via The Strand and Dive Crescent,
To SH2 via Willow Street and Brown Street,
To SH2 via Harington Street and Cameron Road.
There is potential for bus priority measures to be implemented to support the above routes and
enable buses to more efficiently access the Harbour Bridge, as follows:
A bus only through movement (with ‘B’ aspect five second head start) at the right turn into Marsh
Street, effectively adding 150m of bus priority. This may allow the bus to skip up to two cycle’s of
traffic queue and with a cycle time of up to 120 seconds in the peak, this improvement could
save a minimum of 120 seconds per bus. This concept is shown in Figure 10.

B2B Park and Ride Pre-Feasibility Study
Beca // 28 October 2016 // Page 16
3934241 // NZ1-12919054-16 0.16
Figure 10: Potential Bus Priority at Chapel Street
Adding a combined bus/cycle lane using the existing cycle lane and the flush median at Dive
Crescent, or potentially adding an allowance for buses to turn right from the left lane priority
phase. This may allow the bus to skip up to two cycle’s worth of queue and with a cycle time of
up to 70 seconds in the peak, this improvement could save a minimum of 70 seconds per bus.
This measure would not be provided in addition to the Chapel Street improvements as they
serve the same function. This concept is shown in Figure 11.

B2B Park and Ride Pre-Feasibility Study
Beca // 28 October 2016 // Page 17
3934241 // NZ1-12919054-16 0.16
Figure 11: Potential Bus Priority at Dive Crescent
Consideration of bus priority measures at any proposed signalised intersection along Cameron
Road (e.g. Harington Street).
6.3 Summary of Additional Priority Measures
The review of potential bus priority measures is summarised in Table 2.
Table 2: Summary of Priority Measures
Priority Measure Potential Saving (per bus) Notes
Hewletts Road Upgrades 20-30 seconds Both directions
Maunganui Road (North) Bus Priority
20-30 seconds Outbound only
Maunganui Road (Spur Avenue – works)
60-70 seconds Both directions
Marina Intersection bypass 20 seconds Inbound only
Chapel Street Advanced RT 120 seconds Outbound only
Dive Crescent Left Lane RT 70 seconds Outbound only
If all the identified measures are implemented, it is expected that up to six minutes of travel time
savings could be achieved for a round trip (i.e. two minutes inbound, four minutes outbound), with
most benefits being for the outbound direction. Comparing this saving against the requirement of
approximately five minutes in travel time savings required to make bus journey times comparable
for the inbound direction only, the resulting travel time for a P&R bus service is still expected to be
slower (by approximately 2-3 minutes) than simply staying in general traffic. Therefore at least three
minutes of additional travel time savings would need to be achieved through the B2B site for bus
journeys to be attractive on a travel time basis.

B2B Park and Ride Pre-Feasibility Study
Beca // 28 October 2016 // Page 18
3934241 // NZ1-12919054-16 0.16
7 Park and Ride Service Operational Considerations
7.1 Existing Bus Service Patronage
Currently there are three bus routes that service the Papamoa area to the south-east of Bayfair:
Route 30 – Papamoa to Mount Hot Pools,
Route 33 – Papamoa to CBD,
Route 36 – Papamoa (Papamoa College) to CBD.
These routes are shown in Figure 12. Patronage on these routes indicate an average of
approximately 600 passengers use the three routes that service the Papamoa area per day.
Figure 12: Existing Bus Route Patronage
According to the 2013 census, only 1.4% of people who travelled to work in Tauranga on census
day travelled by public bus. Household travel survey data indicates that approximately 2% of
employed persons travel to work by bus in Tauranga. Whilst total bus use in Tauranga is higher
than these figures suggest (closer to 5% on main arterials) there is a proportion of school and non-
employee (retired etc.) trips using the bus services which contribute to this figure, such users would
not be highly likely to use a P&R to/from the CBD in peak hours.
7.2 Potential Park and Ride Passengers
Traffic count data indicates that approximately 5,000 vehicles1 (west-bound toward Tauranga / Mt
Maunganui) could be impacted by B2B construction works in the weekday morning peak period (7
to 9am).
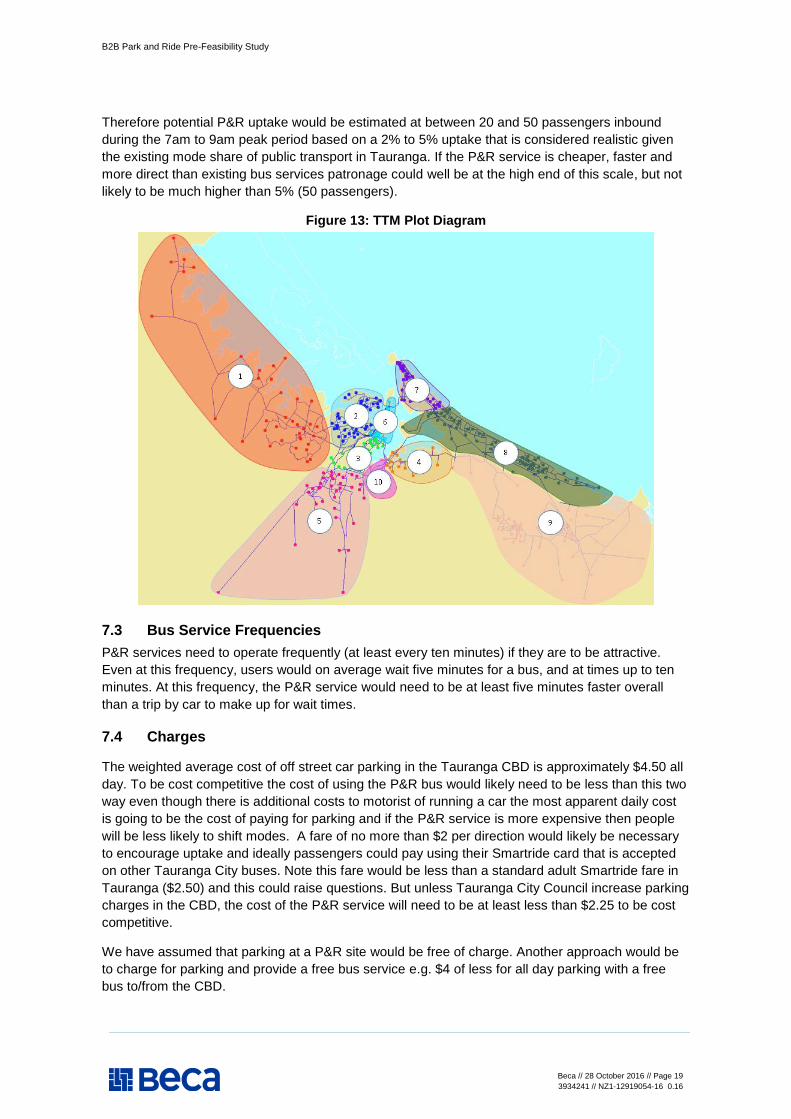
However, we have examined the Tauranga Traffic Model (TTM) to identify the number of vehicle
trips originating east of the City and travelling to the CBD (between sectors 8,9 and 6 in Figure 14)
and the number of trips between these locations is only approximately 550 in the peak hour, or
approximately 950 over a two hour peak period.
1 Actual volumes by the time B2B construction starts may be slightly higher given recent traffic growth in
Tauranga. Volumes on SH2 north of Tauranga have grown by 7 to 9%pa in recent years.
B2B Park and Ride Pre-Feasibility Study
Beca // 28 October 2016 // Page 19
3934241 // NZ1-12919054-16 0.16
Therefore potential P&R uptake would be estimated at between 20 and 50 passengers inbound
during the 7am to 9am peak period based on a 2% to 5% uptake that is considered realistic given
the existing mode share of public transport in Tauranga. If the P&R service is cheaper, faster and
more direct than existing bus services patronage could well be at the high end of this scale, but not
likely to be much higher than 5% (50 passengers).
Figure 13: TTM Plot Diagram
7.3 Bus Service Frequencies
P&R services need to operate frequently (at least every ten minutes) if they are to be attractive.
Even at this frequency, users would on average wait five minutes for a bus, and at times up to ten
minutes. At this frequency, the P&R service would need to be at least five minutes faster overall
than a trip by car to make up for wait times.
7.4 Charges
The weighted average cost of off street car parking in the Tauranga CBD is approximately $4.50 all
day. To be cost competitive the cost of using the P&R bus would likely need to be less than this two
way even though there is additional costs to motorist of running a car the most apparent daily cost
is going to be the cost of paying for parking and if the P&R service is more expensive then people
will be less likely to shift modes. A fare of no more than $2 per direction would likely be necessary
to encourage uptake and ideally passengers could pay using their Smartride card that is accepted
on other Tauranga City buses. Note this fare would be less than a standard adult Smartride fare in
Tauranga ($2.50) and this could raise questions. But unless Tauranga City Council increase parking
charges in the CBD, the cost of the P&R service will need to be at least less than $2.25 to be cost
competitive.
We have assumed that parking at a P&R site would be free of charge. Another approach would be
to charge for parking and provide a free bus service e.g. $4 of less for all day parking with a free
bus to/from the CBD.

B2B Park and Ride Pre-Feasibility Study
Beca // 28 October 2016 // Page 20
3934241 // NZ1-12919054-16 0.16
7.5 Operational Costs
To operate a P&R service every ten minutes will (assuming a round trip time between Baypark and
the CBD of 40 to 60 minutes) will require four to six buses. This would cost in the region of $5,000-
$10,000 per day to operate (at the lower end of this range if off peak frequencies are reduced, e.g.
only one bus operates off peak).
We have assumed the cost of operating the car park for this P&R service would be negligible. There
may be some costs imposed by Baypark or other land owner but at this stage such costs are
unknown.
Assuming a return fare of $4, between 1,250 and 2,500 daily users of the service would need to be
attracted to cover the operating costs. This is equivalent to between approximately 100 and 200
users per hour (or 17-33 people per bus on average), assuming services operate for 12 hours per
day.
Based on the expected patronage identified in Section 7.2, any P&R service is likely to run at a cost
to the Transport Agency rather than being self-funded. An operating cost of $5,000 per day across
each working day for a 2.5 year period results in a total operational cost of approximately $3.3M, of
which only a small amount (likely to be less than $300,000) would potentially be recuperated from
passengers.
B2B Park and Ride Pre-Feasibility Study
Beca // 28 October 2016 // Page 21
3934241 // NZ1-12919054-16 0.16
8 Alternative Options
8.1 HOV Lane Opportunities
Instead of a P&R service, T2 or T3 lanes could be provided in some locations on the route from the
eastern end of the B2B construction site to the CBD (dedicated HOV lanes or HOV provision in bus
lanes).
Tauranga City Council (TCC) surveys of weekday peak period vehicle occupancy on SH2 between
Tasman Quay and the Harbour Bridge (city bound) show the average vehicle occupancy on this link
to be 1.10 persons per vehicle. Of every 100 vehicles, approximately 90 vehicles have one
occupant, eight vehicles have two occupants and one vehicle has three or more occupants.
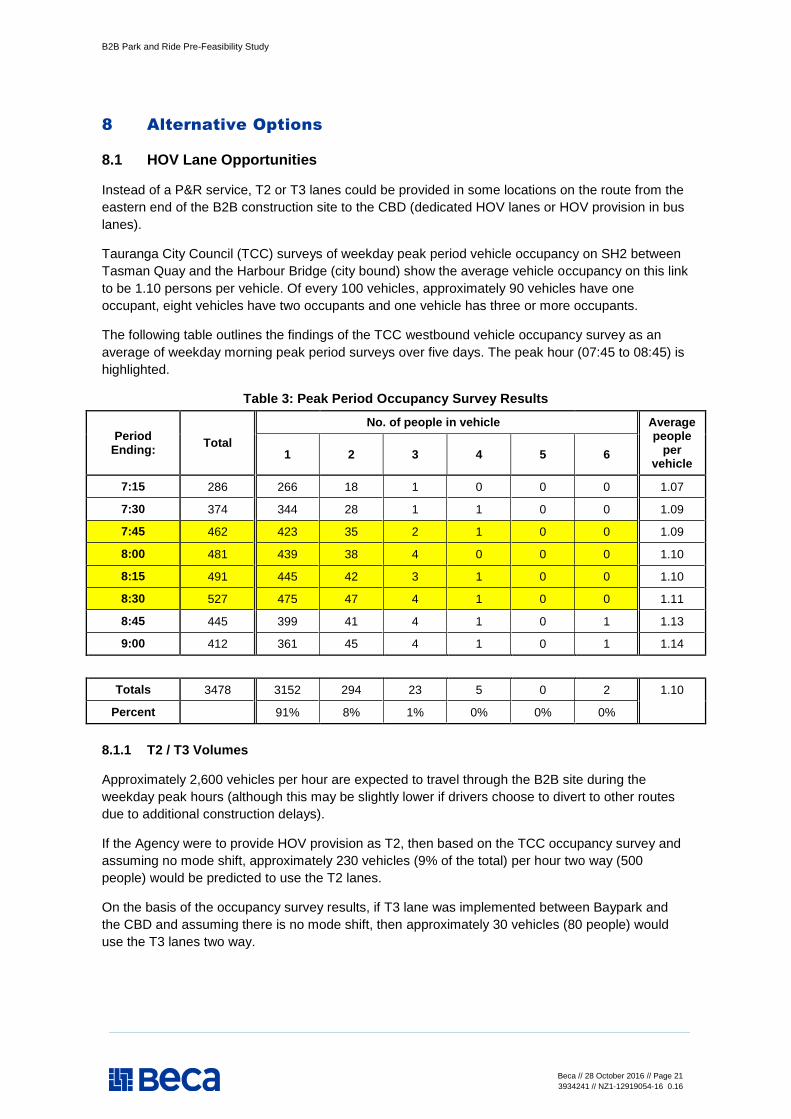
The following table outlines the findings of the TCC westbound vehicle occupancy survey as an
average of weekday morning peak period surveys over five days. The peak hour (07:45 to 08:45) is
highlighted.
Table 3: Peak Period Occupancy Survey Results
Period Ending:
Total
No. of people in vehicle Average people
per vehicle
1 2 3 4 5 6
7:15 286 266 18 1 0 0 0 1.07
7:30 374 344 28 1 1 0 0 1.09
7:45 462 423 35 2 1 0 0 1.09
8:00 481 439 38 4 0 0 0 1.10
8:15 491 445 42 3 1 0 0 1.10
8:30 527 475 47 4 1 0 0 1.11
8:45 445 399 41 4 1 0 1 1.13
9:00 412 361 45 4 1 0 1 1.14
Totals 3478 3152 294 23 5 0 2 1.10
Percent 91% 8% 1% 0% 0% 0%
8.1.1 T2 / T3 Volumes
Approximately 2,600 vehicles per hour are expected to travel through the B2B site during the
weekday peak hours (although this may be slightly lower if drivers choose to divert to other routes
due to additional construction delays).
If the Agency were to provide HOV provision as T2, then based on the TCC occupancy survey and
assuming no mode shift, approximately 230 vehicles (9% of the total) per hour two way (500
people) would be predicted to use the T2 lanes.
On the basis of the occupancy survey results, if T3 lane was implemented between Baypark and
the CBD and assuming there is no mode shift, then approximately 30 vehicles (80 people) would
use the T3 lanes two way.
B2B Park and Ride Pre-Feasibility Study
Beca // 28 October 2016 // Page 22
3934241 // NZ1-12919054-16 0.16
8.1.2 Potential Mode Shift
There is little evidence to support a definitive assumption regarding likely mode shift to T2/T3 as a
result of HOV lanes. Auckland Transport (AT) note “a shift in modal split can take place and the
extent thereof varies depending on the characteristics of the affected traffic and the particular
route”2.
T2 lanes on Tamaki Drive achieved a 5 to 10% increase in T2 traffic and similar reduction in SOV’s.
Considering the congested nature and overall higher travel time (lower travel speed) of the Tamaki
Drive corridor compared with Hewletts Road, a lower target mode shift of 3 to 5% may be more
achievable if priority can be given to HOV traffic that makes ride sharing an attractive option.
As the existing bus lanes on Hewletts Road do not accommodate HOV’s the full length of the bus
lanes would provide travel time savings for high occupancy vehicles if converted to HOV lanes. This
travel time saving is expected to be approximately 1 minute 30 seconds. Adding the Maunganui
Road travel time savings described in Section 6.2 results in a total travel time saving of
approximately three minutes each way. Again it is likely that some travel time saving through the
B2B site would be desirable for HOV’s to have any decent travel time benefit over single occupancy
vehicles, perhaps 2 - 3 minutes to make the journey at least five minutes faster and encourage
mode shift.
If a 5% mode shift is achieved with a T2 lane, then the number of vehicles using the lanes would
increase to 300 vehicles per hour (over 600 people) two way.
If a 5% mode shift is achieved then the number of vehicles using a T3 lane would increase to 65
vehicles per hour (nearly 200 people).
8.1.3 T2 / T3 Consideration
Based on the potential use of a T2 vs T3 lane, it would appear that T2 provision would be more
favourable on a potential usage basis if just considering the B2B site, i.e. T3 would not provide
much benefit in terms of likely use (30 to 60 vehicles per hour two way).
However, if T2 is implemented on Hewletts Road (as per our earlier work on this subject for the
Agency) there is a risk that the number of vehicles using the T2 lanes will impact on the benefit
achieved by the additional lane (especially at the Jean Batten intersection), slow down bus services
and lead to heightened safety risks, e.g. the existing crash risk at Balance Corner three to two lane
merge area and a potential new weaving conflict where eastbound vehicles will need to merge from
the T2 lane across to the flyover after the Jean Batten Drive intersection.
On balance we consider T3 lane provision through the B2B site and on Hewletts Road with an effort
to encourage people to mode shift through promotion or other measures such as HOV parking
areas, discounted HOV parking in the CBD and promotion / support for ridesharing would still be
preferable over T2 provision given the safety and capacity risks presented on Hewletts Road.
8.2 Utilising the East Coast Main Trunk Railway Line
Alternative to all of the identified bus priority related solutions, the shortest and most direct route
between Baypark and the City is along the East Coast Main Trunk Line (ECMT). The distance
between by rail is approximately 7km and would take approximately six minutes (assuming trains
2 Menezes and Qu, Development of a Transit Lane Network for Auckland, IPENZ Transport Group Conference
2016.

B2B Park and Ride Pre-Feasibility Study
Beca // 28 October 2016 // Page 23
3934241 // NZ1-12919054-16 0.16
travel on average at 50km/h). This could be seen as a potential trial for other residential commuter
rail services in Tauranga and thus reducing the reliance on bus travel times through areas with
limited bus priority. If successful, there would be potential for services to run along other stops along
the ECMT, such as Papamoa, Te Puke or even Omokoroa to the north. It is acknowledged however
that a frequent rail service may require additional capacity to avoid a new service impacting on
freight train operations, and a new rail station would be needed in the CBD and at any suburban
stops and to costs / benefits (potential uptake) of this service are currently unknown.

B2B Park and Ride Pre-Feasibility Study
Beca // 28 October 2016 // Page 24
3934241 // NZ1-12919054-16 0.16
9 Summary and Conclusions
This study has investigated the possibility of providing a P&R bus service on SH2 east of Tauranga
to encourage mode shift on to buses during construction of the B2B link upgrade project, and thus
reduce traffic demands and improve the efficiency of the road network for all road users.
Two to four minutes each way (six minutes total) could potentially be saved by implementing bus
priority measures between the P&R site and the CBD. This is not likely to be sufficient to make up
for additional delays imposed by the P&R process (access site, park, and transfer to bus).
Additional savings through the B2B site would need to make up the difference.
Of the possible P&R sites and bus routes investigated, a site at the Truman Lane interchange or
Papamoa would have the shortest overall travel times (largely due to the fact that buses accessing
Baypark would need to travel through the B2B work site and be delayed in this area by traffic
queues). Approximately three to five minutes of travel time saving through the B2B site would be
necessary to make the Baypark favourable in terms of travel time vs private car journeys. Any such
benefits would only apply during the B2B construction period, so the attractiveness of the service
once B2B is complete is likely to diminish.
The key success factors for a P&R service were outlined in Chapter 2. We have commented beside
each in the following table.
Table 4: Summary of Priority Measures
Factor Notes
CBD parking shortage and resultant high parking prices
There is generally sufficient parking availability in the CBD and parking is generally cheaper than a two way bus fare (on a weighted average basis).
Traffic congestion on routes feeding CBD
The SH2 route to the CBD is congested and B2B works will add to this congestion / increase delays. Therefore this would encourage use of a P&R service if buses can achieve shorter journey times than cars, i.e. through bus priority.
Good quality public transport services (<15minutes headway between services)
We assume a 10-15 minute frequency service could be provided, however buses are not likely to provide a significant travel time saving along the route to make P&R attractive option (unless good savings can be made through the B2B site).
Sufficient population catchment near P&R site / travel demand between the site and service destination
Analysis of traffic data and TTM demands indicates that whist there are high volumes of traffic travelling through the B2B site, only a small proportion of these trips end in the CBD. Reflecting a high proportion of employees based outside the CBD and through traffic.
On the basis of the above it would appear that a P&R service is highly unlikely to be successful if it
were considered to be a typical urban and permanent P&R system. Additionally the costs of
operating the service are likely to significantly outweigh the fares that could reasonably be changed.

B2B Park and Ride Pre-Feasibility Study
Beca // 28 October 2016 // Page 25
3934241 // NZ1-12919054-16 0.16
There may be some benefit in providing HOV provision, though this is likely to largely depend on
the amount of travel time savings that can be achieved through the B2B site and this is at this stage
unknown. If considered on a corridor basis, T3 is likely to be more preferable to T2 for the Transport
Agency, given the capacity and safety risks presented on Hewletts Road.
At this stage it appears that a P&R service would provide little benefit (attract approximately 50
users per day) and operate at a significant cost (more than $3M over a 2.5 year period) to the
Transport Agency. The service may be more attractive and achieve greater patronage / cost
recovery if significant time savings can be made through the B2B site. HOV priority is considered a
preferred approach, benefitting 200 to 600 people per day. It is recommended that P&R / HOV
provision is reviewed once possible travel time savings through the B2B site are known.