B1 Assessing Open Archiving Mandates v1-2 · PDF file · 2016-12-20Price Elasticity...
62
Assessing Open Archiving Mandates A Risk Assessment Model for Society Publishers FLINT HILL, VIRGINIA USA • WWW.CHAINBRIDGEGROUP.COM
Transcript of B1 Assessing Open Archiving Mandates v1-2 · PDF file · 2016-12-20Price Elasticity...

Assessing Open Archiving Mandates A Risk Assessment Model for Society Publishers
FLINT HILL, VIRGINIA USA • WWW.CHAINBRIDGEGROUP.COM

2 B1 Assessing Open Archiving Mandates v1-‐‑2.docx | Chain Bridge Group
© BioOne 2014
The preparation of this analysis was sponsored by BioOne— 21 Dupont Circle, Suite 800 Washington, DC 20036
www.bioone.org
This report was prepared by—
Raym Crow Chain Bridge Group
Flint Hill, Virginia USA 22627 www.ChainBridgeGroup.com [email protected]
1.540.675.9950
Revision History—
Version 1.0, September 9, 2013 Version 1.1, incorporating B1 case studies, November 22, 2013, Version 1.2, Advance BioOne Publisher release, April 24, 2014
Note on the Risk Assessment Model & Disclaimer
The risk assessment model described in this document is intended to assist society journal publishers in evaluating the potential financial implications of open-‐‑access mandates and in responding constructively to such mandates. The model provides a basis for exploring various financial outcomes, but should not be construed as guaranteeing any particular outcome or result. Some of the market assumptions, journal attributes, and/or mandate requirements are likely to change. The risk assessment model is intended to help society publishers estimate the extent to which their journal publishing operations might be affected by such changes.
The example values used in this guide are for illustrative purposes only. Any reliance upon the model described in this document or any other use of the information or data contained in this document shall be at the sole risk of the user. Neither BioOne nor Chain Bridge Group will be liable for any damage, loss, cost or expense of any kind arising from the interpretation, use or adaptation of the data or other information contained in this document.

3 B1 Assessing Open Archiving Mandates v1-2 | Chain Bridge Group
ASSESSING OPEN ARCHIVING MANDATES
PART ONE
1. Report Context, Purpose & Structure
1.1. Context & Purpose ........................................................................................................................5
1.2. Purpose of the Risk Assessment .................................................................................................6
1.3. Report Structure ............................................................................................................................6
2. Mandate Policies & Attributes
2.1. Growth & Coverage of Funder & Institutional Mandates.......................................................8
2.2. Mandate Policy Attributes ......................................................................................................... 12
PART TWO
3. Framework for Assessing the Financial Implications of Mandates
3.1. Risk Assessment Issues .............................................................................................................. 16
3.2. Substitution Assessment Model Overview ............................................................................. 18
4. Defining Risk Tolerance
4.1. Purpose of a Risk Threshold ...................................................................................................... 23
4.2. Effect of Substitution on Non-Subscription Revenue ............................................................ 23
5. Journal Attributes & Substitution Risk Factors
5.1. Journal Attributes & Substitution Risk .................................................................................... 26
5.2. Percentage of Research Content Affected ................................................................................ 27
5.3. Deposit Compliance Rate ........................................................................................................... 28
5.4. Use Outside Embargo Period .................................................................................................... 28
5.5. Deposited Version ....................................................................................................................... 29
5.6. Discoverability & Access ............................................................................................................ 29
5.7. Other Journal Attributes ............................................................................................................ 30
5.8. Risk Factor Summary ................................................................................................................. 31
6. Assessing the Impact of Substitution
6.1. Translating Substitution Risk into Financial Impact .............................................................. 32
6.2. Price Elasticity of Demand ......................................................................................................... 32
6.3. Subscription Units Exposed....................................................................................................... 33
6.4. Average Revenue per Subscription .......................................................................................... 34

4 B1 Assessing Open Archiving Mandates v1-2 | Chain Bridge Group
7. Monte Carlo Simulation Model
7.1. Simulation Model Overview .................................................................................................... 35
7.2. Monte Carlo Simulation Description........................................................................................ 35
PART THREE
8. Guide to Using the Substitution Assessment Model
8.1. Guide Introduction ..................................................................................................................... 40
8.2. Establishing a Risk Threshold ................................................................................................... 40
8.3. Journal Attributes ....................................................................................................................... 42
8.4. Percentage of Funded Research Content ................................................................................. 42
8.5. Deposit Compliance Rate ........................................................................................................... 43
8.6. Use Outside Embargo Period .................................................................................................... 44
8.7. Deposited Version ....................................................................................................................... 45
8.8. Discoverability & Access ............................................................................................................ 46
8.9. Price Elasticity of Demand ......................................................................................................... 46
8.10. Exposed Subscription Units....................................................................................................... 48
8.11. Average Revenue per Subscription .......................................................................................... 48
8.12. Example Results ......................................................................................................................... 49
9. Scenarios & Case Studies
9.1. Sample Substitution Scenarios .................................................................................................. 51
9.2. BioOne Journal Analyses ........................................................................................................... 51
Appendices ................................................................................................................................................. 54
Sources Cited .............................................................................................................................................. 61

5 B1 Assessing Open Archiving Mandates v1-2 | Chain Bridge Group
PART ONE
1—REPORT CONTEXT, PURPOSE & STRUCTURE
1.1 Context & Purpose
Increasingly, nonprofit publishers, in all disciplines, must accommodate funder and institutional
mandates requiring the deposit of sponsored research publications in open archives. Societies, including
those sympathetic to the spirit of open archiving policies, are often apprehensive about the potential
implications of such mandates for the revenue streams that support the publications and that (often)
subsidize other mission-oriented activities. Multiple factors affect the impact of mandates on journal
revenue, and sorting out the potential effect of mandates on existing business models is a complex
undertaking. Relatively few society publishers have the organizational resources necessary to assess
accurately the implications of mandates on the financial sustainability of their publishing programs.
To guide strategic and practical responses to mandate policies, society publishers require a realistic
assessment of the implications of mandates on their publishing operations. To that end, BioOne
commissioned this report to provide society publishers with a practical perspective on open-access
mandates and an analytic framework for assessing the potential effect of mandates on their journals. The
report is intended primarily for society and other nonprofit publishers affected by existing or proposed
open archiving mandates, including STM, social science, and humanities publishers.
Absent a reliable model for estimating the potential effect of open-access mandates, society publishers
may rely on intuitive assessments, driven by one or two indicators, such as the proportion of funded
research or embargo length. Such casual assessments often articulate the risk perceived in terms of a
tipping point—the notion being that once a sufficient (but unspecified) proportion of a journal’s content
becomes openly available, a critical (but unspecified) number of institutions will cancel their
subscriptions. The notion of a tipping point thus implies a specific risk threshold, but does not define
what that threshold might actually be.
Cognitive studies have demonstrated that such intuitive risk assessments often result in poor
management decisions. Further, given the risk aversion of many societies, reliance on a casual assessment
may lead a society to overstate the risk posed by open archiving. Even when other factors are considered,
a society publisher may simply rank risk along a notional scale from low to high, without attempting to
quantify the probability of the risk or to estimate the severity of its impact. This can lead a society to
expend disproportionate effort avoiding an exaggerated risk, rather than pursuing more productive
responses.
As the ability of academic libraries to pay for the value added by publishers erodes, society publishers
fear that libraries might cancel journal subscriptions were the same content openly accessible. However,
openly archived articles that comply with mandates are rarely perfect substitutes for the full published
journal. The probability model described in this document intends to provide society publishers with a
better assessment of the financial implications of a given set of open archiving policies than would
otherwise be available. The structured open archiving assessment process allows a society to:
� Estimate the extent to which openly archived articles might serve as substitutes for a published
journal;
� Calculate the effect of the potential substitution on journal subscriptions and revenue; and
� Determine the likelihood that any forgone revenue would exceed the society’s capacity to absorb the
loss.

6 B1 Assessing Open Archiving Mandates v1-2 | Chain Bridge Group
1.2 Purpose of the Risk Assessment
This report provides society publishers with a structured process and probability model for assessing the
implications of various types of mandates and for responding constructively with policies and funding
models that serve both mission and business requirements. The open archiving assessment model
described here uses probability ranges to express uncertainty about the potential effects of mandate
requirements given a particular set of journal attributes. The model then applies a simple Monte Carlo
simulation—a computer-enabled method for generating random scenarios—to test the likelihood that
potential lost revenue would exceed the society’s stated tolerance.
Some might object to the assumption, inherent in the model, that open archiving will affect the perceived
value of a journal. However, such an assumption is dictated by economic axiom: the availability of a
substitute—even an imperfect substitute—affects the demand for any good, including peer-reviewed
journals. The extent of the substitution effect is the issue, and the model presented here provides a
systematic, if necessarily approximate, method for predicting what that effect might be.
At the same time, the model’s development was motivated by a concern that society publishers often
perceive greater risk from open archiving policies than such policies actually pose, and that an
exaggerated perception of risk could lead societies to respond in ways more appropriate to a for-profit
than a nonprofit entity. For-profit publishers seek to maximize revenue and return for their shareholders,
and typically fight to avoid any diminution of revenue. Society publishers, however—while not
indifferent to revenue concerns—typically seek to balance financial sustainability with increased reach
and access. The model is intended to help societies refine that balance, rather than to protect existing
revenue models.
Either under- or overestimating the financial risk posed by open-access mandates could have negative
consequences for a society:
� Underestimating the risk could starve a society of the capital required to respond effectively to a
changing market environment and undermine the society’s ability to support its publications
program or provide key member services.
� Overestimating the risk from mandates might lead a society to misallocate financial and
organizational resources to avoid an overstated threat. It could also drive a society to adopt a
reactionary strategy that does not align with the needs or expectations of its members, or to alienate
key constituencies, including academic libraries.
While the open archiving assessment model described here attempts to quantify the substitution effect of
funder mandate requirements given specific journal attributes, each society will need to determine for
itself the level of risk—both financial and political—that it is able and willing to accept.
1.3 Report Structure
The report is structured as follows:
Part One (Sections 2 – 3) reviews the various types of open-access mandates—including funder
mandates, institutional mandates, and popular (member-driven) mandates—and discusses the practical
implications of each. It also describes key mandate characteristics, such as repository deposit
requirements, embargoes, and compliance mechanisms.
Part Two (Sections 4 – 7) provides a framework for assessing the financial implications of mandates for
subscription journals, focusing on how specific mandate requirements might affect a journal’s revenue
given specific journal characteristics.

7 B1 Assessing Open Archiving Mandates v1-2 | Chain Bridge Group
Part Three (Sections 8 – 9) provides a practical guide to applying the open archiving assessment model,
including detailed instructions and examples.

8 B1 Assessing Open Archiving Mandates v1-2 | Chain Bridge Group
2—MANDATE POLICIES & ATTRIBUTES
2.1 Growth & Coverage of Funder & Institutional Mandates
2.1.1 Growth of Mandates
Open-access mandates—policies that require or encourage authors to make their published research
more widely accessible—have proliferated in recent years. Public and private research funders have
begun to issue mandates that stipulate minimum access requirements for publications by grant recipients,
while faculty at some universities and research institutions have voted to comply voluntarily with
publishing guidelines designed to increase access to the research they publish. The logic behind most
funder mandates is maximizing the return on the funder’s social investment by increasing access to, and
use of, the published research results. Institutional mandates serve a similar function by increasing the
visibility and impact of the research generated by an institution’s researchers.
Besides funder and institutional mandates, a society publisher might face a popular mandate, driven by
member expectations of expanded access. As such member expectations do not entail specific compliance
requirements, we have not addressed them in detail here. However, some of the metrics and analytical
tools described in this document will be relevant to a society attempting to assess the implications of
responding to a member mandate for increased open access.
Exhibit 2-1: Growth in Funder & Institutional Mandates, 2003 – 2013
Data Source: ROARMAP. http://roarmap.eprints.org/
The number and scope of both funder and institutional mandates continue to increase (see Exhibit 2-1).
There are now scores of funding organizations mandating some form of open-access dissemination as a
condition of a grant award, with additional funders considering new mandates.1 These funders include
1 For lists of funder and institutional open access publishing and archiving requirements, see the Registry of Open Access
Repositories Mandatory Archiving Policies (ROARMAP; http://roarmap.eprints.org/) and the SHERPA/JULIET database
(http://www.sherpa.ac.uk/juliet/).

9 B1 Assessing Open Archiving Mandates v1-2 | Chain Bridge Group
large research foundations (e.g., Howard Hughes Medical Institute, the Wellcome Trust, etc.),
government agencies (e.g., the National Institutes of Health), national research councils (in Australia,
Canada, the UK, and Europe), and disease research and patient-advocacy organizations (e.g., Autism
Speaks, British Heart Federation, Canadian Cancer Society, etc.). According to the SHERPA/JULIET
database—which provides a registry of funder open-access policies—60% of funder mandates require
(rather than simply encourage) open-access archiving or publication.2
The approval of an open-access policy by the Harvard University faculty in 2008 provided the impetus
for a number of institutions to adopt similar policies, and almost 200 institutions worldwide have now
adopted open-access mandates. Although the rate of growth has slowed somewhat, colleges and
universities continue to announce new open-access policies. According to ROARMAP3—a database of
institutional repository mandatory archiving policies—the majority of institutional open-access mandates
are found in the US, Australia, the UK, and Europe, although such mandates have also been adopted by
institutions in Asia, Africa, and South America.4
In the US, institutions adopting open-access mandates range from large research-intensive institutions to
small colleges, and include Harvard, MIT, the University of California system, Princeton, Duke, Rice,
Amherst, and Oberlin. Besides mandates that cover entire institutions, a number of mandates apply to a
specific school or department within an institution. For reasons discussed below, many institutional
mandates are hortatory, rather than compulsory.
2.1.2 Coverage of Mandates
2.1.2.1 Funder Mandates
The overall number of research articles covered by funder mandates also continues to grow. Government
agencies represent the largest source of research funding, especially in the sciences. The Research
Councils UK (RCUK), which fund about £3 billion of scientific research per year, announced in 2012 that
papers resulting from wholly or partially funded research must be compliant with its open-access policy.
That policy allows an embargo period of from six to 24 months, depending on whether an article is self-
archived or published in a fee-based open-access journal.5
Also in 2012, the Higher Education Funding Council for England (HEFCE), which funds approximately
£1.6 billion in research per year, indicated that it would be developing open-access policies to make its
sponsored research as broadly accessible as possible.6 With UK authors representing 4% - 6% of global
research article output annually, and about 60% - 70% of UK articles receiving some level of public
funding, articles covered under UK-based mandates would represent approximately 2.5% - 3.5% of global
article production.7
The European Commission has identified the open dissemination of publicly funded research results to
be critical to the effectiveness of research investment and has signaled its intention to implement a
mandate governing research funded by the EU Research Framework Programs (e.g., Horizon 2020 and
FP7). Starting in 2014, all articles from research funded under Horizon 2020 must be openly accessible,
2 SHERPA/JULIET is maintained by the University of Nottingham and funded by JISC and the Research Libraries UK;
http://www.sherpa.ac.uk/juliet/. 3 ROARMAP was developed and is maintained by the School of Electronics and Computer Science at the University of
Southampton; http://roarmap.eprints.org/. 4 In Latin America, legislation requiring publicly funded research to be available in open access digital repositories was approved in
Argentina and Perú in 2013. See http://www.mincyt.gob.ar/noticias/es-ley-el-acceso-libre-a-la-informacion-cientifica-9521 5 For the RCUK policy, see www.rcuk.ac.uk/media/news/2012news/pages/aspx. 6 www.hefce.ac.uk/news/newsarchive/2012/statementonimpkementing openaccess/. 7 Aspesi, September 2012, 11.

10 B1 Assessing Open Archiving Mandates v1-2 | Chain Bridge Group
either immediately via the publisher (with the potential for article fees to be reimbursed under the
funding program), or through deposit in an open repository within six months of publication (12 months
for the humanities and social sciences). The EC is advising individual member states to adopt open-access
mandates with the same general provisions, with the goal of 60% of European publicly funded research
to be available open access by 2016.8 According to one estimate, if the EC members, especially Germany
and France, mandate open access, then such policies could affect approximately 25% of total global
research output.9
In the US, public access to federally funded research is being promoted by both legislation and the
executive branch. The Fair Access to Scientific and Technical Research Act (FASTR),10 which succeeds the
previously proposed Federal Research Public Access Act (FRPAA) legislation, was introduced into both
houses of Congress in February 2013. As with the earlier bill, FASTR would require federal agencies
funding more than $100 million in research to provide public access within six months of publication,
either through agency-hosting or through institutional or subject-based repositories. The new bill also
calls for common deposit procedures across agencies and for deposit formats and license policies that
facilitate computational analysis and constructive reuse. FASTR would extend open access to (non-
classified) research funded by over 100 federal agencies, including the Departments of Defense, Energy,
Health and Human Services, and Transportation; the National Aeronautics and Space Administration;
the National Endowment for the Humanities; and the National Science Foundation.
Complementing the legislative action, the White House Office of Science and Technology Policy (OSTP)
issued a directive, in February 2013, requiring federal agencies funding more than $100 million in
research to develop plans to make publications resulting from funded research publicly accessible within
one year of publication.11 Although FASTR and the OSTP directive share many elements, the latter is
already in effect. At the same time, a future president could rescind the executive directive, while the
FASTR legislation would provide a more certain future for a federal public access policy. If the US
government adopts an open-archiving policy along the lines proposed by FASTR and/or the OSTP
directive, approximately 18% of global research output would be affected.12
In the meantime, an omnibus appropriations bill, passed in January 2014, included language that
effectively codified the OSTP Directive requirements into law for the Departments of Education, Labor,
and Health and Human Services, and their related agencies (including the Agency for Healthcare
Research and Quality and the Centers for Disease Control).
Together, the UK, EU, and US research output potentially subject to open archiving mandates represents
almost half of annual scientific research articles worldwide. Although the timelines for these government
mandates vary—the RCUK policy took effect in 2013; the EC intends to implement its policies starting in
2014; and a US policy has yet to be implemented—society publishers need to be aware of the implications
for their particular disciplines. In some well-funded disciplines, particularly biomedicine, the percentage
of articles potentially affected could be significant, while in under-funded disciplines the proportion of
articles under funder mandates may remain low.
8 See RIN 2009 and http://ec.europa.eu/research/science-society/index.cfm?fuseaction=public.topic&id=1294&lang=1. Several
prominent European research funders—including Inserm in France and Deutsche Forschungsgemeinschaft in Germany—have
already established open-access policies. 9 Aspesi September 2012, 12. 10 For text of the bill, see http://beta.congress.gov/bill/113th-congress/senate-bill/350?q=s350. 11 http://www.whitehouse.gov/sites/default/files/microsites/ostp/ostp_public_access_memo_2013.pdf 12 Aspesi September 2012, 12.

11 B1 Assessing Open Archiving Mandates v1-2 | Chain Bridge Group
In addition to the potential for additional federal mandates, several US states—including California,13
Illinois,14 and New York15—have passed, or are actively considering, open-access legislation that targets
state-funded research. This state legislation could have significant implications for journals that have a
high percentage of state-funded research.16
Private nonprofit agencies, foundations, and patient-advocacy groups—such as HHMI, the Wellcome
Trust, and the Health Research Alliance—which fund hundreds of millions of dollars of research
annually, will have a particular impact on biomedical journals.17
2.1.2.2 Institutional Mandates
The number of articles published by authors at institutions with open-access mandates is more difficult to
estimate. Institutional mandates have a broad, positive effect on self-archiving deposit rates, with one
analysis indicating that self-archiving at institutions with mandates is triple the deposit rate of
institutions without mandates (see Exhibit 2-2).18 The ROAR website provides data on the self-archiving
activity for individual institutional repositories, including those at institutions with mandates.19
Exhibit 2-2: Self-Archiving Rates at Institutions With & Without Open Access Mandates
Data Source: Poynder 2011. http://poynder.blogspot.com/2011/06/open-access-by-numbers.html
13 California Taxpayer Access to Publicly Funded Research Act (AB 609). See http://www.leginfo.ca.gov/cgi-
bin/postquery?bill_number=ab_609&sess=CUR. 14 The Illinois Open Access to Articles Act (SB 1900). See http://www.ilga.gov/legislation/fulltext.asp?DocName=
09800SB1900&GA=98&SessionId=85&DocTypeId=SB&LegID=&DocNum=1900&GAID=12&Session=. 15 NY State Taxpayer Access to Publicly Funded Research Act (A 180 / S 4050). See http://open.nysenate.gov/legislation/api/1.0/lrs-
print/bill/S4050-2013.
16 California currently funds approximately $200 million per year in scientific research—down from $350 million before the 2008
recession (see http://www.ccst.us/publications/2008/2008RandD.php) and the sponsors of the New York legislation claim that the
state funds scores of millions of dollars in research. 17 The Wellcome Trust awards an average of £800 million per year for biomedical research. The Health Research Alliance (HRA),
http://www.healthra.org/, which represents about 50 of the largest private funders of biomedical research in North America,
provides about $16 billion per year in research funding. Although none of the HRA organizations has yet issued an open-access
mandate, the member organizations are beginning to coordinate mandate policies. 18 Gargouri et al. 2012. 19 See ROAR, http://roar.eprints.org/.

12 B1 Assessing Open Archiving Mandates v1-2 | Chain Bridge Group
Individual research institutions can account for a significant number of peer-reviewed articles per year.
The faculty at the ten campuses of the University of California, for example, publish upwards of 40,000
articles per year, which represents about 2.5% of global research article output.20 However, the articles
covered by institutional mandates are less likely to be concentrated by discipline than those under funder
mandates, and the effect of a particular institution’s mandate on a given journal will need to be evaluated
individually.
2.2 Mandate Policy Attributes
Several mandate policy attributes have implications for subscription-based journals, as they affect the
extent to which openly archived content serves as a substitute for the published journal. These
requirements include the version of the article to be archived, the allowable timeframes for deposit and
access, and where the paper must be deposited. We discuss below the principal attributes of funder and
institutional mandates as context for understanding their implications for substitution and for journal
revenue models.
2.2.1 Version Archived
Most funder mandates stipulate deposit of the author’s “Accepted Manuscript;”21 that is, after peer
review comments have been incorporated, but before copyediting and publisher formatting have been
applied. Few, if any, funder mandates accept the “Author’s Original” version as submitted to a journal,
but before review comments have been included. Similarly, few mandates require deposit of the “Version
of Record,” the final published version of an article, unless access to the article is provided via the
publisher’s website or results from payment of an open-access publication fee.22
Although researchers prefer the Version of Record, especially when preparing formal research
publications of their own, the author’s Accepted Manuscript is perceived to be an adequate substitute for
the published version by many researchers and librarians.23 We discuss the substitution implications of
the deposited version in §5.5.
2.2.2 Embargo & Deposit Timeframe
Although there is no empirical evidence documenting their effectiveness, content embargoes remain the
prevalent strategy for reducing the risk of substitution. As we discuss in §5.4, an embargo’s stated
duration is just one dimension of determining the substitution effect of an embargo, and other factors—
including actual use of the journal within the embargo period—must be taken into account.24
Embargoes established by publishers vary considerably in length, both within and across disciplines.25
One recent study indicates that the most common embargo period is 12 months (48% of journals),
followed by 24 months (28%), and then six months (17%), with a small percentage of journals having
20 “Academic Senate approves open access policy,” University of California Press Release, August 2, 2013,
http://www.universityofcalifornia.edu/news/article/29858. 21 We use here the terms proposed by the NISO/ALPSP Technical Working Group on Journal Article Versions
(http://www.niso.org/publications/rp/RP-8-2008.pdf). 22 For example, to comply with the RCUK policy, a journal must either provide immediate access through the publisher’s website or
allow self-archiving of the author’s accepted manuscript. See http://www.rcuk.ac.uk/documents/documents/RCUK%20_Policy_on_
Access_to_Research_Outputs.pdf. 23 Beckett and Inger 2005.
24 Although the model includes average online use within an embargo period as one input for the risk assessment, it does not test
the effectiveness of relative embargo lengths. 25 See, for example, Jones 2013.

13 B1 Assessing Open Archiving Mandates v1-2 | Chain Bridge Group
embargo periods of less than six months or more than two years.26 Further, some embargoes carry
additional restrictions, such as the payment of a fee or requiring formal permission to self-archive.
The policies of the largest research funders vary in terms of acceptable mandate length. The NIH public
access policy requires deposit within 12 months, the Wellcome Trust within six months, and RCUK
within six months (with provision for longer embargoes in the humanities and social sciences). The
pending EC policy and FASTR legislation propose six-month embargoes.
Institutional mandate policies do not always stipulate a specific deposit timeframe, although some call for
immediate deposit upon publication, with access opened in compliance with the publisher’s mandate
terms.
2.2.3 Deposit Channel(s)
The ease and reliability with which openly archived content can be discovered and used is largely a
function of the repository in which it is deposited.
Institutional mandates typically call for authors to deposit articles in the institution’s online repository,
while funder mandates vary in their deposit requirements. Some funders stipulate a specific repository
where grantees must deposit to be in compliance. For example, the mandates of major biomedical
funders, including NIH and the Wellcome Trust, require deposit in the National Library of Medicine’s
PubMed Central (PMC) or in Europe PubMed Central. In other fields, mandates call for an author to
deposit in an appropriate institutional or subject-based repository and/or for access to be available via the
publisher’s website.
We discuss the substitution implications of mandated deposit channels in §5.6.
2.2.4 Compliance Provisions
The rate at which authors comply with a mandate affects the amount of content available for potential
substitution for the published journal. A 2005 survey of researchers indicated that a significant majority
of researchers (> 80%) would comply willingly with a funder or institutional open-access mandate.27 Still,
in practice, compulsory funder mandates tend to enjoy higher compliance rates than voluntary self-
archiving policies.
2.2.4.1 Institutional Mandate Compliance
Institutional open-access policies are typically self-imposed mandates, approved by an institution’s
faculty. In order to get enough support to pass an open-access policy in the faculty senate, most
institutional mandates include liberal waiver policies that allow faculty to publish without complying
with the mandate. As a result, many institutional self-archiving policies might be better characterized as
pledges than mandates. Fewer European institutions have such opt-out clauses, resulting in higher
compliance rates.28 Further, in the UK and some European countries, a faculty member’s research
publications must be deposited in the institution’s repository to be considered for review in professional
assessment exercises.
26 The SHERPA Services Blog (November 2, 2011) reporting on the 19,000 journals tracked by the SHERPA service. See
http://romeo.jiscinvolve.org/wp/2011/11/24/60-of-journals-allow-immediate-archiving-of-peer-reviewed-articles-but-it-gets-much-
much-better/. 27 Swan and Brown 2005, Table 29. Another 13% indicated that they would comply reluctantly, and 5% indicated that they would
not comply. 28 For example, the University of Liège, which has a mandatory policy (http://roarmap.eprints.org/56/) is reported to have a deposit
rate of over 80%.

14 B1 Assessing Open Archiving Mandates v1-2 | Chain Bridge Group
Deposit rates have been shown to climb significantly at institutions that adopt open-access mandates—
even relatively weak ones—with much of that growth facilitated by libraries that utilize staff to promote
compliance. A recent study based on ROARMAP data demonstrated a significant correlation between
deposit rate and institutional mandate strength, with the strongest mandates realizing compliance rates
of over 70% within two years, compared to a self-archiving rate of 20% for institutions without
mandates.29
Irrespective of an institution’s policy, mandate compliance is likely to be highest in disciplines with a
culture of information sharing and a predisposition to open access. Thus, authors in fields such as
computer science, economics, mathematics, and physics may be expected to comply with mandate
policies at a higher rate than authors in the social sciences and humanities.30 Although compliance rates
vary by institution, as the number of institutions adopting open-access mandates grows, the number of
openly archived articles available to serve as substitutes increases.
2.2.4.2 Funder Mandate Compliance
Funders typically have enforcement leverage and strong mandate compliance provisions, and compliance
rates have climbed for the major funders that have implemented stricter controls. Initially, for example,
compliance with the NIH public access mandate was voluntary and grantee compliance rate was
reported to be under 5%. A policy introduced in 2008 made deposit mandatory, and compliance rose
significantly thereafter, increasing to its current rate of approximately 75%.31 The relatively high
compliance rate is supported, in part, by large publishers managing PMC deposit requirements for their
authors.32
Similarly, the Wellcome Trust’s mandate compliance policy hardened in 2009, with non-compliant papers
resulting in a portion of the grant budget being withheld. The Wellcome Trust now reports a 60%
compliance rate, but has announced plans to increase compliance further by shifting responsibility to the
researcher’s host institution and ensuring that all publications from previous grants are in compliance
with the policy before any funding renewals or new grant awards.33
The FundRef registry, recently developed by CrossRef,34 provides a standard taxonomy with which
editorial workflow systems can capture article funding information from authors. This information will
allow publishers to analyze the funded articles in their journals and help funders track and increase
compliance with their policies.
We discuss the implications of mandate compliance rates for estimating the percentage of a journal’s
content exposed to substitution in §5.3.
2.2.5 Focus on Funder Mandates
As described above, both funder and institutional mandates will have an impact on the amount of openly
archived content available to serve as a substitute for the published journal. However, for practical
29 Gargouri et al. 2012. See also Nicholas et al. 2012 and Xia et al. 2012. 30 See Kim 2010. 31 Aspesi 2012, 20. 32 For a list of publishers supporting author deposit in satisfaction of the NIH policy, see
http://publicaccess.nih.gov/select_deposit_publishers.htm and http://publicaccess.nih.gov/submit process_journals.htm. 33 See Wellcome Trust Authors’ FAQs http://www.wellcome.au.uk/About-us/Policy/Spotlight-issues/Open-
access/Guides/WTDo18855.htm#ten and Times Higher Education, March 29, 2012 (http://www.timeshighereducation.co.uk/
story.asp?storycode=419475). 34 http://www.crossref.org/fundref/

15 B1 Assessing Open Archiving Mandates v1-2 | Chain Bridge Group
purposes, the open archiving assessment model we describe in the following sections focuses on funder
mandates.
Although open-access mandates are in effect at some of the world’s leading research institutions, they
cover a relatively small fraction of the annual global output of research articles. Moreover, in the majority
of cases, it would be difficult to estimate the percentage of content affected by institutional mandates for
any given journal.35
The relatively rare journal that derives a significant percentage of its research content from authors at a
well-defined set of universities can apply the methods described in the rest of this document to assess the
risk of substitution posed by the mandates at those institutions. For the majority of journals, however,
focusing on funder mandates will provide the most effective approach to assessing and responding to the
risk of substitution.
Exhibit 2-3 summarizes the key attributes of major funder mandates. Additional information on funder
mandates is available via the ROARMAP service.36
Exhibit 2-3: Summary of Major Funder Mandate Attributes
35 Additionally, although it is not recommended, a publisher could control whether its content is covered by institutional mandates
through retrograde licensing terms (for example, by introducing inordinately long embargo periods or license transfer policies
designed to defeat the effects of institutional mandates). As explained in §3.2, factors under a publisher’s control should be excluded
from the risk assessment. 36 http://roarmap.eprints.org/
FunderNational Institutes of Health
(NIH)Wellcome Trust
Research Councils United
Kingdom (RCUK)European Research Council License FASTR
Howard Hughes Medical
Institute (HHMI)
In effect since April 7, 2008Updated policy in effect since
April 1, 2013In effect since April 1, 2013 In effect since January 1, 2008.
Applies to all work
conducted using HHMI
Does not apply to HHMI
grantees
Deposit
LocationPubMed Central Europe PMC
Institutional or subject
repository
Europe PMC, arXiv & other
specified repositoriesNot stipulated
Suitable depository to be
designated by each agencyPubMed Central
Delayed or withdrawn
funding.
Delayed or withdrawn
funding.
Compliance rate ~75% Compliance rate ~60%
Application In effect since 2008 Pending legislationCovers all research wholly
or partially funded
Covers all research wholly
or partially funded
Covers all research wholly
or partially funded
Author grants NIH a non-
exclusive right to copyright
to the original paper in PMC
Version of record &/or
Author’s accepted
manuscript
Version of record &/or
Author’s accepted
manuscript
Embargo/
Deposit
Timeframe
Within 12 months Within 6 months
Immediate for paid OA,
otherwise within 6 months
(12 months for social sciences
& humanities)
Immediate for paid OA,
otherwise within 6 months
(12 months for social sciences
& humanities)
CC-BY, if article fee paid Within 6 months Within 6 months
VersionAuthor’s accepted
manuscript
Author’s accepted
manuscript, if self-archived;
Version of record, if article
fee paid
Author’s accepted
manuscript, if self-archived;
Version of record, if article
fee paid
Author’s accepted
manuscript, if self-archived;
Version of record, if article
fee paid
CC-BY, if article fee paid
Enforcement
Linked to Research
Assessment Exercise; block
grants to fund article fees
Condition of fundingPresumably, similar to NIH
policyCondition of employmentNot stipulated

16 B1 Assessing Open Archiving Mandates v1-2 | Chain Bridge Group
PART TWO
3—FRAMEWORK FOR ASSESSING THE FINANCIAL IMPLICATIONS OF MANDATES
3.1 Risk Assessment Issues
3.1.1 Probability & Impact
Risk is typically described as having two dimensions: probability and impact. Probability relates to
uncertainty, as risk refers to the possibility of a future state, which may or may not occur. Impact relates
to what would happen were the event to occur. Thus, risk is often defined as the potential loss multiplied
by the probability that the loss will occur. In the case of a society publisher assessing the implications of
funder mandates, quantifying risk entails assessing the probability that various mandate requirements
might result in subscription cancellations and determining the financial impact were the cancellations to
occur.
In most cases, it will be relatively simple to estimate the impact of the cancellation risk in terms of forgone
revenue. However, assessing the probability of risk is more problematic, as:
� testing the probability of subscription cancellations can be difficult without actually putting
subscriptions at risk or without incurring significant market research costs;
� risk inherently involves uncertainty; and
� probability estimates can be influenced by subjective and unconscious biases.
Reviewing each of these issues in turn will provide context for a description of a structured framework
for assessing and responding to mandate requirements.
3.1.2 Need for a Market Surrogate
For most journals, there is no cost-effective way for a publisher to test the potential effects of available
substitutes on cancellations without exposing itself to an unacceptable risk. Journal-specific market
research might provide better information about potential library responses to the availability of
substitutes, and thus reduce uncertainty in assessing the risk for a given journal. However, properly
conducted in a manner designed to yield reliable results, such market research would likely prove too
expensive for many society publishers. Further, simply waiting to see the market response to the
availability of substitutes might limit a society’s response options. Therefore, a risk assessment model is
needed to provide a market surrogate.
The open archiving assessment model described here provides a publisher with a tool to assess potential
market responses to substitution actively and before the fact. Moreover, the time and effort required to
apply the risk assessment tool should be far less intensive than performing the journal-specific market
research and environmental analyses that would otherwise be necessary.
3.1.3 Measuring Uncertainty
It is impossible to determine probability precisely in a complex decision such as subscription
cancellations. Although assembling accurate data and controlling for perception biases will improve the
accuracy and utility of substitution estimates, there will always be some degree of uncertainty and
imprecision. Fortunately, precision is not necessary in order to provide a useful estimate of the
probabilities of various substitution scenarios.
Reducing uncertainty is useful, even if does not eliminate uncertainty entirely. Although it may not
always be possible to achieve a high degree of precision—and some of the measurements proposed for

17 B1 Assessing Open Archiving Mandates v1-2 | Chain Bridge Group
assessing substitution risk retain a significant amount of potential error—the model nevertheless
represents an improvement over casual assumptions.37
The open archiving assessment model takes into account the lack of complete or accurate journal and
market information by using probability ranges that measure the relative likelihood of a given outcome,
using values that lie on a continuum between impossibility and certainty. These ranges are defined with
scales that provide a publisher with a meaningful frame of reference for estimating the probability of a
given risk.
The model measures this uncertainty by assigning a probability range to the likelihood of substitution for
each critical journal attribute based on the best evidence available. Using probability ranges allows a
publisher to assess risk without making assumptions that go beyond what it knows to be factually
correct. An upper and lower bound of probability is identified for each of the substitution factors, with
the goal of establishing a 90% confidence interval. Given the nature of the data available, and the element
of subjectivity inherent in some of the factors, broad probability ranges are sometimes required to achieve
a high confidence that the true value lies within the range.
Research indicates that explicitly documenting the validity of probability estimates significantly improves
the calibration of the estimates.38 Although the specific values for the substitution risk variables (see §3.2)
will vary for each journal, we have proposed general ranges for the variables and documented the
rationale behind the range assumptions. Suggesting ranges for the substitution variables in this way risks
anchoring or priming the values for a publisher that wishes to modify the proposed ranges. Therefore, we
repeat reminders of these risks wherever we propose default confidence ranges in Part 3 of this report.
Naturally, the accuracy of the probability assessment will be affected by the quality of the data
underlying it. Lack of accurate data on relevant journal attributes (such as a journal’s use curve or the
proportion of articles resulting from funded research), and an incomplete understanding of market
demand, complicate an assessment of the implications of various mandate requirements on substitution.
However, improving the accuracy of data, even where possible, will not always prove cost effective. The
benefit of refining the estimated range of any given risk factor must be weighed against the cost of
collecting the additional data required.
3.1.4 Credibility & Legitimacy
The results of the risk assessment must be understood, and considered legitimate, by decision-makers
within a society. Often, decision-makers will prefer a quantitative assessment of risk, assuming that the
measurement methodology is sound. Where an empirical basis for establishing the substitution
probability ranges is weak or absent, a pragmatic approach, that marshals available data, may be
required. In any event, the data used to justify a probability assumption must be documented and
synthesized in a logical and transparent manner.
Estimating probability can be influenced by subjective and unconscious biases. Cognitive studies39
suggest that a variety of perceptual factors can influence the way a society perceives uncertainty and risk.
Factors that merit special attention for society publishers include:
37 See Slovic 1987 and Hammond et al. 1998. 38 See Hubbard 2010, 64 – 65. 39 See, for example, Hammond et al. 1998; Hillson and Hulett 2004; Kahneman 2012; and Slovic 1987.

18 B1 Assessing Open Archiving Mandates v1-2 | Chain Bridge Group
� Familiarity—
The extent to which a society has experience analyzing subscription risk factors can affect whether it
will perceive the risk probability as high or low. A society with little or no previous experience with
such analyses will often perceive a higher degree of uncertainty (and therefore risk) than one with
extensive experience.
� Timeframe and scale—
A society will perceive the risk of cancellations to be higher if the risk is closer in time, rather than
further into the future. This can lead a society to perceive the risk of cancellations resulting from
mandate policies to be great, while it underestimates the incremental threat of cancellations that
cumulate over time. Similarly, a society may perceive the risk of a sudden drop in subscriptions to be
greater than a gradual, but equally harmful, decline.
� Control—
The extent to which a society perceives that it can exercise some control over an outcome will affect
its perception of the risk. This is true even where the perception of control is illusory. This may help
explain why publishers appear to be more apprehensive of externally imposed embargo periods than
those they implement—without apparent empirical evidence—themselves.
� Motivation—
Motivational bias can occur when the assessing individual(s) or organization has an interest in
influencing the results. In the case of a society publisher, this bias could run either way: assessors
with a predisposition to increased access might reflect a bias toward lessening the perceived risk,
while more conservative assessors might be biased towards an increased perception of risk. Involving
a variety of stakeholders (including members, staff, and independent stakeholders) in the risk
assessment exercise can help counter such motivational bias.
As these perceptual factors operate subconsciously in individuals and groups assessing probability, a
structured approach that helps manage potential bias will provide a more realistic and useful assessment
of probability.
3.2 Substitution Assessment Model Overview
3.2.1 Substitution Risk Factors
An overview of the logic behind the risk model will provide useful context for discussing the substitution
risk factors and Monte Carlo simulation in detail. As already noted, the open archiving assessment model
has been designed to:
1) assess the probability that openly archived articles might serve as a substitute for a subscription to a
published journal; and
2) estimate the extent to which this substitution might translate into lost revenue.
The substitutability of openly archived content for a subscription to a published journal will be affected
by several factors. Three of the factors quantify the amount of content that will be openly available and
two additional factors qualify the extent to which the open content might serve as a substitute. The three
quantitative factors are:
19 B1 Assessing Open Archiving Mandates v1-2 | Chain Bridge Group
� The proportion of a journal’s research content affected by funder mandates—
The first step is to determine the percentage of a journal’s content that would be subject to one or
more funder mandates. Not all of a journal’s research content is covered by a mandate (the
proportion covered is typically less than 50%), and research articles do not necessarily represent all of
a journal’s content (for example, reviews, letters, editorials, and other communications can comprise
a significant portion of some journals).
� The percentage of authors complying with funder requirements—
Not all of the content covered by mandates necessarily gets deposited per the funder’s policies. The
compliance rate for funder mandates depends on funder enforcement policies and other factors and,
as a result, may change over time. Sometimes the compliance rate for a funder’s mandate is
documented and published, while in other instances the extent of actual compliance is unknown.
� Use of a journal’s content within the embargo timeframe—
Embargo lengths vary from six months to 24 months, and the percentage of online use that occurs
within the embargo period varies by type of journal (e.g., fast-cycling scientific journals receive a
higher proportion of use upfront than social science and humanities journals). Use within the
embargo timeframe provides a better metric for evaluating the effect of an embargo than the nominal
embargo period.
Together, these quantitative factors define the amount of content that would be available as a substitute
(however imperfect) for the published journal. As a simplified example, were 40% of a journal’s content
covered by a funder mandate with an 80% compliance rate, and were 75% of the use of that content
estimated to occur after the embargo period, then 24% (i.e., 40% * 80% * 75%) of the published journal’s
content would be available to serve as a substitute.
If the openly available content were exactly the same in all other respects as the content in the published
journal, then the journal’s value, relative to its current price, could be said to be reduced by 24% as a result
of the open archiving. However, in most cases, the openly archived content is not the same as the
published version in several significant respects, and these differentiating factors mitigate the
substitution effect of the openly archived content.
While the quantitative factors measure the amount of content available for substitution, the differentiating
factors represent qualitative considerations that reduce the extent to which the available content might
serve as a substitute for the published journal. There are two principal differentiating factors:
� The version of the article that is openly archived—
Surveys of academic libraries indicate that an author’s post-peer review manuscript is a better—
although still imperfect—substitute for the published article than the author’s manuscript before any
revisions. Most mandates require the deposit of the author’s manuscript after referee comments have
been incorporated, but before copyediting and the publisher’s formatting has been applied. However,
mandate policies can vary.
� Reliability of access, functionality, and extent of content integration—
Some mandates require that content be deposited in a subject-specific repository, while other
mandates allow content to be deposited in any online repository. Content archived in centralized,
well-indexed repositories is easier to discover, and provides a more effective substitute for the
published journal, than scattered content for which discovery is less reliable.

20 B1 Assessing Open Archiving Mandates v1-2 | Chain Bridge Group
The risk assessment model measures each differentiating factor by the probability that the factor would
be considered an effective substitute for the published version, thus reducing the value of the journal to a
subscriber relative to the journal’s current price. For example, for the “archived version” variable, an 80%
substitutability value would indicate that 80% of subscribing institutions would consider the openly
archived version to be a sufficient substitute for the published version. As a result, the 80%
substitutability of the archived version would reduce the value of the published content by 20%. (In
practice, this probability will be treated as a range to achieve a 90% confidence interval, as described
below.)
Again, the overall value of the substitute content—that is, the exposed content adjusted by the qualifying
factors—is treated as functionally equivalent to a reduction in the published journal’s value relative to the
journal’s current price. As subscribers will have various intensities of demand (that is, varying consumer
surplus) for a journal, a given decrease in relative value will not typically translate into a commensurate
reduction in the number of subscriptions. To estimate the effect of the substitution on subscriptions, the
model uses a journal’s price elasticity of demand (see §6.1).
3.2.2 Critical Modeling Assumptions
Each of the quantitative and qualitative substitution risk factors are logically independent of one another,
and the substitution probability ranges reflect the effect of each factor individually, all other things
equal.40 However, in making a decision whether to cancel a journal and rely on openly archived content
as a substitute, librarians often consider the contributing factors together.
Strictly speaking, determining the extent to which funder mandate requirements might increase
substitution for a published journal would require an analysis of historical price and circulation data,
controlling for all relevant variables—including journal quality, price, version archived, and reliability of
access. Theoretically, such an analysis of revealed preferences would be possible for those journals that
have been operating under mandates for some time. However, such an analysis would be time-
consuming, expensive, and—by definition—post hoc.
As rigorous econometric modeling is beyond the resources of most society publishers—and a post hoc
analysis typically irrelevant in any event—we have designed the model to allow journal publishers to
estimate—with a reasonable degree of accuracy—the potential impact of funder mandate policies on the
revenue streams for their journals. The model makes the following critical assumptions:
1) To measure the extent to which openly archived content would serve as a substitute for published
content, we have multiplied the probabilities of the individual risk factors.
As described above, calculating the amount of content that might serve as a substitute is relatively
straightforward: For example, were 40% of a journal’s research content covered by a mandate with an
80% compliance rate, then (ceteris paribus)41 the substitution risk would be 32%. And were 75% of the
use to occur outside the embargo period, then the substitution risk for that factor would be 75%.
Again, considering only the three quantitative factors, the probability of substitution would be:
40% * 80% * 75% = 24%.
40 If articles based on funded research were to receive consistently more use within a journal than other original research articles,
then the usage attribute would not be independent of the percentage of funded research. However, an analysis of article usage for a
sample of BioOne journals does not suggest a correlation between funding and use. Therefore, we assume such situations would be
rare or nonexistent. 41 That is, assuming immediate access to the final published manuscript via the publisher’s web site.

21 B1 Assessing Open Archiving Mandates v1-2 | Chain Bridge Group
Establishing a 90% confidence interval for the three quantitative factors presents a straightforward
sampling issue for each factor. (Establishing the bounds for a 90% confidence interval is important for
the Monte Carlo simulation, described in §7.)
2) For each of the qualitative factors, there are criteria that can be assessed to allow the potential extent
of the substitution to be expressed quantitatively.
For example, content known to be archived in a well-indexed, centralized repository—as mandated
by some research funders—would pose a greater risk of substitution than content archived in
unspecified repositories with limited or non-existent indexing practices. Similarly, content archived
with robust metadata and indexed by leading search engines and library discovery tools would
typically be more susceptible to substitution than content scattered across multiple digital
repositories of unknown discovery standards. Absent survey or revealed preference data
documenting librarian perceptions of these factors, we can assign—arbitrarily, but pragmatically—
substitution probabilities for the factors along a broad scale, as described in §5.
Although these probability ranges reflect a lower standard of certainty than might be possible were
better empirical data available, they serve a legitimate purpose by helping to reduce uncertainty. The
bounds for a 90% confidence interval for substitutability based on such criteria will tend to be broad.
Running thousands of scenarios under a Monte Carlo simulation allows us to model the effects of the
substitution assumptions, despite the necessarily broad ranges.
Further, although the ranges for these values are broad, they should be sufficient for the purposes of
most scholarly and scientific societies. In most cases, the value of additional measurement to refine
the probability ranges (and reduce uncertainty) would not justify the additional cost.
3) Conceptually, the qualitative factors can be thought of as reducing the substitution effect of the
openly archived content. (Practically, the order of the probabilities being multiplied does not matter.)
For example, assuming a journal with:
� 24% of its content openly available based on the three quantitative factors (as calculated in the
example above);
� a 75% probability of substitution given the version archived; and
� a level of access with a 60% probability of substitution,
the overall substitution effect would be as follows:
Substitution = 24% * 75% * 60%; that is, Substitution = 10.8%
4) The model posits that the overall calculated substitutability equates to a commensurate reduction in
the journal’s value to a subscriber at the journal’s current price. In other words, if the openly archived
content available given a set of mandate requirements represented a 10.8% substitute for the
published journal, this would be the effective equivalent of a reduction in the journal’s value, relative
to its current price, of 10.8%.
5) The model further assumes that a reduction in a journal’s value via substitution is functionally
equivalent to an inferred increase in the journal’s price. This equivalence is important, because we
use this change in value in combination with a journal’s price elasticity of demand to predict the
number of subscriptions that might be at risk given such a change in value (see §6).

22 B1 Assessing Open Archiving Mandates v1-2 | Chain Bridge Group
Not all subscribers value a journal equally. Some institutions will be at the limit of what they are
willing to pay for a journal, while others would be willing to pay more than the journal’s current
price. As determining the consumer surplus for each individual subscriber—that is, the difference
between what an institution is currently paying and what the institution would be willing to pay—
would be practically impossible, the model uses a journal’s price elasticity of demand to translate a
marginal loss in value/demand into a loss of subscriptions.
For example, a journal with archived content available that represents a substitutability of 10.8% (and
therefore an inferred price increase of the same percentage) and an arc price elasticity of demand
(see §6) of 0.41, would be expected to have a 4.4% decline in the quantity of subscriptions demanded
(0.108 * 0.41 = 0.0442). Applying this predicted change in quantity demanded to the institutional
subscription base, and multiplying by the average subscription price, would thus yield the lost
revenue predicted for each scenario. (The model allows for the elasticity to be adjusted for journals
that have already been affected by archiving mandates.)
The model uses a Monte Carlo simulation to generate random values, within the established probability
ranges, for each of the substitution variables. The results of each scenario are compared against the
publisher’s revenue risk tolerance (see §4) which reflects the publisher’s perception of the revenue loss
that it would be able to accept for the journal. The simulated probability of exceeding a specified lost
revenue threshold (over 10,000 scenarios) represents the financial risk to a journal’s publisher. (As
described below, a publisher may use the model to test multiple revenue loss thresholds.) The publisher
then needs to consider this financial risk, along with any non-financial risks, in the context of
compensatory benefits such as mission fulfillment.
Sections 4 – 7 below describe each component of the model in greater detail.

23 B1 Assessing Open Archiving Mandates v1-2 | Chain Bridge Group
4—DEFINING RISK TOLERANCE
4.1 Purpose of a Risk Threshold
A society’s risk tolerance—stated as a dollar amount—provides a basis against which to test the potential
financial impact of funder mandate requirements. As explained above, the risk model uses a Monte Carlo
simulation to generate random values for a set of substitution factor probability ranges. The model
compares the outcome of thousands of scenarios against a financial risk threshold established by the
publisher, and calculates the probability of exceeding that threshold. Obviously, the lower the financial
risk tolerance, the greater the probability—all things equal—that the substitution effects of a mandate will
exceed the publisher’s tolerance. Therefore, determining how much financial risk a publisher is willing
and able to accept represents a critical component of the analysis.
Societies have different perceptions of risk, and each society will need to determine its own capacity for
absorbing it. In setting a financial threshold, a publisher will need to be especially careful to avoid
introducing motivational bias. For example, a society may be tempted to set the financial risk threshold to
increase the probability that the substitution effects of a mandate will fall above or below the society’s
risk threshold. The model assumes that a publisher has successfully controlled for such bias according to
the principles outlined in §3.1.4. In other words, the open archiving assessment exercise assumes that a
publisher is seeking as objective an assessment as possible. A publisher that does not consider the logic
behind the model’s risk assessment variables to be compelling should adjust those variables, rather than
manipulating the risk threshold.
After running the Monte Carlo simulation based on the financial threshold(s) identified, a society should
evaluate the financial risk in combination with non-financial considerations, such as mission alignment
and member demand. This will allow the society to account for any significant non-financial risks and
any compensating benefits in evaluating the implications of the financial risk assessment.
The revenue risk threshold should take into account the incremental loss a society is able and willing to
tolerate excluding any losses that would be incurred independently of the mandate’s implications (for
example, from current cancellation trends). At a later stage, the society will need to take any revenue
losses unrelated to mandates into account in determining the type of response that might be warranted
based on the totality of the journal’s revenue position. Additional detail on establishing a risk threshold
for modeling purposes is provided in §8.2.
4.2 Effect of Substitution on Non-Subscription Revenue
In calculating the change in subscription revenue that a journal could absorb in order to break even or
lower its operating margin to a specific percentage, the publisher must take into account both the variable
costs of fulfilling journal subscriptions and the contribution of non-subscription revenue streams.
For most peer-reviewed journals, institutional subscription revenue represents over 75% of a journal’s
total revenue, and for small journals institutional subscriptions can account for over 90% of revenue.
Although subscriptions represent the largest source of revenue, most journals generate some revenue
from other sources, including rights and permissions, print advertising, aggregator license royalties,
single issue sales, pay-per-view fees, and (in some instances) page charges.42
To calculate a journal’s risk threshold, a society needs to identify whether non-subscription revenue
streams might be affected by an increase in the availability of openly archived content. While the revenue
42 Although some societies allocate individual member dues to offset the cost of providing member copies, this discussion focuses
on external revenue sources.

24 B1 Assessing Open Archiving Mandates v1-2 | Chain Bridge Group
of each journal will need to be assessed individually, we comment in general below on the potential effect
of substitution on each type of revenue.
4.2.1 Aggregator License Royalties
In addition to subscriptions to the primary journal, many journals are also distributed via online journal
databases offered by aggregators (including EBSCO, JSTOR, ProQuest, etc.), either with or without a
content embargo, and license royalties from these databases can represent a significant portion of a
journal’s non-subscription revenue. For the purposes of this model, royalties received for distribution of
the primary journal—for example, via Project MUSE or BioOne—should be treated as subscription
revenue.
A high percentage of openly archived content might marginally reduce the value of a journal’s content in
aggregated databases. However, academic libraries typically subscribe to such journal aggregations to
provide convenient research resources for students and faculty (especially when conducting
interdisciplinary research), and this convenience value should not be significantly diminished by the
availability of openly archived content. Indeed, it is not uncommon for content in aggregated databases
to duplicate journal content that a library holds in other formats. Further, individual journals bundled in
an aggregation cannot be readily deselected by subscribing institutions. Taken together, these factors
suggest that the availability of openly archived content should not have a significant impact on a
journal’s royalty revenues from journal aggregations.
4.2.2 Rights & Permissions
Revenue for reprint and electronic reserves permissions typically represents less than 5% of a journal’s
total revenue, and for many journals such revenue has been declining with the rise of online distribution.
(Medical journals, for which reprint sales for clinical trials can be substantial, are an exception.) Logically,
where a funder mandate requires a CC-BY license,43 one might expect the demand for permissions to
decrease in proportion to the number of articles covered by the mandate. In practice, however, the
manner in which permissions are processed tends to dampen the substitution effect of openly archived
content.
Most permissions revenue is processed by reproduction rights organizations—such as the Copyright
Clearance Center (CCC) in the US, the Copyright Licensing Agency (CLA) in the UK, and Access
Copyright in Canada—that offer comprehensive annual licenses to institutions on behalf of rights
holders, including journal publishers. These blanket licenses effectively bundle the rights to articles,
reducing the substitutability of an openly archived version of any given article. Although the rights
management agencies also offer transactional licenses and online services (such as RightsLink) for course
packs and electronic reserves, the onus for determining whether an open-access substitute is available lies
with the permission seeker. Given the practical hurdles to substitution, and the relatively low percentage
of revenue represented, the model does not assume any material loss of permissions revenue due to
mandated open archiving.
4.2.3 Advertising & Sponsorships
Advertising also represents less than 5% of total revenue for most peer-reviewed journals. Although most
advertising revenue is driven by subscription circulation, the correlation is not necessarily linear. A
significant decline in circulation would lower the value of a journal as an advertising venue. However, a
5% drop in subscriptions would not translate into a commensurate drop in advertising revenue. If the
risk model indicates a drop in the number of subscriptions greater than 20%, a society might adjust the
43 For an explanation of the CC-BY license, and other Creative Commons licenses, see http://creativecommons.org/licenses/.
25 B1 Assessing Open Archiving Mandates v1-2 | Chain Bridge Group
revenue threshold to account for an anticipated loss of advertising revenue. However, a loss of
subscriptions on such a scale would likely require a major revision to the journal’s income model in any
event.
4.2.4 Pay-per-View Fees
Pay-per-view (PPV) revenue often represents less than 1% of a journal’s overall revenue. PPV
transactions might be expected to decrease for openly archived articles, although the substitution would
be inhibited by the same imperfect market information affecting rights and permissions revenue. At the
same time, PPV transactions might be expected to grow in the event of substitution-driven journal
cancellations, as former subscribers seek access to the non-open content. Given the potential for the
effects of open archiving on PPV demand to offset each other, coupled with the immaterial amount of
revenue typically at stake, the model does not assume any incremental loss in PPV revenue due to open
archiving.

26 B1 Assessing Open Archiving Mandates v1-2 | Chain Bridge Group
5—JOURNAL ATTRIBUTES & SUBSTITUTION RISK FACTORS
5.1 Journal Attributes & Substitution Risk
As already discussed, the openly archived version of an article will rarely afford a perfect substitute for
the published version. The journal attributes described below affect the perceived value of openly
archived content as a substitute for a subscription to the published journal. Subscribers on the margin—
that is, with low demand relative to price44—will be more open to imperfect substitutes for a journal.
Therefore, to estimate the potential effect of mandate policies on a journal’s value to subscribers (and,
ultimately on a journal’s revenue) requires that we determine the extent to which openly archived content
provides a substitute for the journal itself, taking into account all the principal factors that affect such
substitution.
For any given institutional subscriber, the decision to acquire or retain a subscription involves a number
of evaluative criteria that determine a journal’s relative value to the institution. These factors typically
include:
� relevance to an institution’s core academic programs and curriculum (including maintaining a
balance between disciplines at an institution, supporting new programs, etc.);
� level of local use (as measured by online use, re-shelving statistics, etc.) relative to other resources
serving the same programs;
� faculty feedback on a title, including local faculty involvement with a journal as authors and editors;
� cost relative to local importance and use, and relative to other titles in a subject area;
� the availability of substitutes in other formats (for example, via aggregated databases, pay-per-view,
consortia sharing, inter-library loan, etc.);45
� the currency of the content, including how frequently it is updated; and
� journal quality and publisher authority, with publications from professional associations and journals
with high Impact Factors, sometimes favored over other journals.
Cancellation decisions are also affected by local budget exigencies and other environmental factors.
Further, substitution risk can vary by market segment, requiring a journal with a significant proportion of
non-academic subscribers (such as corporate or special libraries) to assess the demand of those segments
independently.
Libraries vary in how carefully and empirically they weigh the above criteria, including local usage and
the percentage of content available openly. Necessarily, the substitution assessment described here
assumes that libraries analyze the amount of content openly available and make cancellation decisions
accordingly. However, in practice, such analyses can prove difficult and resource intensive.46 As a result,
the substitution model may overstate the risk of substitution.
44 Technically speaking, subscribers with a low consumer surplus for a journal at the subscribed price. 45 In some disciplines—for example, visually oriented disciplines—there may still be demand for a print edition that would prevent
a library from cancelling in favor of an online-only substitute. In reality, however, the journals most likely to experience a
continuing demand for a print edition are unlikely to be significantly affected by mandates. Therefore, the risk model does not
include demand for a print edition as a substitution risk factor. 46 For several perspectives on library behavior in the face of openly archived alternatives, see the discussion on the GOAL listserv on
September 16, 2013 and digested in Lib-License on September 17, 2013, especially the contributions by Rick Anderson of the
University of Utah Library and Ellen Duranceau of the MIT Libraries.

27 B1 Assessing Open Archiving Mandates v1-2 | Chain Bridge Group
Although a journal’s relevance to an institution’s research and teaching focus represents the preeminent
subscription acquisition/retention criterion, it is not practicable to take into account institution-specific
criteria in assessing the potential substitution risk across all subscribers. However, the risk model uses the
following factors to determine the likelihood that, on average, mandate-compliant content would provide
an effective substitute for the published journal and result in a marginal reduction in a journal’s value:
� percentage of a journal’s overall content that funded research articles represent;
� rates of author compliance with mandate deposit requirements;
� online usage relative to the timeframe of the embargo;
� the version of the content archived; and
� ease of discoverability and access to the archived content.
The first three attributes are quantitative and can be said to describe the extent of a journal’s content
exposed to substitution. The remaining attributes are qualitative and serve to mitigate the substitution
effect of the exposed content. The substitution risk factors are independent of one another. That is, the
occurrence of one factor does not influence the occurrence of another.
In estimating the substitution risk, the model does not consider journal attributes over which a society
could exercise control. These include attributes that the publisher could modify to minimize or eliminate
risk, such as the journal’s subscription price or the price of a pay-per-view option. Additionally, although
a journal’s price and value represent important preference factors in acquisition/cancellation decisions,
the model takes these factors into account by using a journal’s price elasticity of demand (see §6) to
estimate the impact of a marginal reduction in value on a journal’s subscriptions and revenue.
The risk model takes each of the factors above into account to determine the probability that mandate-
compliant openly archived content would substitute for a published journal, potentially resulting in
journal cancellations and reduced revenue. Because the journal attributes are independent of each other,
the substitution risk can be calculated by multiplying the probability of each of the factors.
The model requires that a publisher define a range of values for each factor that represents a 90%
confidence interval. To facilitate this assessment, we have described each of the principal risk factors in
more detail below. Section 8 provides sample value ranges for each variable, along with the rationale
behind the assumptions. These probability assumptions can be modified to reflect the particular situation
of any given journal.
5.2 Percentage of Research Content Affected
The percentage of a journal’s content that results from research funded under an open-access mandate is
an obvious factor in assessing the potential risk of substitution for the published journal. Indeed, along
with embargo length, it is often one of the only factors a publisher might consider in a casual assessment
of risk. At the same time, a 2006 library survey indicated that librarians place less weight on the amount
of freely archived content than other factors (such as quality, cost, article version, access, etc.) when
weighing substitution alternatives, with only 12% of librarians considering it the principal
consideration.47
For some journals, non-research content represents an important element of the journal’s value.
Therefore, in assessing the percentage of content that funded research represents, a publisher should
47 Beckett and Inger 2006.

28 B1 Assessing Open Archiving Mandates v1-2 | Chain Bridge Group
measure the funded content against all of a journal’s content—including editorials, letters, reviews, and
other non-research content—not only relative to other research content.48
Additional detail on determining the percentage of research content is provided in §8.4.
5.3 Deposit Compliance Rate
The compliance rate for a relevant mandate represents another quantitative factor that affects the amount
of content available to serve as a substitute for the journal. Compliance rates for funder mandates will
tend to be higher when the publisher manages the content deposit. Although responsibility for
compliance typically resides with the author, some large publishers provide mandate compliance support
as a service for authors. Presumably, where a publisher deposits on behalf of its authors, the compliance
rate will be near 100%.
Additional detail on determining the deposit compliance rate for modeling purposes is provided in §8.5.
5.4 Use Outside Embargo Period
The length of the embargo period allowed by a funder mandate often plays a disproportionate role in
casual assessments of substitution risk. However, as discussed above, embargo length is just one element
of a complex cancellation decision for institutional subscribers. One-dimensional assessments that
artificially isolate embargo length as a risk factor are likely to under- or overstate risk.49
Although an embargo ostensibly precludes access to content for a specified period, not all of the use
occurs within the embargo timeframe. In reality, therefore, there are two components to the perception of
content currency: 1) the nominal length of the embargo itself, and 2) the actual amount of use that the
content receives within the embargo period. The nominal length of the embargo affects a subscriber’s
perception of the currency of a journal’s content, while the proportion of use that the content receives
within the embargo period more accurately reflects the actual value that a subscriber derives from the
journal during the embargo period.
For example, a subscriber might perceive a 12-month embargo as being too long for self-archived articles
to serve as effective substitutes for a subscription. However, if most of the use of the content actually
occurs after the embargo period ends, then the extent to which an embargo decreases substitutability may
be less than the nominal length of the embargo might imply. Therefore, the journal’s use outside the
embargo period represents the extent to which the content might substitute for the content in the
published journal. For example, if a journal’s content receives, on average, 35% of its use within the
embargo window, then the value of the content given the embargo would be 65% of the value of the
published journal.
This discrepancy between the stated embargo length and its actual effect complicates an effort to estimate
an embargo’s substitution impact, as some subscribers will act based on the nominal embargo duration,
while others will base their decisions on an analysis of a journal’s local use patterns. Given the increasing
reliance of institutional libraries on local usage data in making acquisition and renewal decisions, the
48 Further, the risk assessment model projects the change in the number of subscriptions based on the price elasticity of demand for
the journal, and that elasticity is predicated on all of the journal’s current content. 49 Such as the survey sponsored by ALPSP and the Publishers’ Association (Bennett 2012), which asked “Would you continue to
subscribe were most of a journal’s content freely available within six months of publication?” See also Davis 2012. The PEER project
(www.peerproject.eu) also found that embargoes of 6, 12, and 18 months had little effect on demand for the published journal.
However, the design of the PEER study makes it difficult to generalize from that study’s findings. See
http://www.peerproject.eu/fileadmin/media/reports/20120618_PEER_Final_public_report_D9-13.pdf and
http://www.peerproject.eu/reports/#c20.

29 B1 Assessing Open Archiving Mandates v1-2 | Chain Bridge Group
conservative approach is to assume that libraries will evaluate substitution based on actual use, and a
journal’s average use across all institutions should provide a serviceable proxy for local use.
The content’s use within the embargo timeframe might seem to be a dependent variable. That is, use of
the journal might seem correlated to the other substitution factors (such as accessibility) in that a readily
accessible journal might be expected to receive more use than a less accessible journal. While that would
be true for the overall volume of use of the journal, the use of the journal within the embargo timeframe
measures the distribution of the journal’s use, irrespective of the overall volume of use. That distribution
of use is an independent variable.
Additional detail on determining a journal’s use relative to the stated embargo period is provided in §8.6.
5.5 Deposited Version
The universal use of web-based discovery and retrieval tools tends to obscure the provenance of content,
which can increase the extent to which preprints of an article may serve as substitutes for the published
version of record. The major funder mandates require deposit of the author’s submitted version of an
article, incorporating any peer review changes, but prior to final copyediting and publisher formatting.
Few mandates appear to consider the author’s original submitted manuscript to be adequate or, at the
other extreme, to require the publisher’s final version.
Studies of the manner and extent to which the final published version of an article differs from the
author’s corrected manuscript indicate that there are real differences between the author’s refereed, but
not copy edited, manuscript and the publisher’s final version.50 The integrity of references appears to be
the principal improvement added to the published version,51 and copyediting now appears to have as
much to do with the accuracy of XML tagging as with sense and consistency of style. However, these
improvements are not always sufficient to affect the value perception of end users.
Additional information on determining the substitution probability range for various article version is
provided in §8.7.
5.6 Discoverability & Access
Another factor affecting the extent to which an openly archived article might serve as a substitute for the
published version is the ease with which an article can be discovered, retrieved, and used. The reliability
with which self-archived content can be discovered and retrieved depends on the quality of the metadata
associated with the content and the repository in which it is deposited. As discussed in §2, funder
mandates differ on where articles are to be archived. Some require deposit in a specific digital
repository—such as the NIH’s public access policy, stipulating deposit in PubMed Central—while others
allow deposit in any complying institutional repository.
The quality of the metadata associated with the content archived in these repositories can vary
considerably. Some repositories have specific requirements for metadata, while others simply allow for
voluntary, author-assigned metadata. Further, some repositories allow full-text indexing by
Google/Google Scholar and web-scale library discovery services (such as Serials Solutions Summon and
XLibris Primo), while others do not. As a result, self-archived content known to reside in a repository
with policies that promote reliable access will provide a better substitute for the organization and
coherence afforded by the published journal than content for which the reliability of discovery and access
are uncertain.
50 Wates and Campbell 2007; Goodman et al. 2007. 51 Representing approximately 43% of copy editing changes according to Wates and Campbell 2007.
30 B1 Assessing Open Archiving Mandates v1-2 | Chain Bridge Group
Additional detail on determining the substitution probability range based on reliability of access is
provided in §8.8.
5.7 Other Journal Attributes
There are several other journal attributes that might seem relevant in assessing the potential for openly
archived content to substitute for a published journal. As described below, some of these factors are
already subsumed under one of the attributes described above, while others are within a publisher’s
control, and have therefore been excluded from the risk model.
5.7.1 Content Quality & Value
Not surprisingly, librarians report that content quality is the most important preference factor in
acquisition/cancellation decisions.52 However, the intellectual quality of the content in an article is
essentially the same whether the content is openly archived or available through the published journal.
Therefore, quality does not affect the substitution of an archived article for a published journal. To the
extent that the content does differ—for example, an author’s manuscript prior to peer review versus the
published article—that difference is covered by the Deposited Version attribute (see §5.5).
Of course, cancellation decisions are made relative to other journals (and other priorities), and journal
quality plays a critical consideration in such decisions. Subscribers with low demand relative to price
(that is, with a lower consumer surplus) will typically be more open to imperfect substitutes for a low-
quality journal than for a high-quality title. However, the risk model takes relative consumer surplus into
account by using a journal’s price elasticity of demand (see §6) as a mechanism for translating a relative
drop in demand into a quantifiable decrease in subscriptions. Therefore, the risk model does not treat a
journal’s quality and value as independent variables.
5.7.2 Functionality
Dissimilarities in platform functionality can also differentiate the published content from self-archived
versions. Access via the publisher’s platform often provides CrossRef-enabled reference linking,
advanced search functionality, dynamic content alerting, multimedia and interactive article elements, and
support for mobile devices. The absence of this functionality could reduce the extent to which the
archived version would provide an acceptable substitute for the published journal. At the same time, the
value subscribers perceive in the publisher platforms appears to be decreasing with time. In some cases,
this has been accelerated by the use of web-scale library discovery services, which allow users to
download content PDFs without interacting with a publisher’s platform, thus discounting the value of
publisher-provided tools and platform features. As a result, the model does not treat platform
functionality as a discrete variable.
5.7.3 Cited Half Life
Cited half-life is a measure of how long a journal article continues to be cited after publication. Cited half-
life is calculated as the median age of the articles in a journal that were cited in a given year of the Journal
Citation Report.53 In other words, half of the journal's cited articles were published more recently than the
cited half-life.
An exceptionally short cited half-life may reflect a journal that focuses on the rapid communication of
current information and for which content currency is especially valued. However, a long cited half-life
does not necessarily mean that the currency of a journal’s content is not valued; rather, that the content’s
52 Beckett and Inger 2005. 53 See http://admin-apps.webofknowledge.com/JCR/help/h_ctdhl.htm.

31 B1 Assessing Open Archiving Mandates v1-2 | Chain Bridge Group
usefulness or popularity remains steady over time. Therefore, we have used online usage within the
embargo period (see §5.4) as a more accurate indicator of the value placed on currency.
5.7.4 Pay-per-View Access
The availability of a journal’s content on a
pay-per-view (PPV) basis provides a
substitute for the journal for institutions
that cannot justify or afford a subscription
to the journal itself. However, because a
publisher can control the per-view pricing
for its journals—for example, by
increasing the PPV price for its content to
a level that effectively precludes
substitution—PPV does not constitute a
relevant factor for assessing the potential
for subscription substitution.
5.8 Risk Factor Summary
Taken together, the substitution variables
described above help predict the
likelihood that funder mandated openly
archived content would substitute for a
published journal. The results for the
individual variables can be summarized in a risk register, as illustrated in Exhibit 5-5 for a hypothetical
journal.
The following sections describe how the substitution probability ranges summarized in a risk register can
be translated into a quantifiable impact on the number of institutional subscriptions and a probability
distribution established using a Monte Carlo simulation.
Exhibit 5-5: Hypothetical Risk Register
Lower Bound Upper Bound
35% 40%
Lower Bound Upper Bound
60% 80%
Lower Bound Upper Bound
40% 50%
Lower Bound Upper Bound
45% 95%
Lower Bound Upper Bound
30% 80%
Mandate Risk Model/Risk Register
Percentage of Content Covered by Mandate(s), §8.3
Compliance Rate of Mandate(s), §8.4
Percentage of Use Outside Embargo Timeframe, §8.5
Archived Version Substitutability, §8.6
Access Substitutability, §8.7

32 B1 Assessing Open Archiving Mandates v1-2 | Chain Bridge Group
6—ASSESSING THE IMPACT OF SUBSTITUTION
6.1 Translating Substitution Risk into Financial Impact
The substitution risk equation—based on the five journal attributes described in §5—measures the extent
to which the journal’s marginal utility or value declines for the average subscriber. In practice, however, a
subscriber would not have the option of paying a lower subscription price for a journal were the value to
decrease. Typically, a subscriber’s only option would be to either retain the subscription at the current
price, despite the relative reduction in value, or cancel the subscription entirely and forgo all the non-
funded content.54
Assessing the financial impact of partial substitution requires that a publisher: 1) quantify any decline in
value in terms of the number of potential subscription cancellations, and 2) estimate the average value of
a cancelled subscription. The first, translating a decline in value into subscription cancellations, needs to
take into account that subscribers will have different levels of consumer surplus for a journal; that is,
some subscribers will place a higher value on a journal relative to its price than others. The model uses a
journal’s price elasticity of demand to translate a decrease in value into a decline in subscription units.
The decline in subscription units is then multiplied by the average price of a cancelled subscription.
6.2 Price Elasticity of Demand
The risk model allows a publisher to assess the extent to which self-archived content might substitute for
the published journal, thus marginally reducing the value of the journal relative to the price paid by
subscribers. However, this marginal reduction in value would not invariably translate into subscription
cancellations, as some or all of the institutions subscribing to a journal would be willing to pay more than
they are currently paying.55
The market price of a journal is different from the journal’s economic value to subscribers: a journal’s
price only reflects the minimum amount that an institution is willing to pay, while a journal’s value is the
highest price an institution would be willing to pay. Institutions for which a journal’s value exceeds the
price actually paid—that is, in economic terms, institutions that enjoy a “consumer surplus”—would
retain their subscriptions despite a relative drop in value.
Determining the extent of this consumer surplus for each of the subscribers to a journal—in order to
estimate how much value could be reduced relative to price before triggering cancellations—would be
difficult to determine cost effectively. Therefore, the model requires a means by which to measure the
potential effect a marginal decrease in value might have on a journal’s revenue. For this purpose, the
model uses a journal’s price elasticity of demand.56
Elasticity measures how responsive quantity demanded is to a change in price. Specifically, elasticity
measures the change in quantity demanded, in percentage terms, relative to the size of a price change,
also in percentage terms. Demand for a journal is said to be elastic when the change in quantity
demanded is greater than the percentage change in price that caused it, and inelastic when the percentage
change in quantity demanded is less than the percentage change in price.
If demand for a journal is elastic—that is, if the market is sensitive to a decline in value relative to price—
then the decrease in value due to substitution would result in a higher number of subscription
54 Although institutions would likely seek access to the cancelled content via other routes (including PPV and ILL), that substitution
lies beyond the specific substitution effects and revenue impact of funder mandates. 55 That is, absent perfect price discrimination, whereby a journal’s pricing would reflect the actual value for each subscribing
institution, some subscribers would be willing to pay more than the journal’s current price. 56 For convenience, we sometimes refer to the price elasticity of demand as price elasticity, demand elasticity, or elasticity.

33 B1 Assessing Open Archiving Mandates v1-2 | Chain Bridge Group
cancellations. If the demand for the journal is relatively inelastic, then the effect of substitution on
subscription cancellations would be lower.
Elasticity is typically used to predict the effect on revenue given a potential change in price. For the
purposes of our model, we can consider the change in a journal’s perceived value, due to the availability
of openly archived content as a substitute, to be functionally equivalent to an increase in price. That is,
from a subscriber’s perspective, a reduction in a journal’s value of 10% would be effectively the same as
an increase in price of 10%. Thus, the model uses a journal’s price elasticity to predict the change in
demand for subscriptions given a probable change in value. This can be expressed simply as:
Substitution % * Elasticity = % Change in Quantity
We describe below (see §8.8) how a journal’s price elasticity of demand is calculated. However, it is
important to recognize that factors other than price affect demand for a journal. The law of demand states
that, other things equal, an increase in price results in a decrease in quantity demanded and a decrease in
price results in an increase in quantity demanded. Here, “other things equal” means that determinants of
demand other than price—including the size of library budgets, institutional preferences, significant
changes in the scale or scope of the journal itself, a change in the importance of a field or discipline, and
the availability and prices of substitutes (including aggregated journal databases and self-archived
content)—remain the same along the demand curve. A shift in demand can occur when one or more of
the non-price factors changes.
For simplicity and practical necessity, the model assumes that subscription cancellations precipitated by
the availability of openly archived content can be isolated from cancellations for other reasons.57 In
reality, the factors cannot be easily separated. Although the resulting measurement is imperfect, it
represents a significant improvement over an intuitive approach.
6.3 Subscription Units Exposed
The model uses the substitution probabilities and price elasticity of demand to estimate the percentage of
exposed subscriptions that would be liable to substitution. This substitution percentage is then applied
against the number of institutional subscriptions to a journal. This requires that a publisher determine the
number of subscriptions actually exposed to potential substitution.
The model assumes that, in most cases, only individual institutional subscriptions to a journal will be
affected by substitution. Subscriptions included as part of a subscription bundle (including so-called “Big
Deals”), or included in an online aggregation (either the publisher’s own or a third-party’s), are not as
readily susceptible to substitution as primary subscriptions. Although a library could cancel a
subscription bundle in order to subscribe only to selected high-use titles, the cumulative price of the
individual titles can often exceed the price of the bundle (such discounts being the appeal of such
aggregations in the first place). Similarly, the model assumes that individual society membership would
not typically be affected as a journal only represents element of the benefits being delivered to a member.
Moreover, any substitution that might have taken place would have already occurred when members
gained online access to the journal via institutional site licenses.
57 Although the model uses a journal’s current price elasticity of demand to predict the effect that a change in value would have on
demand for subscriptions to the journal, in reality, the availability of openly archived articles would reduce demand for the journal
overall, independent of price. In the case of journals that have been publishing articles affected by funder mandates for some time,
the current elasticity should already reflect this shift in demand. For journals that have yet to publish articles under mandates, we
have had to ignore the potential effect of a future demand shift, as controlling for such a shift would require an impractical data
collection and analysis exercise.
34 B1 Assessing Open Archiving Mandates v1-2 | Chain Bridge Group
6.4 Average Revenue per Subscription
To determine the revenue impact of the substitution risk, the model multiplies the estimated number of
units that would be subject to substitution by the average amount of revenue that would be at risk for
each cancelled subscription. The simplest approach to determining average revenue at risk from
cancellation will typically be to calculate the weighted average subscription price across all subscribers.
This approach would also be conservative—that is, it would likely overstate the risk—as most of the
cancellations would come at the margins of the journal’s subscription base, from institutions that place
less value on the journal. Often, these subscribers will have access to the journal via a consortia offering
or tiered pricing that discounts a journal’s price in order to reach a larger audience. As a result, these
institutions at the margin will typically pay a lower average price than other subscribers.
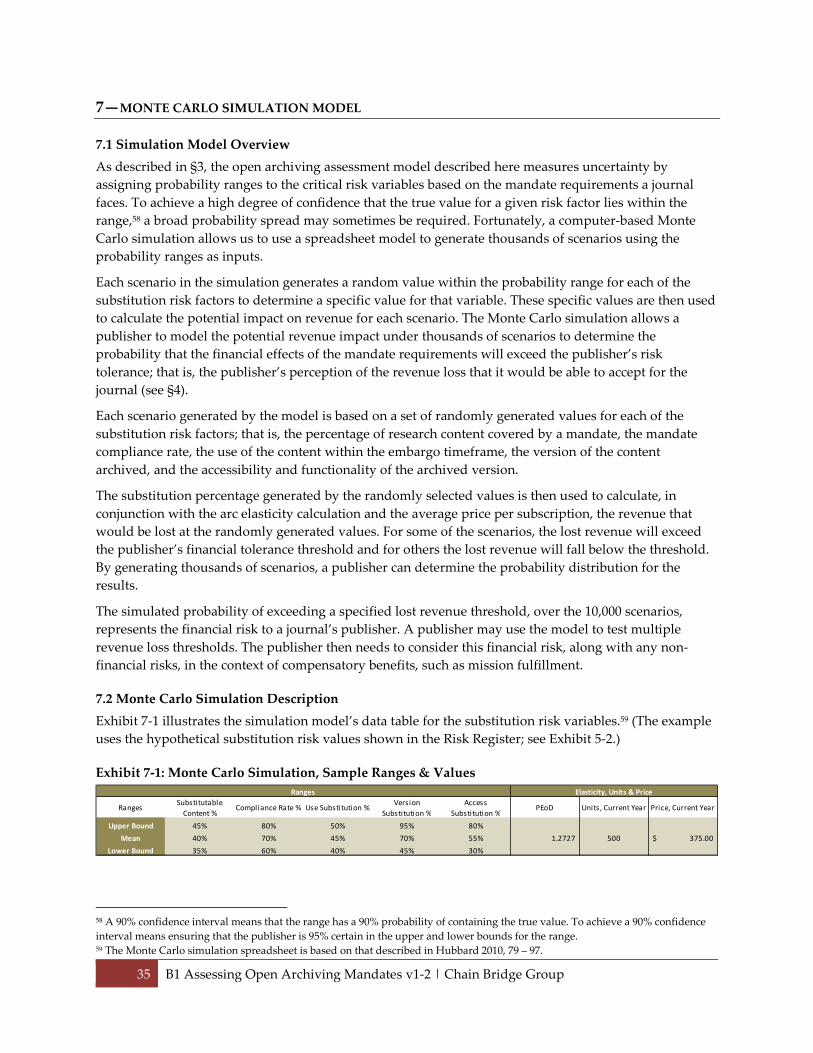
35 B1 Assessing Open Archiving Mandates v1-2 | Chain Bridge Group
7—MONTE CARLO SIMULATION MODEL
7.1 Simulation Model Overview
As described in §3, the open archiving assessment model described here measures uncertainty by
assigning probability ranges to the critical risk variables based on the mandate requirements a journal
faces. To achieve a high degree of confidence that the true value for a given risk factor lies within the
range,58 a broad probability spread may sometimes be required. Fortunately, a computer-based Monte
Carlo simulation allows us to use a spreadsheet model to generate thousands of scenarios using the
probability ranges as inputs.
Each scenario in the simulation generates a random value within the probability range for each of the
substitution risk factors to determine a specific value for that variable. These specific values are then used
to calculate the potential impact on revenue for each scenario. The Monte Carlo simulation allows a
publisher to model the potential revenue impact under thousands of scenarios to determine the
probability that the financial effects of the mandate requirements will exceed the publisher’s risk
tolerance; that is, the publisher’s perception of the revenue loss that it would be able to accept for the
journal (see §4).
Each scenario generated by the model is based on a set of randomly generated values for each of the
substitution risk factors; that is, the percentage of research content covered by a mandate, the mandate
compliance rate, the use of the content within the embargo timeframe, the version of the content
archived, and the accessibility and functionality of the archived version.
The substitution percentage generated by the randomly selected values is then used to calculate, in
conjunction with the arc elasticity calculation and the average price per subscription, the revenue that
would be lost at the randomly generated values. For some of the scenarios, the lost revenue will exceed
the publisher’s financial tolerance threshold and for others the lost revenue will fall below the threshold.
By generating thousands of scenarios, a publisher can determine the probability distribution for the
results.
The simulated probability of exceeding a specified lost revenue threshold, over the 10,000 scenarios,
represents the financial risk to a journal’s publisher. A publisher may use the model to test multiple
revenue loss thresholds. The publisher then needs to consider this financial risk, along with any non-
financial risks, in the context of compensatory benefits, such as mission fulfillment.
7.2 Monte Carlo Simulation Description
Exhibit 7-1 illustrates the simulation model’s data table for the substitution risk variables.59 (The example
uses the hypothetical substitution risk values shown in the Risk Register; see Exhibit 5-2.)
Exhibit 7-1: Monte Carlo Simulation, Sample Ranges & Values
58 A 90% confidence interval means that the range has a 90% probability of containing the true value. To achieve a 90% confidence
interval means ensuring that the publisher is 95% certain in the upper and lower bounds for the range. 59 The Monte Carlo simulation spreadsheet is based on that described in Hubbard 2010, 79 – 97.
RangesSubstitutable
Content %Compliance Rate % Use Substitution %
Version
Substitution %
Access
Substitution %PEoD Units, Current Year Price, Current Year
Upper Bound 45% 80% 50% 95% 80%
Mean 40% 70% 45% 70% 55% 1.2727 500 375.00$
Lower Bound 35% 60% 40% 45% 30%
Elasticity, Units & PriceRanges

36 B1 Assessing Open Archiving Mandates v1-2 | Chain Bridge Group
The exhibit summarizes the upper and lower bounds for the substitution risk variables in the simulation.
The mean is used in calculating the standard deviation for the normal distribution assumed for the
analysis. The elasticity (PEoD), as well as the subscription units and average revenue per primary
subscription for the current year (that is, the last full year) are used for calculating the revenue impact for
each of the generated substitution scenarios. As noted in §6.4, the number of subscription units should
only reflect direct subscriptions to a journal, excluding subscriptions in aggregations or subscription
bundles.
A publisher could estimate the logical extremes for the substitution risk by calculating the product of the
lower bounds for all of the variables and the product of the upper bounds for all of the variables.
However, this approach will typically yield too broad a range to allow a publisher to determine how best
to respond to the substitution risk.
7.2.1 Risk Variables
Exhibit 7-2 illustrates the first six (of 10,000) randomly generated scenarios based on the hypothetical
substitution risk variables. (The following descriptions apply to the “Monte Carlo” tab of the companion
Substitution Model workbook.)
Exhibit 7-2: Substitution Risk Scenario Examples, Monte Carlo Simulation
Exhibit 7-3 shows detail on the substitution risk columns (columns 2 – 6). These columns represent the
randomly generated values for each of the risk variables.
Exhibit 7-3: Substitution Risk, Monte Carlo Simulation
The random value for each variable is calculated by using the normal cumulative distribution for the
mean (i.e., the 90% Confidence Interval (CI) upper bound plus the 90% CI lower bound divided by two)
1 2 3 4 5 6 7 8 9 10 11 12
Scenario # Content % Compliance % Use % Version % Access % Substitution %
Adjusted
Substitution %
("Price Increase")
% Δ in Quantity Unit Δ in QuantityRevenue Decrease,
Year 1
Threshold
Exceeded
1 34% 73% 47% 88% 68% 6.89% 6.66% 8.47% 42.36 15,885$ 1
2 42% 75% 46% 86% 81% 9.95% 9.47% 12.06% 60.29 22,610$ 1
3 31% 71% 46% 84% 51% 4.39% 4.30% 5.47% 27.36 10,262$ -
4 44% 58% 42% 78% 18% 1.47% 1.46% 1.86% 9.29 3,484$ -
5 38% 62% 42% 66% 40% 2.55% 2.52% 3.21% 16.05 6,020$ -
6 39% 63% 45% 61% 39% 2.60% 2.57% 3.27% 16.35 6,132$ -
Scenarios
1 2 3 4 5 6
Scenario # Content % Compliance % Use % Version % Access %
1 34% 73% 47% 88% 68%
2 42% 75% 46% 86% 81%
3 31% 71% 46% 84% 51%
4 44% 58% 42% 78% 18%
5 38% 62% 42% 66% 40%
6 39% 63% 45% 61% 39%

37 B1 Assessing Open Archiving Mandates v1-2 | Chain Bridge Group
and standard distribution (i.e., the 90% CI upper bound less the 90% CI lower bound) divided by the 3.29
(the standard deviation in one 90% CI).60
Exhibit 7-4 shows detail on the calculated values (columns 7 – 12). The calculated values are described
below:
� Substitution percentage (column 7)—
The substitution percentage represents the product of each of the risk variables (columns 2 – 6). That
is:
Compliance % * Content % * Use % * Version % * Access % = Substitution %
Exhibit 7-4: Substitution Risk, Monte Carlo Simulation
� Adjusted substitution percentage (column 8)—
The model uses the arc price elasticity of demand, taking into account the average elasticity for the
part of the demand curve represented by the data (see §6), as the basis for calculating a change in
units demanded. As a result, the Substitution Percentage needs to be adjusted to reflect the arc price
for the journal. Appendix F explains this adjustment.
� Percentage change in quantity (column 9)—
The percentage change in quantity is calculated by multiplying the journal’s price elasticity of
demand by the adjusted substitution percentage. For example, an adjusted substitution percentage of
6.66% and an elasticity of 1.2727 would yield a percentage change in subscription quantity of 8.47%.
� Unit change in quantity (column 10)—
The unit change in quantity is calculated by multiplying the current subscription base (in units) by
the percentage change in quantity. For example, 500 units and a percentage change in quantity of
8.47% would result in a change in quantity of 42.36 units.
� Decrease in revenue, Year 161 (column 11)—
The decrease in revenue due to mandate-driven substitution is calculated by multiplying the current
subscription price by the unit change in quantity. For example, in the first scenario, 42.36 units and an
average revenue per primary subscription of $375 would result in a decrease in Year 1 revenue of
60 The Excel formula is: =NORMINV(RAND(), (”90% CI Upper Bound” + “90% CI Lower Bound” / 2), (“90% CI Upper Bound” –
“90% CI Lower Bound” / 3.29). 61 Year 1 refers to the first year to which the analysis applies. Typically, the year following the current year.
7 8 9 10 11 12
Substitution %
Adjusted
Substitution %
("Price Increase")
% Δ in Quantity Unit Δ in QuantityRevenue Decrease,
Year 1
Threshold
Exceeded
6.89% 6.66% 8.47% 42.36 15,885$ 1
9.95% 9.47% 12.06% 60.29 22,610$ 1
4.39% 4.30% 5.47% 27.36 10,262$ -
1.47% 1.46% 1.86% 9.29 3,484$ -
2.55% 2.52% 3.21% 16.05 6,020$ -
2.60% 2.57% 3.27% 16.35 6,132$ -

38 B1 Assessing Open Archiving Mandates v1-2 | Chain Bridge Group
approximately $15,885. The model indicates the average decrease in revenue across all of the
scenarios; for example, the average decrease under the example variables would be approximately
$11,250 per year.
� Threshold Exceeded (column 12)—
The model compares the decrease in revenue for each scenario and compares it against the
publisher’s financial tolerance threshold. If the threshold is exceeded, the model returns a “1.”
The model uses the results of column 12 to calculate the percentage of scenarios that exceed the threshold,
as shown in the hypothetical example illustrated in Exhibit 7-5. In the example, the probability of
exceeding the publisher’s stated risk threshold, given the variable values, is 41%. (The model also
indicates the average forgone subscription revenue given a particular set of assumptions.) We provide
case studies, based on anonymized data provided by three society publishers, in §9.
Exhibit 7-5: Substitution Simulation, Example Summary Results
7.2.2 Probability Distribution
The model calculates the percentage of scenarios that exceed the threshold, which represents the
probability of exceeding the publisher’s stated risk threshold given the variable values. Besides the
average across all of the scenarios, another way of looking at the probability of a journal exceeding the
publisher’s risk threshold is to create a histogram that that counts the number of scenarios that fall within
specified increments. Appendix G provides an example of such a histogram, and the simulation tool in
the companion worksheet automatically generates one. A histogram provides a more nuanced
perspective of the risk probability and can be useful in presenting the potential outcomes to stakeholders
within a society.
The histogram sorts scenarios into thousand dollar increments or bins. The histogram data can then be
used to generate a chart, such as the one in Exhibit 7-6. A histogram provides a more nuanced perspective
of the risk probability and can be useful in presenting the potential outcomes to stakeholders within a
society.
$11,719
41%
59%
Publisher's average annual risk threshold for the journal. Model assesses probability that revenue
risk will exceed the threshold.
The probability that the revenue loss will exceed the annual revenue threshold.
The chance that the revenue loss will not exceed the risk threshold.

39 B1 Assessing Open Archiving Mandates v1-2 | Chain Bridge Group
Exhibit 7-6: Example Histogram
0
200
400
600
800
1000
1200
1 3 5 7 9 11 13 15 17 19 21 23 25 27 29 31 33 35 37 39 41 43 45 47 49 51 53 55 57 59 61
Nu
mb
er
of
sce
na
rio
s p
er
incr
em
en
t
Revenue Decrease ($000 bins)

40 B1 Assessing Open Archiving Mandates v1-2 | Chain Bridge Group
PART THREE
8—GUIDE TO USING THE SUBSTITUTION ASSESSMENT MODEL
8.1 Guide Introduction
This section provides a step-by-step guide to applying the mandate substitution risk assessment model,
including suggestions on assembling and preparing the journal data required. The descriptions below
refer back to the relevant sections in the report that provide background and context for the data or
analysis being described, and to the relevant models and templates in the companion Excel-based
simulation model.
8.2 Establishing a Risk Threshold
A society’s tolerance of risk—stated as a dollar amount—provides the basis against which the open
archiving assessment model tests the financial impact of funder mandate requirements. (See §4.1.) The
risk model compares the outcome of thousands of scenarios against the financial risk threshold
established by the publisher, and calculates the probability of exceeding that threshold. Therefore,
determining how much financial risk a publisher is willing and able to accept represents a critical
component of the analysis.
There are two principal steps to establishing a society’s risk threshold: 1) calculating a baseline for a
journal’s current financial performance (for example, based on net income or net revenue contribution),
and 2) determining the extent of a change in the journal’s current financial performance that the society
could realistically accommodate, taking into account the society’s overall financial position. The second
step may result in the society identifying several alternative financial risk tolerance scenarios that it wants
to test.
For modeling purposes, the revenue risk threshold should take into account the incremental loss a society
is able and willing to tolerate excluding any losses that would be incurred independently of the
mandate’s implications (for example, from current cancellation trends).
8.2.1 Defining a Performance Baseline
For modeling purposes, the revenue risk threshold should take into account the incremental loss a society
is able and willing to tolerate excluding any losses that would be incurred independently of the
mandate’s implications (for example, from current cancellation trends). As described in §4.2, the effect on
non-subscription revenue will typically be limited. Therefore, the description here focuses on the net
change in subscription revenue. The process also requires that the revenue be adjusted to reflect variable
costs, as failing to do so would overstate the net financial impact of revenue lost to substitution.
We describe below how to calculate a risk threshold based on a journal breaking even in terms of net
income (that is, gross revenue less all direct and indirect expenses). This approach requires a caution:
Allocating indirect costs (including overhead and other shared costs) across a society’s journal(s) and
other programs invariably relies on some logic extraneous to the activities of the individual programs
themselves.62 As a result, overhead allocations are inherently arbitrary. At the same time, such allocations
reflect a society’s current financial expectations of a journal vis-à-vis other society programs. Therefore,
62 For example, general operating and overhead cost allocations are often allocated based on the revenue an activity generates (e.g.,
an activity that produces 25% of the organization’s revenue is allocated a quarter of the general operating costs) or proportional to
the direct costs that the activity incurs. Although these allocation approaches are appropriate from a financial accounting
perspective, they are less useful for establishing a society’s risk threshold for a journal. For societies, balancing both revenue-
generating and subsidized programs, overhead cost allocations typically reflect political or policy decisions as well.

41 B1 Assessing Open Archiving Mandates v1-2 | Chain Bridge Group
calculating the change in a journal’s net income provides a logical starting point in assessing financial
tolerance. A society might subsequently consider shifting resources and/or rebalancing program costs
and resources.
Alternatively, a society could calculate the net revenue a journal contributes to shared operating costs—
that is, the revenue a journal contributes to a society’s finances before indirect costs are taken into
account—to provide a financial baseline. Some societies will consider this approach preferable, as it
effectively isolates the financial performance of the journal. For a description of net revenue contribution
and related concepts, see Appendix A.
8.2.2 Establishing a Risk Threshold
As the first step in establishing a risk threshold, the society needs to determine how much of a change in
net income it would be able to absorb. This calculation will depend on a variety of factors, typically
including how much net income the journal currently contributes, the amount of surplus revenue (if any)
generated by other journals or programs, and the availability of cross-subsidies from other society income
streams (including member dues, endowments, dedicated publication funds, etc.).
After determining the annual change in net income that it would be able and willing to absorb, a society
needs to translate this change in net income into a change in top-line (gross) subscription revenue.
Translating a society’s tolerance for a change in net income into gross revenue is simply a matter of
dividing the net income amount by the journal’s contribution margin for subscription revenue.63 For
example, if a society determined that it could absorb a loss to net income of $10,000 a year for a journal
with a contribution margin of 80%, the revenue risk threshold would be $12,500 (i.e., $10,000/0.80).
Appendix B illustrates a worksheet (see the “Threshold” tab in the Substitution Model workbook) that a
publisher can use to determine the revenue threshold for modeling purposes.
In Tab 1, “Risk Threshold,” of the Substitution Model workbook, a publisher should enter the
revenue amount for the journal's primary subscriptions in Line a), the variable costs for those
subscriptions in Line b, and the total net income the publisher is able and willing to risk in
Line d). The values entered will yield the publisher’s revenue risk threshold for the journal and
this value will automatically populate Tab 8, “Data Input Summary” of the Substitution Model
workbook.
The model assesses the probability of exceeding the risk threshold in a single year. In reality, however, it
may take several years for the market to adjust to the availability of openly archived content as a
potential substitute. As a result, the revenue risk may not be as great in the years immediately following
the imposition of a mandate.
A society that publishes multiple journals will want to assess the substitution effect on each journal
individually, which will require setting separate financial thresholds. The society can then analyze the
combined financial implications across all the journals analyzed.
A society might conclude that it cannot tolerate any change in the net revenue generated by its publishing
program. In such a case, of course, the model will indicate a 100% probability of the journal’s risk
tolerance threshold being exceeded. Even so, it would still make sense for a society to run its journal
attributes through the open archiving assessment model to test the potential extent of a decrease in
63 Contribution margin as a percentage = (revenue – variable costs) / revenue. For example, a journal with $100,000 in revenue and
$20,000 in variable costs would have a contribution margin of 80% (100,000 – 20,000)/ 100,000. See also Appendix A.

42 B1 Assessing Open Archiving Mandates v1-2 | Chain Bridge Group
revenue. This would provide the society with better information with which to plan a response to the
changing market situation.
8.3 Journal Attributes
The journal attributes described in §5 affect the perceived value of openly archived content as a substitute
for a subscription to the published journal. The risk model uses the following factors to determine the
likelihood that mandate-compliant content would provide an effective substitute for the published
journal and result in a marginal reduction in a journal’s value:
� percentage of a journal’s overall content that funded research articles represent;
� rates of author compliance with mandate deposit requirements;
� online usage relative to the timeframe of the embargo;
� the version of the content archived; and
� ease of discoverability and access to the archived content.
The first three attributes describe the extent of a journal’s content exposed to substitution. The remaining
attributes mitigate the substitution effect of the exposed content.
The risk model takes each of the above factors into account to determine the probability that mandate-
compliant openly archived content would substitute for a published journal, potentially resulting in
journal cancellations and reduced revenue. Because the journal attributes are independent of each other,
the substitution risk is calculated by multiplying the probability of each of the factors.
The model requires that a publisher define a range of values for each factor that represents a 90%
confidence interval. To facilitate this assessment, we have provided below sample value ranges for each
variable, along with the rationale behind the assumptions. These probability assumptions can be
modified to reflect the particular situation of any given journal.
8.4 Percentage of Funded Research Content
Determining the percentage of a journal’s content published under a funder mandate should be relatively
straightforward. For journals that only publish original research articles, the proportion of funded-
research articles can be determined based on the average number of items that cite a relevant research
funder (typically, in the article’s acknowledgements). Given the potential for growth in federal, state, and
private funder mandates, it makes sense to track all funded research, even if not all of the funded
research is currently under a mandate, so that the potential implications of any future mandates can be
evaluated. For journals that include non-research content—which can differ in length from research
articles—the proportion of funded research content can be calculated based on average page counts.
To determine a 90% confidence interval for the percentage of a journal’s content represented by funded
articles—whatever the basis of comparison used—the publisher can analyze five issues of the journal
picked at random over a time period that reflects the current funding trends in the discipline. If the
sample is truly random, there is a 93.75% chance that the median value for the results for all the issues is
between the highest and lowest values in the sample. For example, were the five random issues to have
funded article percentages of 43%, 35%, 45%, 40%, and 37%, there is a 93.75% chance that the median
percentage for all of the journal’s issues would be between 35% and 45%.64
64 That is, the chance of selecting five issues that are either all above or all below the median is 3.125%, the equivalent of getting
heads five times in a row in a random coin flip. See Hubbard 2010, 30. Alternatively, a publisher might use the small sample

43 B1 Assessing Open Archiving Mandates v1-2 | Chain Bridge Group
In Tab 2, “Content Under Mandate,” of the Substitution Model workbook, a publisher should
enter the low and high bounds for the percentage of funded research content. The values
entered will automatically populate Tab 8, “Data Input Summary” of the Substitution Model
workbook.
Although non-research content needs to be taken into account, subscribers will often value original
research articles more highly than some other journal content. Therefore, journals that have a significant
proportion of non-research content—and have surveyed their readers as to the relative perceived value of
the content—may want to weight the content accordingly.
8.5 Deposit Compliance Rate
A publisher depositing on behalf of its authors should have empirical data regarding its author
compliance rate. Uncertainty in such circumstances should be low, and the 90% confidence range for the
compliance variable should thus be relatively narrow. Similarly, the compliance rate for a mandate of a
major research funder—especially if it requires deposit in a centralized repository—is more likely to be
published and readily available than the compliance rates when deposit in any conforming institutional
repository is acceptable.65 Access to published compliance rates will reduce (though not eliminate)
uncertainty on the part of a publisher, so that the range of values for the variable should be narrower
than for mandates with unpublished compliance rates.
Exhibit 8-1: Default Substitution Probability Ranges, Deposit Compliance
Exhibit 8-1 illustrates the substitution probability ranges for the compliance rate variable under several
sets of circumstances:
� A high compliance rate and high confidence in the quality of the compliance data—for example,
given publisher-managed deposit and journal-specific data;
� A moderate compliance rate and a moderate confidence in the compliance data—for example,
author-managed deposit and the availability of funder data on compliance across all authors, but not
specific to a given journal; and
� A low or unknown compliance rate—for example, deposit is scattered across multiple repositories
with undocumented compliance rates.
Some journals will be solely or predominantly affected by a mandate from a single funder. Others may
publish content covered under multiple mandates. In the latter case, to make the probability model as
accurate as possible, it may be necessary to adjust the amount of content covered by each mandate by the
compliance rate for that mandate. For example, a journal with 20% of its content subject to a mandate
technique described in §8.5 and Appendix D, in the context of determining the percentage of a journal’s use within an embargo
timeframe. 65 While deposit in a centralized repository (e.g., PMC) affects both accessibility and the compliance rate, the substitution effects are
logically independent of one another.
Mandate Risk Model/Compliance Rate
Low Substitutability Medium Substitutability High Substitutability
5 - 40% 30% - 75% 60% - 95%
High compliance/
High confidence
Moderate compliance/
Moderate confidenceLow or unknown compliance

44 B1 Assessing Open Archiving Mandates v1-2 | Chain Bridge Group
with a reported compliance rate of 75% and another 15% of its content covered by a mandate with 60%
compliance, would have 24% of its content exposed to substitution ((20% * 70%) + (15% * 60%) = 24%).66
In Tab 3, “Mandate Compliance Rate,” of the Substitution Model workbook, a publisher should
enter the low and high bounds for the percentage of funded authors complying with funder
mandates. The values entered will automatically populate Tab 8, “Data Input Summary” of the
Substitution Model workbook.
8.6 Use Outside Embargo Period
Most journals continue to receive use, albeit at a reduced level, for years after initial publication. To
estimate the average use within an embargo period requires the publisher to set an artificial timeframe
(for example, the first four years after publication) as the basis for the estimation. One justification for this
approach is that institutional libraries may be expected to place relatively greater value on near-term use
when making subscription retention decisions. Although imposing such an artificial timeframe reduces
the accuracy of usage as a variable in estimating the effect of an embargo, even an imperfect adjustment is
preferable to taking the nominal embargo length at face value.
Alternatively, a publisher can make an assumption about the proportion of lifetime use that occurs within
a given period after publication. For example, by assuming that 80% of a journal’s lifetime use occurs
within the first four years after publication, a publisher could adjust the proportion of use that occurs
within the embargo period to reflect the estimated lifetime usage. An example of such a calculation is
shown in Appendix C.
As the substitution risk is represented by the content’s use outside the embargo timeframe, the
substitution percentage equals the inverse of the use percentage. For example, if, on average, a journal
receives 35% of its first four years’ use within the embargo window, then the substitution risk would be
65%. That is, the value of the embargoed content would be 65% of the value of the same content available
immediately upon publication.
The greater the depth of usage data available, the higher a publisher’s confidence in the average use
calculation for a journal. In any event, many journals will be limited in terms of the usage data available
for such an analysis. For example, for a quarterly journal, a publisher would require at least four years’
worth of use data to get four samples (each issue would provide one sample), and less frequently
published journals would require five or more years’ of data to get at least four samples. The usage data
should be available from a society’s primary publishing partner or, in the case of self-published journals,
the journal’s platform or website host.
To compute a 90% confidence index for a small sample set, the publisher can use the t-statistic, which
assumes a broader distribution than the normal distribution for larger sample sizes. For example, using
this approach—which is described in Appendix C—four usage samples of 45%, 42%, 30%, and 37%
would yield a range of use within the embargo timeframe of 31% - 46% for a 90% confidence interval.
This would translate into a range of use outside the embargo timeframe of 54% - 69%.
66 Unless online use of the content differed—significantly and consistently—depending on the funder sponsoring the research, the
same usage percentage (see §5.4) would apply across the funded content.

45 B1 Assessing Open Archiving Mandates v1-2 | Chain Bridge Group
In Line a) of Tab 4, “Use Outside Embargo,” of the Substitution Model workbook, a publisher
should enter the percentage of a journal's estimated use within the first four years after
publication to provide a basis for estimating the percentage of use within an embargo
timeframe. In Line b) of Tab 4, a publisher should enter the low and high bounds for the
percentage of a journal's use within the embargo timeframe based on the average use data for
the journal. The values entered will automatically populate Tab 8, “Data Input Summary” of the
Substitution Model workbook.
8.7 Deposited Version
Institutional libraries state a strong preference for the peer-reviewed version of research articles over
unrefereed author manuscripts.67 However, as long as a paper has been through the peer review process,
additional refinements in the archived version of the article appear to have little effect on subscription
retention/cancellation decisions.68 Likewise, most individual researchers in the sciences and social
sciences consider pre-prints as important for their research, although pre-prints appear to be far less
important for research in the humanities.69 Publishers of journals in the humanities may expect the
substitutability of pre-prints for the published journal to be lower than for science and social science
journals.
Exhibit 8-2: Default Substitution Probability Ranges, Archived Version
The substitution risk probability boundaries shown in Exhibit 8-4 reflect this subscriber survey data. The
three substitutability levels reflect the logical range of article versions, although, as noted above, few
funder mandates would accept the unrefereed manuscript or require the final published version. As a
result, the medium range will be appropriate for most journals.
Although necessarily subjective, this scale aligns with article version preferences identified in researcher
and librarian surveys. One survey reports that respondents considered the final published version only
slightly more critical in subscription decisions—all other factors held equal—than the author’s refereed
and copyedited manuscript or the author’s refereed manuscript prior to copy editing. Only a small
percentage of respondents indicated that an author’s unrefereed manuscript would be acceptable.70
The probability ranges in the exhibit reflect this finding that a post-peer review version of an article will
frequently provide an acceptable substitute for the published version. The lower bounds are more
difficult to determine. As a result, in the absence of empirical evidence—for example, the availability of a
journal-specific survey—the proposed bounds for a 90% confidence interval have been set broadly. A
publisher may elect to modify these ranges based on journal-specific situations. For example, a journal for
which either copyediting or formatting is perceived by subscribers as especially important.
67 Beckett-Inger 2006, especially Figures 1 and 8. 68 This complements research that suggests that researchers prefer the published version when preparing a formal paper, but are
satisfied with the pre-publication version for general research purposes. See RIN 2009. 69 Housewright, Schonfeld, and Wulfson 2013, 14 – 15, Figure 1. 70 Beckett and Inger 2006, Figure 4.
Mandate Risk Model/Version
5 - 50% 40% - 80% 65% - 95%
Low Substitutability Medium Substitutability High Substitutability
Unrefereed Manuscript Refereed Author Manuscript Published Version
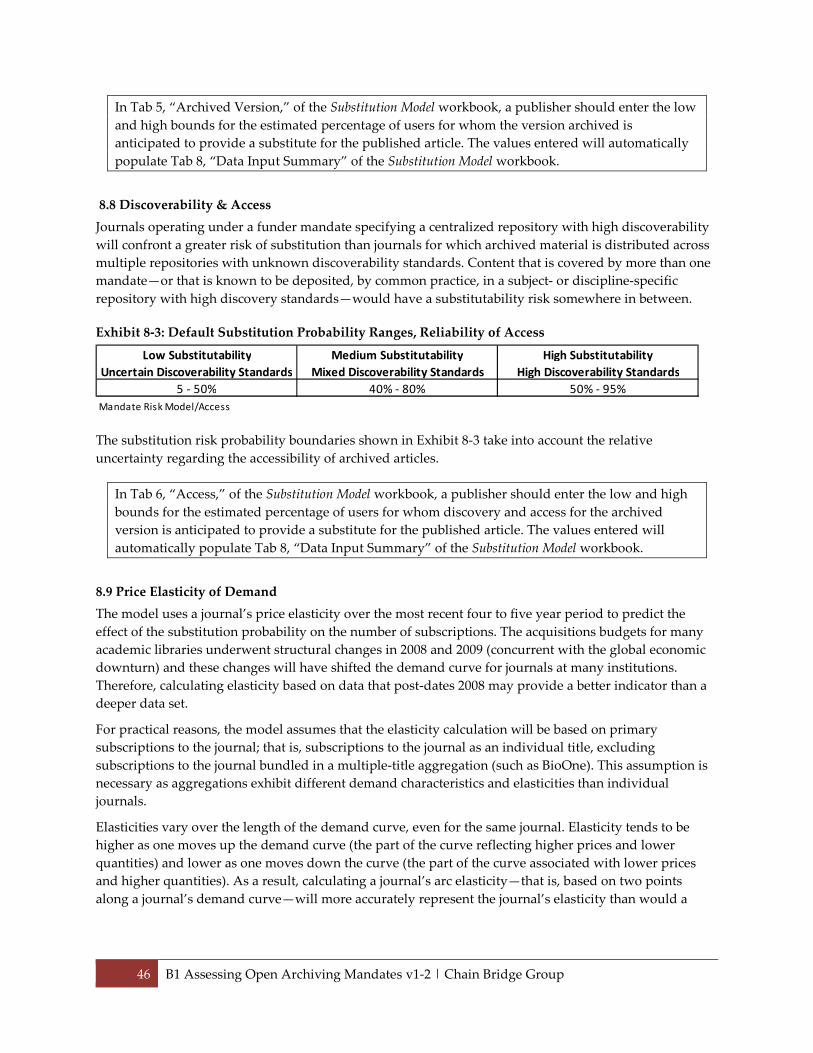
46 B1 Assessing Open Archiving Mandates v1-2 | Chain Bridge Group
In Tab 5, “Archived Version,” of the Substitution Model workbook, a publisher should enter the low
and high bounds for the estimated percentage of users for whom the version archived is
anticipated to provide a substitute for the published article. The values entered will automatically
populate Tab 8, “Data Input Summary” of the Substitution Model workbook.
8.8 Discoverability & Access
Journals operating under a funder mandate specifying a centralized repository with high discoverability
will confront a greater risk of substitution than journals for which archived material is distributed across
multiple repositories with unknown discoverability standards. Content that is covered by more than one
mandate—or that is known to be deposited, by common practice, in a subject- or discipline-specific
repository with high discovery standards—would have a substitutability risk somewhere in between.
Exhibit 8-3: Default Substitution Probability Ranges, Reliability of Access
The substitution risk probability boundaries shown in Exhibit 8-3 take into account the relative
uncertainty regarding the accessibility of archived articles.
In Tab 6, “Access,” of the Substitution Model workbook, a publisher should enter the low and high
bounds for the estimated percentage of users for whom discovery and access for the archived
version is anticipated to provide a substitute for the published article. The values entered will
automatically populate Tab 8, “Data Input Summary” of the Substitution Model workbook.
8.9 Price Elasticity of Demand
The model uses a journal’s price elasticity over the most recent four to five year period to predict the
effect of the substitution probability on the number of subscriptions. The acquisitions budgets for many
academic libraries underwent structural changes in 2008 and 2009 (concurrent with the global economic
downturn) and these changes will have shifted the demand curve for journals at many institutions.
Therefore, calculating elasticity based on data that post-dates 2008 may provide a better indicator than a
deeper data set.
For practical reasons, the model assumes that the elasticity calculation will be based on primary
subscriptions to the journal; that is, subscriptions to the journal as an individual title, excluding
subscriptions to the journal bundled in a multiple-title aggregation (such as BioOne). This assumption is
necessary as aggregations exhibit different demand characteristics and elasticities than individual
journals.
Elasticities vary over the length of the demand curve, even for the same journal. Elasticity tends to be
higher as one moves up the demand curve (the part of the curve reflecting higher prices and lower
quantities) and lower as one moves down the curve (the part of the curve associated with lower prices
and higher quantities). As a result, calculating a journal’s arc elasticity—that is, based on two points
along a journal’s demand curve—will more accurately represent the journal’s elasticity than would a
Mandate Risk Model/Access
5 - 50% 40% - 80% 50% - 95%
Low Substitutability Medium Substitutability High Substitutability
Uncertain Discoverability Standards Mixed Discoverability Standards High Discoverability Standards

47 B1 Assessing Open Archiving Mandates v1-2 | Chain Bridge Group
single point on the curve. Practically speaking, arc elasticity can be calculated by using an average of the
change in price and the quantity demanded.71
A journal’s elasticity of demand can be summarized by the following equation:
% Change in Quantity
% Change in Price
The formula for calculating the arc price elasticity of demand (PEoD) is:
PEoD = % Change in Quantity Demanded (QD) / % Change in Price (P), where:
the % Change in Quantity Demanded = (QD2 – QD1) / ((QD1 + QD2) / 2)
and the % Change in Price = (P2 – P1) / ((P1 + P2) / 2)
For example, if a journal price increase from $400 to $485 were to result in a drop from 800 to 700
subscriptions, the price elasticity of demand for the journal would be 0.6941. Exhibit 8-4 shows the detail
behind this example calculation.
Exhibit 8-4: Example Arc PEoD Calculation
The “Elasticity” tab of the companion Substitution Model workbook provides a template for calculating a
journal’s arc elasticity of demand.
To translate a change in value resulting from substitution into a change in the number of subscriptions
demanded, the model multiplies the substitution probability by the price elasticity. For example, a
journal with a risk profile indicating a substitution probability of 5.47% and an elasticity of 1.2727 would
be projected to have a decrease in subscriptions of 6.96% (i.e., 0.0547 * 1.2727).
Adjusting a Journal’s Price Elasticity of Demand
There are situations in which a publisher may need to adjust the elasticity calculation for a journal. These
include:
1) When a journal’s content has already been subject to funder mandates, but for a relatively short
period of time;
71 In the equations that follow, QD1 = the starting quantity demanded; QD2 = the new quantity demanded; P1 = the starting price; and
P2 = the new price.
P1 325.00$ QD1 600
P2 375.00$ QD2 500
Difference (50.00)$ Difference 100
Average P1 & P2 350.00$ Average QD1 & QD2 550
% Change Price -14.29% % Change Demand 18.18%
PEoD = -15.38%/10.53%
PEoD* = 1.2727
*Dropping the negative sign. Mandate Risk Model/Elasticity

48 B1 Assessing Open Archiving Mandates v1-2 | Chain Bridge Group
2) When extraneous market factors are known to have affected the quantity demanded for the journal
during the timeframe assessed; and
3) When the available price and subscription data for the journal yield an implausible result (that is,
there is not an inverse relationship between price and quantity demanded).
Appendix E describes how a publisher can adjust for the above contingencies.
A publisher can use the price elasticity template, provided in the “Elasticity” tab of the Substitution Model
workbook, to adjust a journal’s price elasticity. The resulting adjusted price elasticity calculation is linked
to the Data Input table (Substitution Model workbook, “Data Input” tab).
In Tab 7, "Elasticity," of the Substitution Model workbook, enter the journal's starting price in Line a)
and the journal's ending price in Line b); enter the journal's starting quantity of primary subscriptions
in Line c) and the journal's ending quantity of such subscriptions in Line d); and enter the estimated
percentage change in the quantity due to factors other than a price increase in Line e). The adjusted
elasticity will automatically populate Tab 8, “Data Input Summary” of the Substitution Model
workbook.
8.10 Exposed Subscription Units
The model uses the substitution probabilities and price elasticity of demand to estimate the percentage of
exposed subscriptions that would be liable to substitution. This substitution percentage is then applied
against the number of institutional subscriptions to a journal. This requires that the publisher determine
the number of subscriptions actually exposed to potential substitution.
As subscriptions included in irreducible bundles behave differently than other types of subscriptions—
for example, institutions cannot easily cancel an individual journal included in a bundle—for most
journals, only individual “primary” institutional subscriptions will be affected by substitution. Therefore,
subscriptions included as part of a multiple-journal bundle (including so-called “Big Deals”), or included
in an online aggregation (either the publisher’s own or a third-party’s) should not be counted in
determining the number of exposed subscriptions.
Although counting the actual number of subscriptions might sometimes be complicated by consortia
sales, most societies should be able to estimate the subscription base reasonably accurately.
The number of exposed primary subscriptions is pulled from Line b) of Tab 7, “Elasticity,” and
automatically populates Tab 8, “Data Input Summary” of the Substitution Model workbook.
8.11 Average Revenue per Subscription
To determine the impact of substitution on revenue requires that a publisher estimate the average
amount of revenue that would be at risk for each cancelled subscription. The simplest approach to
determining average revenue at risk from cancellation will typically be to calculate the average
subscription price across all primary subscribers (that is, excluding subscriptions to the journal in
multiple-title bundles and online aggregations).
Calculating the average subscription price is simply a matter of dividing the net primary subscription
revenue (after subscription agent discounts and commissions, etc.) by the number of primary
subscriptions. In practice, however, isolating primary subscriptions and revenue can be complicated.
Societies relying on revenue reports from publishing partners will need to ensure that primary
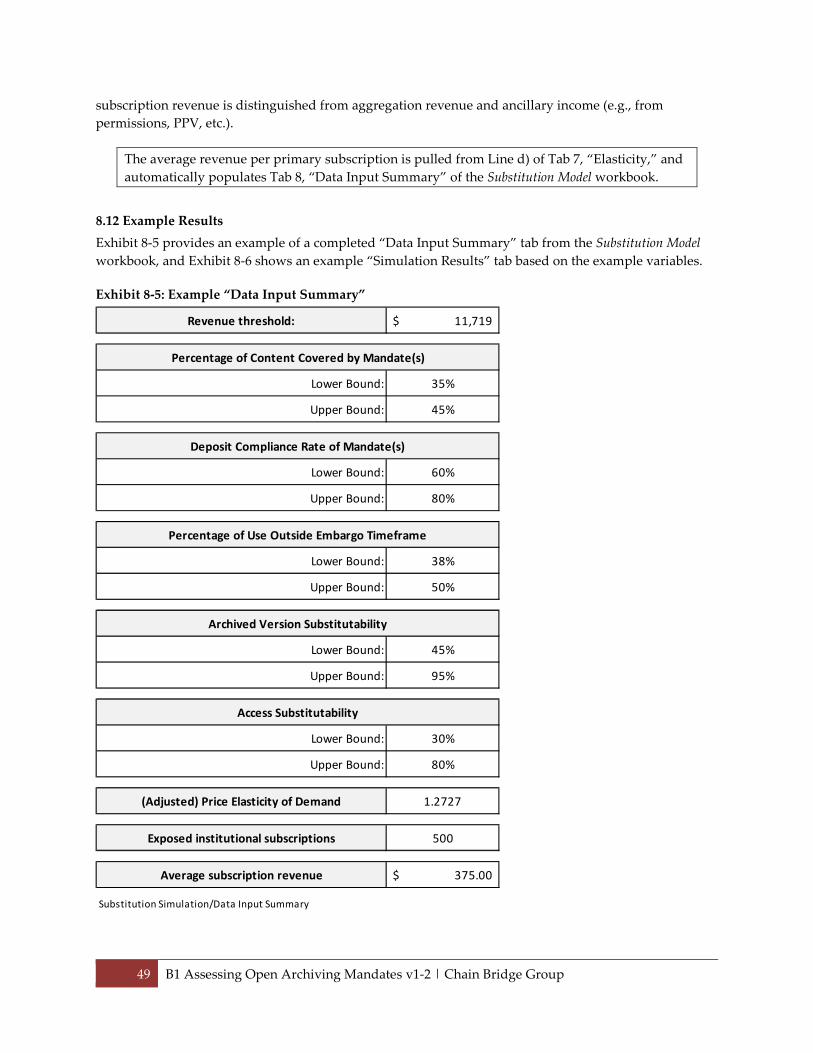
49 B1 Assessing Open Archiving Mandates v1-2 | Chain Bridge Group
subscription revenue is distinguished from aggregation revenue and ancillary income (e.g., from
permissions, PPV, etc.).
The average revenue per primary subscription is pulled from Line d) of Tab 7, “Elasticity,” and
automatically populates Tab 8, “Data Input Summary” of the Substitution Model workbook.
8.12 Example Results
Exhibit 8-5 provides an example of a completed “Data Input Summary” tab from the Substitution Model
workbook, and Exhibit 8-6 shows an example “Simulation Results” tab based on the example variables.
Exhibit 8-5: Example “Data Input Summary”
Revenue threshold: 11,719$
Lower Bound: 35%
Upper Bound: 45%
Lower Bound: 60%
Upper Bound: 80%
Lower Bound: 38%
Upper Bound: 50%
Lower Bound: 45%
Upper Bound: 95%
Lower Bound: 30%
Upper Bound: 80%
(Adjusted) Price Elasticity of Demand 1.2727
Exposed institutional subscriptions 500
Average subscription revenue 375.00$
Substitution Simulation/Data Input Summary
Access Substitutability
Percentage of Content Covered by Mandate(s)
Deposit Compliance Rate of Mandate(s)
Percentage of Use Outside Embargo Timeframe
Archived Version Substitutability

50 B1 Assessing Open Archiving Mandates v1-2 | Chain Bridge Group
Exhibit 8-6: Example “Simulation Results”
Section 9 provides some example substitution risk calculations based on data provided by BioOne
publishers.
Publisher's average annual risk threshold for the journal: $11,719
The probability that the revenue loss will exceed the annual revenue threshold: 39%
The chance that the revenue loss will not exceed the risk threshold: 61%
Average revenue decrease: $10,951
Substitution Simulation/Substitution Results

51 B1 Assessing Open Archiving Mandates v1-2 | Chain Bridge Group
9—BIOONE EXAMPLES
9.1 Introduction
Exhibit 9-1 (next page) summarizes actual data for several (anonymized) BioOne journals and provides a
substitution risk assessment for each under various revenue risk tolerance assumptions.
The percentage of content covered by funder mandates and the percentage of use outside the embargo
timeframe for each of the journals are based on tracking data for a single issue over a four-year period. In
practice, a publisher would likely base these criteria on a larger sample. For our purposes here, the
modeling assumes upper and lower bounds that represent a 10% spread relative to the sample; a larger
sample might result in a narrower range for the upper and lower bounds.
Not surprisingly, as the BioOne journals have a number of characteristics in common, the results for the
three journals are substantially similar. We have described the substitution analysis for one journal
(Journal A) in detail below.
9.2 “Journal A” Substitution Modeling
The risk factor variables assumed for Journal A are described below. The analysis assesses the
substitution risk assuming the passage of the FASTR legislation, the implementation of the OSTP public
access directive, and the ratification of the pending EC public access policies. In other words, it assumes
all proposed government funding mandates are put into effect.72
Percentage of content covered by a funder mandate—
Nineteen percent of the content in the issue of the journal sampled was funded by a US federal agency
that would be covered by either the FASTR legislation and/or the OSTP public access directive or by a
public access policy of an EC member state. As noted above, the modeling assumes 5% above and below
the sample data point, yielding a range of between 14% - 24%.
Compliance with mandate—
A quarter of the journal’s covered content is funded by NIH, which has a relatively high compliance rate
due to mature enforcement policies. The compliance rate for the remainder of the funded content—
largely funded by NSF grants—will depend on future implementation policies. We have assumed that,
over time, these mandates would have approximately the same compliance rate as NIH. Therefore, we
have used a compliance rate range of 60% to 80%.
Percentage of use outside the embargo period—
For the sample, the journal received 51% of its use outside an assumed one-year embargo period. (The
analysis would need to be modified to reflect a longer or shorter embargo period.) The modeling
assumes a range of from between 46% - 56%.
Version substitutability—
The modeling assumes deposit of the author’s accepted manuscript, and assumes a high degree of
acceptance for that version for research purposes, but a lower acceptance of the author’s version when
citing an article for formal publication purposes. Given these assumptions, we have assumed a version
substitutability range of 65% to 95%.
72 None of the journals sampled published research funded by one of the US states with a pending public access mandate.

52 B1 Assessing Open Archiving Mandates v1-2 | Chain Bridge Group
Exhibit 9-1: Substitution Profiles, Selected BioOne Journals
Discovery & access substitutability—
As with mandate compliance, the extent to which ease of discovery and access affects substitutability will
depend on policies that may be implemented as part of the FASTR legislation or OSTP directive. For
Journal
% Content Covered by
Mandate
Low High Low High Low High
14% 24% 22% 32% 23% 33%
Compliance Rate
Low High Low High Low High
60% 80% 60% 80% 60% 80%
Use Outside Embargo
Low High Low High Low High
46% 56% 43% 53% 56% 66%
Version Substitutability
Low High Low High Low High
65% 95% 65% 95% 65% 95%
Access Substitutability
Low High Low High Low High
40% 90% 40% 90% 40% 90%
Price Elasticity of Demand
Average Weighted
Revenue per Subscription
Number of Primary
Institutional Subscriptions
Average Substitution %
Average revenue decrease
Revenue Threshold % 5% of revenue 10% of revenue 5% of revenue 10% of revenue 5% of revenue 20% of revenue
Revenue Threshold $ $3,320 $6,640 $5,465 $10,925 $2,525 $10,100
Probability of Exceeding
Threshold~60% ~2% ~35% ~6% ~98% ~13%
Mandate Risk Model/B1 Examples
Includes content that may be covered
by future US federal & EC publ ic pol icy
mandates . Bounds represent a 10%
spread relative to current year data .
Includes content that may be covered
by future US federa l & EC publ ic pol icy
mandates. Bounds represent a 10%
spread rela tive to current year data.
Includes content that may be covered
by future US federa l & EC publ i c pol i cy
mandates . Bounds represent a 10%
spread rela tive to current year data.
~$7,200 ~$7,000
Bounds represent a 10% spread
relative to an analysis of four years of
usage data.
1.4401.626
Author's Accepted Manuscript. High
discipl inary acceptance of preprints.
Bounds represent a 10% spread
relative to an analysis of four years of
usage data.
Bounds represent a 10% spread
relative to an analysis of four years of
usage data.
Journal A
Most of the covered content deposited
in a centralized repository, with the
remainder accessible via agency-
specific repositories.
$285
2.062
Most of the covered content deposited
in a centralized repository, with the
remainder accessible via agency-
specific repositories.
Most of the covered content deposited
in a centralized repository, with the
remainder accessible via agency-
specific repositories.
Journal C
Most of the content under mandates
with high average compliance.
Journal B
~$3,700
177177
3.5%
$341
7.1%
Substitution Range
4.7%
$375
320
Substitution Range
Author's Accepted Manuscript. High
disciplinary acceptance of preprints.
Author's Accepted Manuscript. High
disciplinary acceptance of preprints.
Substitution Range
Substitution Range
Most of the content under mandates
with high average compliance.
Most of the content under mandates
with high average compliance.
Substitution Range

53 B1 Assessing Open Archiving Mandates v1-2 | Chain Bridge Group
modeling purposes, we have assumed that some sort of centralized repository—or coordinated network
of repositories—will be implemented to facilitate discovery and access. Therefore, we have assumed an
upper bound of 90% substitutability (for mature, centralized repositories) and a lower bound of 40%
(given potential uncertainty and inconsistency of discovery).
Elasticity—
Based on the price and primary subscription data provided by the journal’s publisher, Journal A has a
price elasticity of demand of 1.626, which is relatively elastic. Although other factors may have affected
demand for the journal, we do not have sufficient information with which to adjust the elasticity.
Revenue risk threshold—
For modeling purposes, we have tested two risk tolerance thresholds: 5% of primary institutional
subscription revenue and 10% of primary institutional subscription revenue, yielding risk thresholds of
$3,320 and $6,640, respectively.
Probability of exceeding revenue threshold—
Running the model over 10,000 scenarios, there would be about a 60% chance of exceeding the 5%
revenue threshold and about a 2% chance of exceeding the 10% threshold.
The results for the other two BioOne journals summarized are similar, although in the case of “Journal
C,” the chances of exceeding the revenue threshold remain relatively high until the threshold reaches
about 20% of revenue.

54 B1 Assessing Open Archiving Mandates v1-2 | Chain Bridge Group
Appendix A: Example Risk Threshold Calculation
Net Revenue Contribution & Contribution to Overhead & Surplus
A journal’s net revenue contribution is the journal’s gross revenue less the direct variable costs of
producing and fulfilling the journal. The journal’s contribution margin (indicated as a percentage) is the
net revenue contribution divided by the top-line revenue. Thus, a journal with $100,000 in revenue and
variable costs of $20,000 would have a net revenue contribution of $80,000 and a contribution margin of
80%. Deducting the direct fixed costs of producing the journal from the net revenue contribution reveals
the revenue remaining to contribute to covering the society’s overhead costs and contributing to any
operating surplus.
Example/Illustration of Calculating Net Revenue Contribution to Shared Operating Costs
Step 1) Establish a baseline for the journal's Contribution to Shared Costs & Surplus (CSC&S):
Example Summary Income Statement
Line Description 201X Logic/Source
(a) Journal Revenue 100,000$ Publisher-supplied data.*
(b) Variable Costs 20,000$ Publisher-supplied data.*
(c) Net Revenue Contribution 80,000$ = (a) - (b)
(d) Contribution Margin 80% = (c) / (a)
(e) Direct Fixed Costs 50,000$ Publisher-supplied data.*
(f) Contribution to Shared Costs & Surplus 30,000$ = (c ) - (e)
Step 2) Convert the adjusted change in Contribution to Shared Costs & Surplus to revenue:
Example conversion of Contribution to Shared Costs & Surplus to top-line revenue:
Line Description 201X Logic/Source
(g) Change in CSC&S to breakeven 30,000$ As calculated above; Line (f).
(h) Plus adjustment to CSC&S 5,000$ As determined by publisher.
(i) Adjusted CSC&S 35,000$ = (g) + (h)
(j) Contribution Margin 80% As calculated above; Line (d).
(k) Top-line Revenue Change Threshold 43,750$ = (i) / (j)
Step 3) Multiply acceptable annual revenue change by 3 to get Revenue Risk Threshold:
(l) (3-Year) Revenue Risk Threshold 131,250$ = (k) * 3
Mandate Risk Model/Rev Threshold Example
*Journal data for the current year or the average of 3 most recent years. Whichever provides the most representative
data.

55 B1 Assessing Open Archiving Mandates v1-2 | Chain Bridge Group
Appendix B: Revenue Risk Tolerance Threshold Example
Financial Threshold, Example
Relevant
Line Description Value Source/Logic Report Section Comments
a) Contribution margin %): 80% Contribution margin = (subscnription revenue - variable costs) / revenue
b) Tolerance for decrease in net income ($): 9,375$ Determined by publisher.
c) Risk threshold for modeling purposes: 11,719$ = b / a Net income translated into subscription revenue.
Financial Threshold, Worksheet
Instructions:
Line a)
Line b)
Enter the society's tolerance (in $) for decreased annual net income.
Line Description Value
a) Contribution margin %): 0%
b) Tolerance for decrease in net income ($): -$
c) Risk threshold for modeling purposes: Calculated Field
See §4, §8.2 &
Appendix A
Enter a journal's contribution margin (i .e., net revenue
contribution divided by revenue), stated as a percentage.
Enter the results of this field in Line 1 of the Data Input tab.
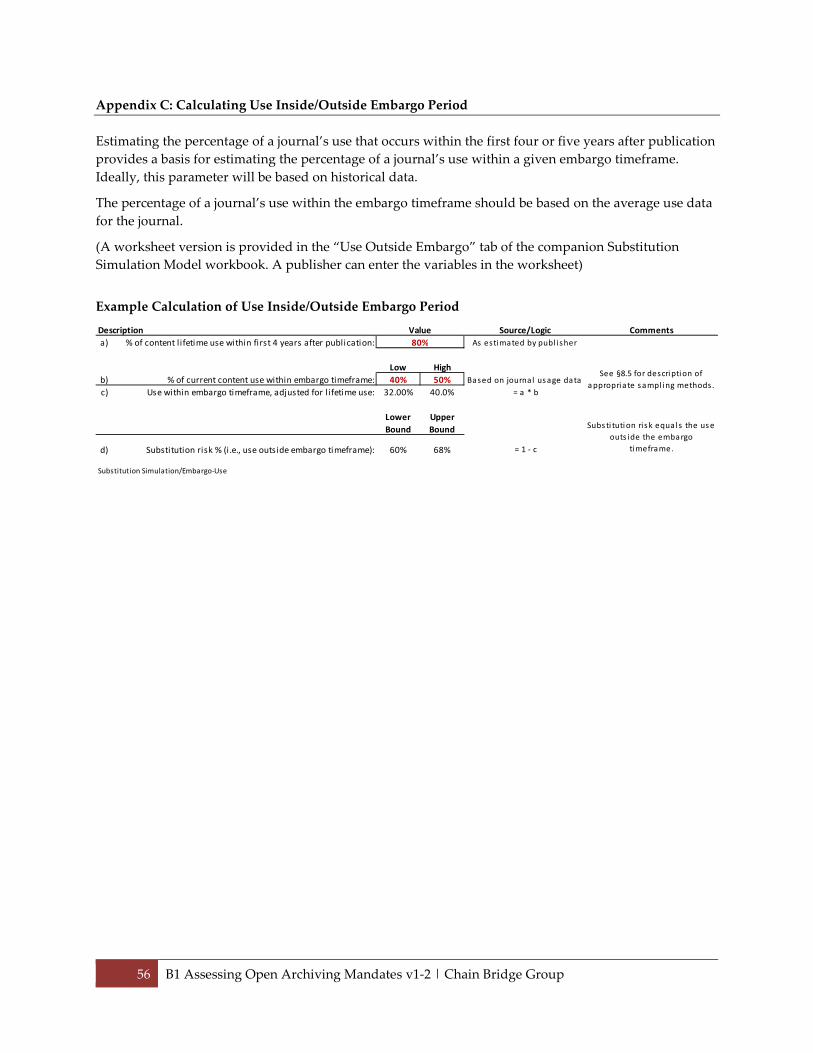
56 B1 Assessing Open Archiving Mandates v1-2 | Chain Bridge Group
Appendix C: Calculating Use Inside/Outside Embargo Period
Estimating the percentage of a journal’s use that occurs within the first four or five years after publication
provides a basis for estimating the percentage of a journal’s use within a given embargo timeframe.
Ideally, this parameter will be based on historical data.
The percentage of a journal’s use within the embargo timeframe should be based on the average use data
for the journal.
(A worksheet version is provided in the “Use Outside Embargo” tab of the companion Substitution
Simulation Model workbook. A publisher can enter the variables in the worksheet)
Example Calculation of Use Inside/Outside Embargo Period
Description Source/Logic Comments
a) % of content lifetime use within first 4 years after publication: As estimated by publ i sher
Low High
b) % of current content use within embargo timeframe: 40% 50% Based on journal us age data
c) Use within embargo timeframe, adjusted for lifetime use: 32.00% 40.0% = a * b
Lower Upper
Bound Bound
d) Substitution risk % (i.e., use outside embargo timeframe): 60% 68% = 1 - c
Substitution Simulation/Embargo-Use
80%
Value
See §8.5 for descri pti on of
a ppropri ate s ampl ing methods.
Subs ti tuti on ris k equal s the us e
outs ide the embargo
timeframe.

57 B1 Assessing Open Archiving Mandates v1-2 | Chain Bridge Group
Appendix D: Calculating 90% Confidence Interval for a Small Sample of Usage Data
Example data points (four-year timeframe)
Timeframe % of use within embargo timeframe
2007 - 2010: 45%
2008 - 2011: 42%
2009 - 2012: 30%
2010 - 2013: 37%
Number of samples: 4
Step 1
a) Determine the mean of the sample: 0.385
0.004225
0.001225
0.007225
0.000225
0.0043
Step 2
0.032787
Simplified t-statistic Table
Step 3 90% confidence interval (2 sided)
Sample Size t-stat
2 6.314
2.353 3 2.920
4 2.353
Step 4 5 2.132
7.71% 6 2.015
7 1.943
8 1.895
9 1.860
Step 5 Source: Wikipedia, Student's t -distribution
http://en.wikipedia.org/wiki/Student%27s_t-distribution
Upper: 46.21%
Lower: 30.79%
For a fuller explanation of the simplified calculation, see Hubbard 2010, pp. 142 - 144.
Calculate the sample variance:
b) Subtract the average of the sample
from each of the samples and square the
result for each sample:
c) Add the squares and divide by one less
than the number of samples to get the
sample variance:
Divide the sample variance by the
number of samples and determine the
square root of the result:
Look up the appropriate t-stat for the
sample size using the simplified t-statistic
table shown to the right:
Multiply the t-statistic (Step 3) by the
result of Step 2 to get the sample error:
Add the sample error to the mean of the
sample (Step 1a) to get the upper bound
and subtract the sample error from the
mean of the sample to get the lower
bound:

58 B1 Assessing Open Archiving Mandates v1-2 | Chain Bridge Group
Appendix E: Adjusting Elasticity
As described in §6.2.3, there are situations in which a publisher may need to adjust the elasticity
calculation for a journal. Some of these situations are described below, along with a description of how a
journal’s price elasticity of demand can be adjusted.
Pre-existing Substitution
If a new substitution channel for the journal was introduced within the period covered by the elasticity
data, the effect of that substitution on the number of subscriptions should be taken into account. For
example, were a publisher to have offered a pay-per-view option or licensed content through an
additional online aggregator during the period covered by the elasticity data, then the effect of that
offering on institutional subscriptions should be estimated and the elasticity adjusted accordingly.
Pre-existing Mandate Effects
Presumably, the elasticity for a journal that has been operating under an existing funder mandate for a
number of years already reflects the effects of the mandate on demand for the journal. However, in other
circumstances, a journal’s content may have been affected by funder mandates for a relatively short
period. In such cases, it will be difficult to assess the extent to which the mandate has already affected
demand for the journal.
Adjusting for Market Factors
A variety of market and environmental factors can affect the price elasticity for a journal. These include
library budget constraints and other local exigencies, a change in the importance of a field or discipline,
and the availability of other substitutes (for example, database aggregations with embargoed content).
The cost and effort of applying more rigorous data analysis methods to bracket out the effects of such
environmental and market issues will typically outweigh the potential increase in accuracy. Therefore,
the model provides a simple method for adjusting a journal’s price elasticity (see below) to reflect the
effects of known extraneous factors. Although the adjustment may lack precision, it should result in a
more accurate elasticity measure than would otherwise be available.
Adjusting a Journal’s Price Elasticity of Demand for Non-Price Factors
We described how to calculate a journal’s arc elasticity in §8.9. If demand for a journal has changed
substantially for reasons other than price—such as the circumstances described above—the computed
elasticity can be easily adjusted. A publisher can make the adjustment by multiplying the calculated
elasticity by the inverse of the change in demand due to non-price factors. For example, if a publisher
calculates a journal’s elasticity to be 1.2727 (using the example described in §8.9), but estimates that non-
price market factors accounted for 5% of the change in unit count, the journal’s elasticity would be
adjusted as follows:
Adjusted Elasticity = 1.2727 * (1.0 - 0.05); or
Adjusted Elasticity = 1.209
The companion Sustainability Model workbook provides a table for adjusting a journal’s elasticity (see
the “Elasticity” tab).73
73 The adjustment calculation described assumes that quantity demanded and the non-price factors being adjusted for are all
moving in the same direction. For example, that the subscription base for the journal has decreased due to a price increase and the

59 B1 Assessing Open Archiving Mandates v1-2 | Chain Bridge Group
Appendix F: Description of the Adjusted Substitution Percentage
The simulation model, described in §7.2, uses the arc price elasticity of demand for projecting the effect of
substitution on the quantity of subscriptions demanded. As a result, the substitution percentage needs to
be adjusted to reflect the arc price for the journal.
The arc price for the journal can be summarized by the following equation:
Arc Price = (P3 – P2) / (( P3 + P2) / 2)
Where P2 is the current year’s price and P3 is the first projected year’s price. The first projected year’s price
(P3) is calculated by increasing the current year’s price (P2) by the Substitution Percentage, which (recall)
is the functional equivalent of a price increase (see §3.2.2).74
adjustment factor(s) also reduce the number of subscriptions due to decreased demand (e.g., due to a new substitute, etc.) or that
the subscription base for the journal has increased due to a price decrease and the adjustment factor(s) also increased units due to an
increase in demand (e.g., due to an extraordinary marketing campaign, etc.). A different adjustment method is required when
demand and any adjustment factors move in opposite directions. Given the anticipated rarity of such situations, the method has not
been described here. 74 We cannot adjust the unit quantity to reflect the demand arc because the simulation is solving for the unit quantity.

60 B1 Assessing Open Archiving Mandates v1-2 | Chain Bridge Group
Appendix G: Dynamic Histogram Example
The histogram in the companion substitution simulation
model worksheet (“Monte Carlo” tab) sorts scenarios
into thousand dollar increments or bins. The histogram
data can then be used to generate a chart.
BinCumulative
FrequencyBin Frequency
0 5 5
1,000 7 2
2,000 24 17
3,000 68 44
4,000 192 124
5,000 454 262
6,000 843 389
7,000 1452 609
8,000 2301 849
9,000 3210 909
10,000 4206 996
11,000 5177 971
12,000 6103 926
13,000 6939 836
14,000 7679 740
15,000 8259 580
16,000 8723 464
17,000 9094 371
18,000 9355 261
19,000 9550 195
20,000 9702 152
21,000 9814 112
22,000 9876 62
23,000 9924 48
24,000 9944 20
25,000 9967 23
26,000 9981 14
27,000 9993 12
28,000 9995 2
29,000 9999 4
30,000 9999 0
31,000 9999 0
32,000 10000 1
33,000 10000 0
34,000 10001 1
35,000 10001 0
36,000 10001 0
37,000 10002 1
38,000 10002 0
39,000 10002 0
40,000 10002 0
Dynamic Histogram

61 B1 Assessing Open Archiving Mandates v1-2 | Chain Bridge Group
SOURCES CITED
Aspesi, Claudio. 2012. “Reed Elsevier: A Short History of Two Days in July (and Why Investors Should
Care).” Bernstein Research. September 10, 2012.
http://blogs.library.duke.edu/scholcomm/files/2012/09/Berstein-report-on-Elsevier.pdf
Beckett, Chris and Inger, Simon. 2006. “Self-Archiving and Journal Subscriptions: Co-existence or Competition?
London: Publishing Research Consortium.
Bennett, Linda. 2012. “The potential effect of making journals free after a six month embargo.”
Association of Learned, Professional and Society Publishers and The Publishers Association, May 2012.
http://www.publishingresearch.net/documents/ALPSPPApotentialresultsofsixmonthembargofv.pdf
Davis, Phil. 2012. “Open Access Embargoes — How Long Is Long Enough?” Scholarly Kitchen, September
18, 2012. http://scholarlykitchen.sspnet.org/2012/09/18/open-access-embargoes-how-long-is-long-enough/
Gargouri, Y., Lariviere, V., Gingras, Y., Brody, T., Carr, L., and Harnad, S. 2012. “Testing the Finch
Hypothesis on Green OA Mandate Effectiveness.” http://eprints.soton.ac.uk/344687/
Goodman, David, and Sarah Dowson and Jean Yaremchuk. 2007. “Open Access and Accuracy: Author-
archived manuscripts vs. published articles.” Learned Publishing 20.3: 203 – 215.
Hammond, J. S., Keeney, R. L. and Raiffa, H. 1998. “The hidden traps in decision making.” Harvard
Business Review, September/October 1998: 47-58.
Hillson, David and David Hulett. 2004. “Assessing Risk Probability: Alternative Approaches.” PMI
Global Congress—Europe. Prague: Project Management Institute.
http://marketplace.pmi.org/Pages/ProductDetail.aspx?GMProduct=00100775200&iss=1
Housewright, Ross, Roger C. Schonfeld, and Kate Wulfson. “US Faculty Survey 2012.” New York: Ithaka
S+R, 2013.
Jones, Lee. 2013. “HEFCE, the REF, Open Access and Journals in Politics, IR and Political Theory.” The
Disorder of Things. August 16, 2013. http://thedisorderofthings.com/2013/08/16/hefce-the-ref-open-access-
and-journals-in-politics-ir-and-political-theory/
Kahneman, D. 2012. Thinking Fast and Slow. **get rest of cite
Kim, Ji-Hyun. “Faculty Self-Archiving: Motivations and Barriers.” 2010. Journal of the American Society for
Information Science and Technology. 61.9 (September 2010): 1909-1922.
Nicholas, David, Ian Rowlands, Anthony Watkinson, David Brown, and Hamid R. Jamali. 2012. “Digital
Repositories Ten Years On: What do scientific researchers think of them and how do they use them?”
Learned Publishing 25.3: 195 – 206.
Poynder, Richard. 2011. “Open Access by Numbers.” Open and Shut, June 19, 2011.
http://www.richardpoynder.co.uk/Open_Access_By_Numbers.pdf
http://poynder.blogspot.com/2011/06/open-access-by-numbers.html
Research Information Network. Overcoming barriers: Access to research information content. Research
Information Network. London 2009. http://www.rin.ac.uk/barriers-access
Slovic, Paul. 1987. “Perception of risk.” Science, 236, 280-285.
Swan, Alma and Sheridan Brown. 2005. “Open access self-archiving: An author study.” (Truro, UK: Key
Perspectives, May 2005).

62 B1 Assessing Open Archiving Mandates v1-2 | Chain Bridge Group
Vaughan, J. 2012. Investigations into Library Web-scale Discovery Services. Information Technology &
Libraries, 31(1), 32-82.
Wates, Edward and Robert Campbell. 2007. “Author’s Version vs. Publisher’s Version: An analysis of the
copy-editing function.” Learned Publishing 20.2: 121 – 129.
Xia, Jingfeng, Gilchrest, Sarah B., Smith, Nathaniel X.P., Kingery, Justin A., Radecki, Jennifer R., Wilhelm,
Marttha L., Harrison, Keith C., Ashby, Michael L., and Mahn, Alyson J. 2012. “A Review of Open Access
Self-Archiving Mandate Policies.” portal: Libraries and the Academy 12.1: 85 – 102.