
B01212 Final Report - Visit Cornwall · 8 Final Report Cornwall Visitor Survey 2012 4. MAIN...
47
CORNWALL VISITOR SURVEY 2012 FINAL REPORT January 2013
Transcript of B01212 Final Report - Visit Cornwall · 8 Final Report Cornwall Visitor Survey 2012 4. MAIN...

CORNWALL VISITOR SURVEY
2012
FINAL REPORT
January 2013

2 Final Report Cornwall Visitor Survey 2012
Prepared for: Visit Cornwall Client Contact: Emma Rojano Prepared by: Beaufort Research Agency contact: Claire Peate 2 Museum Place Cardiff CF10 3BG Tel: (029) 37 6740 Fax: (029) 2037 0600 E-mail: [email protected] Website: www.beaufortresearch.co.uk © Beaufort Research Ltd 2013 B01212 FINAL/ CP / January 2013
TERMS OF CONTRACT
Unless otherwise agreed, the findings of
this study remain the copyright of Beaufort Research Ltd and may not be quoted, published or reproduced without the
company’s advance approval.
Approval to quote or publish will only be withheld on the grounds of inaccuracy
or misrepresentation.
Any approved publication must detail: Beaufort Research Ltd as provider,
sample size and field dates.
3 Final Report Cornwall Visitor Survey 2012
CONTENTS PAGE 1. INTRODUCTION AND OBJECTIVES ........................................................ 4 2. METHODOLOGY ...................................................................................... 6 3. HEADLINE FINDINGS 3.1 Visitor and trip profile ......................................................................... 7 3.2 Visit experience ................................................................................ 11 3.3 Information ....................................................................................... 16 3.4 Transport .......................................................................................... 18 3.5 Spend ............................................................................................... 19 APPENDIX Survey questionnaire

4 Final Report Cornwall Visitor Survey 2012
1. INTRODUCTION AND OBJECTIVES 1.1 Background and objectives
In February 2012 Visit Cornwall commissioned Beaufort Research to conduct the
Cornwall Visitor Survey for 2012. The survey repeated – and built on – research
conducted in previous years in the county.
The research assists Visit Cornwall in its understanding of visitor’s expectations,
experiences and needs in the region and helps them in their work with other tourism
organisations in delivering a targeted tourism product.
Specific objectives were:
Provide a profile of the types of visitor coming to Cornwall
Measure the visitor’s trip experience against expectations
Understand the decision making process including information sources pre
and during the trip
Explore trip characteristics such as transport use, accommodation and
activities undertaken
The survey ran from 21st March – 31st December 2012. This report is the final report
and is accompanied by a full set of data tabulations for the purposes of in depth
analysis of the results.

5 Final Report Cornwall Visitor Survey 2012
1.2 Research context
The economic and climatic backgrounds to this research are given below – both of
which contribute negatively to the UK tourism market.
The negative growth between Q4
2011 and Q2 2012 came to an end
in Q3 2012.
By the year end there was, however,
talk of a potential triple dip recession
on the horizon and businesses and
consumers remain financially
cautious.
As part of the ongoing financial situation the media continue to report on the subject of
the Staycation – that is the substitution of a holiday abroad for a holiday within the UK.
Climatically, the UK weather in 2012 was heavily
influenced by the abnormal position of the Jet
Stream (which has been in a lower position than
normal since 2007). Summer 2012 was referred to
in the media as the “lost summer” being the wettest
summer in 100 years and temperatures well below
average.
By the year end the Met Office confirmed that 2012
was the second wettest year on record.
Source: ONS

6 Final Report Cornwall Visitor Survey 2012
2. METHODOLOGY 2.1 Methodology summary
The research universe was classed as those aged 16 or over who live outside the
county and are either as a Staying or Day Visitor.
A fifteen minute questionnaire was administered face-to-face across a number of
locations in the county:
West Cornwall South Coast North Coast Bodmin Moor & Tamar Valley
Penzance St Ives
Marazion Lizard
Lands End
Falmouth Truro
Mevagissey Charlestown
Fowey Lostwithiel
Looe
Perranporth Newquay Padstow
Wadebridge Bude
Launceston Liskeard Bodmin Minions
2.2 Summary of interviews achieved
The breakdown of interviews across the seasons is as follows:
Chart 1
1000
270
390360
1068
315376 377
Total Spring Summer Autumn/ Winter
Target Achieved

7 Final Report Cornwall Visitor Survey 2012
3. KEY FINDINGS
Satisfaction with the trip is high, with 84% of visitors Promoters. Not
surprising given the high proportion of repeat visitors, for most the trip “met
expectations”.
The majority don’t need information pre-visit. For those that do need
information (first-time visitors) the internet is most-mentioned source:
accommodation sites are the most popular. With 91% of visitors to Cornwall
on a repeat visit many visitors use previous experience to inform their current
trip.
The phenomenon of Staycationing (visitors who are substituting a holiday
abroad for one in the UK) is introducing new visitors to the region: 17% on a
Staycation have never visited Cornwall before compared to 6% who are not on
a Staycation.
Anticipated spend during the trip is remaining fairly constant regardless of
the financial climate: around two thirds will spend the same or more on
accommodation, things to do and food and eating out.
There is some appetite for the Oyster Card and Loyalty Schemes: more so
amongst the younger visitors than those in the older age groups.
The car still dominates travel, with car-free days showing a year on year
decline to 23% in 2012 (from 29% in 2010). The road network in Cornwall was
very positively received as being able to handle the volume of traffic.

8 Final Report Cornwall Visitor Survey 2012
4. MAIN FINDINGS
4.1 VISITOR AND TRIP PROFILE
Including visitor profile, trip profiles, and destination choices.
4.1.1 Visitor Profile
Looking first at visitor origin, the vast majority of visitors to the county are from the
UK (94%) with 4% of visitors from Europe and 2% from further afield. This is
consistent with the findings from the 2011 and 2010 visitor surveys.
Visitors from the UK are drawn from most regions (see Map 1, below) with a
stronger focus on the South West and South East and Midlands.
Map 1: Distribution of UK visitors to Cornwall
The UK distribution of visitors breaks
down as follows:
South West 28% South East (including London) 26% West Midlands 13% North West England 8% Yorkshire and Humberside 5% East of England 5% Wales 5% Scotland 1% North East England 1%
From overseas the countries with the most visitors to Cornwall were Germany
(32% of overseas visitors) and USA/ Canada (20%).
Looking solely at Day Visitors to Cornwall, not surprisingly the majority (91%) are
from neighbouring Devon, again consistent with previous years.

9 Final Report Cornwall Visitor Survey 2012
The lifestage of the visitor to Cornwall was captured, using the following
segmentation:
Young Independent: aged up to 34 years, no children in household
Older Independent: aged 35 years or more, no children in household
Families: children in household
The chart below shows that Older Independents make up the majority of visitors to
the region – accounting for two thirds (66%) of all visitors.
Chart 2: Lifestage of visitors to Cornwall
Base: all visitors (1,068)
10
66
24
Young Independents
Families
Older Independents

10 Final Report Cornwall Visitor Survey 2012
Turning to look specifically at the age of the visitor, the following chart shows the age
breaks both for the total sample and also at a number of subsamples to demonstrate a
variation to the profile of visitors to the region.
Chart 3: Lifestage of visitors to Cornwall
3 4 5 3 3 3 5 810 9 9 12 11
612
13
17 1522
14 20
12
1916
2321
25
23 18
24
2818
2424
21
25 2428
17 30
22 2619 22 24 27
1812
Total Spring Summer Autumn/Winter
WestCornwall
SouthCoast
NorthCoast
Bodmin/Tamar
65+
55‐64
45‐54
35‐44
25‐34
16‐24
Base: all respondents (2012 = 1,068)
Looking regionally, in Bodmin Moor and Tamar Valley 21% of visitors are below the
age of 34, compared to just 9% on the South Coast of Cornwall. In the summer
months the rise of the mid-age-ranges (35-54) indicates the predominance of families
during the school holidays: they account for 47% of visitors during the summer
compared to 36% of visitors during the spring and 37% of visitors during the autumn/
winter.

11 Final Report Cornwall Visitor Survey 2012
The social grade of visitors to Cornwall is given in the table below. Social grade is a
classification based on occupation, used for over 50 years and is a market research
industry standard for classification. The classifications are as follows:
A Higher managerial, administrative and professional
B Intermediate managerial, administrative and professional
C1 Supervisory, clerical and junior managerial, administrative and professional
C2 Skilled manual workers
D Semi-skilled and unskilled manual workers
E State pensioners, casual and lowest grade workers, unemployed and state
benefits only.
The results show that the profile of visitors to Cornwall is heavily skewed towards the
upper social grades: that is ABC1.
Table 1: Socio Economic Group - Stage I data
UK Profile*
Region visited
TOTAL Spring Summer
Autumn/
Winter West South North
Bodmin/ Tamar
ABC1 55% 69% 71% 71% 67% 69% 68% 68% 84%
C2DE 45% 30% 29% 29% 33% 31% 31% 32% 14%
Sample size - 1,068 315 376 377 316 312 358 82
Base: all visitors *Source: National Readership Survey 2010.
Ethnically Cornwall attracts a very limited ethnic mix of visitors with just 2% of visitors
falling into non-white classifications.

12 Final Report Cornwall Visitor Survey 2012
Looking at visitors’ previous experience of Cornwall, the vast majority of visitors (90%)
are on a repeat visit with just 9% on a first time visit to the county. The summer period
sees the highest proportion of first time visitors (where they account for 14% of
visitors). The phenomenon of the Staycation appears to attract a higher proportion of
new visitors to the region: 17% have not visited before compared to 6% who are not
on a Staycation.
Chart 4: Proportion of new and repeat visitors
9 11 12 12 10 1022 20
15
91 89 88 88 90 9078 80
85
2012 2011 2010 2008/9 2006/7 2004/5 2002/3 2000/1 1999
Repeat visit
First visit
Base: all respondents (2012 = 1,068)
(%)
Amongst those who have been to Cornwall before the last visit was – for over half –
within the previous twelve month period.
Within the last month (7%)
Within the last six months (22%)
Within the last twelve months (28%)
1-2 years ago (15%)
3-4 years ago (8%)
5+ years ago (19%)

13 Final Report Cornwall Visitor Survey 2012
Looking at the visit party, nearly half (47%) are on a trip with a spouse/ partner:
highest in the autumn/ winter period (57%) and lowest during the summer months
(34%) when Families dominate the profile.
Chart 5: Party composition
7 6 6 9
47 49
34
57
36 3152
24
56
4 45 8 4 5
Total Spring Summer Autumn/Winter
Family and friends
Friends only
Family only
Spouse/ partner
Alone
Base: all respondents (2012 = 1,068)
Who are you with on this visit? (%)
Over one in five visitors (22%) were on a trip with someone with a disability in their
immediate party. A disability was classed as having conditions or impairments relating
to:
Mobility (including wheelchair use)
Sight (either partial sight or blind)
Hearing
Learning
Long-term illness (for example cancer, arthritis)

14 Final Report Cornwall Visitor Survey 2012
The chart below shows that the proportion on a trip to Cornwall with someone in the
party with a disability increases as the year progresses: in autumn and winter nearly a
quarter (24%) are with someone who has a disability.
Chart 6: Conditions or impairments in party
78 81 77 76
87
610
11
1 27 5
6 91 2 110 10 9 101 2 1
Total Spring Summer Autumn/Winter
Other
Long‐term illness
Learning
Hearing
Sight
Mobility
No disabilities
Base: all respondents (2012 = 1,068)
Do you or does anyone in your immediate party have any of the following conditions or impairments? (%)

15 Final Report Cornwall Visitor Survey 2012
4.1.2 Trip Profiles
The main purpose of the trip for the majority of visitors to Cornwall was leisure/ holiday
with over four in five (83%) on a leisure/ holiday trip to the region. The proportions
visiting friends and relatives increases out of season: from 10% in the summer to 20%
in the autumn/ winter. There are also differences in the region visited: those in the
Bodmin/ Tamar area are more likely to be visiting friends and relatives (23% are doing
so) compared to those in North Cornwall (just 9%).
Table 2: Main purpose of trip to Cornwall
Region visited
TOTAL Spring Summer
Autumn/ Winter
West South North Bodmin/ Tamar
Leisure/ holiday 83% 85% 88% 77% 83% 80% 89% 72%
Visiting friends and family
15% 14% 10% 20%
16% 18% 9% 23%
Shopping trip 1% 1% 1% 1% 1% 0% 1% 5%
Business/ attending a conference
1% 1% 1% 1%
1% 2% 1% 0%
Sample size 1,068 315 367 377 316 312 358 82
Base: all Visitors
While the figures, above, remain consistent with previous waves of the Cornwall Visitor
Survey there has been a slight increase in the proportions visiting friends and relatives
(15% in 2012, up from 11% in 2011 and 9% in 2010).

16 Final Report Cornwall Visitor Survey 2012
Turning to look at the type of trip being taken – that is whether it is a day or staying trip
– the results are shown in the chart below and point to a marked focus on Staying
Visitors, not surprising given the geographical situation of the county. The results
show little change over time.
Chart 7: Proportion of day and staying visitors to Cornwall
4 8 4 6 6
96 92 95 95 94
2012 2011 2010 2008/9 2006/7
Staying visitor
Day visitor
Base: all respondents (2012 = 1,068)
(%)
Staying Visitors from the UK were asked if they were on a Staycation – that is a
holiday in the UK that would normally be taken abroad. Just over one in ten (12%)
said they were on a Staycation: rising to nearly one in five over the summer period
(18%). See chart following.

17 Final Report Cornwall Visitor Survey 2012
Chart 8: Proportion of Staycationers in Cornwall
12
26
11 1218
9
Total First trip Repeat visit YoungIndependents
Families OlderIndependents
Base: all staying respondents (2012 = 1,002)
Does this trip in Cornwall replace a holiday that would normally be taken abroad? (% yes)
In total over two in five (44%) classify themselves as on a short break: highest in the
North Coast (51% are on a short break). See chart below.
Chart 9: Nature of trip
26 29 2719
43
2731
25
27
15
4438
43 5137
3 1 4 2 6
Total WestCornwall
South Coast North Coast BodminMoor/Tamar
Other
Short break
Secondary/additionalholiday
Main holiday
Base: all staying respondents (2012 = 1,002)
(%)

18 Final Report Cornwall Visitor Survey 2012
Those on a staying trip in the county were asked for the town nearest to where they
were staying. The most-mentioned location was Newquay with 21% mentioning this as
the nearest town (on a par with previous research waves in 2008/9 to 2011 when 19%
of visitors stayed nearest to Newquay).
Table 3: Town nearest to location of accommodation
Main reason
(%)
Newquay 21%
St Austell 14%
Wadebridge 12%
St Ives 11%
Penzance 9%
Looe 6%
Helston 6%
Bude 4%
Falmouth 4%
Liskeard 3%
Bodmin 2%
Truro 2%
Camborne/ Redruth 1%
Launceston 1%
Sample size 1,002
Base: all staying visitors

19 Final Report Cornwall Visitor Survey 2012
The average number of nights stayed stands at 6.9 in 2012 – up from 6.3 in 2011.
The average number of nights is highest in the summer months (8.5) and lowest in the
spring (6.2) and autumn/ winter (5.8).
Chart 10: Average number of nights stayed
6.85
6.27
6.63
7.5
6.9
2012 2011 2010 2008/9 2006/7
Base: all staying respondents (2012 = 1,002)
Reflecting the nature of the trip taken by the different visitor groups, those visitors
falling into the Young Independents lifestage take an average of 5.7 nights, with
Families taking 6.8 nights. Older Independents have the highest average nights with
7.1 nights.

20 Final Report Cornwall Visitor Survey 2012
4.1.3 Destination Choices
For the majority of visitors to Cornwall there was no other destination considered when
planning their trip: 77% said they did not choose Cornwall in direct preference to
another destination. This rises to 82% who classify themselves on a short break and
falls to 68% amongst those who were on a secondary/ additional holiday.
Amongst those who did consider another destination, leading destinations were:
The South West (26%) Europe (16%) Scotland (12%) Wales (11%)
For the majority of visitors it is past experience that drives a repeat visit: for two thirds
(67%) they are visiting because we’ve enjoyed previous visits, amongst other reasons,
and it is the main reason for over a third (37%). See the table below for the list of
reasons, ranked in order of most-mentioned (all influences).
Table 4: Reasons for visiting Cornwall
All influences Main reason
Because we’ve enjoyed previous visits 67% 37%
The beauty of the natural landscape 51% 11%
Because it’s peaceful/ relaxing/ quiet 47% 8%
High quality beaches/ bathing 31% 3%
To visit family and friends (and/or their property) 22% 15%
To visit a specific location or attraction 16% 5%
Because it’s easy to get to 15% 1%
South West Coast Path 11% 2%
To undertake a specific hobby/ pastime/ activity 8% 3%
Word of mouth/ recommendation 6% 2%
To visit own property (house, caravan etc) 4% 3%
Because of an advert or special offer 3% 1%
Business 1% 1%
Never been before/ somewhere new 1% 1%
Sample size 970
Base: all visitors

21 Final Report Cornwall Visitor Survey 2012
Amongst the main reasons for visiting the region there are a few differences across
the visitor profiles, with those interviewed in Bodmin/ Tamar Valley more likely to
mention the beauty of the natural landscape and those on the North Coast more likely
than those elsewhere to mention because it’s peaceful/ relaxing. This was also
mentioned by a greater proportion of visitors in the autumn and winter months.

22 Final Report Cornwall Visitor Survey 2012
4.2 VISIT EXPERIENCE
St Ives was the most-mentioned urban destination for visitors with 37% having visited
or intending to visit the town as part of their trip, with Newquay (33%) the second
most-mentioned. This corresponds with previous years, with St Ives mentioned by
38% and Newquay by 33% in 2011. The centres of St Austell/ Charlestown
(mentioned by 23% in 2012, 13% in 2011) and Rock/ Padstow/ Polzeath (mentioned
by 32% in 2012 and 20% in 2011) have increased in intention to visit, while Truro has
decreased (26% in 2012 from 35% in 2011).
Table 5: Towns visited or plan to visit during trip (top mentions)
Visited/ intend to visit
(%)
St Ives 37%
Newquay 33%
Rock/ Padstow/ Polzeath 32%
Penzance/ Newlyn 28%
Truro 26%
Charlestown/ St Austell 23%
Mevagissey 21%
Falmouth/ Penryn 20%
Polperro/ Looe 17%
Fowey 17%
The Lizard 16%
Perranporth/ St Agnes 15%
Bodmin 15%
Boscastle/ Tintagel 13%
Sample size 1,068
Base: all visitors

23 Final Report Cornwall Visitor Survey 2012
Coastal locations dominate the list of destinations/ potential destinations for visitors.
The most-mentioned destination was fishing villages/ harbours, mentioned by over half
(57%) of all visitors. This was followed by seaside resorts (40%) and remote/ sandy
beaches (32%). See chart, below.
Chart 11: Destinations visited/ planning to visit during trip
0
1
6
14
14
15
15
16
17
23
24
26
29
30
32
40
57
Eating establishments
Shops/ markets
Arts venues
Family attractions
Parks/ woodland
Museums
Art galleries/ exhibitions
Larger towns/ city
Estuaries/ rivers
South West Coast Path
Popular beaches
Rural towns and villages
Heritage/ historic sites
Gardens
Remote sandy beaches
Seaside resorts
Fishing villages/ harbours
Key:
Urban destination
Nature‐based destination
Attraction
Base: all respondents (2012 = 1,068)
(%)
There are significant differences within the sample of visitors:
Gardens are more likely to be visited during the spring (37% intend to do so)
compared to the autumn/ winter (23%). They are also more popular amongst
those in West and South Cornwall (38% and 35% intend to visit gardens during
their trip) compared to those interviewed in North Cornwall (21%) and Bodmin/
Tamar (23%). Almost half (43%) of those aged 65+ intend to visit a garden
during their trip, compared to 23% aged 25-44.
Heritage/ historic sites/ properties are mentioned by a greater proportion of
visitors in West Cornwall (20%) compared to Bodmin/ Tamar (7%). Amongst
those on a first time trip to Cornwall nearly half (46%) intend to visit a heritage/
historic site/ property compared to 27% on a repeat visit to the county. They
are also mentioned by a greater proportion of visitors from AB social grade
(37%) compared to those from C2 (23%) and DE (27%) social grades.

24 Final Report Cornwall Visitor Survey 2012
Family attractions are, not surprisingly, mentioned by a greater proportion of
families (31%) compared to Young Independents (11%) and Older
Independents (8%).
The South West Coast Path is most popular in the spring (28% have visited or
intend to visit) compared to the summer (21%) and autumn/ winter (22%). A
greater proportion of AB social grades have visited/ intend to make use of the
path (32%) compared to those from other social grades (19%).
When looking at the sites of interest in the county, almost nine in ten visitors to
Cornwall (89%) believed that the county possessed heritage coastline and a similar
proportion (86%) believed it possessed Areas of Outstanding Natural Beauty. See
chart, below.
Chart 12: Recognition of sites of interest
8986
70
57 56
Heritage Coastline AONB AncientMonuments
National Park World HeritageSites
Base: all visitors (1,068)
Which of the following, if any, do you think are in Cornwall? (%)
Interestingly over half (57%) believed – incorrectly – that Cornwall has a national park
within its boundaries.

25 Final Report Cornwall Visitor Survey 2012
Cornwall lives up to expectation to expectations for the majority of visitors (58%) the trip
was the same as expected. This is not surprising given the high proportion (91%) of
repeat visitors to the region and it does not necessarily imply a negative experience:
repeat visitors are returning because a previous visit was enjoyable and the current
trip is the same as expected. For almost a third (30%) the trip was better than
expected and for nearly one in ten (9%) it was much better than expected. This rose
to 15% amongst those on a first visit to Cornwall.
Chart 13: Destinations visited/ planning to visit during trip
1
58
30
91
Much worse than expected
Worse than expected
The same as expected
Better than expected
Much better than expected
Don't know
Base: all respondents (2012 = 1,068)
63% on a first visit said it was better than expected, compared to 37% on a repeat visit (for whom 60% said it was the same as expected).
For most the trip was as expected(%)

26 Final Report Cornwall Visitor Survey 2012
Visitors were asked to rate elements of their trip, from very good through to very poor
on a five point scale. The results, shown in the chart below, demonstrate not only that
the elements of the trip were positively received, but also that for the majority of
visitors a number of the elements were not experienced. Over four in five visitors were
not able to rate attractions, activities and public services while three quarters were
unable to rate museums and galleries.
Chart 14: Rating trip elements
1 11 1 2 1 2 1 2 210 9 9 9 5
48 5
87
60
43
26
1010
15
10
1
29
45
64
81 8475
82
OVERALLTRIP
Beaches Coastal path Heritagesites/
properties
Attractions Activities Musuemsand
galleries
Publicservices
Don't know
5 - very good
4
3
2
1 - very poor
Base: all visitors (1,068)
4.9 4.8 4.8 4.44.54.64.34.7Mean score
(%)
The survey also captured another measure of satisfaction with the trip: the use of the
Net Promoter Score. Net Promoter Scores (NPS) measure customer loyalty using the
question how likely is it that you would recommend Cornwall as a place to visit to a
friend or colleague? The scale used runs from ‘0’ (not at all likely) to ‘10’ (extremely
likely). Three distinct groups are produced:
Detractors (those who score 0-6). Customers that have generated sales but
are actually bad for the ‘company’ over the long haul. They are less likely to
buy anything/ visit again and are more likely to spread bad word of mouth and
more costly to serve because of their dissatisfaction.
27 Final Report Cornwall Visitor Survey 2012
Passives (those who score 7-8). Customers are generally more positive but are
significantly less valuable than Promoters. Passives may be satisfied but that
may not be in the longer term.
Promoters (those who score 9-10). Customers that drive business growth. The
company has gone beyond satisfying needs and truly delights them. As a
result they will be more likely to revisit and to recommend it to many others.
The Net Promoter Score is a simple calculation as follows:
(% Promoters) – (% Detractors)
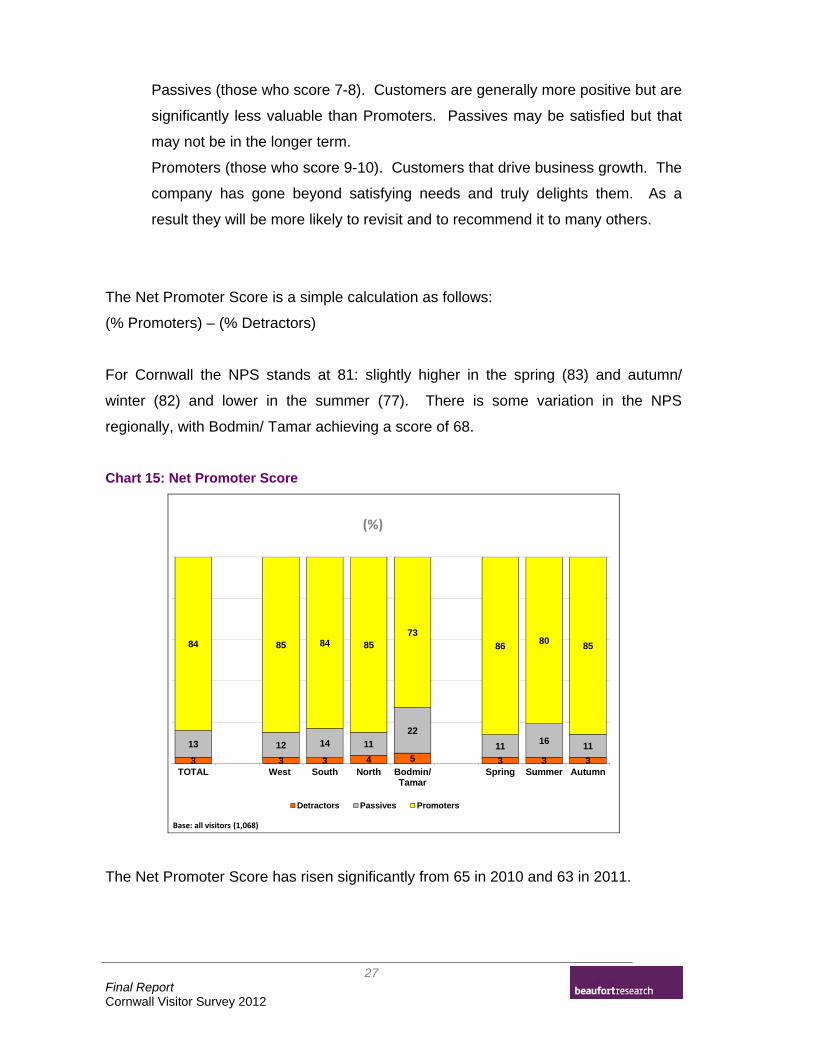
For Cornwall the NPS stands at 81: slightly higher in the spring (83) and autumn/
winter (82) and lower in the summer (77). There is some variation in the NPS
regionally, with Bodmin/ Tamar achieving a score of 68.
Chart 15: Net Promoter Score
3 3 3 4 5 3 3 3
13 12 14 11
22
1116 11
84 85 84 8573
8680 85
TOTAL West South North Bodmin/Tamar
Spring Summer Autumn
Detractors Passives Promoters
Base: all visitors (1,068)
(%)
The Net Promoter Score has risen significantly from 65 in 2010 and 63 in 2011.

28 Final Report Cornwall Visitor Survey 2012
4.3 INFORMATION
Including pre- and during-visit information sourcing.
The rise of the internet as an information source prior to taking the trip is clearly shown
in the chart below. In 2006/7 just 21% of visitors used the internet to find out
information before travelling to Cornwall, compared to over double that proportion
(45%) in 2012. The high proportion of repeat visitors also informs future visits with just
under half (48%) in 2012 claiming they either did not source information prior to the
visit or they used knowledge gained from a previous visit.
Chart 16: Information sources prior to trip
40
36
40
40
48
19
17
9
9
6
15
10
14
15
6
21
23
41
35
45
6
2
5
6
2
2
1
1
1
1
2006/7
2008/9
2010
2011
2012
Previous visit/ Didn'tobtain info
Recommendation
Brochure/ guidebook
Internet
Newspaper advert
TIC
Base: all respondents (2012 = 1,068)
Thinking now about information sources, prior to your trip in Cornwall, where did you obtain your information about the trip? (%)
The use of the internet prior to the visit is even more pronounced amongst first-time
visitors. Three quarters (75%) of those who have not been to the county before used
the internet to find out information about the trip.
Amongst those who used the internet the majority did so to source information and to
book accommodation/ car hire/ flights/ tickets (72%). Just over a quarter (27%) used
the internet to source information only.

29 Final Report Cornwall Visitor Survey 2012
Accommodation sites were the most-mentioned type of internet source prior to taking
a trip to Cornwall: 64% of those who used the internet to source information consulted
an accommodation site. General tourism sites were the next most-mentioned internet
source of information: mentioned by 34% of internet users.
Chart 17: Information sources prior to trip
64
34
159
4 3 1
Accommodationspecific
General tourism Attractionspecific
Search engine Activity specific Social website Transport site
Base: all respondents who used the internet to obtain information (2012 = 481)
Which of the following internet sources, if any, did you use when searching for information about Cornwall? (%)
During the trip the areas that visitors are most likely to gather information on are:
Places to go (30%)
Things to do (30%)
Attractions (23%)
Maps (15%)
Events (11%)
Accommodation (7%)
Offers (3%)
Transport (1%)
30 Final Report Cornwall Visitor Survey 2012
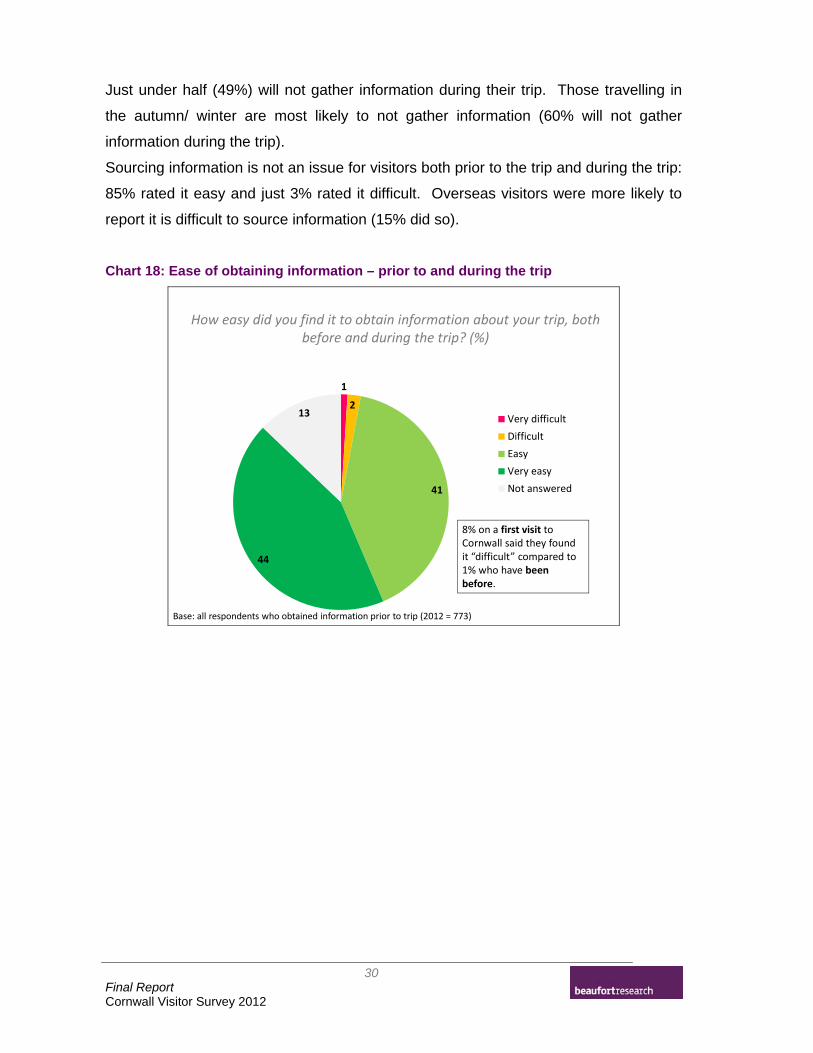
Just under half (49%) will not gather information during their trip. Those travelling in
the autumn/ winter are most likely to not gather information (60% will not gather
information during the trip).
Sourcing information is not an issue for visitors both prior to the trip and during the trip:
85% rated it easy and just 3% rated it difficult. Overseas visitors were more likely to
report it is difficult to source information (15% did so).
Chart 18: Ease of obtaining information – prior to and during the trip
1
2
41
44
13Very difficult
Difficult
Easy
Very easy
Not answered
Base: all respondents who obtained information prior to trip (2012 = 773)
8% on a first visit to Cornwall said they found it “difficult” compared to 1% who have been before.
How easy did you find it to obtain information about your trip, both before and during the trip? (%)

31 Final Report Cornwall Visitor Survey 2012
4.4 TRANSPORT
Including use of transport to and around Cornwall.
For the majority of visitors (86%) the car or van was the main form of transport (see
chart below). This proportion has increased from 75% in 2011. The most significant
decrease between 2011 and 2012 has been with organised coach tour down from 11%
of visitors in 2011 to just 2% in 2012. One reason for this may be due to differences in
fieldwork procedures (we only interview one member of a coach party but other
agencies may interview multiple members). In addition in 2012 there were 21
locations for interviewing while in 2011 there were just 6 – all of which were
reasonable sized urban areas which can attract coach parties.
Chart 19: Main form of transport for longest part of journey to Cornwall
1
2
2
3
7
86
Motorbike
Plane/ air travel
Organised coach tour
Bus/ coach service
Train
Car/ van
Base: all respondents (2012 = 1,068)
Car/ van usage declines with age: 25% of those aged 65+ did not use a car/van but used amongst other forms of transport the bus/coach (8%) or train (10%).
(%)
Almost all (93%) of visitors who travelled by car/ van did not consider another form of
transport for the journey. Those that were most likely to consider another form of
transport were on a first trip to Cornwall (13% said they had considered another form
of transport) and those in the younger age groups (15% of those aged under 34
considered an alternative).

32 Final Report Cornwall Visitor Survey 2012
The proportion of car-free days has declined slightly over time: down from 29% in
2010 to 23% in 2012.
Chart 20: Proportion of car-free days 2010 - 2012
Base: all visitors with a car (2012 = 919)
23
77
Car free
Used car
28
72
29
71
2010 2011 2012
(%)
In 2012 amongst those who had car-free days, these were due to:
Staying close to accommodation (75%)
Using public transport (14%)
Using other transport (11%)

33 Final Report Cornwall Visitor Survey 2012
Just over three quarters (76%) of visitors used the A30 with just under a quarter (24%)
using the A38 and 18% using the A39. Visitors who had used the roads were asked to
rate them for their ability to deal with the volume of traffic. The results in the chart
below show that the roads of Cornwall were positively rated with only a very slight
decrease in satisfaction over the busy summer months.
Chart 21: Rating the major Cornish roads
1 12 2 26
510
3
60 63
61
58
31 3226
36
Total Spring Summer Autumn/Winter
Very good
Fairly good
Fairly poor
Very poor
Don't know
Base: all respondents travelling by car (2012 = 919)
Thinking specifically about this trip, how would you rate the overall ability of the roads in Cornwall to deal with the volume of traffic? (%)

34 Final Report Cornwall Visitor Survey 2012
4.5 SPEND
Including comparable spend with previous trips, parking and public toilet
charges, and attitudes towards a visitor loyalty scheme and a ‘charged card’.
Spend while on a trip appears to be holding steady, despite the difficult financial
climate. Only around one in ten repeat visitors to Cornwall are planning to spend less
on accommodation, attractions and events and/or food and eating out. For the
majority of visitors the trip spend will be on a par with a previous comparable trip and
for between 19% and 31% trip spend will be more on the elements. See chart, below.
Chart 22: Spend compared to previous comparable trips to Cornwall
11 12 9
39
52 56
28
19
31
21 174
Accommodation Attractions and events Food and eating out
Not applicable
More
The same
Less
Base: all respondents who have visited Cornwall before (2012 = 968)
Compared to previous similar trips to Cornwall do you think you will be spending more money during your trip, about the same, or less on …? (%)

35 Final Report Cornwall Visitor Survey 2012
When asked what they thought a fair and reasonable chart for parking in Cornwall
would be, only 7% said free (see chart, below). A quarter of visitors said they believed
it should be 50p or under, per hour with half (49%) believing it should be between 51p
and £1.00 per hour. The average cost was 88p per hour.
Chart 23: Fair and reasonable charge for parking in Cornwall
Base: all visitors who used a car/ van as main transport (919)
7
26
49
8
37
Free
50p or under
£51p - £1.00
£1.01 - £1.50
£1.51 - £2.00
Don't know
Average 88p per hour
(%)

36 Final Report Cornwall Visitor Survey 2012
When asked what they thought would be a fair and reasonable charge for using good
quality public toilets, 42% of visitors believed they should be free of charge (see chart,
below). Just over half (51%) believed they should be below 50p. The average cost
came out at just 18p.
Chart 24: Fair and reasonable charge for using high quality public toilets
Base: all visitors (1,068)
42
51
3
03
Free
Under 50p
51p - £1.00
£1.01+
Don't know
Average 18p
(%)
Visitors were asked to give their opinions on the possibility of the introduction of an
Oyster Card, with the following explanation read out to them:
“Some holiday destinations are considering creating a card which can be
‘charged up’ with money (like an Oyster Card in London) and that could pay for
public transport, parking and leisure facilities during your trip within the region.
Readily available it would offer discounts of up to 25% on regular prices and
would not expire so could be used on return visits. Is this something you would
be interested in on future trips to Cornwall?”

37 Final Report Cornwall Visitor Survey 2012
Just under half (46%) of visitors would be interested in the proposed scheme, with
interest peaking in the younger age groups: around three in five aged under 44 would
be interested compared to just over one in five in the 65+ age group. See chart,
below.
Chart 25: Interest in Oyster-Card style chargecard
46 48
18
6360 59
48
41
29
Total UK Overseas 16‐24 25‐34 35‐44 45‐54 55‐64 65+
Base: all respondents (2012 = 1,068)
(% interested)
Amongst those who expressed an interest in the card, the average amount they would
charge to the card was given as £68. This ranged from £59 on average amongst
those on a short break, £65 on average amongst those on a secondary/ additional
holiday, and £99 on average for those on a main holiday.

38 Final Report Cornwall Visitor Survey 2012
Visitors were also asked to say whether they were interested in a visitor loyalty
scheme, with the following explanation read out to them:
“Visit Cornwall are looking at setting up a visitor loyalty scheme which will
support projects via donations to improve and protect the natural environment
and help community based learning initiatives. Is this something you would be
interested in?”
The results show a slightly lower level of interest than with the Oyster Card scheme,
with just over a third (34%) believing they would be interested in the visitor loyalty
scheme: again there was more interest amongst younger visitors than those in the
older age groups. See chart below.
Chart 26: Interest in visitor loyalty scheme
34 36
17
45 47
37 3531
27
Total UK Overseas 16‐24 25‐34 35‐44 45‐54 55‐64 65+
Base: all respondents (2012 = 1,068)
(% interested)

39 Final Report Cornwall Visitor Survey 2012
APPENDIX I – SURVEY QUESTIONNAIRE
B01212 (FINAL) 1
2012 CORNWALL VISITOR SURVEY
(B01212) FINAL
For office use: Sample point ref: (1) (2)
Case number (3) (4) (5) (6)
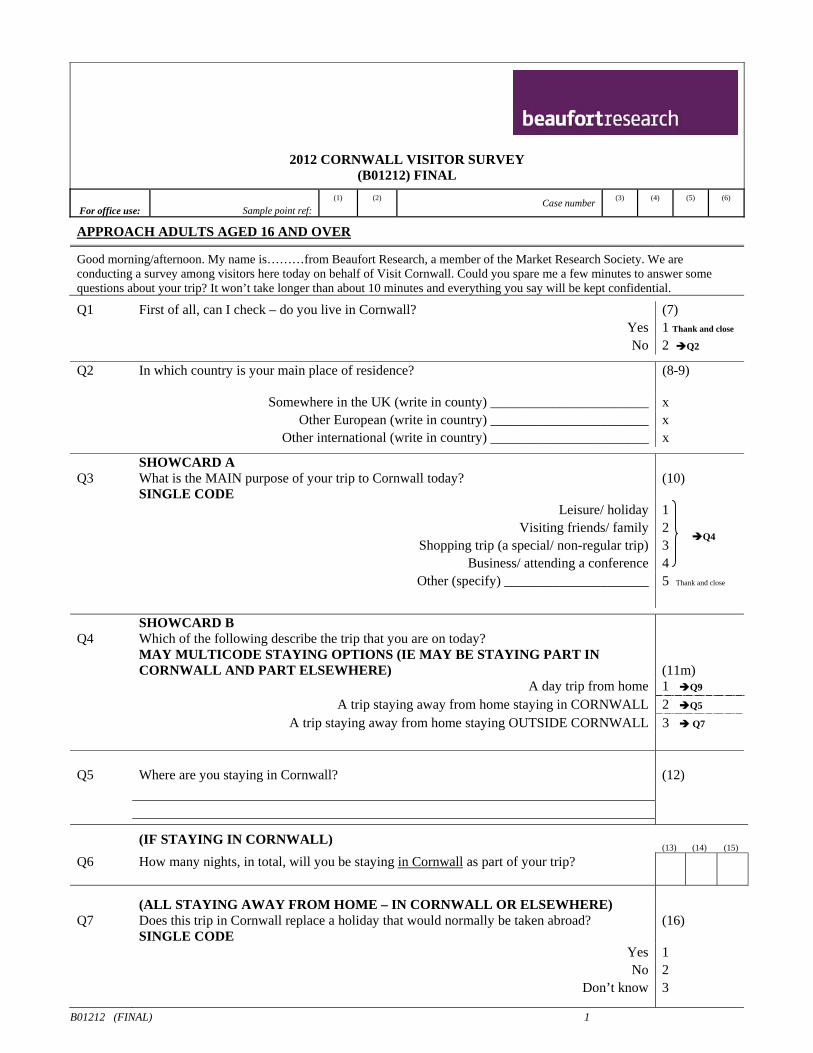
APPROACH ADULTS AGED 16 AND OVER
Good morning/afternoon. My name is………from Beaufort Research, a member of the Market Research Society. We are conducting a survey among visitors here today on behalf of Visit Cornwall. Could you spare me a few minutes to answer some questions about your trip? It won’t take longer than about 10 minutes and everything you say will be kept confidential.
Q1 First of all, can I check – do you live in Cornwall? (7) Yes 1 Thank and close No 2 Q2
Q2 In which country is your main place of residence? (8-9)
Somewhere in the UK (write in county) _______________________ x Other European (write in country) _______________________ x Other international (write in country) _______________________ x
Q3
SHOWCARD A What is the MAIN purpose of your trip to Cornwall today? SINGLE CODE
(10)
Leisure/ holiday 1 Visiting friends/ family 2 Shopping trip (a special/ non-regular trip) 3 Business/ attending a conference 4 Other (specify) _____________________ 5 Thank and close
Q4
SHOWCARD B Which of the following describe the trip that you are on today? MAY MULTICODE STAYING OPTIONS (IE MAY BE STAYING PART IN CORNWALL AND PART ELSEWHERE)
(11m)
A day trip from home 1 Q9 A trip staying away from home staying in CORNWALL 2 Q5
A trip staying away from home staying OUTSIDE CORNWALL 3 Q7 Q5
Where are you staying in Cornwall?
(12)
(IF STAYING IN CORNWALL) (13) (14) (15)
Q6 How many nights, in total, will you be staying in Cornwall as part of your trip?
Q7
(ALL STAYING AWAY FROM HOME – IN CORNWALL OR ELSEWHERE) Does this trip in Cornwall replace a holiday that would normally be taken abroad? SINGLE CODE
(16)
Yes 1 No 2 Don’t know 3
Q4

B01212 (FINAL) 2
SHOWCARD C Q8 What type of trip are you on? (17) Main holiday of the year 1 Secondary/ additional holiday 2 A short break 3 Other 4 Don’t know 5
ASK ALL Q9 Did you choose this trip to Cornwall in direct preference to another destination? (18) Yes 1 Q10 No 2 Q11
(IF YES) Q10 Where else did you consider for this trip? (19-22m)
Q11
ASK ALL Is this your first visit to Cornwall?
(23)
Yes 1 Q14 No 2 Q12
(IF BEEN TO CORNWALL BEFORE)
Q12 SHOWCARD D When was your last visit to Cornwall?
(24)
Within the last month 1 Within the last six months 2 Within the last twelve months 3 1 – 2 years ago 4 3 – 4 years ago 5 5 or more years ago 6 Can’t remember 7 Q13 Compared to previous similar trips to Cornwall do you think you will be spending more
money during your trip, about the same, or less on the following aspects?
Read out Spending LESS
Spending about the same
Spending MORE
Not applicable
Accommodation 1 2 3 4 (25)
Attractions and events 1 2 3 4 (26)
Food and eating out 1 2 3 4 (27)
ASK ALL SHOWCARD E
Q14 Who are you with on this trip? (28) Alone 1 Spouse/ partner 2 Family only 3 Friends only 4 Family and friends 5 With club/ organised group 6 Other x

B01212 (FINAL) 3
SHOWCARD F
Q15 Do you or does anyone in your immediate party have any of the following conditions or
impairments? You can read out the letter on this card.
MULTICODE. INCLUDES PROBLEMS WHICH ARE DUE TO OLD AGE
(31-32m)
A Mobility (e.g. wheelchair use) 1 B Sight (either partial sight or blind) 2 C Hearing 3 D Learning 4 E Long-term illness (e.g. cancer, arthritis)
Other5 6
No conditions or impairments 7 Don’t know 8 Refused 9
SHOWCARD G Q16a Q16b
Which of the following, if any, influenced your decision to visit Cornwall? MAY MULTICODE
And which one, if any, is your main reason for visiting Cornwall? SINGLE CODE
Qa ALL REASONS
Qb MAIN REASON
(33-36m) (39)
Because we’ve enjoyed previous visits 1 Because we’ve enjoyed previous visits 1
Word of mouth/ recommendation 2 Word of mouth/ recommendation 2
Because it’s easy to get to 3 Because it’s easy to get to 3
The beauty of the natural landscape 4 The beauty of the natural landscape 4
High quality beaches/ bathing 5 High quality beaches/ bathing 5
Because it’s peaceful, relaxing, quiet 6 Because it’s peaceful, relaxing, quiet 6 To undertake a specific activity, hobby, pastime 7 To undertake a specific activity, hobby, pastime 7
To visit a specific location or attraction 8 To visit a specific location or attraction 8
To attend a specific event or show 9 To attend a specific event or show 9 To visit family and friends (and/or their property) A To visit family and friends (and/or their property) A
To visit own property (e.g. house, caravan etc) B To visit own property (e.g. house, caravan etc) B
Because of an advert or special offer C Because of an advert or special offer C
Presence of Olympic Torch relay in Cornwall D Presence of Olympic Torch relay in Cornwall D
To get away from the Olympics E To get away from the Olympics E
South West Coast Path F South West Coast Path F
Other reason (specify) _________________ x Other reason (specify) _________________ x (37-38m) (40)
INFORMATION SOURCES Q17 SHOWCARD H Thinking now about information sources, prior to your trip in
Cornwall, where did you obtain your information about the trip? MAY MULTICODE (41-44m)
Previous visit 1 Recommendation 2 Newspaper advert 3 Q20 Travel agent 4 Tourist information centre 5 Brochure/ guidebook 6 Internet 7 Q18 Television programme 8 Didn’t obtain information prior to trip 9 Q20 Other (specify) _________________________________ x ( 45-46m)

B01212 (FINAL) 4
Q18 IF USED INTERNET (OTHERS GO TO Q20) Did you use the internet to source information ONLY or did you use it to source information AND to book accommodation/ car hire/ flights/ tickets etc.
(47)
Information sourcing ONLY 1 Information sourcing AND to book accommodation/ car hire/ flights/ tickets etc 2
SHOWCARD I Q19 Which of the following internet sources, if any, did you use when searching for information
about Cornwall? MAY MULTICODE
(48-51m)
Accommodation specific websites 1 Attraction specific websites 2 Activity specific websites (e.g. walking, surfing etc) 3 Social websites (e.g. Facebook, Twitter etc) 4 General tourism websites (e.g. visitcornwall.com etc) 5 Other (specify) ____________________________ x
ASK ALL Q20 During your trip, which of the following areas have you / will you gather information on?
MAY MULTICODE (52-55m)
Events 1 Attractions 2 Accommodation 3 Things to do 4 Places to go 5 Maps 6 Offers 7 Will not gather information during trip 8 Other (specify) __________________________________ x
Q21
IF DID NOT OBTAIN INFORMATION AT Q17 AND Q20 SKIP TO Q22 SHOWCARD J How easy did you find it to obtain information about your trip, both before and during the trip?
(56)
Very difficult 1 Difficult 2 Easy 3 Very easy 4
TRANSPORT ASK ALL Q22 SHOWCARD K
What was the main form of transport you used for the longest part of your journey to Cornwall during this trip?
(57)
Car/ van 1 Q23 Bus/ coach service 2 Organised coach tour 3 By plane/ air travel 4 Q29 Bicycle 5 Train 6 Other (specify) ______________________ x
Q23 (IF CAR/ VAN USER) Did you consider any alternative forms of transport for the longest part of your journey to Cornwall during this trip?
(58)
Yes 1 No 2

B01212 (FINAL) 5
(60) (61) (62)
Q24a What is the total number of days that you have stayed in Cornwall SO FAR on this trip?
(63) (64) (65)
Q24b And how many of these days would you estimate that you have NOT used your car? IF NO DAYS, SKIP TO Q26
(ALL WHO HAVE NOT USED CAR FOR AT LEAST ONE DAY) Of the days that you haven’t used your car/ van what proportion were spent… RECORD %. ENSURE ALL THREE ADD UP TO 100% (66) (67) (68)
Q25a On public transport (e.g. train, public bus)
(69) (70) (71)
Q25b Close to accommodation so no transport required
(72) (73) (74)
Q25c On other transport
Q26 Which of the following roads, if any, did you use to reach Cornwall for this trip? The A30, the A38 or the A39? MAY MULTICODE
(75-76m)
A30 1 A38 2 A39 3 Don’t know/ can’t remember 4
Q27 SHOWCARD L Thinking specifically about this trip, how would you rate the overall ability of the roads in Cornwall to deal with the volume of traffic?
(77)
Excellent 1 Fairly good 2 Fairly poor 3 Very poor 4 Don’t know 5
Q28 What do you think is a fair and reasonable hourly charge for car parking in Cornwall? IF “SHOULD BE FREE” WRITE IN 0000. DON’T KNOW = 9999 (78)
£
(79) £
(80) p
(81) p
Hourly charge…
Q29
ASK ALL And what do you think is a fair and reasonable charge for using public toilets that are high quality? DO NOT PROMPT. IF “SHOULD BE FREE” WRITE IN 0000. DON’T KNOW = 9999
(82) £
(83) £
(84) p
(85) p
Q30 Some holiday destinations are considering creating a card which can be “charged with money” (like an Oyster Card in London) and that could pay for public transport, parking and leisure facilities during your trip within the region. Readily available it would offer discounts of up to 25% on regular prices and would not expire so could be used on return visits. Is this something you would be interested in purchasing on future trips to Cornwall?
(86)
Yes 1 Q31 No 2 Q32 Don’t know 3 Q32
(IF YES) Q31 What value do you think you would charge on the card for a trip like your current trip? ENTER VALUE. IF RANGE CHOOSE MID POINT. DK = 999. DO NOT PROMPT. (87) (88) (89)
•
•
B01212 (FINAL) 6
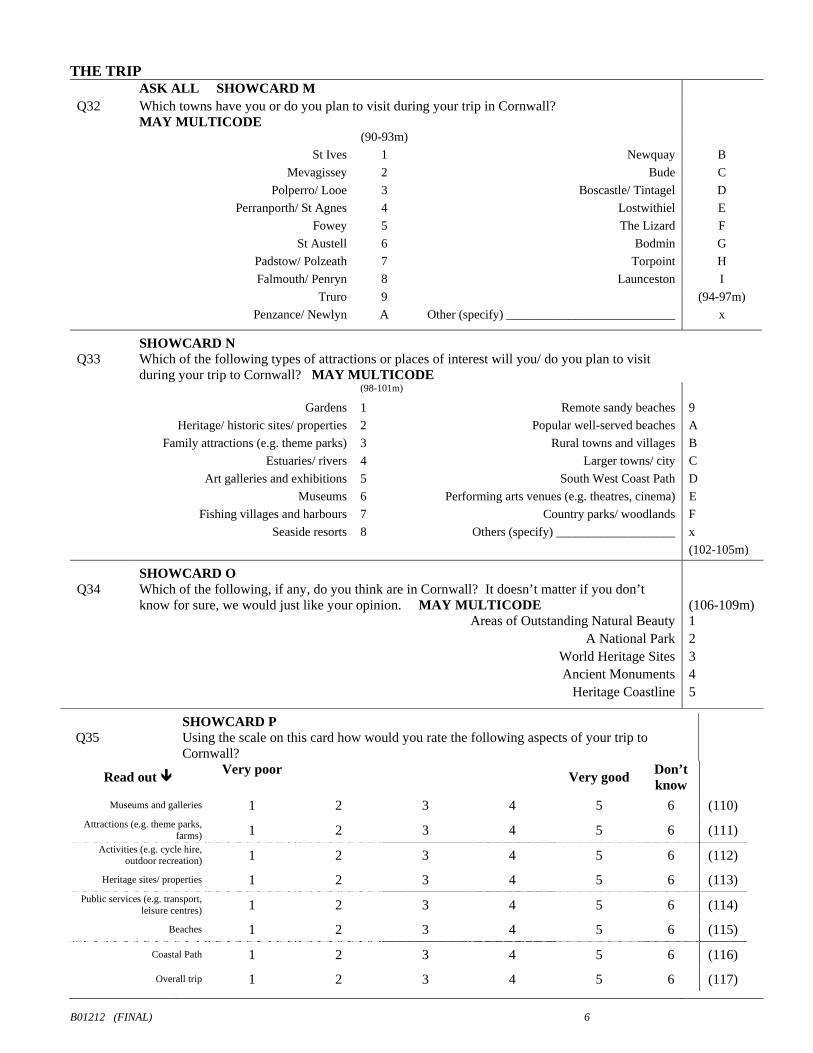
THE TRIP ASK ALL SHOWCARD M Q32 Which towns have you or do you plan to visit during your trip in Cornwall?
MAY MULTICODE
(90-93m)
St Ives 1 Newquay B
Mevagissey 2 Bude C
Polperro/ Looe 3 Boscastle/ Tintagel D
Perranporth/ St Agnes 4 Lostwithiel E
Fowey 5 The Lizard F
St Austell 6 Bodmin G
Padstow/ Polzeath 7 Torpoint H
Falmouth/ Penryn 8 Launceston I
Truro 9 (94-97m)
Penzance/ Newlyn A Other (specify) ___________________________ x
Q33
SHOWCARD N Which of the following types of attractions or places of interest will you/ do you plan to visit during your trip to Cornwall? MAY MULTICODE
(98-101m)
Gardens 1 Remote sandy beaches 9
Heritage/ historic sites/ properties 2 Popular well-served beaches A
Family attractions (e.g. theme parks) 3 Rural towns and villages B
Estuaries/ rivers 4 Larger towns/ city C
Art galleries and exhibitions 5 South West Coast Path D
Museums 6 Performing arts venues (e.g. theatres, cinema) E
Fishing villages and harbours 7 Country parks/ woodlands F
Seaside resorts 8 Others (specify) ___________________ x
(102-105m)
Q34
SHOWCARD O Which of the following, if any, do you think are in Cornwall? It doesn’t matter if you don’t know for sure, we would just like your opinion. MAY MULTICODE
(106-109m)
Areas of Outstanding Natural Beauty 1 A National Park 2 World Heritage Sites 3 Ancient Monuments 4 Heritage Coastline 5
Q35
SHOWCARD P Using the scale on this card how would you rate the following aspects of your trip to Cornwall?
Read out Very poor
Very good Don’t know
Museums and galleries 1 2 3 4 5 6 (110) Attractions (e.g. theme parks,
farms) 1 2 3 4 5 6 (111) Activities (e.g. cycle hire,
outdoor recreation) 1 2 3 4 5 6 (112)
Heritage sites/ properties 1 2 3 4 5 6 (113) Public services (e.g. transport,
leisure centres) 1 2 3 4 5 6 (114)
Beaches 1 2 3 4 5 6 (115)
Coastal Path 1 2 3 4 5 6 (116)
Overall trip 1 2 3 4 5 6 (117)

B01212 (FINAL) 7
Q36
SHOWCARD Q How likely would you be to recommend Cornwall as a place to visit to your friends and/or family? Please use a scale of 0 – 10 where 0 = “extremely unlikely” and 10 = “extremely likely”.
Extremely unlikely Extremely likely
0 1 2 3 4 5 6 7 8 9 10 (120)
Q37 SHOWCARD R To what extent has your trip to Cornwall lived up to your expectations?
(121)
Much better than expected 1 Better than expected 2 The same as expected 3 Worse than expected 4 Much worse than expected 5 Don’t know 6
Q38 READ OUT. Visit Cornwall are looking at setting up a visitor loyalty scheme which will support projects via donations to improve and protect the natural environment and help community based initiatives. Is this something you think you would be interested in?
(122)
Yes 1 No 2 Don’t know 3
SHOWCARD S Q39 Thinking generally, to what extent do you agree or disagree with the following statements?
Please use a scale of 0 – 10 where 0 = strongly disagree and 10 = strongly agree.
Strongly disagree Strongly agree
I like to try things that are new to me 0 1 2 3 4 5 6 7 8 9 10 (123)
I am happy to do my own thing regardless of what
others might think 0 1 2 3 4 5 6 7 8 9 10 (124)
I am prepared to take risks in order to get the most out of
life 0 1 2 3 4 5 6 7 8 9 10 (125)
I find it easy to justify buying expensive alternatives 0 1 2 3 4 5 6 7 8 9 10 (126)
Arts and culture are an important part of who I am 0 1 2 3 4 5 6 7 8 9 10 (127)
I have a fond liking for things that others might describe as
old fashioned 0 1 2 3 4 5 6 7 8 9 10 (128)
I would be prepared to pay more for a fashionable brand 0 1 2 3 4 5 6 7 8 9 10 (129)
Q40 Would you be happy to be recontacted in the future to take part in further research related to this
subject? Your details would only be passed on to Visit Cornwall and would not be used for the purposes of selling. IF YES TAKE EMAIL ADDRESS
(130)
Yes (email address) ________________________________________ 1 No 2

B01212 (FINAL) 8
CLASSIFICATION Now just a few details to check that our sample is representative
GENDER (140) STATUS IN HOUSEHOLD (145)
Male 1 * Chief Income Earner 1 Female 2 Other adult (aged 16+ or over) 2
AGE (141) WORKING STATUS OF RESPONDENT 16-19 1 (146)
20-24 2 Working full time (30+ hours per week) 1 25-34 3 Working part time (up to 29 hours per week) 2 35-44 4 Full time education 3 45-54 5 Retired 4 55-64 6 Not working 5
65 and over 7 Other 6
MARITAL STATUS (142) OCCUPATION OF CHIEF INCOME EARNER* (Last job if retired)
Married or equivalent 1 Single, never married 2 Actual job: ___________________________
Widowed/ divorced/ separated 3 Position/ grade: ________________________
CHILDREN (UNDER 16) IN HOUSEHOLD? (143) SOCIAL CLASS (147)
Yes 1 AB 1 C2 3 No 2 C1 2 DE 4
(IF YES) Ages of children in h/hold. (144m) 0-4 1
5-10 2 11-15 3
WHAT IS YOUR ETHNIC GROUP? SHOWCARD T White (148) Mixed Asian or Asian British Black or Black British Chinese or other
White British 1 White & Black Caribbean 4 Indian 8 Caribbean C Chinese F
White Welsh 2 White & Black African 5 Pakistani 9 African D Other G
Other white 3 White & Asian 6 Bangladeshi A Other Black E
Other mixed 7 Other Asian B
*The Chief Income Earner is the member of the household with the largest income, whether from employment, pensions, state benefits, investments or any other source. Either male or female.
Respondent name: _________________________________________________________________________
Address:____________________________________________ County (Country if outside UK):
Postcode:
(149)
(150)
(151)
(152)
(153)
(154)
(155)
Telephone number:
THANK RESPONDENT: CLOSE INTERVIEW: PROVIDE THANK-YOU LEAFLET
INTERVIEWER DECLARATION: I declare that I have conducted this interview in accordance with your instructions.
Signature: _________________________________________
D D M M Y Y INTERVIEWER NO. Accompanied: Supervisor
Date of interview:
(156)
(157)
(158)
(159)
1
(160)
2
(161) (162) (163) (164) (165)
Yes 1 No 2
_____ Month:
March 1 April 2 May 3 June 4
(166)
July 5 August 6 September 7 October 8 November 9 December A
Day of week: (167) Monday 1 Tuesday 2 Wednesday 3 Thursday 4 Friday 5 Saturday 6 Sunday 7
Weather (Mainly): (168)Sunny 1 Cloudy 2 Showers 3 Rain 4 Windy 5