B DPT ND NVTNT FND · th b Dpt nd nvtnt Fnd. Th r th b rltrl rtn Brd, th b rp nrn Brd nd th b Dpt...
28
QUEBEC DEPOSIT AND INVESTMENT FUND 'OND UA EPORT
Transcript of B DPT ND NVTNT FND · th b Dpt nd nvtnt Fnd. Th r th b rltrl rtn Brd, th b rp nrn Brd nd th b Dpt...

QUEBEC DEPOSITANDINVESTMENT FUND
'ONDUA EPORT
Bodies authorized by an act ofthe provincial legislatureto deposit moneys with theQuebec Deposit andInvestment Fund
Quebec Agricultural Marketing Board
Quebec Crop Insurance Board
Quebec Deposit Insurance Board
Quebec Pension Board

QUEBEC DEPOSITANDINVESTMENT FUND
SECOND ANNUAL REPORT
1967i
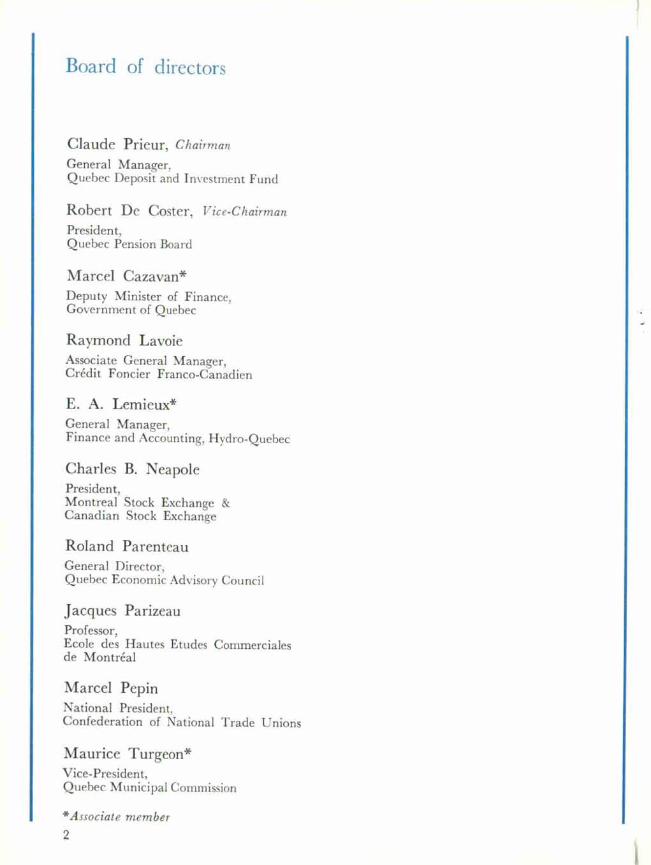
Board of directors
Claude Prieur, Chairman
General Manager,Quebec Deposit and Investment Fund
Robert De Coster, Vice - Chairman
President,Quebec Pension Board
Marcel Cazavan*Deputy Minister of Finance,Government of Quebec
Raymond LavoieAssociate General Manager,Crédit Foncier Franco-Canadien
E. A. Lemieux*General Manager,Finance and Accounting, Hydro-Quebec
Charles B. Neap°lePresident,Montreal Stock Exchange &Canadian Stock Exchange
Roland ParenteauGeneral Director,Quebec Economic Advisory Council
Jacques ParizeauProfessor,Ecole des Hautes Etudes Commercialesde Montréal
Marcel PepinNational President,Confederation of National Trade Unions
Maurice Turgeon*Vice-President,Quebec Municipal Commission
*Associate member
2

Management
General Manager
Claude Prieur
Investment Department
Bonds
Gérard H. Cloutier
Jean-Michel Paris
Stocks
Pierre Arbour
Etienne de Kosko, C.F.A.
Mortgages
Patrick O. Wells
Treasury Department
Jean-Marie Côté, C.A.
Secretariat
Gérard J. Blondeau
Law Department
Paul Martel,
3

4
2,e-ezec
CLAUDE PRIEURCHAIRMAN OF THE BOARDAND GENERAL MANAGER
Quebec City, March 14, 1968
The Honourable Paul Dozois,Minister of Finance,Government of Quebec.
Dear Sir:
In accordance with the provisions of the charterof the Quebec Deposit and Investment Fund,13-14 Elizabeth II, ch. 23, I am transmittingherewith our second annual report for the yearended December 31, 1967.
This report comprises an outline of investmentpolicy, a summary of our activities, and statementsof accounts duly verified by the ProvincialAuditor, along with the required relatedstatistical data.
Yours very truly,
5

Report of management
During its second financial year which closed on 315'December 1967, the assets of the Quebec Deposit andInvestment Fund grew from $183.3 million to $418.6 millionand its annual income rose from $5.1 million in 1966 to$18.7 million. The amounts on deposit reached a total of$412.7 million thus showing a growth of $234.2 million forthe period.
Three Provincial Government Boards were, during the year,authorized by acts of the Legislature to make deposits withthe Quebec Deposit and Investment Fund. These were theQuebec Agricultural Marketing Board, the Quebec CropInsurance Board and the Quebec Deposit Insurance Board.One of these bodies had made an initial deposit by the closeof the year.
The near totality of the funds at present on deposit is forthe account of the Quebec Pension Board. While the Fundwill in time have an increasing number of depositors, theQuebec Pension Board will in all likelihood remain thelargest depositor. It is interesting to note that the depositsof the Quebec Pension Board, during the first two years ofoperation, were approximately 12% greater than originallyforecast.
Review of economic conditions
The second year of operations of the Fund should be viewedagainst the background of a sixth consecutive year of expan-sion of the national economy. However, the rate of economicgrowth was somewhat less than that of the preceding yearand some tensions began to appear. The increase in realterms in the Gross National Product was only about a thirdof that achieved during 1966, investment in the privatesector barely kept pace Nvi t h the rate for the previous year,and corporate pro fits declined while prices and interestrates responded to inflationary pressures.
To avoid too sudden a slow-down in an already unstableeconomy the Canadian Government, with the co-operationof the Bank of Canada, pursued a policy of fiscal and6

monetary expansion for the greater part of the year,refraining on the one hand from taking fiscal measures thatwould have bridged a budget deficit of $740 million while onthe other allowing an unprecedented growth in the moneysupply.
To the extent that this policy aimed at facilitating govern-ment and corporate financing, it enjoyed a measure of suc-cess. Although high interest rates were paid, governmentsdid succeed in financing their exceptionally high deficitsand some corporations, particularly during the first half ofthe year, while perhaps not financing new investments, wereable to restore their liquidity. Meanwhile, investors, in-creasingly aware of inflationary trends, exhibited con-siderable prudence in their assessment of the market. Fromthe outset of the year the prospect of massive governmentborrowings warranted this cautious attitude inasmuch as theeconomy had hardly recovered from a period of creditrestriction.
Except during the first three months of 1967, long-termbond yields continued the rise begun in 1965. The averageyield on long-term Government of Canada bonds rose from5.76% at the beginning of 1967 to 6.54% at the close of theyear. This rise of 0.78% which followed rises of 0.36% in1966 and 041% in 1965, brought about a substantial declinein the market value of outstanding bonds. For example, asa result of the increase in yields during 1967, the price ofGovernment of Canada 53A% bonds due September lst1992 fell from 100 1/8 to 903/8, a loss of close to 10% inmarket value in one year.
This deterioration of financial markets was a reflection ofidentical trends in the United States resulting from con-tinued economic and financial uneasiness. The events ofthe year seem to bear witness to the increasing influence ofthe economy of the United States on that of Canada. In thisconnection, it has become evident that the fixed rate ofexchange for the dollar and the arrangements existing withthe United States concerning the level of Canadian reserves,have the effect of subordinating economic and monetary
7

policies in Canada to overriding continental influences.
Although the budgetary and fiscal problems of the UnitedStates together with their balance of payments complica-tions are at the root of current difficulties, other factors dohave their origin in Canada itself. During 1967, wage andother production cost increases unaccompanied by matchinggains in productivity resulted in lower margins. As highercosts were only partially matched by price increases,corporate earnings declined in the manufacturing industries.
In the stock markets, prices rose until the end of the thirdquarter of 1967, the Dow Jones and Montreal Stock Ex-change indices showing a rise of approximately 25% overthe lows of October of the previous year. This improvementreflected a general expectation that, after the monetarycrisis of 1966, a climate more favourable to business wouldprevail beginning with the second half of 1967. In the sum-mer months it became increasingly evident that the renewalin economic activity would not be accompanied by pro-portionate increases in corporate earnings. Furthermore,corporate financing proved to be more expensive than in1966. By mid-September, the uncertainty which thisdeveloping situation generated caused stock market pricesto drop across the board. In Canada, some shares droppedas much as 40% in price. In the last few weeks of the yeara renewal of interest had a stabilizing effect on stock marketprices in Canada and a modest recovery of the Dow Jonesindex was recorded in the United States.The financial market in the Province of Quebec, while a partof the overall Canadian market, was more adversely affectedduring 1967. The magnitude of this phenomenon can beclearly seen in the steadily widening spread, during the pastfew years, between yields on long-term Quebec bonds andthose of Canada or Ontario. These spreads in yieldsbetween long-term Canada and Quebec bonds fluctuatedbetween 0.46% and 0.61% in 1965, between 0.45% and1.06% in 1966 and between 0.77% and 1.27% in 1967. Acomparison of yields between Quebec bonds and Ontariobonds reveals, for the same years, fluctuations in spreads of8

0.235 to 0.365, of 0.175 to 0.675 and of 0.375 to1.035. In order to take up Quebec Provincial bonds themarket has, therefore, exacted an ever widening yieldpremium in recent years. This is evidence of a continualdecline in the Canadian demand for Quebec bonds, a declineremarkable not only for its sharpness but also for its disturb-ing implications for the future.
This situation can be traced in part to the high rate ofborrowing by the Government of the Province of Quebec.Over a seven year period the per capita debt of the Pro-vince rose from $216 to $773 while that of Ontario rose from$516 to $688. In absolute terms, the direct and indirect debtof the Province of Quebec increased from $1.1 billion to $4.5billion. The placing of these $3.4 billion of new debt ofwhich more than one third was for the account of Hydro-Quebec, had the effect of progressively saturating theportfolios of a growing number of lending institutions.
The onus for the present unsatisfactory situation cannot beentirely attributed to the volume and frequency of provincialborrowings. In fact, it is beyond question that the discussionsand polemics on constitutional matters in the Province, theuncertainty regarding the future political status of Quebecand the publicity that these questions have received continueto maintain a climate of unrest among investors. At the mo-ment, however, this uncertainty appears to be limited toCanadian investors as witnessed by the relatively narrowspread of about 0.155 existing until now in the UnitedStates market between the yields of Quebec bonds and thoseof Ontario.
While it is impossible to measure the extent of this malaise,it is equally impossible not to take cognizance of it as itbecomes increasingly manifest in its effects on the market.
Investment policy
On the basis of actuarial studies and past experience theFund anticipates that the amounts on deposit for the accountof its principal depositor, the Quebec Pension Board, will
9

continue to increase until 1990, or for the next 22 years.Mindful that the Fund is but a trustee for its depositors, ittherefore pursues an investment policy oriented towards theforegoing long-term needs.
In the bond market the Fund continued during 1967 itsprogramme of acquiring long-term bonds of high quality.It also lent considerable support to the direct and indirectborrowings of the Province. During the year the Fund alsoparticipated substantially in long-term financing by Muni-cipalities and School Boards; in this connection a specialeffort was macle to achieve a distribution of these investmentsthroughout the various regions of the Province. In the fieldof corporate bonds, the Fund stepped up its investmentsin issues of prime quality; apart from geographic andindustrial diversification, the extent of the contribution tothe economic development of the Province remained adetermining factor in the selection of these investments.
During 1967 the Fund began to acquire stock. The purposein establishing such a portfolio was to participate in thegrowth of the economy while at the same time protecting toa certain extent a part of its assets against the erosion of thepurchasing power of money.
Continuing its policy of diversification of investments, theFund took the first steps in the commercial and industrialreal estate and mortgage fields. At the close of the year, adepartment had been formed to begin operations andvarious transactions were under negotiation.
Investment operationsDuring the second financial year the bond portfolio almostdoubled, increasing in nominal value from $159,880,500 to$331,504,500 while its yield increased from 6.44% to6.67%.A significant key to the operation of the Fund in the bondfield was the market's reaction to the seven new issues ofQuebec and Hydro-Quebec bonds in Canada during 1967.Conscious of its close identity with the Province, the Fund,10

while adhering to its long-term investment policy, was ableto give solid support by purchasing close to 10% of thesenew issues in Canada. The Fund, by its trading operations,was also active, from time to time, in helping to maintaina more orderly market in Quebec bonds.
In July and August the Fund, believing the North Americanfinancial outlook to be uncertain, increased its short-termholdings. Further, during September, anticipating thedeterioration of the financial markets which in fact beganin the fall, the Fund took advantage of the favourablemarket still prevailing to sell Government of Canada bonds,thus seeking to move into a more defensive position in case apossible financial crisis might jeopardize the borrowingprogramme of the Province. These operations were not onlyprofitable but proved by events to have been most opportune.These steps contributed to a considerable improvement inthe liquid position of the Fund. Short-term holdings reached$47,975,000 by year end but of this amount more than halfwas already earmarked for delayed delivery transactions.
At the close of 1967, direct and indirect long-term bonds ofthe Province for a total of $246,778,000 were held by theFund. This represented 74.4% of the total long-term bondportfolio compared with 77.3% for the previous year. Theaverage yield in this category increased from 6.44% to6.63% during the period.The holdings of Municipal and School bonds increasedconsiderably during the year, their total moving from$16,630,500 to $39,556,500 while the average yield on theserose from 6.91% to 7.07%. This category represented 11.9%of the bond portfolio compared with 10.4% the previousyear. These holdings included bonds of 72 Municipalitiesand 30 School Boards comprising in all 158 issues. The Funddid not limit its activities to purchasing new issues buttraded actively in municipal bonds with dealers who wishedto replenish their inventories. This made it possible for theFund to participate in a larger number of new issues and todistribute over a period bonds that the market could nothave absorbed at the time of issue.
11

The Fund's activity in the corporate bond field was limitedto the first half of the year because new issues suitable for itsportfolio were largely confined to that period. Holdings bythe Fund of this category of bonds reached $21,425,000 atthe close of the year and the yield on these assets was6.86%. It should be pointed out that bond issues secured byprovincial grants, reported in the amount of $9,770,000,are almost exclusively hospital bonds.
The stock operations of the Fund were begun in February1967 with the object of acquiring a core of good qualitystocks with a defensive potential. In selecting these stocks,the Fund followed a policy of avoiding as much as possiblecyclical industries such as pulp and paper, the buildingindustry, agricultural and industrial machinery, etc., suchindustries being particularly vulnerable at the time. Thepurchases were scheduled in such a way as to take advantageof stock market swings. Some preference was shown forQuebec based companies of prime quality, especially bankstocks. It should be pointed out that the Fund acquired alimited number of preferred convertible stocks whichimprove the stability and yield of the portfolio.
The stock portfolio of the Fund totalled $47,551,487 by yearend and showed an expected average yield of 3.74%. Publicutility stocks represent 24.4% of the portfolio and includetelephone, natural gas and electric power companies. Theseindustries usually enjoy regular growth at a rate higher thanthat of the economy as a whole. Financial institutions holdsecond place in the stock portfolio and account for 21.4%of the total. Changes introduced into the Bank Act in 1967seem to offer greater scope and promise for the bankingbusiness. Next in order of importance in the portfolio aremines and metals accounting for 18.9% of the total ; thesebasic industries justify their place in the portfolio in viewof their long-term growth prospects. Finally 12.8% of theportfolio consists of gas and oil stocks, a promising segmentof the Canadian economy.12

The year's resultsThe gross earnings of the Fund, expressed as a yield on theaverage balances on deposit during the year, increased from6.22% in 1966 to 6.23% in 1967. This slight increase wasrecorded despite the acquisition of $47,551,487 in stock onwhich the yield is naturally lower than that on bonds. Therewas however a somewhat greater improvement in the netyield which rose from 5.99% in 1966 to 6.08% in 1967. Thiswas made possible by a relative reduction in the incidenceof operating costs of the Fund which dropped from 0.23%in 1966 to 0.15% in 1967.
Demand deposits with the Fund averaged $26,527,756during the year. Interest paid on these demand deposits inthe amount of $1,248,197 was at a rate fluctuating between4.10% and 6.03% with an average for the year of 4.71%.Notice deposits which averaged $274,048,573 during theyear, earned revenues of $17,030,412 equivalent to aninterest rate of 6.21%. The Fund has thus paid interest at arate of 6.08% on its total deposits in 1967 as compared with5.99% during the preceding year.
The Fund is an active trader in the security markets. In thebond section, trading operations are undertaken to improvethe yield or the quality of the securities held, to realize atrading profi t and, in some situations, to help maintain anorderly market in Quebec bonds. Stock trading aims atimproving book values. The bond and stock trading opera-tions produce at times a profit and at times a loss. Therecorded loss at year end was $13,067 bringing theaccumulated deficit in these operations to $158,503.
The Board of Directors
On the 4th April 1967, the Fund learned with great regret ofthe death of Mr. A. Hamilton Bolton who had been a mem-ber of the Board since its inception. His knowledge of thestock market and his profound understanding of economicmatters earned him the highest respect of the members ofthe Board. His loss was sincerely regretted.
13

To succeed Mr. Bolton on the Board, the Lieutenant-Governor in Council, on July 18, 1967, appointed Mr.Charles B. Neapole, President of the Montreal andCanadian Stock Exchanges.
Staff
As was forecast in last year's annual report, the staff hasnearly doubled during 1967. At the close of the year therewas a total of 38 employees including 9 at managementlevel. The Fund will see a further expansion in its staff in thecoming year, though at a slower pace, so as to broadenagain its investment activities.It is recognized that for its successful operation, the Fundrelies heavily on the devotion and loyalty of the staff andthe Board extends its thanks and appreciation for theircontinuing co-operation.
On behalf of the Board of Directors,
Chairman.Quebec City, March 8, 1968.
14

FINANCIAL STATEMENTS
15
Quebec Deposit and Investment Fund
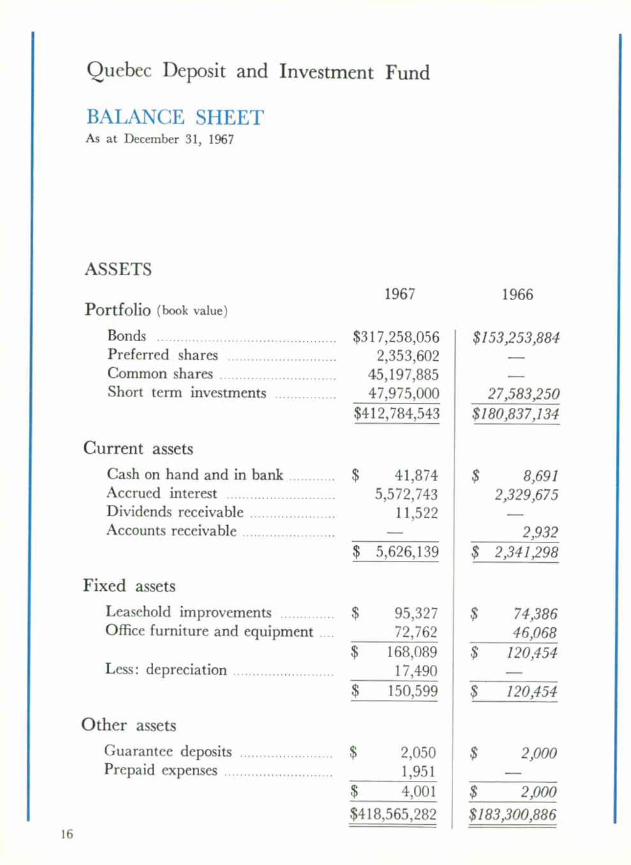
BALANCE SHEETAs at December 31, 1967
ASSETS
1967 1966Portfolio (book value)
Bonds $317,258,056 $153,253,884Preferred shares 2,353,602Common shares 45,197,885Short term investments 47,975,000 27,583,250
$412,784,543 $180,837,134
Current assets
Cash on hand and in bank $ 41,874 $ 8,691Accrued interest 5,572,743 2,329,675Dividends receivable 11,522Accounts receivable 2,932
$ 5,626,139 $ 2,341,298
Fixed assets
Leasehold improvements $ 95,327 $ 74,386Office furniture and equipment 72,762 46,068
$ 168,089 $120,454Less: depreciation 17,490 —
$ 150,599 $ 120,454
Other assets
Guarantee deposits $2,050 $ 2,000Prepaid expenses 1,951
$ 4,001 $ 2,000
$418,565,282 $183,300,88616

LIABILITIES1967 1966
Current liabilities
Accounts payable $ 28,494 $ 14,534Dcmand deposits 43,709,894Accrued interest on demand
deposits 317,707Interest payable on notice deposits 5,680,507 4,916,788
$ 49,736,602 $ 4,931,322
Notice deposits
Depositor's account $368,987,183 $178,515,000Profit (loss) on sale of investments (158,503) (145,436)
$368,828,680 $178,369,564
$418,565,282 $183,300,886
17

STATEMENT OF INCOME AND EXPENDITURE
for the year ended December 31, 1967
Income1967 1966
Interest on bonds , ••• $ 16,144,209 $ 4,064,734Dividends on shares 688,941Net interest on short term
investments 1,887,845 1,039,481Sundry 12,904 2,931
$ 18,733,899 $ 5,107,146
Expenditure
Directors' fees and expenses $ 5,033 7,626Salaries 276,789 116,685Travelling expenses 11,333 2,896Legal and professional fees 6,636 18,122Rent 48,828 17,083Bank charges 31,356 10,366Office equipment rental 14,193 316Electricity, telephone and
insurance 11,593 4,038Financial publications and services 7,764 2,453Stationery and printing 12,235 5,239Depreciation 17,490Other expenses 12,040 5,534
$ 455,290 $ 190,358
Net operating income $ 18,278,609 $ 4,916,788Less:
Interest on demand deposits 1,248,197Net income $ 17,030,412 $ 4,916,788
18
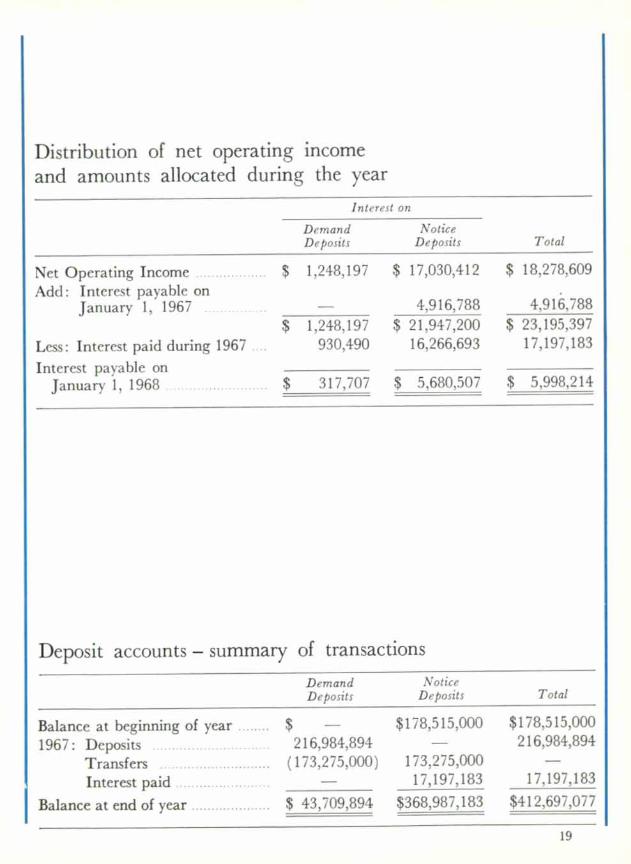
Distribution of net operating income
and amounts allocated during the year
Interest on
TotalDemandDeposits
NoticeDeposits
Net Operating Income $ 1,248,197 $ 17,030,412 $ 18,278,609Add: Interest payable on
January 1, 1967 4,916,788 4,916,788$ 1,248,197 $ 21,947,200 $ 23,195,397
Less: Interest paid during 1967 930,490 16,266,693 17,197,183
Interest payable onJanuary 1, 1968 $ 317,707 $ 5,680,507 $ 5,998,214
Deposit accounts — summary of transactions
DemandDeposits
NoticeDeposits Total
Balance at beginning of year $ $178,515,000 $178,515,000
1967: Deposits 216,984,894 — 216,984,894
Transfers (173,275,000) 173,275,000Interest paid 17,197,183 17,197,183
Balance at end of year $ 43,709,894 $368,987,183 $412,697,077
19
Auditor's report
In accordance with section 43, 13-14 Elizabeth II, chapter23, I have examined the balance sheet of the Quebec Depositand Investment Fund as at December 31, 1967 and thestatement of income and expenditure for the period endedon that date. My examination included a general review ofthe accounting procedures and such tests of accountingrecords and other supporting evidence as I considerednecessary in the circumstances.In my opinion, the operations of the Fund during the yearhave been carried out in conformity with the law, and theaccompanying balance sheet and statement of income andexpenditure present fairly the financial position of theQuebec Deposit and Investment Fund as at December 31,1967 and the results of its operations for the period endedon that date, in accordance with generally accepted ac-counting principles applied on a basis consistent with thatof the preceding year.
Gustave-E. Tremblay, C.A.,Provincial Auditor.
Quebec City, February 29, 1968.
20

STATISTICAL INFORMATION
Yield on deposits
AmountYield equivalence
on average deposits (1)
Gross Income $ 18,733,899 6.23%Expenses 455,290 0.15%Net Operating Income $ 18,278,609 6.08%
( 1 ) Average deposits were $300,576,329.
Average interest rate paid on deposits
AverageDeposits
Interestpaid or due
Averageyield
Demand Deposits $ 26,527,756 $ 1,248,197 4.71%Term Deposit (1)
Notice Deposits 274,048,573 17,030,412 6.21%Total $300,576,329 $ 18,278,609 6.08%
(I) No Term Deposit received during the year.
21

Bond portfolio summary as at December 31, 1967
Face ValueAmount Percent-
Government of Canada $ 13,975,000 4.2'
Government of Quebec and Guarantees 246,778,000 74.4'
Guaranteed by Provincial Grants 9,770,000 3.0'
Municipal and School 39,556,500 11.9'
Corporate 21,425,000 6.5'
$331,504,500 100.0'
(I) Investments in bonds are taken at amortized cost.
(2)Where no active market exists, bonds are valued on a yield basis.
(3)Weighted average of yields as at December 31, 1967.
22

BookValue ( I )
MarketValue (2)
Yield (3)
$ 13,056,349 $ 11,869,625 5.807%
236,715,135 209,691,153 6.632%
9,529,231 8,649,598 6.911%
36,886,958 33,516,435 7.073%
21,070,383 19,651,256 6.863%
$317,258,056 $283,378,067 6.673%
23

Stock portfolio summary as at December 31, 1967
BookValue (I)
Preferred Shares $ 2,353,602
Common Shares
Public Utilities 11,622,688
Banks and Financial 10,179,243
Food, Beverages and Services 3,794,639
Machinery and Equipment 3,277,950
Oil and Gas 6,104,273
Mines and Metals 9,006,312
Forest Products 1,212,780
$ 47,551,487
(I) Investment in stocks are taken at cost.
( 2 ) The excess of book value over market value, in the amount of$1,357,631, does not take into account a net cumulative profit of$740,328 realized on sale of such securities.
24
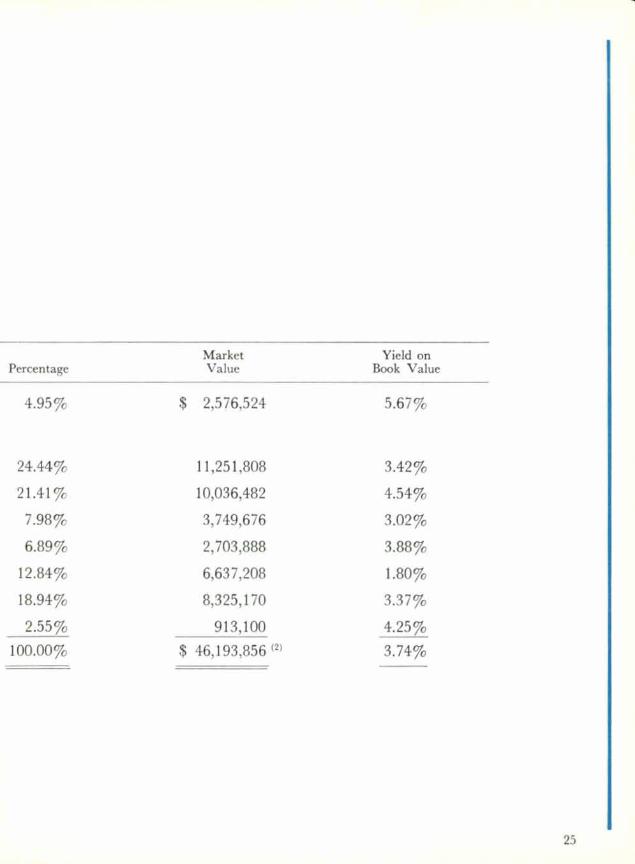
PercentageMarket Yield onValue Book Value
4.95% $ 2,576,524 5.67%
24.44% 11,251,808 3.42%
21.41% 10,036,482 4.54%
7.98% 3,749,676 3.02%
6.89% 2,703,888 3.88%
12.84% 6,637,208 1.80%
18.94% 8,325,170 3.37%
2.55% 913,100 4.25%
100.00% $ 46,193,856 (2) 3.74%
25