B Corp Index
1
B Corps create higher quality jobs and improve quality of life in communities both today and for future generations. Few ordinary businesses measure impact, let alone use a common yardstick, making it difficult to know the relative value they create for society Grew jobs by more than 5% Paid bonuses to non-executive employees over the prior year Cover at least some of health insurance premiums for individuals Extend health benefits to part time and flex time employees† Fund a 401(k) plan for employees Have >5% of company owned by non-executive employees >50% of employees provided paid professional development opportunities† Have >50% products/services that directly address a social issue (eg. microfinance, education) Have >25% of significant suppliers that are certified to meet specific social/environmental criteria† Patronize >10% of significant suppliers from low-income communities† Have >50% of products or input materials that are certified to meet fair trade sourcing practices Have >40% of significant suppliers that are local independent businesses Are majority owned by women or ethnic minorities Have >30% of management from previously excluded populations† Donate >10% of profits or 1% sales to charitable organizations† Allow >20 hrs/year of paid time off for community service Actively recycle at least one output material Have >50% products/services that directly address an environmental issue (eg. energy efficiency technology, forest conservation) Derive >50% of revenues from products made from sustainable input materials (eg. recycled paper, reclaimed metal products) Work in at least one facility that meets green building standards† Specify that >75% printed materials have recycled paper content, FSC certified paper, or soy-based inks Reduced energy usage relative to revenues Generate renewable energy on site Have >25% of their revenue from products that have gone through a Life Cycle Assessment in the last 3 years Have >25% of their transport vehicles or outsourced fleet that are clean or low-emissions vehicles Have a board or advisory body that includes at least one independent member† Regularly share company’s financial info with all full time employees† Evaluate their managers in writing on social and environmental goals Help their industry create social and environmental standards †For definitions, sources, and more metrics, please visit www.bcorporation.net/b-corp-index *Ordinary Businesses represents available data on U.S. small businesses Comparable Metrics on Corporate Impact B Corps B Corps % of total points on the B Impact Assessment % companies for whom this is true OSBs 2 OSBs 2 OBs 2 Workers 56% 48% Job Creation Compensation, Benefits & Training Worker Ownership Work Environment 33% 29% 56% 49% 38% 31% 71% 60% 52% 39% ? 55% 38% ? 87% 56% 26% † 65% 59% ? 45% 51% ? 28% 27% 21% 5% ? 22% ? ? 29% 11% ? 26% 22% ? 14% 19% ? 37% 38% ? 35% 17% 28% † 41% 32% ? 32% 19% ? 19% 8% ? 95% 88% 45% † 16% ? ? 31% ? ? 32% 30% ? 64% 39% ? 26% 27% ? 22% 15% ? 20% 19% ? 32% 15% ? 66% 71% ? 69% 73% ? 33% 23% ? 72% 54% ? 72% 56% 73% 63% 21% 38% 58% 49% 53% 50% 31% 28% 42% 33% 29% 8% 61% 47% 36% 32% 56% 51% 45% 40% Community Products & Services Suppliers & Distributors Local Involvement Diversity Civic Engagement & Giving Corporate Accountability Transparency Environmental Products & Services Land, Office, Plant Inputs Outputs Suppliers & Transportation Community 62% 45% Environment 59% 38% Governance 73% 57% B Corp INDEX 84 105 Total Score: Total Score: Certified B Corporations Other Sustainable Businesses Median score of 1,941 other companies that have voluntarily completed the B Impact Assessment Median score of 504 B Corps (200 pts avail) Certified B Corps score 25% higher than other sustainable businesses on the B Impact Assessment, which assesses overall corporate impact on workers, community, and the environment via 200+ metrics.
Transcript of B Corp Index
2012 B Corporation Annual Report 2012 B Corporation Annual Report 1211
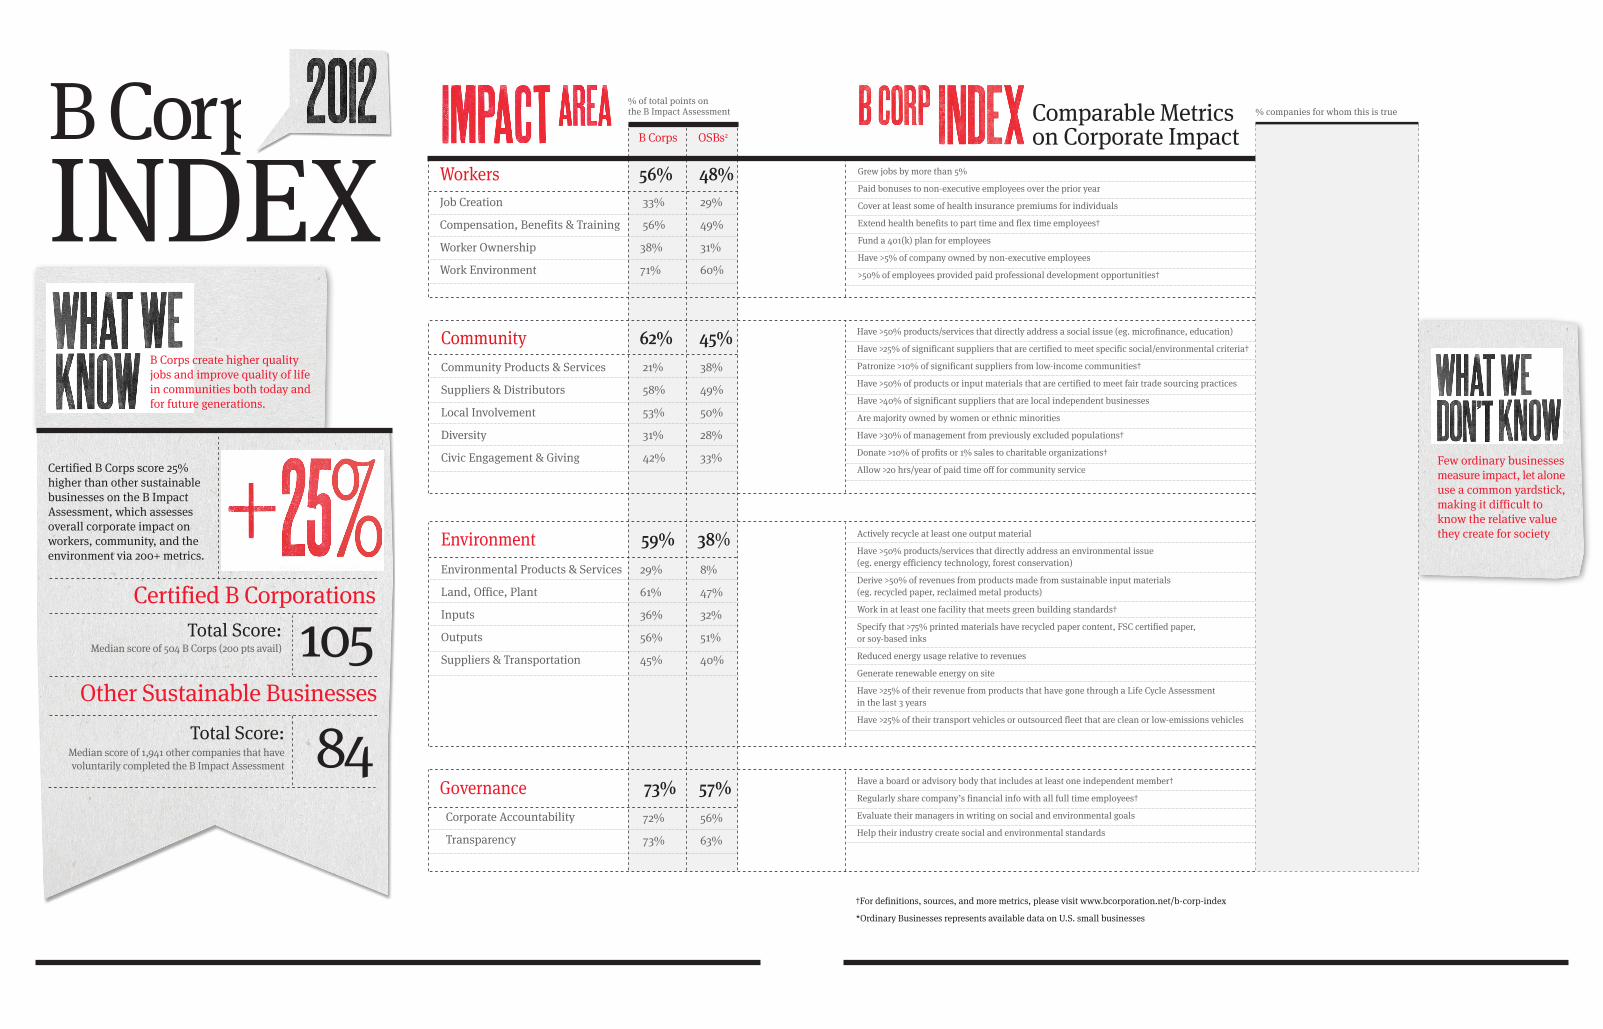
B Corps create higher quality jobs and improve quality of life in communities both today and for future generations.
Few ordinary businesses measure impact, let alone use a common yardstick, making it difficult to know the relative value they create for society
Grew jobs by more than 5%
Paid bonuses to non-executive employees over the prior year
Cover at least some of health insurance premiums for individuals
Extend health benefits to part time and flex time employees†
Fund a 401(k) plan for employees
Have >5% of company owned by non-executive employees
>50% of employees provided paid professional development opportunities†
Have >50% products/services that directly address a social issue (eg. microfinance, education)
Have >25% of significant suppliers that are certified to meet specific social/environmental criteria†
Patronize >10% of significant suppliers from low-income communities†
Have >50% of products or input materials that are certified to meet fair trade sourcing practices
Have >40% of significant suppliers that are local independent businesses
Are majority owned by women or ethnic minorities
Have >30% of management from previously excluded populations†
Donate >10% of profits or 1% sales to charitable organizations†
Allow >20 hrs/year of paid time off for community service
Actively recycle at least one output material
Have >50% products/services that directly address an environmental issue (eg. energy efficiency technology, forest conservation)
Derive >50% of revenues from products made from sustainable input materials (eg. recycled paper, reclaimed metal products)
Work in at least one facility that meets green building standards†
Specify that >75% printed materials have recycled paper content, FSC certified paper, or soy-based inks
Reduced energy usage relative to revenues
Generate renewable energy on site
Have >25% of their revenue from products that have gone through a Life Cycle Assessment in the last 3 years
Have >25% of their transport vehicles or outsourced fleet that are clean or low-emissions vehicles
Have a board or advisory body that includes at least one independent member†
Regularly share company’s financial info with all full time employees†
Evaluate their managers in writing on social and environmental goals
Help their industry create social and environmental standards
†For definitions, sources, and more metrics, please visit www.bcorporation.net/b-corp-index
*Ordinary Businesses represents available data on U.S. small businesses
Comparable Metrics on Corporate ImpactB Corps B Corps
% of total points on the B Impact Assessment % companies for whom this is true
OSBs2 OSBs2 OBs2
Workers 56% 48%Job Creation
Compensation, Benefits & Training
Worker Ownership
Work Environment
33% 29%
56% 49%
38% 31%
71% 60%
52% 39% ?55% 38% ?87% 56% 26%†
65% 59% ?45% 51% ?28% 27% 21% 5% ?
22% ? ?29% 11% ?26% 22% ?14% 19% ?37% 38% ?35% 17% 28%†
41% 32% ?32% 19% ?19% 8% ?
95% 88% 45%†
16% ? ? 31% ? ?
32% 30% ?
64% 39% ?
26% 27% ?22% 15% ?
20% 19% ?
32% 15% ?
66% 71% ?69% 73% ?
33% 23% ?
72% 54% ? 72% 56%
73% 63%
21% 38%
58% 49%
53% 50%
31% 28%
42% 33%
29% 8%
61% 47%
36% 32%
56% 51%
45% 40%
Community Products & Services
Suppliers & Distributors
Local Involvement
Diversity
Civic Engagement & Giving
Corporate Accountability
Transparency
Environmental Products & Services
Land, Office, Plant
Inputs
Outputs
Suppliers & Transportation
Community 62% 45%
Environment 59% 38%
Governance 73% 57%
B Corp INDEX
84
105Total Score:
Total Score:
Certified B Corporations
Other Sustainable Businesses
Median score of 1,941 other companies that have voluntarily completed the B Impact Assessment
Median score of 504 B Corps (200 pts avail)
Certified B Corps score 25% higher than other sustainable businesses on the B Impact Assessment, which assesses overall corporate impact on workers, community, and the environment via 200+ metrics.


![INDEX [] · index gwb series section b:6 473.10 ... 587.50 ..... b:6-39 587.55 ...](https://static.fdocuments.net/doc/165x107/5abf22c27f8b9aa15e8daabe/index-gwb-series-section-b6-47310-58750-b6-39-58755-.jpg)