B cell phenotyping in Common Variable...
69
B cell phenotyping in Common Variable Immunodeficiency B L Ferry Clinical Immunology The Churchill Hospital
Transcript of B cell phenotyping in Common Variable...

B cell phenotyping in Common Variable Immunodeficiency
B L Ferry Clinical Immunology
The Churchill Hospital

Common Variable immunodeficiency
Disorders
CVID


HSC
Plasmacyte
TNKCLP
Myeloid
Pro B Pre B
HIGM Switched BIgGIgAIgECD40L
CD40
AICDA UNG HIGM4AICDAλC
CVIDICOS
XLABTK
Mature B
Λ5 V preB
µ
Bone Marrow
IgM
IgD
Autosomal recessive agammaλ5 Ig α/β µ BLNK LRRC8
Norma NosFew
B mem
Adapted from : A Fischer Nature Immunology 2004

HSC
TNKCLP
Myeloid
Pro B Pre B
Plasmacyte
HIGM Switched BIgGIgAIgECD40L
CD40
AICDA UNG HIGM4AICDAλC
CVIDICOS
XLABTK
Mature B
Λ5 V preB
µ
Bone Marrow
IgM
IgD
Autosomal recessive agammaλ5 Ig α/β µ BLNK LRRC8
Norma NosFew
CD34, CD5, CD10, CD19, CD20 …. IgG, IgA or IgE, CD38 , CD27CD148
Adapted from : A Fischer Nature Immunology 2004

HSC
TNKCLP
Myeloid
Pro B Pre B
Plasmacyte
HIGM Switched BIgGIgAIgECD40L
CD40
AICDA UNG HIGM4AICDAλC
CVIDICOS
ImmunoglobulinProduction
IgM
Mutated IgM
IgG
IgA
AR agammaglobulinaemiaΜ, Ig α, Λ5, BLNK, LRRC8
XLABTK
0
0
0
0
0-low
0-low
0-low
0-low
Low
Low
Low
Low
N-hi
Low
0
0
N-hi
0
0
0
N-hi
biased
0-low
0
N-hi
N
0-low
0-low
Mature B
Λ5 V preB
µ
Bone Marrow
IgM
IgD
Adapted from : A Fischer Nature Immunology 2004

Susceptibility to encapsulated Bacteria
• H Influenzae
• S pneumoniae

Sinusitis
Pneumonia
Otitis Media

CVID • Frequent, Bacterial Respiratory Infections, • Chronic lung disease, Bronchiectasis is common
• Gastrointestinal , nodular lymphoid hyperplasia• Splenomegaly • Malignancies • Autoimmune phenomena : AIHA, ITP

Criteria for CVID• Male /female• > 2 years• Poor responses to vaccines • Serum IgG and IgA are > 2 SD below mean
for age• Exclude other 2nd Ab deficiencies

Spectrum of CVIDSpectrum of CVID
• Estimated incidence 1 in 50,0000• Aetiology unknown (multiple)
• 2nd/3rd/4th decades of life• Serum IgM can be normal in 50% • Abnormalities in T cells occur in 30-40%
cases

HSC
TNKCLP
Myeloid
Pro B Pre B
Plasmacyte
HIGM Switched BIgGIgAIgECD40L
CD40
AICDA UNG HIGM4AICDAλC
CVIDICOS
XLABTK
Mature B
Λ5 V preB
µ
Bone Marrow
IgM
IgD
Autosomal recessive agammaλ5 Ig α/β µ BLNK LRRC8
ImmunoglobulinProduction
IgM
Mutated IgM
IgG
IgA
0
0
0
0
0-low
0-low
0-low
0-low
Low
Low
Low
Low
N-hi
Low
0
0
N-hi
N
0-low
0-low
N-hi
0
0
0
N-hi
biased
0-low
0
Adapted from : A Fischer Nature Immunology 2004

Genetics of CVIDGenetics of CVIDVarious inheritance patternsAR, AD, X-linkedSporadic cases – most common
Linked to MHC and IgADICOS (Grimbacher et al)
Search for CVID candidate proteins, 4/32 patients lacked ICOS, the "inducible costimulator" on activated T cells, due to an inherited homozygous deletion in the ICOS gene. T cells normal: subset distribution, activation, cytokine production and proliferation. . BUTBUT naive, switched and memory B cells were reduced. Phenotype of human ICOS deficiency, suggests critical involvement of ICOS in T cell help for late B cell differentiation, class-switching and memory B cell generation

Classification of CVID
• Farrants method
• Took PBLs from CVID , kept cells alive for 1 week in the lab & got them to produce immunoglobulin
• (the only cells that can make Ig are B cells,….. memory B cells )
• He found he could divide CVID patients into 3 groups depending on the isotype of Ig they made.

Farrants Groups
• Group A• Don’t make any Immunoglobulin in vitro
• Group B • Make IgM only
• Group C • Make IgM, IgG & IgA (but have low serum levels)
• Normal healthy donors• Make IgM, IgG & IgA (have normal serum levels)
Farants method was time consuming & difficult to do.
While: Group A patients correlated with granulomatous disease & splenomegaly
• This method was not adopted generally

CVID Classification ContCVID Classification Cont’’d d
Recent reports described reduced populations of CD27+ memory B cells and increased percentages of undifferentiated B cells in CVID blood.
This work has prompted 2 attempts to classify CVID based on rapid flow cytometric quantification of blood memory B cells and immature B cells.

JC Brouet, A Chedeville, JP Fermand and B Royer. Study of the B cell memory compartment in common variable immunodeficiency. Eur J Immunol 30 (2000) 2516-2520
S Jacquot, L Macon-Lemaitre, E Paris et al. B cell co-receptors regulating T cell dependant antibody production in common variable immunodeficiency: CD27 pathway defects identify subsets of severely immunocompromised patients Int Immunol 13 (2001) 871-876
Warnatz K, Denz A, Drager R, Braun M, Groth C, WolffWarnatz K, Denz A, Drager R, Braun M, Groth C, Wolff--Vorbeck G, Eibel H, Vorbeck G, Eibel H, Schlesier M, Peter HH. Schlesier M, Peter HH. Severe deficiency of switched memory B cells Severe deficiency of switched memory B cells (CD27(+)IgM((CD27(+)IgM(--)IgD()IgD(--)) in subgroups of patients with common variable )) in subgroups of patients with common variable immunodeficiency: a new approach to classify a heterogeneous disimmunodeficiency: a new approach to classify a heterogeneous disease. Blood. ease. Blood. 2002 Mar 1;99(5):15442002 Mar 1;99(5):1544--51.51.
Piqueras B, LavenuPiqueras B, Lavenu--Bombled C, Galicier L, BergeronBombled C, Galicier L, Bergeron--van der Cruyssen F, van der Cruyssen F, Mouthon L, Chevret S, Debre P, Schmitt C, Oksenhendler E.Mouthon L, Chevret S, Debre P, Schmitt C, Oksenhendler E. Common variable Common variable immunodeficiency patient classification based on impaired B cellimmunodeficiency patient classification based on impaired B cell memorymemorydifferentiation correlates with clinical aspects. J Clin Immunol. 2003 Sep;23(5):385-400
Carsetti R, Rosado MM, Donnanno S, Guazzi V, Soresina A, Meini A, Plebani A, Aiuti F, Quinti I. The loss of IgM memory B cells correlates with clinical disease in common variable immunodeficiency. J Allergy Clin Immunol. 2005 Feb;115(2):412-7.

POTENTIAL NEW TYPE OF CLASSIFICATION FOR CVID
• Based on peripheral blood
• Especially B lymphocytes – producers of immunoglobulin
• Using antibodies to identify different types of B lymphocytes
• Look at numbers of memory B lymphocytes

Memory B Cells• B cells make up 6-10% of all PBLs in
healthy person
• Memory B cells make up approx 1.6% of all PBLs in healthy person
• BUT Memory B cells appear to make much lower in CVID patients
• Make up < 0.4% of all PBLs in some CVID patients.

Classification cont’d • The production of immunoglobulin ( in
lab) seems to be dependent on the presence of memory B cells

Methods to examine B memory lymphocytes
•PBLs, contain different types of B cells, including Memory B cells (also T & NK cells)

Methods Cont’d
• Add antibodies that define memory B cells to the PBLs
• Antibodies are• Anti-CD27 • Anti-IgM• Anti-IgD• Anti-CD19

GATE on CD19 B cells
Examine CD27 positive andnegative and IgD expression on CD19 positive B cells

Classification A
Warnatz K, Denz A, Drager R, Braun M, Groth C, Wolff-Vorbeck G, Eibel H, Schlesier M, Peter HH.
Severe deficiency of switched memory B cells (CD27(+)IgM(-)IgD(-)) in subgroups of patients with common variable immunodeficiency: a new approach to classify a heterogeneous disease. Blood. 2002 Mar 1;99(5):1544-51.
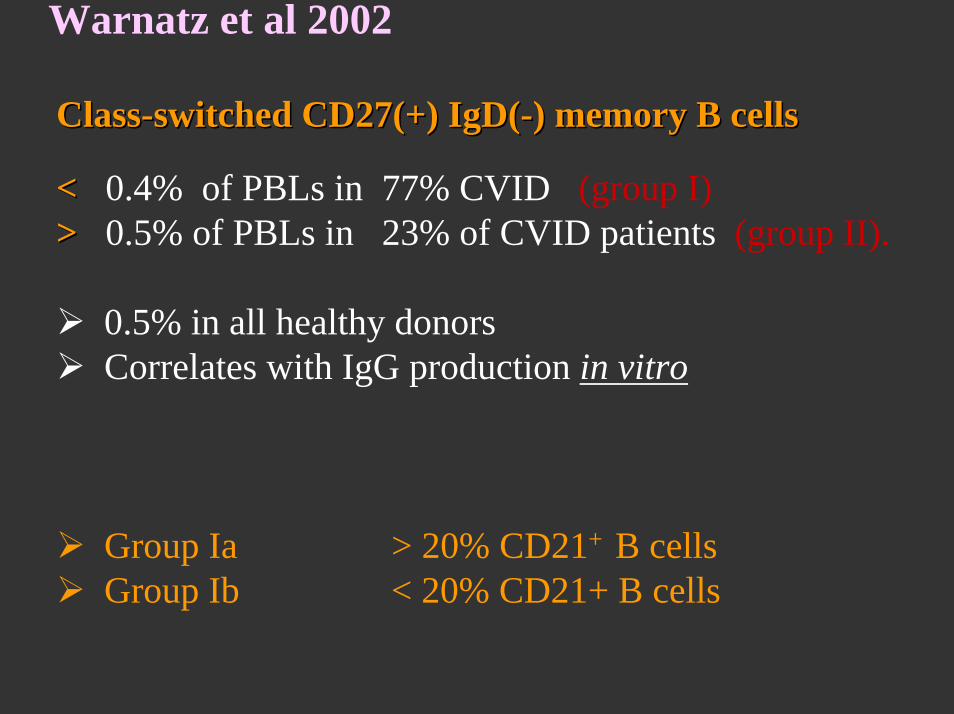
Warnatz et al 2002
ClassClass--switched CD27(+) IgD(switched CD27(+) IgD(--) memory B cells ) memory B cells
< < 0.4% of PBLs in 77% CVID (group I)> > 0.5% of PBLs in 23% of CVID patients (group II).
0.5% in all healthy donorsCorrelates with IgG production in vitro
Group Ia > 20% CD21+ B cells Group Ib < 20% CD21+ B cells

Classification 2 Classification B
Piqueras B, Lavenu-Bombled C, Galicier L, Bergeron-van der Cruyssen F, Mouthon L, Chevret S, Debre P, Schmitt C, Oksenhendler E.
Common variable immunodeficiency patient classification based on impaired B cell memory differentiation correlates with clinical aspects. J Clin Immunol. 2003 Sep;23(5):385-400

Piqueras et al 2003
Group MB2MB2 (19%) with normal memory B cells
Group MB1MB1 (33%) defective switched (IgD-CD27+)
normal non switched (IgD+CD27+)
Group MB0MB0 (47%) Almost no memory B cells.
MB0/MB1 = MB0/MB1 = Group IGroup IPiqueras Warnatz
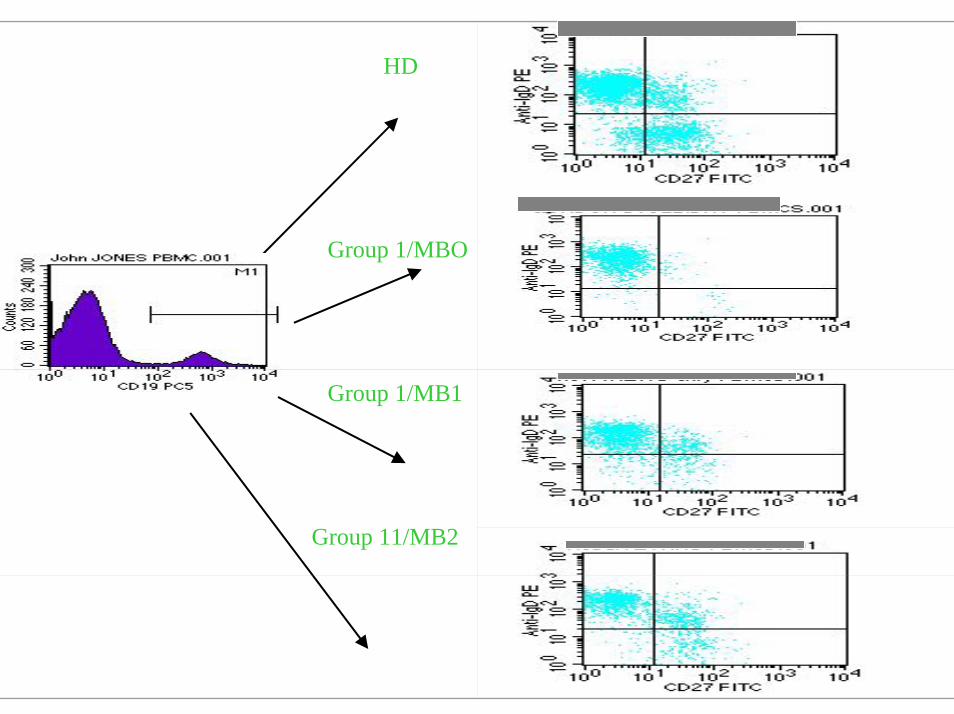
HD
Group 1/MBO
Group 11/MB2
Group 1/MB1
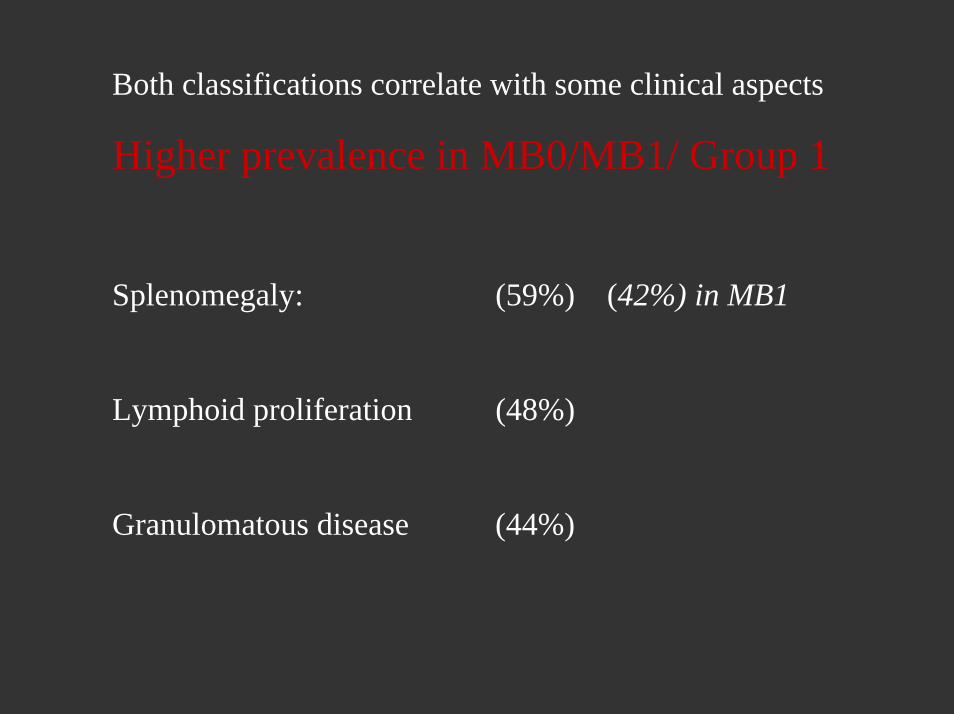
Both classifications correlate with some clinical aspects
Higher prevalence in MB0/MB1/ Group 1
Splenomegaly: (59%) (42%) in MB1
Lymphoid proliferation (48%)
Granulomatous disease (44%)

Classification of CVIDseverity
Bryant (Farant), 1990
Warantz, 2002 Piqueras, 2003
Ano Ig production in vitro
Ia< 0.4% Class-switched CD27(+)IgM(-)IgD(-) memory B cells of PBLs > 20% CD21+ of B cells
MB0Almost no memory B cells
BIgM only
Ib< 0.4% Class-switched CD27(+)IgM(-)IgD(-) memory B cells of PBLs < 20% CD21+ B cells
MB1
defective switched (IgD-CD27+)
normal non switched (IgD+CD27+)
Clow serum levelsof IgM, IgG, IgA
II
> 0.5% CD27(+)IgM(-)IgD(-) of PBLs
MB2
normal memory B cells

Note Note
Although useful, probably all of these classification systems need to be re-analysed and patient diagnoses reassessedin the light of recent genetically identified immunodeficiencies, many of which had been previously categorized as CVID.
i.e XLP, ICOS and AID mutations.

Classifications depend on:
1 Defining tight cut-offs 2 Demonstrating immune phenotypes are stable
with time and not 20 to complications of CVI including inter-current infections.
3 Large collaborative studies needed. 4 Quality assurance of assays will play an
important role IF classifications are to be used predicatively
5 Essential methods involved are simple and reliable.

For the classification to be useful in routine diagnosis, it is important that the flow cytometric method can be used withoutprior separation of peripheral blood mononuclear cells (PBMC).
Whole Blood method is now used.Whole Blood method is now used.

1. Examined 23 CVID patients and 24 controls, using both PBMC and whole blood.
2. Excellent correlation between these methods.
3. Method was reproducible.
4. Classified CVID patients by all 3 existing classifications, including secretion of immunoglobulin by B cells in vitro

Staining programme: Preparation of Whole blood1/ Add 500ul of whole blood (WB) to an LP4 tube and mark its volume with a marker
2/ Add 1.5mls of PBS then vortex and spin at 1000RPM for 5 mins.
3/ Aspirate the supernatant and then re-suspend in 1.5mls of PBS.
4/ Spin at 1000RPM for 5 mins.
5/ Repeat steps 3 and 4.
6/ Aspirate for a final time and fill the tube back up to the line with PBS.
Preparation of PBMC’s1/ After preparation of PBMC’s gain a stock concentration of 5 x 10⁶ cells/ml.
Once the whole blood and PBMC preparations are ready the cells can be stained.
Cell stainingPrepare a cocktail of the 4 antibodies being used and gently mix, for example;

TABLE 1 Characteristics of CVID Patients and Controls
No Sex Age Age Age CD19 Lymph’s IgM/D+27- IgM/D+27- IgM/D+27+ IgM/D+27+ IgM/D-27+ IgM/D-27+ CD27+ CD21-ve Bryant Warnatz Piqueras
Onset Diag % mm2 naive naive IgD mem IgDmem Switched Switched % B % B PBMC WB PBMC WB
% PBL % B % PBL % B % PBL % B % B 1 M 53 27 28 7.4 2399 7.30 98.50 0.10 1.30 0.003 0.04 1.34 18.20 A 1b 1b MBO MBO 2 M 73 63 71 4.0 702 3.8 96.3 0.13 3.3 0.01 0.22 3.52 1.94 A 1b 1b MBO MBO 3 M 67 62 63 1.7 2155 1.5 85 0.17 9.8 0.03 1.7 11.5 10.9 A 1b 1b MB1 MB1 4 F 20 13 14 5.3 1282 4.8 91 0.1 2.2 0.03 0.5 2.7 2.02 A 1b 1b MBO MBO 5 M 68 65 65 4.2 n.d 3.8 89.5 0.2 4 0.10 3.2 7.2 64.7 A 1a 1a MBO MBO 6 F 50 39 41 30.4 746 29.6 82 0.3 8.7 0.10 2.5 11.2 20.4 A 1a 1b MBO MBO 7 M 55 35 35 5.3 730 4.9 92.4 0.2 4.7 0.10 1.5 6.2 35.07 A 1a 1a MB0 MBO 8 M 40 33 36 2.2 1828 1.7 76.1 0.2 7.63 0.10 5.61 13.2 24.3 A 1a 1b MB0 MB1 9 F 76 60 60 6.0 637 5.2 86.5 0.3 5.37 0.10 1.94 7.3 16.6 A 1b 1b MB0 MBO 10 F 50 2 39 1.1 559 0.9 65.7 0.1 8.57 0.10 2.9 11.5 32.14 A 1a 1a MB1 MB1 11 F 33 31 32 3.6 2940 2.6 71.7 0.9 24.6 0.10 2.3 26.9 3.49 A 1b 1b MB1 MB1 12 M 18 16 16 19.0 1039 16.7 88.3 1.9 9.7 0.20 1.3 11 1.74 C 1b 1b MB1 MB1 13 F 71 71 71 8.3 1468 5 60.6 2.6 31.5 0.37 4.64 36.1 39.83 B 1a 1a MB1 MB1 14 F 40 39 39 8.6 695 6.5 75.1 1.5 17.9 0.36 4.13 22.6 4.7 B 1b 1b MB1 MB1 15 F 22 17 17 9.9 769 7.7 79 1.3 13.6 0.28 3.61 17.2 17.8 A 1b 1a MB1 MB1 16 F 54 43 49 11.2 1378 8.4 75 2.3 21 0.33 3.6 24.6 1.5 ND 1b 1b MB1 MB1 17 F 72 64 66 12.2 917 8.8 71.9 1.6 12.7 0.36 2.96 16.7 21.88 B 1a 1a MB1 MB1 18 F 25 2 6 6.0 1569 4.1 68.3 1.2 19 0.58 9.61 29.5 9.68 B 11 II MB2 MB2 19 M 23 1 3 14.8 2011 11 73.9 2.8 19 0.70 4.82 23.8 7.65 C 11 II MB1 MB1 20 M 39 38 38 4.7 2231 2.7 57.2 1.3 27.7 0.66 14.1 41.8 5.38 C 11 II MB2 MB2 21 M 19 16 16 12.7 2054 9.6 75.6 1.3 10.5 1.37 10.75 21.5 1.86 A 11 II MB2 MB2 22 M 44 13 26 6.3 1460 4 64.8 1.7 26.8 0.58 6.4 33.2 4.29 B 11 II MB1 MB1 23 F 58 50 50 12.0 2041 6.7 65.5 1.1 19 0.60 9.8 28.8 56.71 B 11 1a MB2 MB1

TABLE 2 Sex Age Age Age CD19 Lymph’ IgM/D+27- IgM/D+27- IgM/D+27+ IgM/D+27+ IgM/D-27+ IgM/D-27+ CD27+ CD21-ve Onset Diag % mm2 naive naive IgD mem IgD mem Switched Switched % B % B % PBL % B % PBL % B % PBL % B % B
Mean CVID n = 23
PBMC 11M/12F 48 33 39 8.2 +/- 7NS 1398 6.5 + / - 7 NS 78.9 +/- 11 NS 1 +/- 0.9 NS 12 +/- 9 NS 0.28 +/- 0.3 NS 2.62 +/- 3 NS 16.3 +/- 11 NS 16 +/- 17 NS
WB 8.7 +/- 8 7.1 +/ - 7 81.1 +/- 14 1.1 +/- 1 12 +/- 11 0.3 +/- 0.3 3.5 +/- 6 16.2 +/- 14 14.8 +/- 19
Mean HD n=24
PBMC 10M/14F38 8.6 +/- 3 1892 5.6 +/- 2 NS 65 +/- 11 NS 1.2 +/- 0.5 NS 15 +/- 6 NS 1.4 +/- 0.5 NS 17.5 +/- 7 NS 29.8 +/- 8 NS 4.9 +/- 5 NS
WB 8.5 +/- 3 5.9 +/- 2 68.7 +/- 11 1.1 +/- 0.7 13.7 +/- 5 1.2 +/- 0.5 13 +/- 8 26.3 +/- 14 5.4 +/- 5

Correlation of Switched Memory cells: : PBMC vs WB
Fig 1eCVID: PBMC v WB CD27+/IgD- (as % B cells)
0.0 2.5 5.0 7.5 10.0 12.5 15.00.0
2.5
5.0
7.5
10.0
12.5 r = 0.8
(PBMC) CD27+/IgD-
(WB)
CD
27+/
IgD
-
Fig 1fHD:PBMC v WB CD27+/IgD- (as% B cells)
0 5 10 15 20 25 300
10
20
30
r = 0.8
(PBMC) CD27+/IgD-
(WB)
CD2
7+/Ig
D-
Healthy donorsCVID
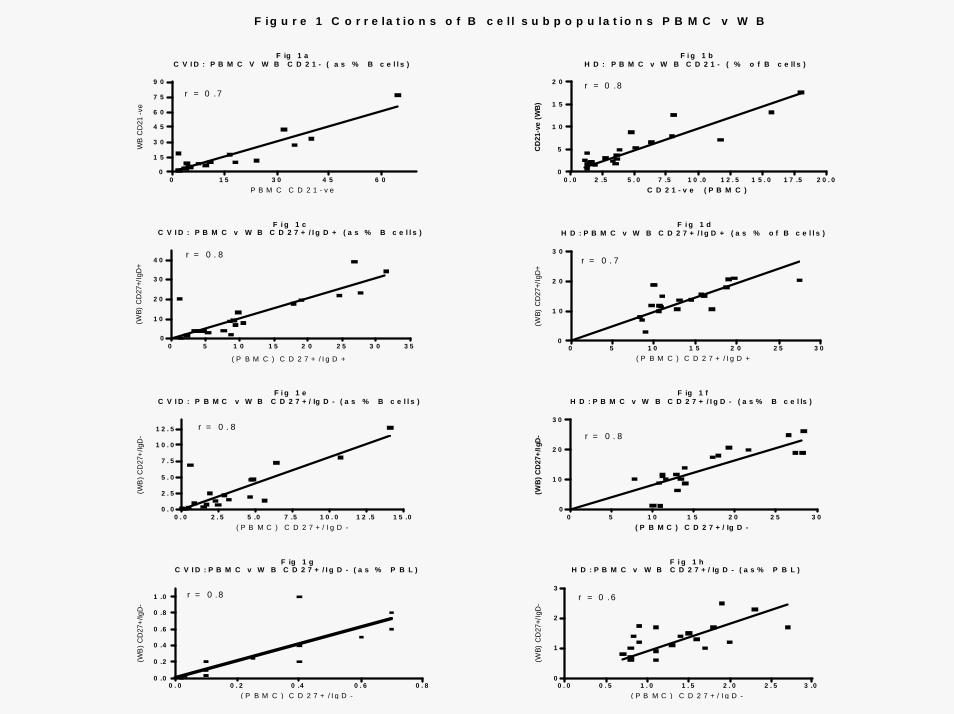
F ig 1 aC V I D : P B M C V W B C D 2 1 - ( a s % B c e l l s )
0 1 5 3 0 4 5 6 00
1 5
3 0
4 5
6 0
7 5
9 0
r = 0 .7
P B M C C D 2 1 - v e
WB
CD
21 -v
e
F i g 1 bH D : P B M C v W B C D 2 1 - ( % o f B c e ll s )
0 . 0 2 .5 5 . 0 7 .5 1 0 .0 1 2 . 5 1 5 . 0 1 7 .5 2 0 . 00
5
1 0
1 5
2 0 r = 0 .8
C D 2 1 - v e ( P B M C )
CD
21-v
e (W
B)
F i g 1 cC V I D : P B M C v W B C D 2 7 + / I g D + ( a s % B c e l l s )
0 5 1 0 1 5 2 0 2 5 3 0 3 50
1 0
2 0
3 0
4 0r = 0 . 8
( P B M C ) C D 2 7 + / I g D +
(WB)
CD
27+/
IgD
+
F i g 1 dH D : P B M C v W B C D 2 7 + / I g D + ( a s % o f B c e l l s )
0 5 1 0 1 5 2 0 2 5 3 00
1 0
2 0
3 0r = 0 . 7
( P B M C ) C D 2 7 + / I g D +
(WB)
CD
27+/
IgD
+
F i g 1 eC V I D : P B M C v W B C D 2 7 + / Ig D - ( a s % B c e l l s )
0 . 0 2 . 5 5 .0 7 .5 1 0 . 0 1 2 .5 1 5 .00 . 0
2 . 5
5 . 0
7 . 5
1 0 . 0
1 2 . 5 r = 0 . 8
( P B M C ) C D 2 7 + / I g D -
(WB
) CD
27+/
IgD
-
F ig 1 fH D : P B M C v W B C D 2 7 + / I g D - ( a s % B c e l ls )
0 5 1 0 1 5 2 0 2 5 3 00
1 0
2 0
3 0
r = 0 . 8
( P B M C ) C D 2 7 + / Ig D -(W
B) C
D27
+/Ig
D-
F ig 1 gC V I D : P B M C v W B C D 2 7 + / I g D - ( a s % P B L )
0 . 0 0 . 2 0 .4 0 . 6 0 . 80 .0
0 .2
0 .4
0 .6
0 .8
1 .0 r = 0 .8
( P B M C ) C D 2 7 + / I g D -
(WB
) CD
27+/
IgD
-
F i g 1 hH D : P B M C v W B C D 2 7 + / Ig D - ( a s % P B L )
0 . 0 0 . 5 1 . 0 1 . 5 2 . 0 2 . 5 3 .00
1
2
3r = 0 .6
( P B M C ) C D 2 7 + / I g D -
(WB)
CD
27+/
IgD
-
F ig u r e 1 C o r r e la t io n s o f B c e l l s u b p o p u la t io n s P B M C v W B

Pat 1: PBMC Pat 1: WB
Pat 2: PBMC Pat 2: WB

Conclusions for WB Method
1. Fast, requires very little blood and is reproducible.
2. Percentages of naïve and memory cells from patients and controls were not significantly altered using WB or PBMC methods.
3. The WB method would ensure easy follow up of patients and allow monitoring of their memory B cell phenotype over time and in response to medications


Tube 1 cocktail
Antibody Dilution* Amount added to cocktail (ul)
CD27 FITC 1:5 20
IgD PE 1:5 20
CD19 PC5 neat 10
IgM Cy5 1:5 4
* All dilutions are in PBS
Once all of the cocktails have been prepared the cells can be stained
1/ 50ul of PBMC’s + 10ul of cocktail
or 100ul of WB + 10ul of cocktail.
2/ Incubate for 15-30mins at 4°C in the dark.
3/ Add 500ul of FACS Lyse to the PBMC’s and incubate for 5 mins.
Add 1.5mls of FACS Lyse to the WB and incubate for 5 mins.
4/ Centrifuge at 1200RPM for 5 mins.
5/ Decant supernatant and re-suspend in 300mls of PBS.
6/ Centrifuge at 1200RPM for 5 mins.
7/ Decant supernatant and re-suspend in 500ul of 1% formaldehyde.
Read on FACScalibur or store at 4°C overnight.


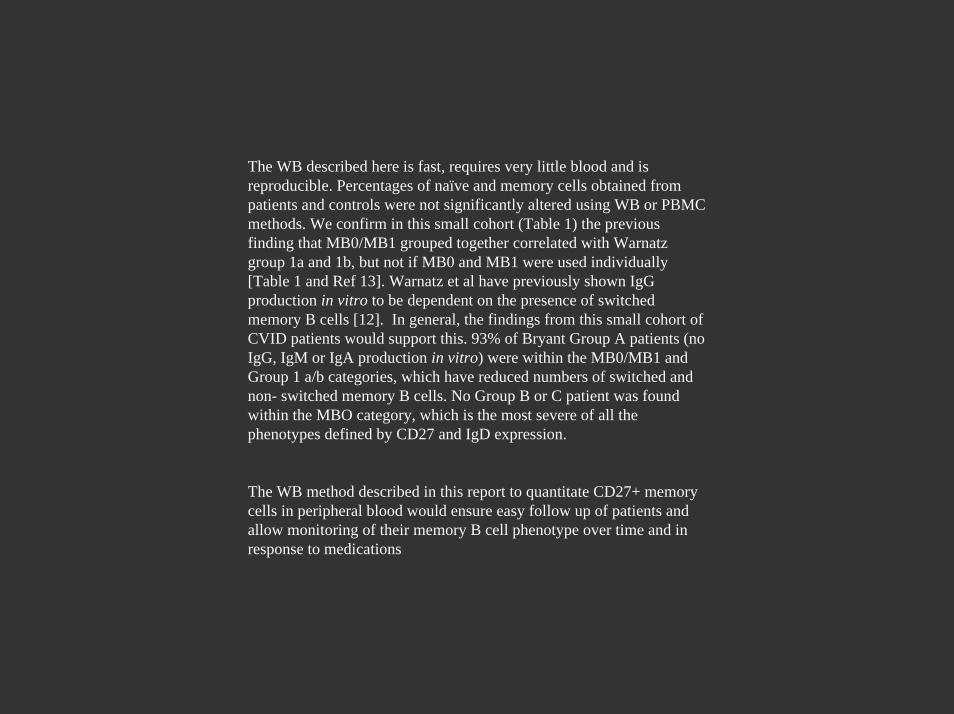
The WB described here is fast, requires very little blood and isreproducible. Percentages of naïve and memory cells obtained from patients and controls were not significantly altered using WB or PBMC methods. We confirm in this small cohort (Table 1) the previous finding that MB0/MB1 grouped together correlated with Warnatz group 1a and 1b, but not if MB0 and MB1 were used individually [Table 1 and Ref 13]. Warnatz et al have previously shown IgG production in vitro to be dependent on the presence of switched memory B cells [12]. In general, the findings from this small cohort of CVID patients would support this. 93% of Bryant Group A patients (no IgG, IgM or IgA production in vitro) were within the MB0/MB1 and Group 1 a/b categories, which have reduced numbers of switched and non- switched memory B cells. No Group B or C patient was found within the MBO category, which is the most severe of all the phenotypes defined by CD27 and IgD expression.
The WB method described in this report to quantitate CD27+ memory cells in peripheral blood would ensure easy follow up of patients and allow monitoring of their memory B cell phenotype over time and in response to medications

Other Questions
• What clinic days ? • How many patients per day? • What patients to begin with• Liz Saxby & John Jones – staff involved.• Berne can be main lab contact • ? Would Zia coordinate? • 20-30 mls EDTA blood • 5 mls serum • When to start?

FACScalibur Protocol for B cell markers
1/ Follow the normal turning on the FACS and calibrate both the LNW and LW. We will use the LW programme if possible.2/ Go to research – B-cells – B cell acquisition.3/ Get the browser via windows. 4/ Connect to the cytometer via acquire.5/ Get counters up6/ Create a new file – on the browser go to change (directory) – desktop – research - B cells – B cell controls – create a new file –select new file.7/ Change file count to 18/ Change the patients name and the tube details accordingly9/ Set the settings via Cytometer – instrument settings – desktop – Fascstation – Bd files – Instrument settings – calib file – set –done.10/ Now set the voltages and compensation.11/ THESE WILL NEED CHANGING FOR EACH TUBE. THE CORRECT SETTINGS ARE SHOWN BELOW.
PBMC WBVoltages B1 B2 B3 B4 B1 B2 B3 B4
FSc 2.00 Same Same Same 2.00 Same Same Same
SSc 417 Same Same Same 417 Same Same Same
FL1 574 Same 533 580 574 580 533 580
FL2 603 Same 594 603 603 Same 594 603
FL3 699 Same Same Same 699 Same Same Same
FL4 568 Same Same Same 549 Same 539 549
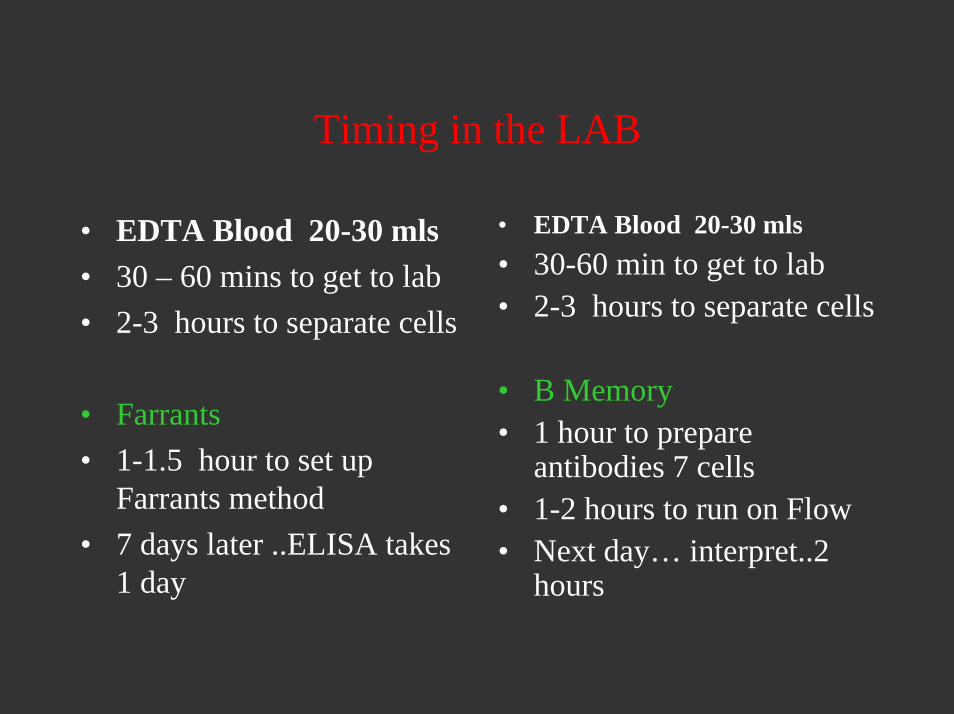
Timing in the LAB
• EDTA Blood 20-30 mls• 30 – 60 mins to get to lab• 2-3 hours to separate cells
• Farrants• 1-1.5 hour to set up
Farrants method • 7 days later ..ELISA takes
1 day
• EDTA Blood 20-30 mls• 30-60 min to get to lab• 2-3 hours to separate cells
• B Memory • 1 hour to prepare
antibodies 7 cells• 1-2 hours to run on Flow • Next day… interpret..2
hours

Heterogeneous Group of disorders
• Primary
• Single gene• XLA
• Complex• CVID
• Secondary
• Malignancy• Renal/GI loss• Drugs

B cell immunodeficienciesas a result of defects in B cell development

HSC
TNKCLP
Myeloid
Pro B Pre B
Plasmacyte
HIGM Switched BIgGIgAIgECD40L
CD40
AICDA UNG HIGM4AICDAλC
CVIDICOS
XLABTK
0
0
0
0
Mature B
Low
Low
Low
Low
ImmunoglobulinProduction
IgM
Mutated IgM
IgG
IgA
0-low
0-low
0-low
0-low
Λ5 V preB
µ
Bone Marrow
IgM
IgD
Autosomal recessive agammaλ5 Ig α/β µ BLNK LRRC8
N-hi
Low
0
0
N-hi
N
0-low
0-low
N-hi
0
0
0
N-hi
biased
0-low
0
Adapted from : A Fischer Nature Immunology 2004
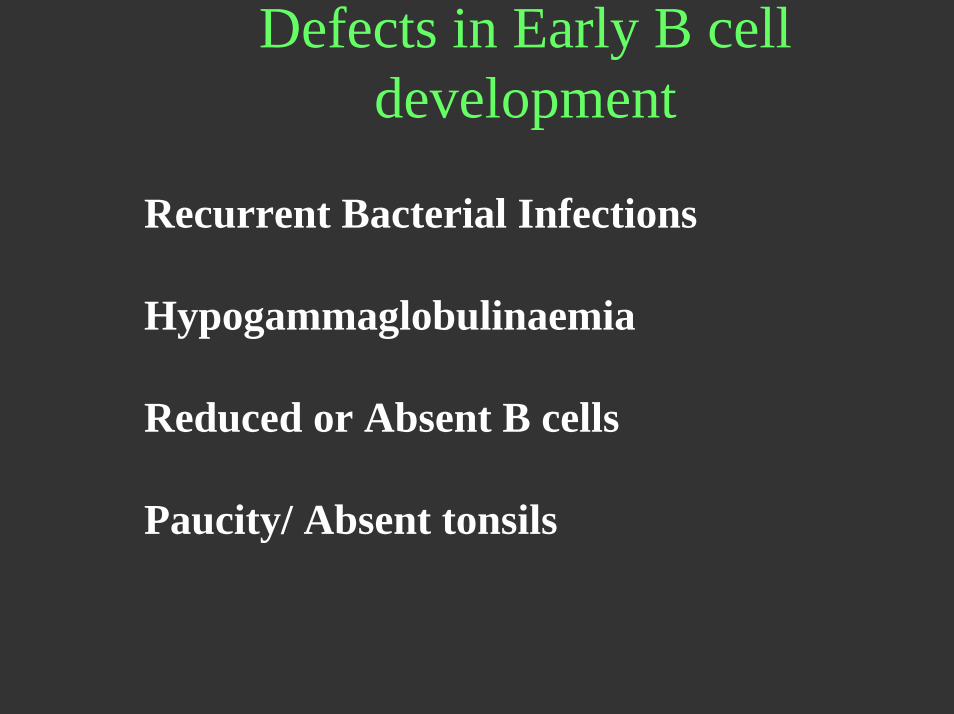
Defects in Early B cell development
Recurrent Bacterial Infections
Hypogammaglobulinaemia
Reduced or Absent B cells
Paucity/ Absent tonsils

Hyper IgM SyndromeLow/absent Serum IgG, IgA, IgECSR Faulty Normal /elevated Serum IgMB cells in blood Normal65% Mutations in CD40L
Others AID, UNG, CD40

HSC
TNKCLP
Myeloid
Pro B Pre B
Plasmacyte
HIGM Switched BIgGIgAIgECD40L
CD40
AICDA UNG HIGM4AICDAλC
CVIDICOS
XLABTK
Mature B
Λ5 V preB
µ
Bone Marrow
IgM
IgD
Autosomal recessive agammaλ5 Ig α/β µ BLNK LRRC8
ImmunoglobulinProduction
IgM
Mutated IgM
IgG
IgA
0
0
0
0
0-low
0-low
0-low
0-low
Low
Low
Low
Low
N-hi
Low
0
0
N-hi
0
0
0
N-hi
biased
0-low
0
N-hi
N
0-low
0-low
Adapted from : A Fischer Nature Immunology 2004

HIGM HIGM CD40L DeficienciesCD40L DeficienciesRecurrent Bacterial
Opportunistic 30% pnemuocystis Carinii < 1 yr
Crytosporidium Atypical mycobacteria

1. Defects in CSR machinery.
2. Genetic linkage subset of HIGM
3. AICDA gene Activation Induced Cytidine DeAminase
4. AICDA: Expressed only in Germinal Centres
5. Enzyme: Activation induced deaminaseAID.

HIGM: AID
Patients did not undergo CSR: but also
Defects in generating somatic hypermutations.in Ig V segments
Linked CSR and SHM Linked CSR and SHM

Methods Cont’d
• We will also do Farrants method to compare.
• We hope to store DNA from the patients for future work (ethical permission would be needed). Look at T cell markers.
• Take serum, measure Igs, freeze serum,


Sex Age Age Age CD19 Lymph’sIgM/D+27-
IgM/D+27-
IgM/D+27+
IgM/D+27+
IgM/D-27+
IgM/D-27+ CD27+
CD21-ve
Onset
Diag % mm2
% PBL % B % PBL % B % PBL % B % B
Means CVID n = 23
PBMC
11M/12F
48 +/-20
33 +/-22
39 +/-21
8.2 +/-7NS
1398 +/-666
6.5 + / - 7 NS
78.9 +/-11 NS
1 +/- 0.9NS
12 +/-9 NS
0.28 +/- 0.3NS
2.62 +/- 3 NS
16.3 +/-11 NS
16 +/- 17 NS
WB 8.7 +/-8
7.1 +/ -7
81.1 +/-14 1.1 +/- 1
12 +/-11 0.3 +/- 0.3 3.5 +/- 6
16.2 +/-14
14.8 +/-19
Means HD n=24
PBMC
10M/14F
38 +/-12
8.6 +/-3
1892+/-434
5.6 +/-2 NS
65 +/-11 NS
1.2 +/-0.5 NS
15 +/- 6 NS
1.4 +/- 0.5 NS
17.5 +/- 7 NS
29.8 +/- 8 NS
4.9 +/- 5 NS
WB 8.5 +/-3
5.9 +/-2
68.7 +/-11
1.1 +/-0.7
13.7 +/- 5 1.2 +/- 0.5 13 +/- 8
26.3 +/-14 5.4 +/- 5
naive naive IgD mem
IgDmem Switched
Switched % B % B

TABLE 2 Sex Age Age Age CD19 Lymph’IgM/D+27- IgM/D+27- IgM/D+27+ IgM/D+27+IgM/D-27+ IgM/D-27+ CD27+ CD21-ve Onset Diag % mm2 naive naive IgD mem IgDmem Switched Switched % B % B % PBL % B % PBL % B % PBL % B % B
Means CVID n = 23
PBMC 11M/12F 48 33 39 8.2 +/- 7NS 1398 6.5 + / - 7 NS 78.9 +/- 11 NS 1 +/- 0.9 NS 12 +/- 9 NS 0.28 +/- 0.3 NS 2.62 +/- 3 NS 16.3 +/- 11 NS 16 +/- 17 NS
WB 8.7 +/- 8 7.1 +/ - 7 81.1 +/- 14 1.1 +/- 1 12 +/- 11 0.3 +/- 0.3 3.5 +/- 6 16.2 +/- 14 14.8 +/- 19
Means HD n=24
PBMC 10M/14F 38 8.6 +/- 3 1892 5.6 +/- 2 NS 65 +/- 11 NS 1.2 +/- 0.5 NS 15 +/- 6 NS 1.4 +/- 0.5 NS 17.5 +/- 7 NS 29.8 +/- 8 NS 4.9 +/- 5 NS
WB 8.5 +/- 3 5.9 +/- 2 68.7 +/- 11 1.1 +/- 0.7 13.7 +/- 5 1.2 +/- 0.5 13 +/- 8 26.3 +/- 14 5.4 +/- 5

Patients and Healthy Donors Ethical permission to study B cells in CVID patients and healthy donors (HD) was obtained from the Central Oxfordshire Research Ethics Committee. Informed consent was obtained from 23 CVID patients who met the International (PAGID & ESID) diagnostic criteria; only those with normal numbers of circulating B cells were tested. CVID patients included those with granulomatous and autoimmune disease. Although not all CVID patients discussed in this report were tested individually for XLP, ICOS or HIGM mutations, their clinical histories and laboratory phenotypes strongly supported the CVID diagnosis. Amongst the Oxford patients, the mean duration of disease was 10.4 years ( Range:newly diagnosed – 48 years) (24 HD were recruited from hospital staff. All patients were stable on immunoglobulin substitution and none were on additional medication. Blood samples from CVID patients were taken prior to Ig infusion.

Bone marrow Blood Lymph node

TABLE 1 Characteristics of CVID Patients and Controls
No Sex Age Age Age CD19 Lymph’s IgM/D+27- IgM/D+27- IgM/D+27+ IgM/D+27+ IgM/D-27+ IgM/D-27+ CD27+ CD21-ve Bryant Warnatz Piqueras
Onset Diag % mm2 naive naive IgD mem IgDmem Switched Switched % B % B PBMC WB PBMC WB
% PBL % B % PBL % B % PBL % B % B 1 M 53 27 28 7.4 2399 7.30 98.50 0.10 1.30 0.003 0.04 1.34 18.20 A 1b 1b MBO MBO 2 M 73 63 71 4.0 702 3.8 96.3 0.13 3.3 0.01 0.22 3.52 1.94 A 1b 1b MBO MBO 3 M 67 62 63 1.7 2155 1.5 85 0.17 9.8 0.03 1.7 11.5 10.9 A 1b 1b MB1 MB1 4 F 20 13 14 5.3 1282 4.8 91 0.1 2.2 0.03 0.5 2.7 2.02 A 1b 1b MBO MBO 5 M 68 65 65 4.2 n.d 3.8 89.5 0.2 4 0.10 3.2 7.2 64.7 A 1a 1a MBO MBO 6 F 50 39 41 30.4 746 29.6 82 0.3 8.7 0.10 2.5 11.2 20.4 A 1a 1b MBO MBO 7 M 55 35 35 5.3 730 4.9 92.4 0.2 4.7 0.10 1.5 6.2 35.07 A 1a 1a MB0 MBO 8 M 40 33 36 2.2 1828 1.7 76.1 0.2 7.63 0.10 5.61 13.2 24.3 A 1a 1b MB0 MB1 9 F 76 60 60 6.0 637 5.2 86.5 0.3 5.37 0.10 1.94 7.3 16.6 A 1b 1b MB0 MBO 10 F 50 2 39 1.1 559 0.9 65.7 0.1 8.57 0.10 2.9 11.5 32.14 A 1a 1a MB1 MB1 11 F 33 31 32 3.6 2940 2.6 71.7 0.9 24.6 0.10 2.3 26.9 3.49 A 1b 1b MB1 MB1 12 M 18 16 16 19.0 1039 16.7 88.3 1.9 9.7 0.20 1.3 11 1.74 C 1b 1b MB1 MB1 13 F 71 71 71 8.3 1468 5 60.6 2.6 31.5 0.37 4.64 36.1 39.83 B 1a 1a MB1 MB1 14 F 40 39 39 8.6 695 6.5 75.1 1.5 17.9 0.36 4.13 22.6 4.7 B 1b 1b MB1 MB1 15 F 22 17 17 9.9 769 7.7 79 1.3 13.6 0.28 3.61 17.2 17.8 A 1b 1a MB1 MB1 16 F 54 43 49 11.2 1378 8.4 75 2.3 21 0.33 3.6 24.6 1.5 ND 1b 1b MB1 MB1 17 F 72 64 66 12.2 917 8.8 71.9 1.6 12.7 0.36 2.96 16.7 21.88 B 1a 1a MB1 MB1 18 F 25 2 6 6.0 1569 4.1 68.3 1.2 19 0.58 9.61 29.5 9.68 B 11 II MB2 MB2 19 M 23 1 3 14.8 2011 11 73.9 2.8 19 0.70 4.82 23.8 7.65 C 11 II MB1 MB1 20 M 39 38 38 4.7 2231 2.7 57.2 1.3 27.7 0.66 14.1 41.8 5.38 C 11 II MB2 MB2 21 M 19 16 16 12.7 2054 9.6 75.6 1.3 10.5 1.37 10.75 21.5 1.86 A 11 II MB2 MB2 22 M 44 13 26 6.3 1460 4 64.8 1.7 26.8 0.58 6.4 33.2 4.29 B 11 II MB1 MB1 23 F 58 50 50 12.0 2041 6.7 65.5 1.1 19 0.60 9.8 28.8 56.71 B 11 1a MB2 MB1