
AZZA ALI ADAM ABUJE B.V.Sc. University of … · 1.2.2.4 Duration and Dosage of progesterone...
149
Association of Blood Progesterone Concentration with Fertility and Infertility in Nubian Does in Sudan by AZZA ALI ADAM ABUJE B.V.Sc. University of Khartoum 1992 A thesis Submitted to the University of Khartoum in Fulfillment of the Requirements for the Degree of Master in Veterinary Science Supervisor Dr. Sharaf Eldin Abdalla Makawi Department of Reproduction and Obstetrics Faculty of Veterinary Medicine May– 2012 Please purchase PDFcamp Printer on http://www.verypdf.com/ to remove this watermark.
Transcript of AZZA ALI ADAM ABUJE B.V.Sc. University of … · 1.2.2.4 Duration and Dosage of progesterone...

Association of Blood Progesterone Concentration with
Fertility and Infertility in Nubian Does in Sudan
by
AZZA ALI ADAM ABUJE B.V.Sc. University of Khartoum 1992
A thesis Submitted to the University of Khartoum in Fulfillment of the Requirements for the Degree of Master in Veterinary Science
Supervisor Dr. Sharaf Eldin Abdalla Makawi
Department of Reproduction and Obstetrics Faculty of Veterinary Medicine May– 2012
Please purchase PDFcamp Printer on http://www.verypdf.com/ to remove this watermark.

DEDICATION
To my lovely kids;
Tagwa, Ahmed and Mohamed.
To the soul of my dear father, the pass.
To my dear mother,
brothers and sisters.
To my husband
To all whom I love, I dedicate this work
Azza
Please purchase PDFcamp Printer on http://www.verypdf.com/ to remove this watermark.

List of Content
Title Page List of contents …………………………………………… I List of tables ……………………………………………… V List of figures ……………………………………………. Vi List of appendix…………………………………………… Vii Acknowledgment …………………………………………. Viii English abstract …………………………………………... X Arabic abstract…………………………………………….. Xiii Introduction………………………………………………..
1
CHAPTER ONE: Literature Review 1.1 Detection and control of oestrus and ovulation……….. 4 1.1.1 Natural oestrus………………………………………… 4 1.1.2 Oestrus detection……………………………………… 4 1.1.3 Oestrus signs…………………………………………… 4 1.1.4 Oestrus duration and length……………………………. 4 1.1.5 Factors Influence the onset of oestrus………………… 5 1.1.6 Ovulation……………………………………………… 5 1.1.6.1 Time of Ovulation…………………………………….. 5 1.1.6.2 Ovulation rate…………………………………………. 6 1.1.6.3 Factors influence ovulation rate………………………. 6 1.1.7 Hormonal profile during oestrus………………………. 7 1.1.7.1 Progesterone…………………………………………… 7 1.1.7.2 Estradiole 17 ß�…………………………………………. 7 1.1.7.3 Lutenizing hormone (LH)…………………………….. 7 1.1.7.4 Follicular stimulating hormone (FSH)………………… 8 1.2 Oestrus synchronization………………………………. 8 1.2.1 Advantages of oestrus synchronization……………….. 8 1.2.2 Achievement of oestrus synchronization……………… 9 1.2.2.1 Oestrus synchronization using Prosraglandin F2a�
(PGF2a�) ………………………………………………. 9
1.2.2.2 Dose of PGF2a�………………………………………… 9 1.2.2.3 Oestrus synchronization using progestagens………….. 9 1.2.2.4 Duration and Dosage of progesterone treatment 10 1.2.2.5 Fertility after hormonal treatments…………………….. 11 1.3 Artificial insemination (AI )…………………………… 13 1.3.1 Advantages of AI……………………………………… 13 1.3.2 Methods of AI…………………………………………. 13 1.4 Gestation or Pregnancy……………………………….. 14
Please purchase PDFcamp Printer on http://www.verypdf.com/ to remove this watermark.

1.4.1 Pregnancy diagnosis………………………………….. 14 1.4.1.1 Return to oestrus……………………………………… 15 1.4.1.2 Abdominal palpation ………………………………….. 15 1.4.1.3 Biochemical technique……………………………….. 15 1.4.1.3.1 Pregnancy Associated Glycoprotein (PAG)………….. 15 1.4.1.3.2 Estrone sulphate………………………………………. 16 1.4.1.3.3 Progesterone (P4) …………………………………….. 16 1.4.1.3.3.1 Sites of progesterone production………………………. 18 1.4.1.3.3.2 Analysis of progesterone……………………………… 19 1.4.1.3.3.3 Advantages of progesterone pregnancy test…………… 19 1.4.1.3.3.4 Radio-immunoassay (RIA) for measuring progesterone
concentrations…………………………………………. 20
1.4.1.3.3.5 Progesterone profile in oestrus……………………….. 21 1.4.1.3.3.6 Progesterone and pregnancy………………………….. 24 1.4.1.3.3.7 Progesterone profile during pregnancy……………….. 24
1.4.1.3.3.8 Relationship between progesterone and litter size……..
27
CHAPTER TWO: Material and methods 2.1 Study area……………………………………………….. 30 2.2 Climate………………………………………………….. 30 2.3 Experimental animals…………………………………… 30 2.4 Husbandry………………………………………………. 30 2.4.1 Housing…………………………………………………. 30 2.4.2 Feeding………………………………………………….. 31 2.4.3 Age……………………………………………………… 31 2.4.4 Body condition score (BCS)……………………………. 32 2.5 Treatments………………………………………………. 32 2.5.1 Experimental procedure………………………………… 32 2.5.1.1 Treatment A…………………………………………….. 32 2.5.1.2 Treatment B…………………………………………….. 32 2.5.1.3 Treatment C……………………………………………. 32 2.5.1.4 Treatment D…………………………………………….. 33 2.5.1.5 Treatment E……………………………………………… 33 2.5.1.6 Treatment F…………………………………………….. 33 2.5.2 Sponges application…………………………………….. 33 2.5.2.1 Placing of sponges………………………………………. 34 2.5.2.2 Removal of sponges…………………………………….. 34 2.6 Artificial insemination of does………………………….. 34 2.7 Pregnancy diagnosis using RIA…………………………. 36 2.7.1 Sampling………………………………………………… 36 2.7.2 Equipment ……………………………………………… 36 2.7.3 Materials and reagent……………………………………. 37
Please purchase PDFcamp Printer on http://www.verypdf.com/ to remove this watermark.

2.7.4 Radioimmunoassay procedures…………………………. 39 2.7.5 Radioactivity measurement and result calculation ……... 39 2.8 Statistical analysis………………………………………..
40
CHAPTER THREE: Results 3.1 Reproductive performance in Nubian Does after
synchronization using progestagens………………………. 41
3.1.1 Non Return Rate (NRR) %................................................... 41 3.1.2 Pregnancy Rate (PR) %........................................................ 41 3.1.2.1 Pregnancy rate (%) according to progesterone
concentration at day 21 post insemination………………
41
3.1.2.2 Pregnancy rates (%) as that reveled by abdominal palpation 90 days post insemination……………………
41
3.1.3 Kidding Rate (KR) %........................................................... 41 3.1.4 Fecundity………………………………………………….. 44 3.1.5 Litters size………………………………………………… 44 3.1.6 Twining Rate (TR)%............................................................ 44 3.1.7 Gestation length/ day……………………………………… 44 3.2 Association of progesterone (P4) concentrations with
fertility…………………………………………………….. 44
3.2.1 Progesterone (P4) concentrations before treatment for oestrus synchronization…………………………………
44
3.2.2 Progesterone (P4) concentrations in pregnant and non-pregnant Nubian does at mid-period of synchronizations…………………………………………...
46
3.2.3 Progesterone (P4) concentrations in pregnant & non- pregnant Nubian Does at the day of insemination…………
48
3.2.4 Progesterone (P4) concentrations on day seven post-insemination in pregnant and non- pregnant Nubian Does………………………………………………………..
48
3.2.5 Progesterone (P4) concentrations on day fourteen post-insemination in pregnant and non- pregnant Nubian Does………………………………………………………..
51
3.2.6 Progesterone (P4) concentrations on day twenty one post-insemination in pregnant and non- pregnant Nubian Does………………………………………………………..
53
3.2.7 Comparisons between progesterone (P4) concentrations of the goats that not carried to term/ returned to oestrus and these which carried to term during synchronization, insemination and at first 21 days after insemination……
55
3.2.8 Progesterone profile during pregnancy, abortion and early 57
Please purchase PDFcamp Printer on http://www.verypdf.com/ to remove this watermark.

embryonic death…………………………………………..
CHAPTER FOUR: Discussion 4.1 Non Return Rate…………………………………………... 66 4.2 Pregnancy rate…………………………………………….. 66 4.3 Kidding rate%...................................................................... 67 4.4 Fecundity rate…………………………………………….. 67 4.5 Twining rate………………………………………………. 68 4.6 Litters size………………………………………………… 68 4.7 Gestation period…………………………………………… 68 4.8 Progesterone (P4) concentrations at the day of
synchronization ( day of hormonal application)………….. 69
4.9 Progesterone (P4) concentrations in pregnant & non- pregnant does at mid-period of synchronizations………….
70
4.10 Progesterone (P4) concentrations in pregnant & non- pregnant does in the day of oestrus /AI application……….
71
4.11 Progesterone (P4) concentrations on day 7,14,21 post-insemination, and during pregnancy in pregnant & non- pregnant Nubian Does……………………………………..
71
4.12 Progesterone profiles in does exposed to abortion or early embryonic death…………………………………………..
73
Conclusion and Recommendations Conclusion………………………………………………. 75 Recommendations……………………………………….. 75 References………………………………………………………….. 76
Please purchase PDFcamp Printer on http://www.verypdf.com/ to remove this watermark.

List of tables No
Table Page
1 Meteorological data during experimental period……………………………
30
2
Analysis of Feed, ingredients of the concentrate ration………………………
31
3 Chemical composition of the concentrate ration………………………………
31
4 Experimental design…………………………………………………………..
33
5 Serum progesterone standards supplied with the FAO/IQEA radioimmunoassay Kit…………………………………………………. ……
37
6 Reproductive performance in Nubian does after synchronizations using progestagens…………………………………………………………………
42
7 Effect of litter size and sex of concepts on the gestation length of Nubian does……………………………………………………………………………
43
8 Progesterone (P4) concentrations before synchronization in pregnant and non-pregnant does in all treatment groups…………………………………….
45
9 Progesterone (P4) concentrations at mid-period of synchronization in pregnant and non-pregnant does in all treatment groups………………………… ………………………………………………
47
10 Progesterone (P4) concentrations at the day of insemination in pregnant and non-pregnant Does in all treatment groups… ……………………………….
49
11 Progesterone (P4) concentrations on day seven post insemination in pregnant and non-pregnant does in all treatment groups……………………………….
50
12 Progesterone (P4) concentrations at day 14 post- insemination in pregnant and non-pregnant Does in all treatment groups………………………………………………………………………….
52
13 Progesterone (P4) concentrations at day 21 post- insemination in pregnant and non-pregnant does in all treatment groups……………………………………………………………………
54
14 Comparisons between progesterone (P4) concentrations (nMol/L) of the goats that not carried to term/ returned to oestrus and these which carried to term at a selected sampling periods …………………………………………..
56
Please purchase PDFcamp Printer on http://www.verypdf.com/ to remove this watermark.

List of figures N0 Figure Page 1 Semen collection& A.I equipments …………………………. 35 2 Gamma counter unit …………………………………………… 38 3 Equipments used in RIA ………………………………………. 38 4 Plasma progesterone concentrations (P4) during gestation
in group A………………………………………………………. 58
5 Plasma progesterone concentrations (P4) in pregnant does in group B………………………………………………….
59
6 Plasma progesterone concentrations (P4) during gestation in group c………………………………………………………..
60
7 Plasma progesterone concentrations (P4) during gestation in group D………………………………………………………..
61
8 Plasma progesterone concentrations (P4) during gestation in group E……………………………………………………….
62
9 Plasma progesterone concentrations (P4) during gestation in group F………………………………………………………..
63
10 Progesterone profile in goat no 2424 showing abortion… 64 11 Progesterone profile in goat no 1204 showing abortion…. 64 12 Progesterone profile in goat no 1806showing abortion….. 65 13 Progesterone profile in goat no 644…………………………. 65
Please purchase PDFcamp Printer on http://www.verypdf.com/ to remove this watermark.
������������������������������ List of Appendix No Appendix Pag
e
1 Progesterone (P4) concentrations at synchronization in does carried to full term and does not carried to full term in all treatment groups………………
109
2 Progesterone (P4) concentrations at mid-period of synchronization in does carried to full term and does not carried to full term in all treatment groups..
110
3 Progesterone (P4) concentrations at the day of insemination in does carried to full term and does not carried to full term in all treatment groups…………
111
4 Progesterone (P4) concentrations on day seven post insemination in does carried to full term and does not carried to full term in all treatment groups..
113
5 Progesterone (P4) concentrations at day 14 post- insemination in does carried to full term and does not carried to full term in all treatment groups…………………………………………………………………………
114
6 Progesterone (P4) concentrations at day 21 post- insemination in does carried to full term and does not carried to full term in all treatment groups……….
115
Please purchase PDFcamp Printer on http://www.verypdf.com/ to remove this watermark.

Acknowledgement
I am gratefully acknowledge my supervisor Dr. sharaf El Din
Makawi, Head Department of Surgery Gynecology and
Obstetrics, Faculty of Veterinary Medicine. University of
Khartoum for his guidance, continuous encouragement and deep
supervision of this work with an open heart and long patience.
I would like to thanks Dr. Yousif Hussein Elmansoury, Head
Manager of the General Administration for Animal Health
Research, Central Veterinary Research Laboratories (CVRL),
Souba, for his precious advices, valuable help and constant
support.
I am extremely grateful to my colleagues in the Department of
Radio Isotopes and Immunology, (CVRL), Souba, Dr. Asha
Abbas Elsadig, Dr. Elsid Ishag, Dr. Hussina Elbashir , Dr. Amna
Eltayb, Tahani Othman, Faroug Idris, Sabri Hussein, Awadia
Hamid and Badria Eltahir for their great help and assistance in
samples preparation and analysis.
I express thanks to Administrations, staff and labors in the Goat
Improving Project- Ministry of Agriculture- Kartoum state, and
National Centre for Artificial insemination- Ministry of Animal
wealth, Kuko, for providing experimental animals, equipment,
photos and other working facilities.
Please purchase PDFcamp Printer on http://www.verypdf.com/ to remove this watermark.

My thanks are also due to my large family specially my mother
for her great support and patience tally caring for my Childs, my
eldest sister Salha, for her financial supplies, my younger lovely
sister Igbal, my eldest kind brother Ahmed, my brothers Adil,
Tarig and Awwad/alla Ali Adam for their help and unlimited
encouragements.
My thanks extended also to my husband, my children's who
tolerated my absences.
I gratefully record my indebtedness to my best friends Dr.
Amna Eltib, CVRL, Dr. Siham Abdoun and Dr. Ishraga Elhaj,
Administration of Pharmacological Quality Control, Ministry of
Health, for their great help in doing Statistic.
Please purchase PDFcamp Printer on http://www.verypdf.com/ to remove this watermark.

Abstract
The objective of this study is to establish correlations between progesterone concentrations at different stages of a controlled breeding programme and fertility rate in Nubian goats.
Sixty Nubian does, were divided into 6 equal groups, according to age and body condition score. The first group A received no treatment and was naturally mated at natural heat, while the other groups B-F were treated with intra-vaginal progestagen sponges for 12 days. Group C was injected with eCG 48h before sponge removal. Group D was injected with eCG at sponge removal. Group E was injected with eCG and PGF2a� at the time of sponges removal and Group F was injected with PGF2a� 48 hours before sponges removal. All groups were inseminated with fresh-diluted semen 48h after sponge removal.
Blood samples were collected from the jugular vein on the first day of treatment for oestrus synchronization (ES), mid-period of hormonal treatment (day 6), day of insemination (day of oestrus onset), day 7, day 14 and day 21 post-insemination and at ten days intervals during the period of gestation. The blood samples were centrifuged, sera separated and kept at -20°C till assayed for progesterone hormone (P4) concentration using Radioimmunoassay technique (RIA).
The results for the non-Return (NRR) were 50%, 50%, 60%, 60%, 50% and 40% in groups A, B, C, D, E and F respectively, with no significant difference (P!0.05) among the groups. Pregnancy rates ranged between 30% and 50% without a significant difference (P!0.05). Kidding rate registered no significance difference among the groups. It reached (40%) in group D and (30%) in the rest of the groups. Group D showed the highest value (kid/doe) when fecundity rates were compared among the groups, whereas the rest of the groups recorded a range of 0.4-0.7, but with no significant difference (P!0.05). Twining rate was 100% in groups D and E, 67% in groups B, C and E and 33.3% in group F. Litter size was 2.5 in group D and ranged between 2.3 to 1.3 in the other groups without a
Please purchase PDFcamp Printer on http://www.verypdf.com/ to remove this watermark.

significant difference (P!0.05). Pregnancy period was significantly longer (P!0.05) in group B, 152.2±1.9 days, where it was 142±2.1 days in group A.
The progesterone concentrations on day one in both does that carried to full term and those returned to oestrus differed according to the phase of oestrus in each doe at the time of hormonal treatment. The total mean of the P4 concentrations on this day was 14.04±9.63 nmol/l and 12.91±5.25 nMol/l in does that carried to full term and those returned to oestrus, respectively, with no significant difference. At the mid-period of treatment, the total mean of P4 registered a higher concentrations that reached up to 26.92±12.90 nmol/l and 23.70±9.98 nMol/l in goats that carried to full term and those returned to oestrus, respectively, without a significant differences (P!0.05). Progesterone concentration then significantly (P!0.05) declined to its lowest concentrations on the day of insemination (oestrus), the total mean of P4 concentration was 1.71±0.86 nMol/l and 3.86±6.01 nMol/1 in does that carried to full term and those returned to oestrus, respectively. Seven days after insemination, the total P4 mean was found to increase significantly in goats that carried to full term to (33.81±9.97 nmol/ml) compared to those returned to oestrus (11.56±7.89 nmol/l). On day 14 post-insemination, the mean P4 concentrations significantly (P!0.05) increased with the progression of pregnancy in the goats that were carried to full term, the total mean registered was 35.77±15.91 nmol/l, where as in the goats that returned to oestrus it was 19.31±18.29 nMol/l. On day twenty one after insemination, the total mean P4 concentration in the goats that were carried to full term was 33.36±16.65 nmol/l where as in the goats that returned to oestrus the total mean level P4 decreased to 3.67±6.99 nmol/l with a significant difference (P!0.05) between the two groups.
During the first days of pregnancy the progesterone levels rised sharply compared to oestrous levels then, they were maintained at high levels with fluctuating peaks throughout pregnancy, until 2-3 days prior to parturition when they abruptly declined on the
Please purchase PDFcamp Printer on http://www.verypdf.com/ to remove this watermark.
day of parturition. The progesterone concentrations significantly (P!0.05) varied among the does through the period of pregnancy but were not affected by the treatments. However, four does in groups A, C, D and E recorded sudden decline in P4 levels between days 30-95 of pregnancy indicating embryonic mortality.
It was noticed that group D which showed the highest percentages in kidding rate, fecundity, twinning rate and litter size, also registered the highest P4 concentrations at mid-period of progesterone sponges treatment, day 7 and day 21 post-insemination. These results illustrated the importance of progesterone assay in detection of early pregnancy, early embryonic losses and in studying fertility indices in the Sudanese Nubian does.
����������������������������������������
Please purchase PDFcamp Printer on http://www.verypdf.com/ to remove this watermark.

ΔΣϭήσϷ�κϠΨΘδϣ����
�Ɖƈ�řſƆśŦƈƅŔ�¿ţŔũƈƅŔ�Ɠž�ƉƏũƔśŬŠƏũŗƅŔ�ƉƏƈũƍ�ŪƔƄũś�ƉƔŗ�řƁƜŷ�ŧŕŠƔŏ�Əƍ�řŬŔũŧƅŔ�ƋŨƍ�Ɖƈ�ŽŧƎƅŔ
ƓŗƏƊƅŔ�ŪŷŕƈƅŔ�Ɠž�řŗƏŰŦƅŔ�ŚƛŧŸƈƏ�ƓŷŕƊųŰƙŔ�ŢƔƂƆśƅŔ�şƈŕƊũŗ�ƀƔŗųś���
��ŧŧŷ�ũŕƔśŦŏ�Ƈś60�ŗƏƊƅŔ�ŪŷŕƈƅŔ�Ɖƈ�ƑŝƊŌ�ũƈŸƅŔ�ƑƆŷ�ĻŔŧŕƈśŷŏ�řƔƏŕŬśƈ�ŚŕŷƏƈŠƈ�ŚŬ�Ƒƅŏ�ŚƈŬƁƏ�Ɠ
ƇŬŠƅŔ�řƅŕţ�ūŕƔƁƏ����ƏƃƍƕŒ�ŗŵƍƆŞƆƃŒ�Ŋ���ĻŕţƔƂƆś�ŚţƂƅƏ�ĻŕƔƊƏƈũƍ�ŕƎśƆƈŕŸƈ�ƇśƔ�Ƈƅ�ƇƄţśƅŔ�řŷƏƈŠƈ
ĻŕƔŸƔŗų����ŕƈŌ�ŗŵƍƆŞƆƃŒ�Ŕ���Ƒśŝŏ�Řŧƈƅ�řƔƆŗƎƈ�ŚŕŠƊſŬŔ�¿ƄŮ�Ɠž�ƉƏũśŬŠƏũŗƅŔ�ƉƏƈũƎŗ�ŚƆƈƏŷ�ŧƂžĻŕƈƏƔ�ũŮŷ���ŚŕŷƏƈŠƈƅŔ�řƔƂŗ��Ş�Ə���řƔƂŗ�Ŷƈ�Ŗ�řŷƏƈŠƈƅŔ�Ɠž�ŕƈƄ�ƉƏũƔśŬŠƏũŗƅŔ�ƉƏƈũƎŗ�ŚŠƅƏŷ
�ŚŕŷƏƈŠƈƅŔ��Ş��Ə���ŚŕŠƅŕŸƈ�řžŕŲŏ�Ŷƈ�Ŗ�řŷƏƈŠƈƅŔ�Ɠž�ŕƈƄ�ƉƏũƔśŬŠƏũŗƅŔ�ƉƏƈũƎŗ�ŚŠƅƏŷ
ƐũŦŌ���ŗśƃœśƃŒ�ŗŵƍƆŞƆƃœż��Ŝ���¿ƈŕţƅŔ�ūũſƅŔ�¿Űƈ�ƉƏƈũƎŗ�ŕƎƊƂţ�ƇśeCG��ŖţŬ�Ɖƈ�ƉƔƈƏƔ�¿ŗƁ
řƔƆŗƎƈƅŔ�ŚŕŠƊſŬƙŔ����ƍŧƃŒ�ŗŵƍƆŞƆƃŒ�ŗŶŕŒ�ť���ŖţŬ�ŧƊŷ�¿ƈŕţƅŔ�ūũſƅŔ�¿Űƈ�ƉƏƈũƎŗ�ŚƊƂţ
řƔƆŗƎƈƅŔ�ŚŕŠƊſŬƙŔ����ŕƈŌ�ŗŪƆœŤƃŒ�ŗŵƍƆŞƆƃŒ�ºƋ���ƑƈƍƆŧƌŕ�Řƈƀš�ťƀż¿ƈŕţƅŔ�ūũſƅŔ�¿Űƈ��Ə
ƉƔŧƊƜƁŕśŬƏũŗƅŔ��ŖţŬ�ŚƁƏ�ƓžřƔƆŗƎƈƅŔ�ŚŕŠƊſŬƙŔ����ŕƈŌƏ�ŗŪťœŪƃŒ�ŗŵƍƆŞƆƃŒ�ƍ���ƉƏƈũƎŗ�ŚƊƂţžƉƔŧƊƜƁŕśŬƏũŗƅŔ�ƈƅŔ�ŚŕŠƊſŬƙŔ�ŖţŬ�ŚƁƏ�ƓžřƔƆƔŗƎ����ŕƎţƔƂƆś�Śƈś�řŠƅŕŸƈƅŔ�ŚŕŷƏƈŠƈƅŔ�¿Ƅ
�ŧŸŗ�ŽſŦƈ�ƒƏƊƈ�¿œŕŬŗ�ĻŕƔŷŕƊųŰŏ���řƔƊƏƈũƎƅŔ�řŠƅŕŸƈƅŔ�ʼnŕƎśƊŏ�Ɖƈ�řŷŕŬ���
�ŶŗŔũƅŔ�ƇƏƔƅŔ���ŶŗŕŬƅŔ�ƇƏƔƅŔ���ŢƔƂƆśƅŔ�ƇƏƔ�Ɠž����ūŧŕŬƅŔ�ƇƏƔƅŔ���řŗũŠśƅŔ�ʼnŧŗ�ŧƊŷ�Ƈŧ�ŚŕƊƔŷ�ŚŸĊƈąŠ
¿ƄƏ�ŢƔƂƆśƅŔ�ŧŸŗ�ƉƏũŮŸƅŔƏ�ƒŧŕţƅŔ�ƇƏƔƅŔ���ũŮŷ�Ō�ŘũŮŷ¿ƈţƅŔ�Řũśž�řƔŕƎƊ�Ƒśţ�ƇŕƔ� �ĊŰŁž�ƇŧƅŔ�¿ƅŔ�ƑƆŷ�¿ƏŰţƆƅ�ƒŪƄũƈƅŔ�ŧũųƅŕŗ¿Űƈ�ƉƏũśŬŠƏũŗƅŔ�ƉƏƈũƍ�ŪƔƄũś�ūŕƔƂƅ�Ŕ�řƔƊƂśŗ¿ƔƆţśƅ��ƓŷŕƊƈƅŔ
�ƓŷŕŸŮƙŔ(RIA)���
�ƀŗŮƅŔ�ŘũƏŧƅ�ŵƏŠũƅŔ�Ƈŧŷ�¿ŧŸƈ�źƆŗ�ŚŕŷƏƈŠƈƅŔ�ƉƔŗ�řƔƆŬŕƊśƅŔ�ŘʼnŕſƄƅŔ�řƊũŕƂƈ�ŧƊŷ60���Ɠž
�ƉƔśŷƏƈŠƈƅŔ�Ş��Əŧ��ƉƔŗ�šƏŔũś�ŕƈƊƔŗ�40��Ə50���Ƈƅ�ƓœŕŰţƙŔ�¿ƔƆţśƅŔ�ƉƄƅƏ�ŚŕŷƏƈŠƈƅŔ�řƔƂŗ�Ɠž
�řſƆśŦƈƅŔ�ŚŕŷƏƈŠƈƅŔ�ƉƔŗ�řƔƏƊŸƈ�ƀƏũž�ƒŌ�¿ŠŬƔ(p>0.05)����ϞϤΤϟ�ϝΪόϣ�Ύϣ�ƉƔŗ�šƏŔũśž50��Ə40���ŚŕŷƏƈŠƈƆƅ�Ş��ŧ���ŚŕŷƏƈŠƈƅŔƏ�Ō�Ŗ�ŧ�»ƍ���řƔƏƊŸƈ�ƀũŔƏž�ƉƏŧŗ�ƓƅŔƏśƅŔ�ƑƆŷ
(p>0.05)����ƀũŔƏž�ĻŕŲƔŌ�ŘŧƛƏƅŔ�ŚƛŧŸƈ�¿ŠŬś�Ƈƅ�ŚżƆŗ�ŜƔţ�ŚŕŷƏƈŠƈƅŔ�ƉƔŗ�řƔƏƊŸƈ40���Ɠž�řŷƏƈŠƈƅŔ�ŧ��Ə30��ŚŕŷƏƈŠƈƅŔ�řƔƂŗ�Ɠž����řŷƏƈŠƈƅŔ�ŚƆŠŬ�ŧ���¿ŧŸƈ�řƊũŕƂƈ�ŧƊŷ�şœŕśƊƅŔ�¿ŲžŌ
�řƔƏƊŸƈ�ƀũŔƏž�ƉƏŧŗ�ƉƄƅƏ�ŚŕŷƏƈŠƈƅŔ�ƉƔŗ�řŗƏŰŦƅŔ(p>0.05)����ϥΎΘϋϮϤΠϤϟ�ΕήϬχϭ��Νϭ�Ω��
�ϢϮΘϟ�ΕϻΪόϣ�ϰϠϋ�100���ϓ�ΔΒδϨϟ�ΖΣϭήΗ�ΎϤϨϴΑ�ΕΎϋϮϤΠϤϟ�ΔϴϘΑ�ϲ�ƉƔŗ33,3���Ə67�����źƆŗ�řŷƏƈŠƈƅŔ�Ɠž�ŧƔƅŔƏƈƅŔ�¿ŧŸƈ�ŧ��2,5��ƉƔŗ�ŚŕŷƏƈŠƈƅŔ�řƔƂŗ�ŚţƏŔũś�ŕƈƊƔŗ1,67��Ə2,33�����ŚſƆśŦŔ
�řŷƏƈŠƈƅŔ�Ɠž�¿ŰƏ�ŕƈƊƔŗž�ŚŕŷƏƈŠƈƅŔ�ƉƔŗ�ĻŕƔƏƊŸƈ�¿ƈţƅŔ�Řŧƈ�Ŗ���Ƒƅŏ1,9±152��ŚƆŠŬ�ĻŕƈƏƔ�řŷƏƈŠƈƅŔ�Ō���Řũśž�ũŰƁŌ(2,1±142)�����
Please purchase PDFcamp Printer on http://www.verypdf.com/ to remove this watermark.

ƗŔ�ƇƏƔƅŔ�Ɠž�řƔŔŧŗ�ŧƊŷ�ƀŗŮƅŔ�ŘũƏŧ�řƆţũƈ�ƑƆŷ�ĻŔŧŕƈśŷŏ�ƉƏũśŬŠƏũŗƅŔ�ŪƔƄũś�ŽƆśŦŌ�řŗũŠśƆƅ�¿Ə
�Ə�ũſŰƅŔ�ƉƔŗ�šƏŔũś���řƔƊƏƈũƎƅŔ�řƆƈŕŸƈƅŔ34,79Ɖ��¿Əƈ��ƉƏƈũƎƆƅ�ƓƆƄƅŔ�ųŬƏśƈƅŔ�źƆŗ�ŕƈƔž�ũśƔƅ14,04�u�9,63Ɖ��¿Əƈ��Ə�ũśƔƅ12,91�u�5,25Ɖ��¿Əƈ��ŖŠƊś�Ƈƅ�ƓśƅŔƏ�ŚŗŠƊŌ�ƓśƅŔ�ŪŷŕƈƆƅ�ũśƔƅ
ƓƅŔƏśƅŔ�ƑƆŷ��řƔƏƊŸƈ�ƀũŔƏž�ŧƏŠƏ�ƉƏŧ(p>0.05)����ŚƊŕƄ�řŗũŠśƅŔ�řƔŔŧŗ�Ɖƈ�ūŧŕŬƅŔ�ƇƏƔƅŔ�Ɠž�řƔƏƊŸƈ�ƀũŔƏž�ŧƏŠƏ�ƉƏŧ�řŸſśũƈ�ƉƏƈũƎƅŔ�ŚŕƔƏśŬƈ(p>0.05)��ųŬƏśƈƅŔ�źƆŗƏ�ŚŕŷƏƈŠƈƅŔ�ƉƔŗ
�ƉƏƈũƎƆƅ�ƓƆƄƅŔ26,92�u�12,90Ɖ��¿Əƈ��Ə�ũśƔƅ23,70�u�9,98Ɖ��¿Əƈ��ŚŗŠƊŌ�ƓśƅŔ�ŪŷŕƈƆƅ�ũśƔƅ
ƅŔ�ƑƆŷ�ŖŠƊś�Ƈƅ�ƓśƅŔƏ�řƔƏƊŸƈ�ƀũŔƏž�ŧƏŠƏ�ƉƏŧ�ƓƅŔƏś(p>0.05)���ƉƏƈũƍ�ŪƔƄũś�űſŦƊŔ�ƉƏŧ�ƀŗŮƅŔ�ŜƏŧţ�ƑƆŷ�¿ŧś�ŚŕƈƜŷ�ŚũƎŴŌ�ƓśƅŔ�ŪŷŕƈƆƅ�řŗŬƊƅŕŗ�ŢƔƂƆśƅŔ�ƇƏƔ�Ɠž�ƉƏũśŬŠƏũŗƅŔ
�řƔƏƊŸƈ�ƀũŔƏž�ŧƏŠƏ(p>0.05)��ƉƏƈũƎƆƅ�ƓƆƄƅŔ�ųŬƏśƈƅŔ�źƆŗƏ�ŚŕŷƏƈŠƈƅŔ�ƉƔŗ1,71�u�0,86Ɖ��¿Əƈ��Ə�ũśƔƅ3,86�u�6,01Ɖ��¿Əƈ�ƅ�ũśƔƅ�ŧƏŠƏ�Ŷƈ�ƓƅŔƏśƅŔ�ƑƆŷ�ŖŠƊś�Ƈƅ�ƓśƅŔƏ�ŚŗŠƊŌ�ƓśƅŔ�ŪŷŕƈƆ
�řƔƏƊŸƈ�ƀũŔƏž(p>0.05)�ƉƔśŷƏƈŠƈƅŔ�ƉƔŗ����ƉƏƈũƍ�ŪƔƄũś�Ŷſśũŏ�ŢƔƂƆśƅŔ�ŧŸŗ�ŶŗŕŬƅŔ�ƇƏƔƅŔ�Ɠž�ƓƆƄƅŔ�ųŬƏśƈƅŔ�źƆŗƏ�ƀŗŮƅŔ�ŘũƏŧ�¿ŧŸƈ�Ɖŷ�ƉƏũśŬŠƏũŗƅŔ33,81�u�9,97Ɖ��¿Əƈ��ƓśƅŔ�ŪŷŕƈƆƅ�ũśƔƅ
�źƆŗ�ŕƈƔž�ŚŗŠƊŌ11,56�u�7,89Ɖ��¿Əƈ��řƔƏƊŸƈ�ƀũŔƏž�ŧƏŠƏ�Ŷƈ�ŖŠƊś�Ƈƅ�ƓśƅŔ�ŪŷŕƈƆƅ�ũśƔƅ
(p>0.05)�ƉƔśŷƏƈŠƈƅŔ�ƉƔŗ����Ɠž�ƉƏũśŬŠƏũŗƅŔ�ŪƔƄũś�ŶſśũŔ�ŢƔƂƆśƅŔ�ŧŸŗ�ũŮŷ�ŶŗŔũƅŔ�ƇƏƔƅŔ�Ɠž�ƉƏƈũƎƆƅ�ƓƆƄƅŔ�ųŬƏśƈƅŔ�źƆŗƏ�¿ƈţƅŔ�ƇŧƂś�Ŷƈ�ŚŗŠƊŌ�ƓśƅŔ�ŪŷŕƈƅŔ35,77�u�15,91Ɖ��¿Əƈ��ŕƈƔž�ũśƔƅ
�źƆŗ19,31�u�18,29Ɖ��¿Əƈ��ŪŷŕƈƆƅ�ũśƔƅ�řƔƏƊŸƈ�ƀũŔƏž�ŧƏŠƏ�Ŷƈ�ŖŠƊś�Ƈƅ�ƓśƅŔ(p>0.05)��ƉƔŗƉƔśŷƏƈŠƈƅŔ���ƉƏũśŬŠƏũŗƅŔ�ƉƏƈũƎƅ�ƓƆƄƅŔ�ųŬƏśƈƅŔ�źƆŗ�ŢƔƂƆśƅŔ�ŧŸŗ�ƉƏũŮŸƅŔƏ�ƒŧŕţƅŔ�ƇƏƔƅŔ�Ɠž
�ŚŗŠƊŌ�ƓśƅŔ�ŪŷŕƈƆƅ33,36�u�16,65Ɖ��¿Əƈ��Ƒƅŏ�űſŦƊŔ�ŕƈƔž�ũśƔƅ3,67�u�6,99Ɖ���¿Əƈ��ũśƔƅ
�řƔƏƊŸƈ�ƀũŔƏž�ŧƏŠƏ�Ŷƈ�ŖŠƊś�Ƈƅ�ƓśƅŔ�ŪŷŕƈƆƅ(p>0.05)�ƉƔśŷƏƈŠƈƅŔ�ƉƔŗ�����
Řũśž�¿ƜŦ��¿ŰƏ�Ƒśţ���řſƆśŦƈ�ƇƈƁ�ƉƔŗ�ĻŕŗŨŗŨśƈ���řƔƅŕŷ�ŚŕƔƏśŬƈƅ�ƑƆŷ�ƉƏƈũƎƅŔ�ŪƔƄũś�Ŵžŕţ�¿ƈţƅŔ
�ƌƅ�ƐƏśŬƈ�ƑƊŧŌ�Ƒƅŏ��Ɖƈ�¿ƁŌ3,18�Ɖ��¿Əƈ�ũśƔƅ���ƐƏśŬƈ�ƉŐž�ŘŧƛƏƅŔ�ƇƏƔ�Ɠž�ŕƈŌ���ŘŧƛƏƅŔ�ŧŸŗ�ĻŕƔŗŬƊ�ĻŕŸſśũƈ�ƉŕƄ�ƉƏƈũƎƅŔ��Ɖƈ�ũŝƄŌ�ƇŔũŠ�Ɖ����ŚţŲƏŌ��ŚŕŠƅŕŸƈƆƅ�ũƔŝōś�ƛ�ƉŌ�řŬŔũŧƅŔ�ƋŨƍ
�řſƆśŦƈƅŔ�řƔƊƏƈũƎƅŔ�ŚŕŷƏƈŠƈƅŔ���ƉƏũśŬŠƏũŗƅŔ�ƉƏƈũƍ�ŪƔƄũś�ƑƆŷ (p>0.05)¿ƈţƅŔ�ʼnŕƊŝŌ�����űŸŗ�ŚŕŷƏƈŠƈƅŔ�Ɠž�ŜŕƊƙŔ�»ƍ��ŧ���Ş���Ō���ƉƔŗ�ŕƈ�ƉƏũśŬŠƏũŗƅŔ�ƐƏśŬƈ�Ɠž�ĻŔŧŕţ�ĻŕŲŕſŦƊŏ�ŚƆŠŬ30�
ô�95�ŜƏŧţƅ�řţŲŔƏ�ŘũŕŮŏ�ƃƅŨ�ƉŕƄƏ�ŢƔƂƆśƅŔ�ŧŸŗ�ƇƏƔ�řƊŠƘƅ�ƀƏſƊ���
řŬŔũŧƅŔ�ƋŨƍ�¿ƜŦ�Ɖƈ��řŷƏƈŠƈƅŔ�ƉŌ�ŴţƏƅ�ŧ���ŘŧƛƏƅŔ�ŚƛŧŸƈ�ŜƔţ�Ɖƈ�şœŕśƊƅŔ�ƑƆŷŌ�ŚũƎŴŌ�ƓśƅŔƏ�ʼnŧŗ�Ɖƈ�ūŧŕŬƅŔ�ƇƏƔƅŔ�Ɠž�ƉƏƈũƎƆƅ�ŪƔƄũś�ƑƆŷŌ�ŚƆŠŬ�ŧƁ�ƇœŔƏśƅŔ�¿ŧŸƈƏ�ƑŝƊƘƅ�ŧƔƅŔƏƈƅŔ�ŧŧŷ��
ƏũŮŸƅŔƏ�ƒŧŕţƅŔ�ƇƏƔƅŔƏ�ŢƔƂƆśƅŔ�ŧŸŗ�ŶŗŕŬƅŔ�ƇƏƔƅŔ���ŚŕŠƊſŬƗŕŗ�řŠƅŕŸƈƅŔŢƔƂƆśƅŔ�ŧŸŗ�Ɖ��ŢŲƏƔ�ŔŨƍƏ�ƅŔ�ůţſƅŔ�Ɠž�ƉƏũśŬŠƏũŗƅŔ�ƉƏƈũƍ�ŪƔƄũś�ūŕƔƁ�řƔƈƍŌŽŮƄ��ũƄŗƈƅŔ�ƀƏſƊƅŔ�Śƛŕţ�ŽŮƄƏ�¿ƈţƆƅ
ƓƊŔŧƏŬƅŔ�ƓŗƏƊƅŔ�ŪŷŕƈƅŔ�Ɠž�řŗƏŰŦƅŔ�ŚƛŧŸƈ�řŬŔũŧ�Ƒƅŏ�řžŕŲƙŕŗ�řƊŠƘƅ���
Please purchase PDFcamp Printer on http://www.verypdf.com/ to remove this watermark.

Please purchase PDFcamp Printer on http://www.verypdf.com/ to remove this watermark.

1
INTRODUCTION Animal resources in the Sudan are estimated to be around140 millions heads,
including cattle, sheep, goat and camel. They play a very important role in the
national economy. The goat population in Sudan is estimated as 41 million
heads distributed throughout the country (MAWF, 2009), their importance is
associated with their contributions to their supplies of milk, meat and skin as
well as manure. Goats are bred by a large sector of the people in the rural areas,
and are well of being (The poor man's cow) because they are owned by those
who can not afford to keep cows for meat and milk production.
Nubian goats are among the best dairy breeds in Africa especially in Sudan
where they comprise 47% of the total goat population. They could reach up to
85 cm in wither height: Males weigh 50-70 kg and females 40-60 kg. Kidding
interval is 228±17days, with a fair twining rate. High proportion of single births
(60%) occurs, while twin and triplet percentage are 30% and 3% respectively
(El Naim, 1979). Weight at birth is 2.5kg for males and 2.1kg for females.
Lactation length is 147days and milk yield is 1.5-2.0 kg/day (Muna et al, 2000).
Nowadays research activities on goat reproduction witness a remarkable
increase. They are focused on performance improvement through proper
management, feeding and breeding programmes.
Cross-breeding is practiced in the Sudan since 70s, it aimed at improving the
genetic potential of the low producing local breeds through crossing with the
internationally high producer foreign goat breeds like, Saaneen, Toggenburg,
and Anglonubian . This crossing is assumed to lead to an increase in goat
productivity thus increasing the welfare of the goat owners. Crossing between
local Nubian goats and Saaneen bucks is the most common practice in the
Sudan and the resultant cross- bred goats are seen almost everywhere. Their
Please purchase PDFcamp Printer on http://www.verypdf.com/ to remove this watermark.

2
improved milk productivity, tolerance to high temperature and adverse
conditions were reported.
There is a need for early pregnancy diagnosis in goats, reliable techniques for
early detection of pregnancy aid in culling or rebreeding of barren does
( Linonel, 1990 and Elmansoury, 2008), and provide available tool for
controlled breeding program. Inability to detect early pregnancy can result in
economic losses in milk supplies, kid production and longer kidding intervals
((Ishwar, 1995). Traditional methods used by goat owner for pregnancy testing
such as a change in behavior, drop in milk yield, tendency to fatten up and
change in body out line are not completely reliable, as they do not distinguish
between true and false pregnancy. Absence of heat could be a useful indicator,
but unfortunately many goats have tendency to show some signs of oestrus
during pregnancy. Therefore, a variety of pregnancy diagnosis methods in
goats have evolved, such as abdominal palpation, ultrasonography , and
hormonal assays (Kinne, 2006).
Measurement of concentrations of steroid hormones such as oestrone sulphate
and progesterone at specific times post-breeding provides a good method of
pregnancy diagnosis in small ruminants (Murray and New stead, 1988; Refstal
et al., 1991). Progesterone is used as an early pregnancy test (18-19 days after
insemination in ewes and 21-22 days in does). The over all accuracy of this test
is higher than 90%. It has been found to be of a significant clinical value in
females of most domestic species and, in fact, the most useful information
about the reproductive status of animals such as age at puberty, pregnancy,
and post partum ovarian activity (FAO/IAEA, 1999). Hormonal radio
immunoassay (RIA) has allowed the development of sensitive tests (Boscos et
al., 2003).
Please purchase PDFcamp Printer on http://www.verypdf.com/ to remove this watermark.

3
The objective of this study:
• To establish a base-line data for the normal progesterone concentrations
at the different stages of reproduction in the Nubian goats.
• To monitor the success of oestrus synchronization and A.I. in goats.
• To establish correlation between progesterone concentrations and fertility
rate at different stages of a controlled breeding program.
Please purchase PDFcamp Printer on http://www.verypdf.com/ to remove this watermark.
4
Chapter one
Literature Review
1. 1. Detection and control of oestrus and ovulation 1.1.1. Natural oestrus
Oestrus is the time during the reproductive cycle in animals when the females
displays interest in mating and in most species will stand to be mounted by both
sexes and mated by males. In most cases the females is about to or has just
ovulated, and is therefore pregnable (Blood, et al, 2007). Oestrus cycle is
divided into two phases, the follicular phase which is the period of follicular
growth and the luteat phase which is the period of corpus luteum functioning
(Noakes et al., 2001).
1.1.2. Oestrus detection
Oestrus detection is generally based on the criteria of sexual receptivity of the
female to mounting by the male , its in fact, the postural immobilization which
will allow mating and deposition of semen by the male into the female (FAO,
1990). Oestrus signs were monitored twice daily (am and pm) using a
vasecotomized buck, immobilization of the female at mounting by the male was
considered a sign of oestrus behavior ( Feritas, et al., 1996b).
1.1.3. Oestrus signs
The signs of oestrus could be manifested as: restlessness, frequent urination, tail
flagging, mounting other females, swollen of the vulva, intermittent discharges
of vaginal mucus, change of the colour of vulva from pale to bright pink
( Shalaby, et al., 2000 and Noakes et al., 2001).
1.1.4. Oestrus duration and length
Oestrus duration was defined as the time between the first and the last accepted
mount, within the same oestrus period (Dogan et al.,2005). The duration of
Please purchase PDFcamp Printer on http://www.verypdf.com/ to remove this watermark.

5
oestrus cycle of the dairy goats varies from breed to another, it was registered
as 28-35 hours in West African Dwarf goats (Akusu and Egbunike, 1990) , 12-
48 hours (Kadouda, 1985), and 36-52 hours (Jubara, 1996) in the Sudanese
Nubian does. The oestrus length is approximately 20-21 days and differ
according to the breed and environment (Hafez and Hafez, 2000), In (2001),
Zarkawi and Soukouti, reported that the average length of the oestrus cycles in
the Damascus breed was (21.2±1.5 days) which ranged between 19-26 days.
While in the Sudanese Nubian breed the oestrus length ranges between 19-24
days according to Kadouda, (1985).
1.1.5. Factors influence the onset of the oestrus
Oestrus onset was affected by many factors like nutrition which affects the
number of oocytes, attainment of puberty and sexual maturity in goats were
very much delayed in inadequately fed female goats , season mainly in
temperate breeds where there is cessation of oestrus during certain months,
presences of the male which stimulates the secretion of the reproductive
hormones and diseases which affect gonads and hence oestrus cycle
( Williamson and payner,1978; Greyling and Van Niekerk, 1990; Ahmed et al.,
1998; Romano, 1998a, 2002).
1.1.6. Ovulation
Ovulation is the process in which the mature graefian follicle ruptures and
release the mature ovum. It is spontaneous, and it occurs in does regardless of
whether or not mating takes place (Evans and Maxwell, 1987).
1.1.6.1.Time of ovulation
Ovulation in goats is generally reported as occurring a few hours after the
termination of standing oestrus (Riera,1982) or towards the end of oestrus
(Vander Westhuysen et al., 1985).Ovulation in different goat breeds , excluding
the Nubian has previously been estimated to occur 24 hours to 40 hours after
Please purchase PDFcamp Printer on http://www.verypdf.com/ to remove this watermark.
6
sexual receptivity. Nubian doe characteristically ovulates during oestrus,
possibly as a reflection of a more prolonged oestrus period in comparison to
other breeds.
1.1.6.2. Ovulation rate
In sheep and goat the number of ova released could range from one to many
depending upon the breed (Hunter et al., 2004). Ovulation rate (number of ova
liberated from the ovary during a given oestrus period) are quoted from 1-2 for
Angora (Shelton, 1960b) to 4 for Black Bengal does (Rao and
Bhatacharrya.,1980). In the Nubian breed as reported by Camp et al. (1982) ,
the number of ova produced by the female / oestrus was 3.1, and the ovulatory
activity in the Nubian doe was greater on the right compared to the left ovary
which was consistent with the findings in other breeds ( Wani , 1982 ).
1.1.6.3. Factors effecting ovulation rate
As described by Hunter et al. (2004), the ovulation rate is influenced by the
following factors:
i. The differences in the hypothalamic-pituitary-ovarian feed- back response
(mainly FSH and LH) lead to the differences in the number of ovulatory
follicles.
ii. Exogenous hormones administered or GnRH- agonist models in which
endogenous gonadotropin secretion is suppressed and exogenous LH and/or
FSH when administered at specific concentration in defined patterns, are useful
for elucidating the precise roles of specific hormones in stimulating follicular
development.
iii. Environmental factors such as nutrition which effects the quality of oocyte
and consequently embryo development and survival.
Please purchase PDFcamp Printer on http://www.verypdf.com/ to remove this watermark.

7
iv. Recently, the regulation of follicular angiogenesis has been shown , to be
important for the development of ovulatory follicles and maintenance of
adequate levels of progesterone to sustain pregnancy.
1.1.7. Hormonal profile during oestrus
1.1.7.1. Progesterone
During oestrus and during seasonal anoestrus, the plasma progesterone
concentrations is <1ng/ml. Progesterone concentrations values reported
during luteal phase (typically 4 to 8 ng/ml) are variable and depends on the
number of corpora lutea present and the assay procedure used. Progesterone
concentration drops 3 days before the next oestrus (Thorburn and Schneider.,
1972). Similar results were registered by Shalaby et al. (2000) when they
studied the reproductive performance of Damascus goats in semi-arid areas in
Egypt and Khanum et al. (2008), when they studied the progesterone profile
during oestrus in Dwarf goat.
1.1.7.2. Estradiol 17 .B
The level of this hormone in the blood rises from the base line of about 8 to
10 pg/ml at the beginning of standing heat only, to fall to the base line again
12 hours later ( Leyaocariz et al .,1995). With the initiation of cyclicity,
estradiol attains higher levels (7.7 ± 1.7 pg/ml) at oestrus phase and drops down
to the lower levels within 3 to 4 days post-oestrus (Khanum et al., 2008).
1.1.7.3. LH ( Lutenizing Hormone)
Pre-ovulatory peak of LH concentration is taken as being indicative of
ovulation. LH peaks appeared to precede ovulation by about 18 - 28h and it
relatively correlated with ovulation rate ( Ritar et al. 1980), LH surge was most
pronounced when PMSG was administered 48 h before rather than at sponge
removal.
Please purchase PDFcamp Printer on http://www.verypdf.com/ to remove this watermark.

8
1.1.7.4. FSH (Follicular Stimulating Hormone)
FSH is the main hormone controlling follicular growth in cattle, sheep and pigs
and its secretion is in turn controlled via the main secretary product of large
follicule(s), oestradiol and inhibin A. (Adams, 1999; Webb et al., 2004).
1.2. Oestrus synchorinization Oestrus synchronization or the artificial hormonal control of oestrus is a
valuable managemental tool that has been successfully employed in enhancing
reproductive efficiency in farm animals (Lu Meng et al., 2008), particularly in
dairy and beef cattle and in sheep ( Henderson et al., 1984; Carlson et al.,
1989; Hamra et al.,1989) . In goats the opportunity for control is greater during
the luteal phase, which is of longer duration and more responsive to
manipulation ( Wilddeus, 1999).
1.2.1. Advantages of oestrus synchronization
As in other species the control of goat reproduction offers different advantage at
farm levels and at the level of a population where genetic program could be
employed, these advantages were described by . (Karaemer 1989, Kusina et al.,
2000 and Abu et al., 2008 ) and were summarized as follow:
a. A large number of does could be bred over a short period. As a result,
management could be concentrated during a short period.
b. Does could be bred at the time that will be suitable for the best marketing
opportunities.
c. Synchronization would also allow producers to schedule kidding to take
advantage of feed supplies, labor, and upward price trends.
d. Implementation of breeding technologies such as artificial insemination and
preparation of donor and recipient does for use in embryo transfer.
Please purchase PDFcamp Printer on http://www.verypdf.com/ to remove this watermark.

9
1.2.2. Achievement of oestrus synchronization
Oestrus synchronization in does, as in cows and ewes, is achieved either
by reducing the length of the luteal phase of the oestrus with prostaglandin
F2a� (PGF2a�) or its analogous, such as cloprostenol ( Estrumate, Cooper ,
UK ) or extend it artificially with exogenous progesterone or more potent
progestagens (Molowuku, 1980; Devendra, 1983; Karatzas et al., 1997;
Amarantidis et al., 2004; Abu et al., 2008).
1.2.2.1. Oestrus synchronization using Prosraglandin F2a� (PGF2a�)
Prostagladin F2a� is often used in a combination with superovulation regimens
to synchronize oestrus by inducing complete regression of corpus luteum
(lutelysis) and hence affect oestrus initiation and was found to be more
convenient and economical method (Perera et al., 1987; Mahmood et al., 1991;
Krisher et al., 1994; Romano 1998b., Muna et al., 1998; Wideus, 2000; Noakes
et al., 2001; Bitaraf et al., 2007 ).
1.2.2.2. Dose of PGF2a�
Administration two doses of 125 to 250g cloprostenol 10 days a part induced
oestrus within 18-48 h in non descript indigenous goat breed (Perera et al.,
1987). Thus same procedure resulted in 84% Red Sokoto does being
synchronized ( Molowuku et al., 1980). Ozawa et al., (2005) synchronized
oestrus cycle in goat using a single intramuscular Injection of 0.5 ml (PGF2a� )
administered 8-10 days following the detection of oestrus.
1.2.2.3. Oestrus synchronization using progestagens
Exogenus progesterone is used to prolong oestrus cycle. The most commonly
used exogenous progesterones are FAG-Flurogesterone acetate and MAP-
Medroxy progesterone acetate ( Bretzlaff and Madrid,1989 ; Bretzlaff, 1997;
Motlomelo, 2002). Abu et al., (2008) synchronized oestrus in West African
Dwarf goats using intramuscular injection of progesterone.
Please purchase PDFcamp Printer on http://www.verypdf.com/ to remove this watermark.

10
The insertion of a vaginal sponges containing a progesterone analogues (FAG-
Fluroggestone acetate ) prolong the luteal phase where the high concentration of
progesterone inhibits the GnRH pulsteitile secretion by the hypothalamus thus
stopping ovulation until the following luteolysis ( Leboeuf, et al, 1997).
The use of PGF2a� application together with FAG increase oestrous response
rate (Dogan et al., 2005). The use of Gonadotropins such as eCG in conjugation
with intravaginal progestagen treatment, reardless PGF2 a� administration was
found to be efficient methods for oestrous induction and synchronization in
sheep and goats (Fonseca et al., 2005; Mehmet and Mehmet, 2006). Babiker et
al .,(2010), when they studied fertility in the Nubian goats concluded that
progesterone treatment (FAG) intravaginal sponges and their combination with
either eCG or PGF are efficient in synchronizing oestrus and seems to be more
convenient.
1.2.2.4. Duration and Dosage of progesterone treatment
The most widely used procedures for synchronization and/or the induction of
oestrus are the introduction of FAG or MAP impregnated intravaginal sponge
for 11-13 days ( Romano, 1996, 1998 a, b, 2002; Romano and Benech., 1996;
Romano and Fernandez Abella., 1997; Romano et al., 2000) and intramuscular
injection of PMSG at the sponge withdrawal ( Greyling and Van der Nest, 2000;
Babiker et al., 2010), or 11 days treatment with FAG impregnated intravaginal
sponges and an intramuscular injection of eCG and synthetic PGF2a�
analogous 48 h before or at sponge withdrawal (Baril et al., 1993; Freitas et
al.,1996a,b., 1997; Leboeuf et al., 2003).
Ovulation is effectively controlled by injection of PMSG around the time of
cessation of intravaginal treatment with sponges containing flurogestone acetate
(Ritar et al., 1984) or with controlled internal drug release CIDR containing
Please purchase PDFcamp Printer on http://www.verypdf.com/ to remove this watermark.
11
progesterone, with no difference in the results between the two treatments
(Ritar et al., 1989).
Motlomle et al., (2002) synchronized oestrus in goats using different
progesterone treatments, MAP(60mg), FAG(40mg) and CIDR. They were
administered for 16 days period and does received 300 iu PMSG i/m at the end
of treatment. These progestagen did not show significant differences in oestrus
response (97%) and duration (33.3 ± 13.4 hrs) of induced oestrus period .Time
of onset of oestrus is advanced in CIDR and also serum progesterone
concentrations in CIDR group where higher (P<0.05) between day 4 and 16 of
progesterone treatment compared to MAP and FAG groups. No significant
difference was observed with respect to pregnancy rate 40 days after AI.
1.2.2.5. Fertility after hormonal treatment
The use of progestagens for improving fertility, pregnancy and kidding rates
will continue to be a viable option in reproductive management of goats (Sahlu
and Goetsch, 2005). Fertility value estimated as the number of does conceived
per hundred does mated (Mari et al., 2000 ). Feritas et al. (1997) assessed the
number of goats ovulated and fertility (number of pregnant goats /number of
treated goats) by a semi–quantitative progesterone assay in blood samples
collected 5 or 6 days, 21 or 22 days after oestrus (day 0). They recorded
conception rates of, 83.9, 49.1 and 66.7; kidding rate 75.0, 45.5 and 58.8; and
litter size of 1.9±0.8, 1.8±0.8 and 1.9±0.8. Ahmed et al., (1998) registered that
fertility rate in Sudanese Nubian does treated with progesterone impregnated
sponges was 40% while Babiker et al., (2010), mentioned that fertility in
Nubian goats measured by the kidding rate was not significantly different
between different synchronized groups and were varied between 20%-35%.
Romano (2004) recorded that the kidding rate after AI in the CIDR, FGA and
MAP treatments were 63%, 65% and 63% respectively.
Please purchase PDFcamp Printer on http://www.verypdf.com/ to remove this watermark.
12
Fertility depends on the time of and efficacy of the treatment to control
oestrus and thereafter ovulation. Baril et al. (1993) noticed that fertility rate
decreased significantly in animals which came into oestrus later than 30h after
sponge removal (late oestrus ), than for goats that exhibited oestrus earlier
(33.3%-65%, P< 0.001). The frequency of late oestrus was not dependant on
the age of goats, but on the number of treatments that they had previously
received , suggesting that the late oestrus could be related to the appearance of
anti-eCG antibodies. The use of eCG resulted in a more predictable occurrence
of oestrous. One limitation of eCG after long-term use is the active production
of anti- eCG antibodies which decrease fertility in goats (Leboeuf et al., 1998;
Fonseca et at., 2005).
Low fertility rates were observed in does treated with half implants of
Norgostomet , compared to goats which received FAG sponges, while in goats
treated with whole implants the decrease of fertility rate was not significant.
Doses of the synchronization hormones affects fertility rate, this fact was stated
by Romano (1998b), who observed that fertility rates resulted from artificial
insemination after a dose of 125 and 62.5 mg Cloprostenol were 4/8 and 5/8,
respectively.
Fertility rate could be also affected by the type of semen used and by the
number of inseminations applied. Karatas et al., (1997) reported that the overall
kidding rate with fresh semen (65%) was significantly higher (P<0.05) than
that with frozen semen (53%), and the overall kidding rate was significantly
higher (P<0.001) in the does inseminated twice with fresh or frozen-thawed
semen (70.4% and 59.1% respectively) than in those inseminated only once
(48.9% and 44.9% respectively). A decrease in fertility following progestagin-
based synchronization in the absence of corpus luteum, and a fixed time
artificial insemination has being observed ( Lassala et al., 2004).
Please purchase PDFcamp Printer on http://www.verypdf.com/ to remove this watermark.

13
Season and housing were found to influence ovarian activities and hence
fertility, possibly due to changes in temperature and photoperiod. Lleweyn and
Ogaa (1995) observed that the proportions of normal cycles occurring in winter
was 87% and 77% for goats in single and groups pens respectively, falling to
62% and 37.5% respectively in spring.
1.3. Artificial insemination Artificial insemination even when used in small scale, allows links between
flocks which increases the efficiency of indexation of sire. Early and accurate
estimation of the genetic value of young bucks is feasible and semen from
identified improved males can be spread rapidly in a large number of flocks.
1.3.1. Advantages of A.I
The use of AI with spermatozoa of selected bucks has led to increase milk
production in goats. Further genetic improvement depends on the widespread
use of AI which can only be possible if the treatment is used to induce
synchronized oestrous that will result in a good fertility rate (Baril et al.,1993).
1.3.2. Methods of AI
Artificial insemination in goat can be applied by many methods such as vaginal
insemination (Paulnez et al., 2005), intracervical insemination (Leboeuf et al.,
2003), intrauterine insemination (Ehling et al., 2003), and laparoscopic
insemination (Sohnery and Haltz, 2005). Cervical insemination involves
deposition of sperms in the uterine side of the cervix, conception rate using this
method ranges from 50 to 70% depending on the season of insemination. The
conception rate is low during spring and summer due to lower sperm motility
than in autumn and winter however, photoperiodic treatment of bucks
(Delgadillo et al.,1995), which enables sprem collection all year round, may
alleviate such seasonal variations in sperm quality. The Laparoscopic
insemination methods involves the use of a laparoscope and manipulating probe
Please purchase PDFcamp Printer on http://www.verypdf.com/ to remove this watermark.

14
to aid in depositing fresh or frozen –thawed semen directly into the uterine
horns. Laparoscopic insemination procedures are described for sheep and goats
by Ritar and Ball (1991). More than 80% success rate of conception is realized
(Amoah and Gelaye, 1992).
Insemination is performed too early to enable the fertilization of ova, this
explanation is supported by the fact that a delay in the insemination of goats
that are observed in oestrus later than 30h after sponge removal is sufficient to
restore normal fertility (Leboeuf, 1994). Leboeuf et al. (2003) inseminated
goats with 100, 75 or 50×106 total frozen-thawed spermatozoa 24h after the
beginning of oestrus behavior. When applying A.I in affixed time in induced
oestrus in goats, interval to oestrus should be considered (Fonseca et al., 2005).
1.4. Gestation or pregnancy Gestation is the period that starts with fertilization and ends with parturition
(the birth process). The average length of the gestation period in the doe is 149-
150 days with considerable variations (Walkden- Brown, 2001). Babiker et al.,
(2010) reported a gestation length in the Sudanese Nubian does of 146 - 152
days, where El Naim, (1979), reported that the gestation length for the
Sudanese Nubian does bearing single kid was 146.5±1.4 days which was
slightly longer than does bearing twins (145.5±1 days), he added that the sex
of the kid and litter size did not significantly affect the gestation length.
Martinez et al. (2005) reported similar gestation length in the Nubian does
(146.5±4.05).
1.4.1. Pregnancy diagnosis
Pregnancy diagnosis is a critical procedure for monitoring goat reproductive
performance, and its an important zoo technical practice necessary to maintain
the high efficiency of a livestock production system (Ortega et al., 1999).
Please purchase PDFcamp Printer on http://www.verypdf.com/ to remove this watermark.

15
various of pregnancy diagnosis methods in goats have evolved over the years
( Kinne, 2006) and these include:
1.4.1.1. Return into oestrus
This is the most commonly used pregnancy test in goats, it involved observation
for signs at 17-21 days post -breeding .Whowever, when inducing oestrus out of
season, in seasonal breeds, the majority of non- pregnant does will not undergo
additional oestrus cycles and will return to seasonal unestrus. Thus, failure to
return to oestrus after breeding, does not indicate pregnancy ( Corteel et al.,
1982 and Smith, 1986).
1.4.1.2. Abdominal palpation
This test like the previous one is cheap and requires no particular equipment. It
is practiced in the second half of pregnancy, it required training and its accuracy
depends very much on the operator. It consists of the presence of the foetus by
forcing it to move in the foetal fluids and bownce against the hand close to the
abdominal wall (Linoel, 1990).
1.4.1.3 Biochemical techniques
1.4.1.3.1. Pregnancy Associated Glycoprotein (PAG):
Pregnancy Associated Glycoprotein (PAG) is one of the proteins from foeto-
placental origin that can be detected in the peripheral circulation of pregnant
animal ( Zoli et al, 1992) and is found in the peripheral circulation of pregnant
dairy and Beef Cows ( Zoli et a.l, 1992), in goats (Benitez and Oritz, 1992 ;
( Ranilla et al.,1997) and in ewes (Ranillia et al.,1994). The level of this
hormone is affected by the breed ( Guilbault et al.,1991), the foetal number
(Benitez and Oritz., 1992) and the period of embryo culture in vitro (Ectors et
al., 1996).
Please purchase PDFcamp Printer on http://www.verypdf.com/ to remove this watermark.

16
1.4.1.3.2. Estrone sulfate
The estrone sulfate test, performed on milk or urine, can determine pregnancy.
Between day 40 and 50 days after conception, the level of estrone sulfate
increases substantially and stays increased throughout pregnancy. Abortion,
foetal death, or resorption causes the esterone sulfate level to drop; therefore,
the test also is a useful measure of fetal viability. The placenta in goats
produces estrone sulfate and it can be detected in goat plasma from around 40-
50 days post breeding (Refstal et al., 1991).
1.4.1.3.3. Progesterone (P4)
Progesterone is one of the C21-steroids (MW=314.5) secreted by the corpus
luteum in females during the oestrus cycle, and in much higher amount by the
placenta during pregnancy. It is also secreted in a minor quantity by the adrenal
cortex in both males and females. Majority of circulating progesterone is bound
to albumin and corticosteroid binding globulin (CBG), the bioactive free
hormone represents only 2.5-3 % of the total progesterone. Measurement of
serum progesterone is of a diagnostic value in menstrual disorders and
infertility in Women. Measurement of progesterone in the first 10 weeks of
gestation, have been suggested in the diagnostic and treatment of patients with
threatened abortion and ectopic pregnancy (IAEA 1984).
Hafez and Hafez, (2000), listed the functions performed by progesterone as
follows:
1. Prepair the endomentrium for implementation and maintenance of pregnancy
by increasing activity of secretory glands in the endometrium and by inhibiting
the motility of the myometrium.
2. Act synergistically with oestrogens to induce behavioral oesturs.
3. Develops the secretory tissue (alveoli) of mammary glands.
4. Inhibits oestrus and the ovulatory surge of LH at high levels.
Please purchase PDFcamp Printer on http://www.verypdf.com/ to remove this watermark.

17
Progesterone is critical for maintenance of pregnancy ( Vasconcelos et al.,
2003). It is synthesized from cholesterol via pregnenolone, then rapidly
metabolized to pregnanediol, for the most part, in the liver. The ovary and
placenta are the major production sites, but a small amount is also synthesized
by the adrenal cortex in both males and females (Thorburn and Schneider,
1972).
Marked differences exit in the level of blood/milk progesterone between
pregnant and non-pregnant females from day 18-19 in the ewe and from day 21-
22 in the doe after fertilization. The assessment of progesterone at this time is a
useful method for detecting non-pregnancy. Measurement of concentrations of
progesterone 19-23 days post-breeding in blood and milk is also a method
for diagnosing pregnancy with high accuracy (Thibier et al.,1982; Murray and
New stead, 1988). Accuracy of diagnosing pregnancy and non-pregnancy was
85.7% and 100% respectively ( Heap and Holdworth, 1981).
Progesterone concentration in milk in does, generally, reflects plasma
concentration, however, concentration of progesterone in milk is higher
(Thibier et al., 1982; Murray and Newstead, 1988). Milk progesterone
concentration above 10ng/ml between 22-26 days after breeding was classified
as positive pregnancy. Milk progesterone concentration varies from day to day
and also with the type of milk sample obtained (Bretzlaff et al., 1989). The
same author reported that plasma concentration of progesterone tends to be
more accurate than milk. Several conditions like hydrometra, pyometra early
embryonic death may extend the luteal life span and give false positive results
(Ishwar, 1995).
The progesterone hormone, When used as an early pregnancy test (18-19 days
after insemination in ewes and 21-22 days in does), the over all accuracy of this
test is higher than 90%. Almost all females diagnosed non-pregnant
Please purchase PDFcamp Printer on http://www.verypdf.com/ to remove this watermark.
18
(prog.<1ng/ml of blood plasma) do not lamb (>98%), while only 75 to 85% of
those presumed pregnant give birth to young. Thus, progesterone estimation at
this stage of pregnancy can be considered as a non-pregnancy test. And at a
late pregnancy (after 19 days in ewes and after 21 days in does), progesterone
measurement can also be used to detect pregnancy. In this case, how ever, the
accuracy depends mainly on sampling frequency as it is impossible to
differentiate between pregnant and cycling females bearing an active corpus
luteum.(FAO, 1990).
Progesterone concentration in serum, plasma or milk can be used as an aid for
monitoring the onset of puberty, postpartum ovarian activity, oestrus cycles and
pregnancy in domestic animals (IAEA, 1999).
1.4.1.3.3.1. Sites of progesterone production
The progesterone is produced by both the corpus luteum and the placenta. Cows
and Sows are dependant on the corpus luteum as a source of progesterone for
most of the gestation period. Progesterone declines during the last half of
pregnancy in these species (Joe, 2000). In both goats and sheep, pregnancy is
maintained by progesterone. Progesterone in ewe is synthesizes by the placenta
in the last–third of pregnancy. However, in goats the sole source of P4
throughout pregnancy is the corpus luteum (Thorburn and Schneider, 1972) and
ovarectomy or stress which upsets the function of the corpus luteum will cause
abortion (Walkden- Brown and Bocquier, 2000).
Thus it is concluded that the integrity of pituitary and the corpus luteum was
essential for the maintenance of pregnancy in the goat and that placenta of goat
did not produce in a sufficient amount to prevent abortion. This conclusion
received support from the findings of Linzell and Heap (1968), who found no
net production of progesterone by the foeto-placental unit of an anaesthetized
Please purchase PDFcamp Printer on http://www.verypdf.com/ to remove this watermark.

19
goat. The rise in the progesterone level in pregnant goat is synthesis by Caprine
placental lactogen (Currie et al, 1977; 1990).
1.4.1.3.3.2. Analysis of the progesterone
One reproductive hormone, progesterone, has been found to be of a significant
clinical value in females of most domestic species and, in fact, overall its
analysis gives the most useful information as to the reproductive status of
animals. While blood has being the usual medium for hormone analysis, milk,
urine, saliva and even faeces are also sources for gaining useful endocrine
information. The later tissues have the advantages in certain situations of being
easier to collect and, at very least, they allow one to avoid the use of
venipuncture (Mats, 2000).
1.4.1.3.3.3. Advantages of the progesterone analysis
Beside its use as an early test for pregnancy diagnosis, progesterone analysis
can also be used for the retrospective confirmation of the absence (or presence)
of a CL at the time of insemination in cattle and this can be a useful tool when
herds with fertility problems are encountered (Karg, et al, 1976; Oltner and
Edqvist, 1982; Garcia and Edqvist, 1990).
A potential important area for the diagnostic use of progesterone analysis
concerns the elucidation of clinical syndromes in the postpartum period in
which cows fail to show sexual receptivity for extended periods of time (Booth,
1988; Sprecher et al., 1990), hence animals which have re-established ovarian
activity can often be distinguished from those which have ovarian inactivity;
elevated progesterone values indicate significant ovarian inactivity is present.
The same author found that progesterone determinations could also be used to
verify the presence of luteal tissue in conjunction with endometritis/ pyometra
and ovarian cysts. Both conditions should respond to prostaglandin therapy,
Please purchase PDFcamp Printer on http://www.verypdf.com/ to remove this watermark.
20
therefore, the use of progesterone analysis would be useful in establishing the
therapeutic response.
1.4.1.3.3.4. Radioimmunoassay for measuring progesterone concentrations:
There are currently several rapid and inexpensive commercial kits available for
use on milk or serum. Results could be qualitative (based on colour changes ) or
quantitative ( progesterone in ng/ml) depending upon the kit (IAEA,1999).
Early and accurate pregnancy diagnosis can be a useful tool for monitoring the
goats reproductive performance (Zoli et al., 1995). Thus enhancing the
reproductive efficiency of flocks.
It is important that clinical endocrinology laboratories understand and have
experience with their assay systems in relation to particular clinical syndromes.
For example, the actual concentration of progesterone during the follicular
phase of the oestrus cycle of domestic animals is approximately 100 pg/ml (318
pmol/liter), certainly not greater than 200 pg/ml (636 pmol/liter) plasma. Some
laboratories, however, reported basal values of 1-2 ng/ml (3.2- 6.4 nmol/liter)
for progesterone (Mats, 2000).
Radioimmunoassays for measuring either progesterone or proteins from
placental and foetal origin have provided early and practical methods for
monitoring pregnancy in farm animals. Progesterone assays accurately detect
non-pregnancy in early gestation (Murray and Newstead, 1988 ; Gonzalez et al.,
(1999); Boscos et al., 2003), the method is based on the competition between
unlabelled progesterone in plasma, serum or milk sample and a fixed quantity
of I125- labeled progesterone for a limited number of binding sites on
progesterone specific antibody immobilized ( coated) on the internal walls of
test tubes ( solid phase). The proportion of the I125 labeled progesterone bound
to the antibody is inversely related to the concentration of the progesterone
found in the tested sample (IAEA, 1999).
Please purchase PDFcamp Printer on http://www.verypdf.com/ to remove this watermark.

21
Serum was used for progesterone testing rather than milk, as serum was readily
available from all animals studied. Some authors suggested that milk
progesterone kits marketed for cattle are unsatisfactory for goat milk since the
goat udder metabolizes progesterone to pregnanedione resulting in false-
negative tests (Holdsworth et al., 1983). So, the ability to utilized serum
samples would increase the usefulness of progesterone test as all goats could be
tested rather than only those which are lactating ( Fleming et al., 1990). Milk
progesterone concentrations are much higher than serum progesterone, and vary
from day to day, according to type of milk sample (foremilk, midmilk, and
strippings) and with production levels in goats (Thibier et al., 1981). A recent
report of the use of a progesterone kit on milk samples in goats indicated
indeterminate progesterone levels in 11.2% of samples while plasma samples
were more accurate on monitoring ovarian activity (Bretzlaff, 1989).
1.4.1.3.3.5. Progesterone profile in oestrus cycle
Determination of hormonal control of oestrus cycle in goats could be based
mainly on plasma progesterone variations (Heap and Linzell,1966; Jones and
kinfton,1977). The circulating progesterone levels, which are characteristically
low during the follicular phase, increase sharply during the luteal phase ,
reaching maximum at 5-10 days after the mid cycle LH peak. Unless
pregnancy occurs, steep decline to follicular levels sets in a bout 4 days before
the next period. During the luteal phase, the concentrations could range between
2.6- 5.4 ng/ml in goats (Khadiga et al., 2005),
The mean progesterone concentration is extremely low at the day of oestrus (0.2
ng/ml) and is not significantly different from that found in unoestrus or
overiectomized animals .The concentration increases to a maximum of 4ng/ml
on about day 10 of the cycle, and decreased rapidly during the last 3 days of
the cycle (Thorburn and Schneider, 1972). The change are closely related to the
Please purchase PDFcamp Printer on http://www.verypdf.com/ to remove this watermark.
22
morphological changes in the corpus luteum during the cycle in the doe. It is
evident from this information that the corpus luteum in goat is not functional
until 3-4 days after ovulation ( Bosu et al., 1978), where (Bono et al., 1983)
found that, the mean plasma value of progesterone during oestrus ranged
between 1-4 ng/ml. Between the 8-56 h before the LH ovulatory peak, the
plasma progesterone levels suddenly decreased, remained lower than 1ng/ml for
a bout 6 days and then gradually increased to typically dioestrus values. Plasma
progesterone drop occurred 24-48 h before behavioral oestrus, whose length
varied between 32-40 h.
The progesterone concentration in the blood decreased sharply during
regression of corpus luteum in the non-pregnant doe (one or tow days prior to
oestrus ) and return to a higher levels within four days following oestrus ( Ott et
al., 1980). Leyva-Ocariz, et al. (1995) compared the progesterone profiles of
native and cross-bred goats in a tropical semiarid zone during the oestrus cycle.
The progesterone levels were found to be similar throughout the oestrus cycle
in both breeds, presenting highest values on days 12 and 15 ( 12ng/ml and
10ng/ml, respectively). For both native and cross-bred does, progesterone
concentrations (2.0±1.2ng/ml and 1.8± 0.2ng/ml, respectively) on day 19
indicated that luteal regression had started. During day 0, one, tow and 20
progesterone concentrations were less than 1 ng/ml (o.5±o.2ng/ml). A
significant difference (P<o.o5) between day 4 (2± 0.49ng/ml) and day 2 in
progesterone levels was found, indicating that the luteal phase was established
from day 4 until day 19.These finding were in a greement with blood levels
found previously (Thibier et al., 1982; Bono et al., 1983). As in the ewe
(Hauger et al.,1977), in native and cross-bred goats and under the tropical
conditions described in this study, at the end of luetal phase of the oestrus cycle,
Please purchase PDFcamp Printer on http://www.verypdf.com/ to remove this watermark.

23
circulating concentrations of progesterone decline while estradiol rises, acting
as a primary signal for the preovulatory gonadotropin surge ( Pant et al., 1977).
There is a paucity of information on hormonal control dynamics after
synchronization of oestrus in does. Most studies have been limited to measuring
responses such as time to onset of oestrus and fertility, this was noticed by
Kusina et al. (2000), who conducted an experiment to study the effect of
different progesterone treatments and PGF2a� on oestrus synchoronization and
fertility of Mashona goats treated with intravaginal sponges. The plasma
progesterone concentrations increased sharply following insertion of sponges to
peak at 6-7 ng/ml within 3 to 5 days after sponge insertion. These levels were
maintained thereafter until removal of sponges. On removal of sponges,
concentration fell sharply to basal levels (< 2 ng/ml within 24h). In does treated
with Norgestomate ear implants, plasma progesterone concentration increased
gradually, reaching a peak of 6 ng/ml prior to removal of the implants. Similar
to the response for does treated with sponges, plasma progesterone
concentrations fell sharply after removal of the ear implants. In does treated
with cloprostenol , the progesterone concentrations plummeted to below basal
levels after the second cloprostenol injection.
Variability in the observed increase in circulating progesterone concentrations
can be quite large (Darwash et al., 2001) and is influenced by feed intake and
milk production ( Lopez et al., 2004; Wiltbank et al., 2006; Elmansoury, 2008 ).
When Greyling and Van der Nest, (2000), synchronized oestrus in different
breeds of goats, Indigenous and Boer goats, they found that, the mean serum
progesterone concentrations for the observation period varied between 0.01 and
6.19 ng/ml for Indigenous and 0.01 and 9.05 ng/ml for Boer goat.
Progesterone started to increase from the mean basal value of 0.1 ± 0.03 ng/ml
on day-0 to 3.0 ± 0.9 ng/ml on day-6 of oestrus cycle and reached the peak
Please purchase PDFcamp Printer on http://www.verypdf.com/ to remove this watermark.
24
value of 7.7 ± 0.6 ng/ml on day 12. From day-15, a decline was observed in
progesterone values till the end of the cycle. (Khanum et al., 2008).
1.4.1.3.3.6. Progesterone and pregnancy
Maintenance of pregnancy is dependant largely on a proper hormonal balance
and the disturbance of this balance results in abortion. Gestation stability is
dependant on an interplay between the mother, the placenta, and the concepts
(embryo or foetus). So progesterone has a dominant role in maintenance of
pregnancy, particularly during the early stage. This fact was noticed by (Joe,
2000 and Vasconcelos et al., 2003), who also noticed that high concentrations
of progesterone decrease the tone of myometrium and inhibit myometrial
contractions. The role of progesterone in down-regulating receptor sites for
estradiol and oxytocin in the myometrium, high progesterone will stop cyclic
oestrus by preventing the cyclic release of gonadotropins.
4.1.3.3.7. Progesterone profile during pregnancy
Several reports are available on progesterone concentrations in blood during
early pregnancy in cattle (Pope et al., 1969). A finding of importance is that
progesterone can be measured in the milk of lactating cows and, further, that its
concentration accurately reflects the concurrent blood plasma concentration of
progesterone (Laing and Heap, 1971).
The difference which exists in both blood plasma and milk progesterone
concentrations 19-24 days after a fertile breeding as compared to a non-fertile
breeding has been used as an early pregnancy test (Shemesh et al., 1968;
Robertson and Sarda, 1971). The plasma progesterone concentrations in blood
of pregnant cows at 21 days post breeding is almost always at least 2 ng/ml (6
nmol/liter) and usually 4-8 ng/ml(13-26 nmol/liter), as compared to less than
0.5 ng/ml (1.6 nmol/liter) in the non-pregnant animal at the same time. Elevated
Please purchase PDFcamp Printer on http://www.verypdf.com/ to remove this watermark.
25
progesterone concentrations, however, only reflect the presence of luteal tissue
and are not directly indicative of the presence of a fetus in vitro.
Furthermore, a slight prolongation of luteal activity in a non-pregnant animal
can occur which results in elevated progesterone concentrations at day 21, a
situation in which the analytical progesterone result would be positive and the
animal would be falsely considered pregnant (Mats, 2000). The same author
add that, the accuracy of the forecast for pregnancy (positive forecast) thus is
often lower than desirable, in most cases ranging between 75 and 90 %. The
negative forecast, however, is more accurate since cows having low
progesterone concentrations in milk or blood 21 days post breeding will almost
always not be pregnant. The accuracy of the positive forecast can be increased
if progesterone analyses are also carried out on samples obtained at the time of
insemination in order to eliminate animals inseminated during the luteal phase
of the oestrus cycle. Cows inseminated during the luteal phase will be in the
luteal phase 21 days later with the animal being falsely considered pregnant.
The plasma progesterone concentrations during early pregnancy in goats (2.5-
3.5 ng/ml) was similar to luteal phase value and remained steady from day 8 to
day 60, between day 60-70 there was a secondary increase in progesterone
concentrations which was maintained in this increase levels (4.5 - 5.5 ng/ml)
until just before parturition ( in twin bearing animals, the secondary increase
was greater). The progesterone concentration decrease rapidly at 1-2 days
preceding parturition, but the concentration was still quite high on the day of
parturition (1.25 ng/ml). (Thorburn and Schnider, 1972).This results were
reported also by Irving et al. (I972) and Humblot et al. (1990). Who
established no trends for a continuous increase or decrease of mean
progesterone concentrations throughout pregnancy.
Please purchase PDFcamp Printer on http://www.verypdf.com/ to remove this watermark.

26
Sousa et al. (1999) studied the progesterone profile in Coninde and Moxoto
goats. They found the following results, during the first week of pregnancy,
the progesterone concentrations were (0.23± 0.07 ng/ml and 0.13±0.03 ng/ml,
respectively). Thereafter, progesterone levels increased significantly ( P<0.05)
in week three (3.35± 0.85 ng/ml and 4.36 ± 0.6 ng/ml), remaining high until
week 19 ( 7.76± 1.33 ng/ml and 5.94 ± 0.90 ng/ml) and decreasing ( P< 0.05 )
just before parturition 3.98± 1.51 ng/ml and 3.45± 0.03ng/ml i.e during
pregnancy mean weekly progesterone concentration varied significantly among
the animals and periods of pregnancy (P<0.01), but they do not affected by
breed or number of fetuses. Llewlyn et al., (1987 and 1992), reported that, the
plasma progesterone concentration rise significantly from 0.91 ±0.51 ng/ml on
day 40 to 5.±o.5 day 60 and remain higher up to 6 ng/ml until 5 days before
kidding. These values in pregnancy is typical to luteal phase in non-pregnant
goats. Those authors also found that, pseudo-pregnant does have similar
progesterone profiles to pregnant does first 80 days, but the rise around day 35
to 40 was not significant and the progesterone concentration returned gradually
to basal level after day one. In indigenous Small East African goats, the mean
plasma progesterone concentration ranged from 2.6 to 10.8 ng/ml from
conception to the mid gestation (Kanuya et al., 2000). After conception, higher
progesterone levels (4.3–11.0 ng/ml) were maintained throughout the gestation
period, and declined rapidly during 19 days pre-partum, reaching 0.8-1.0 ng/ml
on the day of parturition. Zarkawi and Al-Masri, (2002) found that
progesterone concentration in the serum started from basal levels at mating and
become elevated during pregnancy, until a peak level of 13.84±3.77 ng/ml is
reached on day 115.4 ± 23.4 after mating. The concentration drop sharply after
kidding to an average of 0.29 ± 0.25 ng/ml. The mean maximum
progesterone level during gestation recorded by ( Khanum et al., 2008) was
Please purchase PDFcamp Printer on http://www.verypdf.com/ to remove this watermark.
27
10.9 ± 1.3 ng/ml, while Elmansoury, (2008), when he studying the progesterone
profile in pregnant Sudanese Nubian goats, stated that the highest mean of the
monthly progesterone concentration reach up to 17.54±7.60 nmol/L in the first
month, 15.72±4.65 nmol/L in the second month, 16.83±4.44 nmol/L in the
third month, 24.48±7.87 nmol/L in the fourth month and 22.95±7.59 nmol/L
in the fifth month without significant difference (P>0.05). The progesterone
level began at 1.34 ng/ml and then elevated to reach 13.82 ng/ml as a maximum
level and remained elevated above 1 ng/ml until the end of the gestation period
at parturition, this notification was mentioned by Elmoubark, (2010), working
on Sudanese Desert goats. He found that the mean serum progesterone
concentration during pregnancy was 5.93±3.27, 5.51±3.23 and 5.47±2.93 ng/ml
for the different treatment groups. In the breeding season there was a significant
increase (P<0.001) of progesterone concentration in does, (2.85±0.15 ng/ml)
than out side the breeding season (2.37±0.13 ng/ml) and a relevant significance
elevated (P<0.05) level of progesterone in pregnant (3.75±0.17 ng/ml) than in
non-pregnant does (2.47±0.10 ng/ml). This observation was noticed by Al-
Sobaiyl, (2010), on a study about breeding season and pregnancy effect in
Aradi goats.
1.4.1.3.3.8. Relationship between Progesterone and litter size:
The level of progesterone from placental lactogen depend on the number of
faeti (Hayden et al., 1980). Contrast to this, Humblots et al., (1990) found no
relation between the progesterone and the litter size.
Thorburn and Shnieder, (1972), had followed the progesterone concentrations
in six goats, three of which were carrying single fetuses and the other three
carrying twins. The increase in the progesterone concentrations after mating
was the same as that seen in the first part of a normal oestrus cycle. However,
there was no rapid decline in peripheral Progesterone concentrations on day
Please purchase PDFcamp Printer on http://www.verypdf.com/ to remove this watermark.

28
19 as was seen in the non-pregnant animals. In animals carrying single fetuses,
the progesterone concentrations remained at a reasonably steady level (2.5-3.5
ng/ml) from day 8 until about 60; then rose to around 4.5-5.5 ng/ml during the
second part of pregnancy, declining just before partuition. In all the twin-
bearing animals there was a gradual decrease in progesterone concentration
from day 12 until about day 40, a similar decrease was also seen in one animal
carrying a single foetus. The subsequent increase in the progesterone
concentration at about day 60 was greater than in animals carrying single foetus.
In two of the twin-bearing animals, the progesterone concentration decreased
again about day 100 and was then maintained at a similar level to that found in
animals carrying single foetus. Those values in the plasma progesterone
concentrations in does carrying single or twin foetuses are comparable to those
reported for temperate (Chemineau et al, 1982) and other tropical breeds of
goats (Ezzo and Shalably, 1990).
The higher progesterone concentrations in blood plasma of does carrying twins
may be associated with different numbers of corpora lutea as previously
suggested by Chemineau et al. (1982). It is also suggested that plasma
progesterone determination during the fourth to fifth week of gestation can be
used to predict the number of fetus(es) in the Small East African does (Kanuya
et al., 2000). However, Chauhan, et al, (1991), noticed a low accuracy for
predicting multiple pregnancies in goats by use of serum progesterone
concentration. On the other hand successful prediction of the litter size using
progesterone assay in ewes at about 100 days of gestation has being reported
(West, 1986; Schneider and Halford, 1996).
In another experiment studied by Manalu et al. (1997), the average
progesterone concentrations during the last two months of gestation period in
single or twin-bearing does markedly increased (P<o.o1) by 1302 and 2591 %,
Please purchase PDFcamp Printer on http://www.verypdf.com/ to remove this watermark.
29
respectively, as compared to those non-pregnant does (5.791 and 11.113 vs.
0.413 ng/ml). Serum progesterone concentrations increased by 92.4 % as fetal
number increased from single to twins and the average progesterone
concentrations of aborted does had decreased to a very low level, but still
higher than those of non-pregnant does, at least seven weeks prior to abortion
date (1.691 ng/ml for aborted vs. 0.413 ng/ml for non-pregnant does). Where,
Sousa et al. (1999), concluded that progesterone concentrations during
pregnancy were not different between single or multiple pregnancies. Similarly,
Jarrel and Dziuk, (1991) reported that the number of corpora lutea of goats uses
does not influence progesterone concentrations after day 30 of pregnancy in
goats.
Please purchase PDFcamp Printer on http://www.verypdf.com/ to remove this watermark.

30
Chapter Two
Materials And Methods 2.1. Study Area
This study was carried out in the Goat Breed Improvement Project at Helat
Kuku in Eastern Nile Province, Between longitudes E 32 and 33 and latitudes
15 and 36 N and altitude of 380 m above sea level.
2.2. Climate
Details of the climatic conditions of the area have been described below Table( 1). Meteorological data during experimental period (July 2000- January 2001) Season
Temperature (ºc) Relative Humidity Rain fall Day Length Max Min % (mm) (h)
Autumn Winter Summer
39.2 25.2 38 16.98 12.26 32.4 16.9 27 0 11.25 41.1 25 18 0 12.34
*Data obtained from the meteorological Station of Khartoum airport. ` 2.3. Experimental Animals
Sixty healthy Sudanese Nubian does were selected from the total flock of the
project. They were 2.5-5 years old. These does were then subdivided into six
groups each of ten goats. The animals were proved to be empty.
2.4. Husbandry
2.4.1. Housing
Please purchase PDFcamp Printer on http://www.verypdf.com/ to remove this watermark.
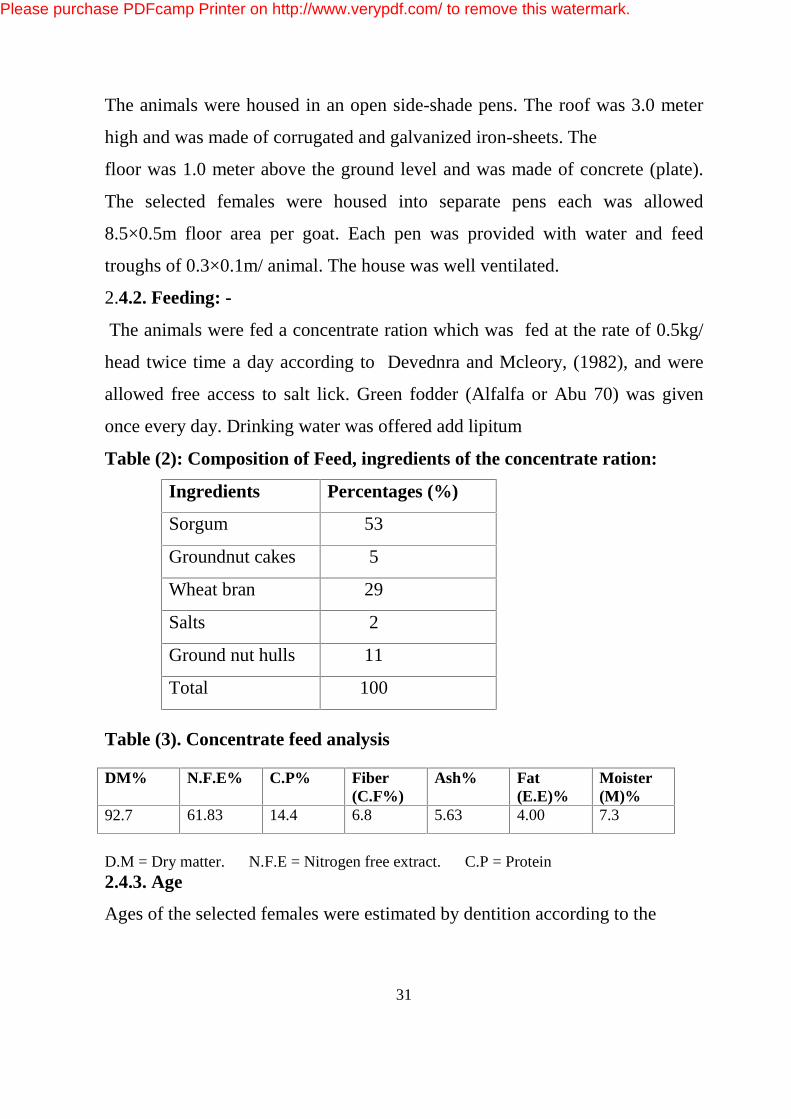
31
The animals were housed in an open side-shade pens. The roof was 3.0 meter
high and was made of corrugated and galvanized iron-sheets. The
floor was 1.0 meter above the ground level and was made of concrete (plate).
The selected females were housed into separate pens each was allowed
8.5×0.5m floor area per goat. Each pen was provided with water and feed
troughs of 0.3×0.1m/ animal. The house was well ventilated.
2.4.2. Feeding: -
The animals were fed a concentrate ration which was fed at the rate of 0.5kg/
head twice time a day according to Devednra and Mcleory, (1982), and were
allowed free access to salt lick. Green fodder (Alfalfa or Abu 70) was given
once every day. Drinking water was offered add lipitum
Table (2): Composition of Feed, ingredients of the concentrate ration:
Ingredients Percentages (%)
Sorgum 53
Groundnut cakes 5
Wheat bran 29
Salts 2
Ground nut hulls 11
Total 100 Table (3). Concentrate feed analysis DM% N.F.E% C.P% Fiber
(C.F%) Ash% Fat
(E.E)% Moister (M)%
92.7 61.83 14.4 6.8 5.63 4.00 7.3
D.M = Dry matter. N.F.E = Nitrogen free extract. C.P = Protein 2.4.3. Age
Ages of the selected females were estimated by dentition according to the
Please purchase PDFcamp Printer on http://www.verypdf.com/ to remove this watermark.
32
appearance of the permanent incisors described by Mc Nitt (1983). The age
was ranged between 2.5 to 5 years.
2.4.4. Body condition scoring:
Body condition scoring was assessed for both males and females by palpation
of the lumber region immediately behind the rib and above the kidney, the
degree of projection of the spinal transverse processes of the lumber vertebrae
was assessed according to Russel, (1984). the Body condition scores are range
between 3and 5.
2.5. Treatments
2.5.1. Experimental procedure The does were subdivided into six equal groups. Each group was composed of
10 pure Nubian goats. The groups were randomly assigned to one of the
following treatments.
2.5.1.1. Treatment A:
These animals received no treatment and were observed for natural heat and
mated naturally.
2.5.1.2. Treatment B:
In this group oestrous was induced by introduction of vaginal sponges
impregnated with 40 mg Fluorgestone Acetate (FGA), which is a synthetic
progesterone (Cronogest Intervet International B.V., Boxmeer Holland). The
sponges were removed after 12 days and goats were inseminated artificially
after 48 hours post withdrawal of the sponges.
2.5.1.3. Treatment C:
This group received the same treatment as in group (B) plus an injection with
500 i.u Equine Chorionic Gonadotropin (eCG), intervet, UK:PL 1708-4309
POM, two days before removal of the vaginal sponges and artificial
insemination was conducted at the time of sponges removal.
Please purchase PDFcamp Printer on http://www.verypdf.com/ to remove this watermark.

33
2.5.1.4. Treatment D:
This group received the same treatment as in group (C) but the injection with
Equine Chorionic Gonadotropin (eCG) was applied at sponge removal and
artificial insemination was conducted 48 h later.
2.5.1.5. Treatment E:
In this group the does were injected at the time of progestagen sponges
removal with 300-500 i.u of eCG and 0.5 ml of Estrumate, (synthetic
Prostaglandin F2 a�, Cooper, each ml contains 263 µ�g cloprostenol sodium BP
equivalent to 250µ�g). Insemination was performed 48 hours after eCG and
PGF2a� injection.
2.5.1.6. Treatment F: In this group the animals were injected with 0.5 ml prostaglandin PGF2a� at the
time of sponges removal and the insemination was performed 48 hours there
after.
2.5.2. Sponges application:
Sponges were applied and removed as illustrated in the steps below, and the
instruments used were shown in Figure (3).
Table (4 )-Experimental design INSEMENATION TREATMENT ANIMAL
NO GROUPS
Natural Mating
Non 10 A
AI 48 h post removal of sponges
Progesterone - 10 B
AI at removal of sponges
Progesterone +eCG 48h before removal
10 C
AI 48h post removal of sponges
Progesterone +eCG at removal 10 D
AI 48 h post removal of sponges
Progesterone +eCG + PGF2 at removal
10 E
AI 48 h post removal Progesterone + PGF2 at removal
10 F
Please purchase PDFcamp Printer on http://www.verypdf.com/ to remove this watermark.

34
2.5.2.1. placing of the sponge:
-The applicator was thoroughly disinfected with disinfectant between each
application of the sponge.
-Sponge was inserted with the string- attached end fixed at the near end of the
tube.
-Then the plunger was introduced in the tube.
-The doe was immobilized and the tube was introduced into the vagina.
-The plunger was held and the tube was removed back word to release the
sponge. Then the applicator was withdrawn.
2.5.2.2. Removal of the sponge: -
The sponge was removed gently by pulling back word the string.
2.6. Artificial insemination of does:
Does regardless of oestrus occurrence were inseminated artificially 48 hours
post sponge removal (Fixed time insemination). Semen samples were collected
from four pure Sanneen bucks of known fertility. Immediately before the time
of insemination. Artificial vagina for small ruminants (IMVQ 40) was used.
(Figure 1), semen was collected in a graduated test- tube and then placed in a
water bath at 37c� immediately after collection. Semen samples were generally
evaluated for physical characteristics such as volume, colour, consistency, mass
motility, individual motility, concentration and abnormal morphology as
described by (Evans and Maxwell, 1987). Motility and concentration governed
the volume of Tris diluent to be added. The dilution was done to make final
concentration of 5×10⁸ spermatozoa/ml by pipetting the volume of diluent
required and adding it slowly to the semen, which was held in a baby flask.
Then they were gently mixed, and the diluted sample was then evaluated
under the microscope to confirm sperm viability. The does in the treatment
Please purchase PDFcamp Printer on http://www.verypdf.com/ to remove this watermark.

35
Figure :1, Equipment used in A. I
Please purchase PDFcamp Printer on http://www.verypdf.com/ to remove this watermark.

36
groups whether observed in oestrus or not were inseminated at 48-52 hours
after treatment termination. Site of insemination was interacervical or uterine as
long as the cervix could allow the passage of the insemination gun. A volume of
0.5ml fresh diluted semen containing ( 200×106 ) active spermatozoa was used.
Does to be inseminated were restrained with hindquarter raised over a rail, and
the fore limbs on the ground between the assistant’s legs as described by
(Evans and Maxwell, 1987). A lubricated speculum was introduced into the
vagina to visualize the cervix, the semen was deposited as deeply as possible
into the cervical canal or into the uterus ( 1.5-3.0 cm) into the cervix or into the
uterus, then the semen was deposited by pressing the plunger of the
insemination gun. Figure (1). Goats that returned to oestrus were reinseminated
naturally.
2.7. Pregnancy Diagnosis
Pregnancy was diagnosed by using Radio-Immuno-Assay Technique (RIA),
and by calculation of the Non-Return Rate as detected by a vasectomized buck.
2.7.1. Sampling:
Blood samples were collected from the jugular veins in vacutainers tubes then
cetrifugated for 15 minutes at 3000 round/ minute to separate the serum which
was kept in a deep freezer (-20ºc). The samples were collected at the day of
vaginal sponge insertion, mid period of treatment (day 6), day of insemination,
seven days post insemination, fourteen days post insemination, twenty one days
post insemination, and then at 10 days interval till the end of the gestation
period.
2.7.2. Equipments (Figure 3 ):
a. A microlitter pipette with disposable plastic tips.
Please purchase PDFcamp Printer on http://www.verypdf.com/ to remove this watermark.

37
b. A hand held mulit-dispencer instruments (two) with combitips (Eppendrof
4780 pipette) one for the samples and other for the tracer (I125).
c. A foam decantation rack to hold the coated tubes.
d. A ?�Vortex?� mixer
e. A multi-well gamma counter.(Figure 2)
2.7.3. Materials and Reagents:
a. Antibody- coated tubes, Polypropylene tubes coated with progesterone
antibodies.
b. Tracer I125- progesterone labeled with radio active iodine- (I125).
c. External and internal quality control (EQC) and (IQC).
d. Standards of different counts of progesterone concentrations in blood serum,
as shown in table (5).
Table (5): Serum progesterone standards supplied with the FAO/IQEA
radioimmunoassay Kit (in nmol/L and ng/ml)
Standard Nº nmol/L ng/ml
A 0.0 0.0
B 0.3 0.1
C 1.6 0.5
D 6.4 2.0
E 15.9 5.0
F 31.8 10.0
G 63.6 20.0
Please purchase PDFcamp Printer on http://www.verypdf.com/ to remove this watermark.

38
Figure :2, Gamma Counter
Figure :3, Equipment used in RIA
Please purchase PDFcamp Printer on http://www.verypdf.com/ to remove this watermark.

39
2.7.4. Radioimmunoassay Procedures:
The RIA technique was applied as what mentioned in FAO/IAEA assay
protocol version 3:1 (1996).
a. Samples and other assay components were brought at room temperature.
b. The precoated antibody tubes were labeled for total count (TC), standards,
EQC. and IQC (double for each concentration), and samples.
c. Tested samples and standard and QCs were mixed with the vortex.
d. Hundred µL (100µL) of tested serum, standards and QCs were pipette into
the bottom of the pericoated tube using a microlitre pipette with a disposable
tips.
e. 1 ml of the tracer was pipetted to standards, samples and QCs with the
multi-disposable pipette
f. The tubes were covered with aluminum foil and kept in 40C for 3-4 hours.
g. All the tubes except the total count (TC), which should be placed in a
separate rack, were decanted vigorously in appropriate radioactive waste
disposable pool and the rack was kept upside down on an absorbent paper and
allowed to drain for 2-3 mins and again stirked sharply downwards to remove
residual droplets.
h. The radioactivity were counted in all the tubes.
2.7.5. Radioactivity Measurement and Result Calculation
a. The radioactivity in all tubes ( include TC) were count in a gamma counter
for fixed time (60 seconds). The maximum percentage binding (B max) is
calculated by dividing the average counts per minutes (CPM) of two zero
binding tubes (Bo) by average CPM of the two TC tubes and multiplying by 100.
B max = Average CPM of Bo(standard Zero) X 100
Average CPM of TC
Please purchase PDFcamp Printer on http://www.verypdf.com/ to remove this watermark.

40
*B max. is a measure of how well the assay is functioning ( i.e. how well
progesterone binds to the antibody coated onto the tubes).
b. The percent binding values (B/Bo %) for all standers, samples and quality
control tubes (QCs) was calculated by dividing each CPM of these tubes with
that of Bo (Zero standard) tubes and multiplying by 100.
B/B0 = Average CPM of standard/ sample/ QCs × 100
Average CPM of Bo
* B/B0 is the percentage of the standard, samples, or QC bound by the antibody
in comparison with the B max.
c. A logit- log graph paper was used to plot the average percent bound (B/Bo)
on vertical (Y) axis and the progesterone stander concentrations on the
horizontal (X) axis and straight line (best- fit) through the points on the graph
were drawn, the progesterone concentrations of samples and QCs can then be
measured by reading their percent binding values and interpolating from the
standard curve to the progesterone concentrations on the X-axis. In this
experiment all these calculations of the result were achieved by using special
computer program as shown in figure (2).
2.8. Statistical Analysis:
The comparisons of progesterone concentrations between pregnant and non-
pregnant does were achieved by student's t-test, and the significance between
different treatment groups were achieved by One way Analysis of Variance
(ANOVA), Soft ware, SPSS, version 16. A p-value of less than 0.05 was
considered statistically significant. The percentages were compared by using
Chi- square test.
Please purchase PDFcamp Printer on http://www.verypdf.com/ to remove this watermark.

41
Chapter Three RESULT 3.1.Reproductive Performance in Nubian Does after
Synchronization using Progestagens
3.1.1. Non Return Rate (NRR) % Non- return rate percentages after first service were 50%, 50%, 60%, 60%,
50% and 40% in group A, B, C, D, E and F respectively. There were no
significance differences (P>0.05) between the different treatment groups.
table(6).
3.1.2. Conception/Pregnancy Rate (PR) %
3.1.2.1. Pregnancy rate (%) according to progesterone concentration at day
21 post insemination
Pregnancy rate at day 21 post insemination according to progesterone
concentrations were 30% in group B, 40% in groups A and F, and 5o% in
groups C, D and E without significant differences (P>0.05), as in table (6).
3.1.2.2. Percent of does confirmed pregnant by abdominal palpation 90
days post insemination
Pregnancy rate was found to be 40% in the group A, B, E and F without
significant difference ( P>0.05) while it reached 50 in group C and D without
significant difference( P>0.05), as illustrated in table (6).
3.1.3. Kidding Rate (KR) %
In this study group D showed the highest kidding rate (40%) while it was 30%
in the other groups (A, B, C, E and F). No significant differences ( P>0.05)
where found between these groups, as shown in table (6).
Please purchase PDFcamp Printer on http://www.verypdf.com/ to remove this watermark.
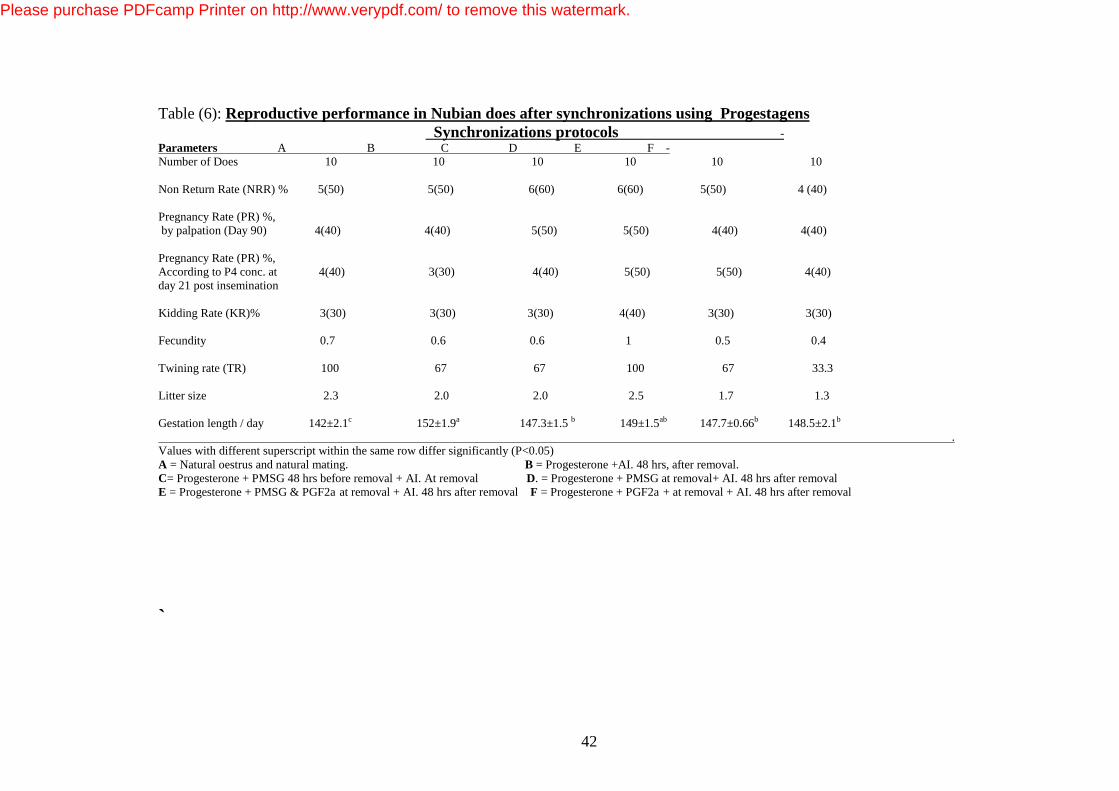
42
Table (6): Reproductive performance in Nubian does after synchronizations using Progestagens Synchronizations protocols - Parameters A B C D E F - Number of Does 10 10 10 10 10 10 Non Return Rate (NRR) % 5(50) 5(50) 6(60) 6(60) 5(50) 4 (40) Pregnancy Rate (PR) %, by palpation (Day 90) 4(40) 4(40) 5(50) 5(50) 4(40) 4(40) Pregnancy Rate (PR) %, According to P4 conc. at 4(40) 3(30) 4(40) 5(50) 5(50) 4(40) day 21 post insemination Kidding Rate (KR)% 3(30) 3(30) 3(30) 4(40) 3(30) 3(30) Fecundity 0.7 0.6 0.6 1 0.5 0.4 Twining rate (TR) 100 67 67 100 67 33.3 Litter size 2.3 2.0 2.0 2.5 1.7 1.3 Gestation length / day 142±2.1c 152±1.9a 147.3±1.5 b 149±1.5ab 147.7±0.66b 148.5±2.1b . Values with different superscript within the same row differ significantly (P<0.05) A = Natural oestrus and natural mating. B = Progesterone +AI. 48 hrs, after removal. C= Progesterone + PMSG 48 hrs before removal + AI. At removal D. = Progesterone + PMSG at removal+ AI. 48 hrs after removal E = Progesterone + PMSG & PGF2a� at removal + AI. 48 hrs after removal F = Progesterone + PGF2a� + at removal + AI. 48 hrs after removal
`
Please purchase PDFcamp Printer on http://www.verypdf.com/ to remove this watermark.

43
Table (7): Effect of litter size and sex of concepts on the gestation length of Nubian does
Litter size Sex
Concept
Single Twin Male Female
Gestation length(Days) (means
±SD)
149.09±3.3
149.09±2.2
149.00±3.08
148.75±2.62
*Significance is done at (P< 0.05).
Please purchase PDFcamp Printer on http://www.verypdf.com/ to remove this watermark.

44
3.1.4. Fecundity: Fecundities of Nubian does valued 0.7, 0.6, 0.6, 1 , 0.5 & 0.4 for the (A, B, C,
D, E and F respectively), as in table (6).
3.1.5. Littre size: The litter size for Nubian does was found to be 2.5 in group D, 2.3 in group A,
2 in groups B and C, 1.7 in group E and 1.3 in group F, as in table (6).
3.1.6 .Twining Rate (TR)%: The twining rate was found to be 100% in groups A and D, 67% in groups B,
C, and E, and 33.3% in group F. as shown in table (6)
3.1.7. Gestation Length/ day:
As illustrated in table (6) the gestation lengths in the Nubian goats were
significantly long in-group B and shorter in the group A, but were comparable
in-groups C, D, E, and F. Regardless to the hormonal treatment protocol there
were no differences in gestation length in Nubian does carrying singles
(149.09±3.3 days) or twins (149.09±2.2 days) and no effect of the sex of
concept on the gestation length as shown in table (7).
3.2. Association of Progesterone (P4) Concentrations with fertility
3.2.1. Progesterone (P4) concentrations before treatment for
oestrus synchronization: A large variations on the progesterone concentrations were registered between
the does in each group before application of the vaginal progesterone
impregnated sponges according to the stage of oestrus at sampling. So goats
with low progesterone concentrations (<3.18 nMol/L) were assumed to be in
oestrus, while those with high progesterone concentrations (>3.18 nMol/l) were
assumed to be in luteal phase.
Please purchase PDFcamp Printer on http://www.verypdf.com/ to remove this watermark.

45
Table (8): Progesterone (P4) concentrations before treatment for oestrus synchronization,
in does carried to full term and does not carried to full term (nMol/L):
Synchronizations protocols
Parameters A B C D E F
N0. of does 10 10 10 10 10
10
Does not carried to full term
Mean ±Sd (nMol/l)
-
7.94 ± 8.69A
(7)
18.91± 29.89A
(7)
7.59 ± 11.00A
(6) 12.59 ± 11.69A
(7)
17.49 ± 12.49A
(7)
Does carried to full term Mean ±Sd (nMol/l)
-
15.03± 13.69A
(3)
5,43± 8.72A
(3)
18.39 ± 11.22A
(4)
28.07 ± 10.15A
(3)
13.38 ± 12.18A
(3)
P-value* - 0.34 0.31 0.17 0.08
0.68
Values between brackets are number of does.
*Values with different superscript within the same column differ significantly (P<0.05). A = Natural oestrus and natural mating. B = Progesterone +AI. 48 hrs after removal.
C= Progesterone + PMSG 48 hrs before removal + AI. At removal D. = Progesterone + PMSG at removal+ AI. 48 hrs after removal E = Progesterone + PMSG & PGF2a� at removal + AI. 48 hrs after removal F = Progesterone + PGF2a� + at removal + AI. 48 hrs after removal
Please purchase PDFcamp Printer on http://www.verypdf.com/ to remove this watermark.

46
Although individual does varied in their progesterone values, yet no significant
differences were found between the means of the groups (P>0.05) .
The mean progesterone concentrations of does carried to full term before the
hormonal application were insignificantly (P>0.05) higher than that of does
that not carried to full term in groups B, D and E while insignificantly (P>0.05)
lower in group C&F.
There were no significance differences (P>0.05) in the progesterone
concentrations between means within the different groups of either does carried
to full term nor Nubian does not carried to full term at the day of
synchronizations, table (8).
3.2.2. Progesterone (P4) concentrations in does carried to full
term & does not carried to full term at mid-period (day 6) of
Synchronizations: The mean progesterone (P4) concentrations during the mid-period (day 6) of
hormonal treatment were always high and this is assumed to be due to the
presence of progesterone impregnated sponges that releases the hormone into
the blood stream thus keeping its concentration at high levels. As shown in
table (9) the mean progesterone concentrations of the does carried to full term
were higher than that of does not carried to full term, for all groups ( except
group B). Group D from the does carried to full term showed the highest P4
concentrations at the mid period (4o.63 nMol/l).
There were no significant differences (P>0.05) in the progesterone
concentrations among means of different treatment groups of either
carried to full term nor Nubian does not carried to full term at the mid-period
(day six) of hormonal applications as in table(9).
Please purchase PDFcamp Printer on http://www.verypdf.com/ to remove this watermark.

47
Table (9): Progesterone (P4) concentrations in does carried to full term & does not carried to full term at mid-period (day 6) of
Synchronization (nMol/L):
Synchronizations protocols
Parameters A B C D E F
N0. of does 10 10 10 10 10
10
Does not carried to full term
Mean ±Sd (nMol/l)
-
20.13 ± 19.77A
(7)
10.89 ± 10.03A
(7)
31.05 ± 28.31A
(6)
20.27 ± 9.33A
(7)
36.09± 18.08A
(7) Does carried to full term
Mean ±Sd (nMol/l)
-
13.72 ± 12.96A
(3)
13.16 ± 11.84A
(3)
40.63± 20.53A
(4)
29.91 ± 27.68A
(3)
37.17± 22.99A
(3)
P-value* - 0.5 0.77 0.55 0.40
0.93
Values between brackets are number of does.
*Values with different superscript within the same column differ significantly (P<0.05). A = Natural oestrus and natural mating. B = Progesterone +AI. 48 hrs after removal. C= Progesterone + PMSG 48 hrs before removal + AI. At removal D. = Progesterone + PMSG at removal+ AI. 48 hrs after removal E = Progesterone + PMSG & PGF2a� at removal + AI. 48 hrs after removal F = Progesterone + PGF2a� + at removal + AI. 48 hrs after removal
Please purchase PDFcamp Printer on http://www.verypdf.com/ to remove this watermark.
48
3.2.3. Progesterone (P4) concentrations in does carried to full
term & does not carried to full term at the day of oestrus/
insemination: As shown in table (10), progesterone concentrations at the day of insemination
or mating were almost low in the does not carried to full term except two does
from group B and one doe in each of groups, C, D, E and F. while they were
consistently low in the does carried to full term (> 3.38 nMol/l).
The mean progesterone concentration in the does carried to full term was
lower than that of the does that not carried to full term. Even the overall P4
values for the does carried to full term in the groups were less than that in does
not carried to full term but without significant difference (P>0.05).
Concerning does that not carried to full term, the mean progesterone
concentration of group A (1.07nMol/l) is the lowest concentration among the
groups and group B showed the highest P4 concentration ( 14.99 nmol/l)
appendix ( ). The rest of the groups were similar in their P4 concentrations. No
significant differences were found between the means of P4 among the does
not carried to full term in the different groups at insemination (P>0.05).
The does carried to full term in group C registered the lowest P4 value at
insemination (0.20 nMol/l).
3.2.4. Progesterone (P4) concentrations on day 7 post-
insemination in does carried to full term and does not carried to
full term: Progesterone concentrations of the does carried to full term seven days post
insemination were always high (>14.08 nMol/l) in all treatment groups, while
most of the does not carried to full term registered low levels of the P4
Please purchase PDFcamp Printer on http://www.verypdf.com/ to remove this watermark.

49
Table (10): Progesterone (P4) concentrations in does carried to full term & does not carried to full term at the day of oestrus/
insemination (nMol/L):
Synchronizations protocols
Parameters A B C D E F
N0. of does 10 10 10 10 10 10
Does not carried to full term
Mean ±Sd (nMol/l)
1.07±0.96A
(7)
1.63 ± 1.31A
(5)
3.97±8.95A
(7)
3.90±4.27A
(6)
3.76±2.85A
(7)
4.33±2.21A
(7)
Does carried to full term
Mean ±Sd (nMol/l)
2.02±0.41A
(3)
1.79±0.92A (3)
0.20±0.15A (3)
1.56±1.02A (4)
2.82±1.08A (3)
1.85±1.06A (3)
P-value* 0.07 0.21 0.31 0.42 0.47 0.37
Values between brackets are number of does. *Values with different superscript within the same column differ significantly (P<0.05). *Tow does in group B with high progesterone concentrations had been excluded from statistical analysis A = Natural oestrus and natural mating. B = Progesterone +AI. 48 hrs after removal. C= Progesterone + PMSG 48 hrs before removal + AI. At removal D. = Progesterone + PMSG at removal+ AI. 48 hrs after removal E = Progesterone + PMSG & PGF2a� at removal + AI. 48 hrs after removal F = Progesterone + PGF2a� + at removal + AI. 48 hrs after removal
Please purchase PDFcamp Printer on http://www.verypdf.com/ to remove this watermark.
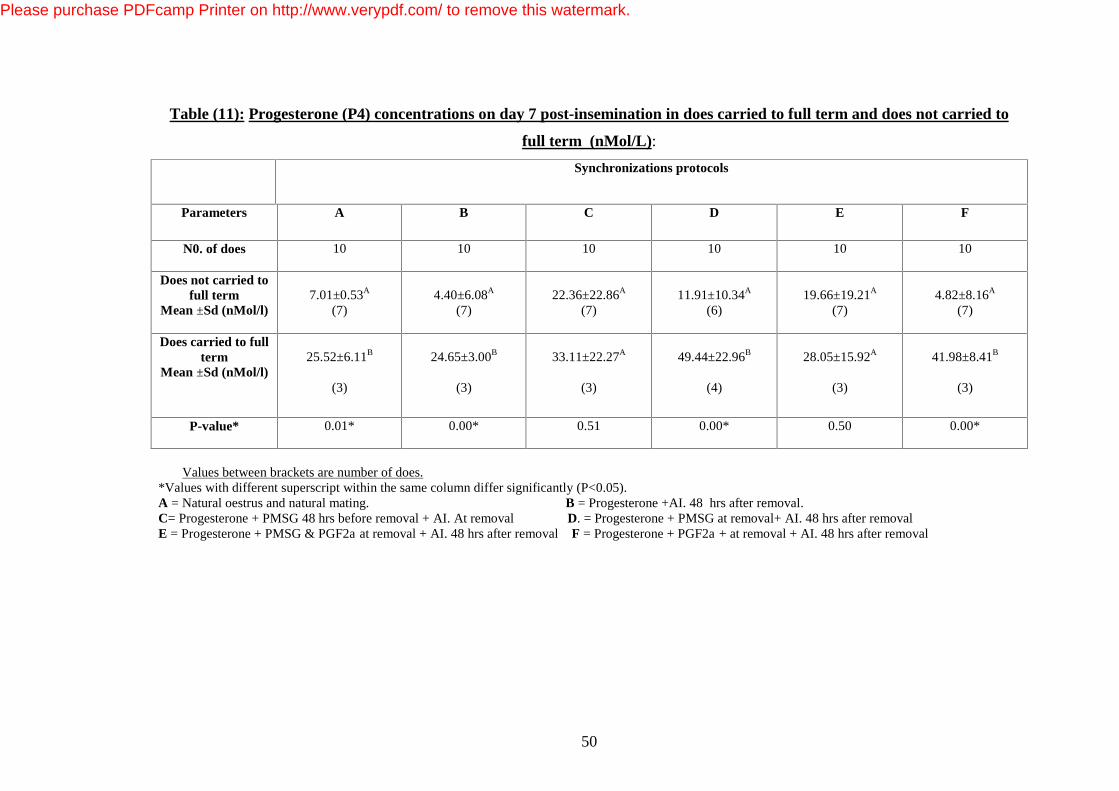
50
Table (11): Progesterone (P4) concentrations on day 7 post-insemination in does carried to full term and does not carried to
full term (nMol/L): Synchronizations protocols
Parameters A B C D E F
N0. of does 10 10 10 10 10
10
Does not carried to full term
Mean ±Sd (nMol/l)
7.01±0.53A
(7)
4.40±6.08A
(7)
22.36±22.86A
(7)
11.91±10.34A
(6)
19.66±19.21A
(7)
4.82±8.16A
(7)
Does carried to full term
Mean ±Sd (nMol/l)
25.52±6.11B
(3)
24.65±3.00B
(3)
33.11±22.27A
(3)
49.44±22.96B
(4)
28.05±15.92A
(3)
41.98±8.41B
(3)
P-value*
0.01* 0.00* 0.51 0.00* 0.50 0.00*
Values between brackets are number of does.
*Values with different superscript within the same column differ significantly (P<0.05). A = Natural oestrus and natural mating. B = Progesterone +AI. 48 hrs after removal. C= Progesterone + PMSG 48 hrs before removal + AI. At removal D. = Progesterone + PMSG at removal+ AI. 48 hrs after removal E = Progesterone + PMSG & PGF2a� at removal + AI. 48 hrs after removal F = Progesterone + PGF2a� + at removal + AI. 48 hrs after removal
Please purchase PDFcamp Printer on http://www.verypdf.com/ to remove this watermark.
51
concentrations at this day ( some exceptional does showed high P4
concentrations).
The mean progesterone concentrations of does carried to full term seven days
post–insemination in all the treatment groups were higher than that for the non-
pregnant does These variations in the mean P4 concentrations between does
carried to full term and does not carried to full term were significantly different
(P<0.05) in groups A, B, D and F, while the differences were insignificant
(P>0.05) in group C and E (table 11).
The mean progesterone concentrations 7 days post- insemination for the does
carried to full term were lower in group A and B (24.65 and 25.52 nMol/L)
than that in group E, C and D (28.05, 33.11 and 49.44 nMol/L respectively) but
these differences were not significant (P>0.05), where for the does not carried
to full term the mean P4 concentrations on day 7 post-insemination in groups
B, F and A, (4.40, 4.82 and 7.01 nMol/L respectively) were lower than that of
groups D, E and C (11.91, 19.66 and 22.36 nMol/L respectively) but also these
differences were not significant (P>0.05), as illustrated in table (11).
3.2.5. Progesterone (P4) concentrations on day fourteen post-
insemination in does carried to full term and does not carried to
full term: Table (12) showed that, the mean progesterone concentrations in all treatment
groups fourteen days post insemination were always high, (>23.15 nMol/L
and >15.58 nMol/L) in does carried to full term and does not carried to full
term, respectively.
The mean progesterone concentrations in does carried to full term fourteen
days post–insemination in all the treatment groups were higher than that for the
does not carried to full term. These variations in the mean P4 concentrations
Please purchase PDFcamp Printer on http://www.verypdf.com/ to remove this watermark.

52
Table (12): Progesterone (P4) concentrations on day fourteen post-insemination in does carried to full term and does not
carried to full term(nMol/L):
Synchronizations protocols
Parameters A B C D E F
N0. of does 10 10 10 10
10 10
Does not carried to full term
Mean ±Sd (nMol/l)
18.02±22.25A
(7)
15.58±33.71A
(7)
16.58±20.25A
(7)
25.90±19.55A
(6)
21.36±20.99A
(7)
18.15±15.27A
(7)
Does carried to full term
Mean ±Sd (nMol/l)
23.15±11.63A (3)
33.71±6.12A (3)
40.84±1.09A (3)
25.83±25.17A (4)
52.27±17.98B (3)
27.47±5.57A (3)
P-value* 0.66 0.14 0.08 0.59
0.04* 0.19
Values between brackets are number of does. *Values with different superscript within the same column differ significantly (P<0.05). A = Natural oestrus and natural mating . B = Progesterone +AI. 48 hrs after removal. C= Progesterone + PMSG 48 hrs before removal + AI. At removal D. = Progesterone + PMSG at removal+ AI. 48 hrs after removal E = Progesterone + PMSG & PGF2a� at removal + AI. 48 hrs after removal F = Progesterone + PGF2a� + at removal + AI. 48 hrs after removal
Please purchase PDFcamp Printer on http://www.verypdf.com/ to remove this watermark.

53
between does carried to full term and does not carried to full term was just at
the level of significance (P=0.05) in group E, while the remaining groups
showed in- significant differences (P>0.05).
The progesterone concentrations fourteen days post- insemination for the does
carried to full term were significantly indifferent (P>0.05) when we compare
the means of the different treatment groups.
The progesterone concentrations fourteen days post- insemination for the does
not carried to full term were significantly indifferent (P>0.05) when we
compare the means of the different treatment groups. 3.2.6. Progesterone (P4) concentrations on day twenty one post-
insemination in does carried to full term and does not carried to
full term:
Progesterone concentrations of the does carried to full term twenty one days
post insemination were always high (>14.62 nMol/l) in all treatment groups,
while most of the does not carried to full term registered lower levels of the P4
concentrations at this day ( some exceptional does showed elevated P4
concentrations), as illustrated in table (13).
The mean progesterone concentrations in does carried to full term twenty one
days post–insemination in all the treatment groups were higher than that for
does not carried to full term. These variations in the mean P4 concentrations
between the types of does, were significantly different (P<0.05) in all groups
except group A (P>0.05).
The progesterone concentrations twenty one days post- insemination in the
does carried to full term were significantly indifferent (P>0.05) when we
compare the means of the different treatment groups.
Please purchase PDFcamp Printer on http://www.verypdf.com/ to remove this watermark.
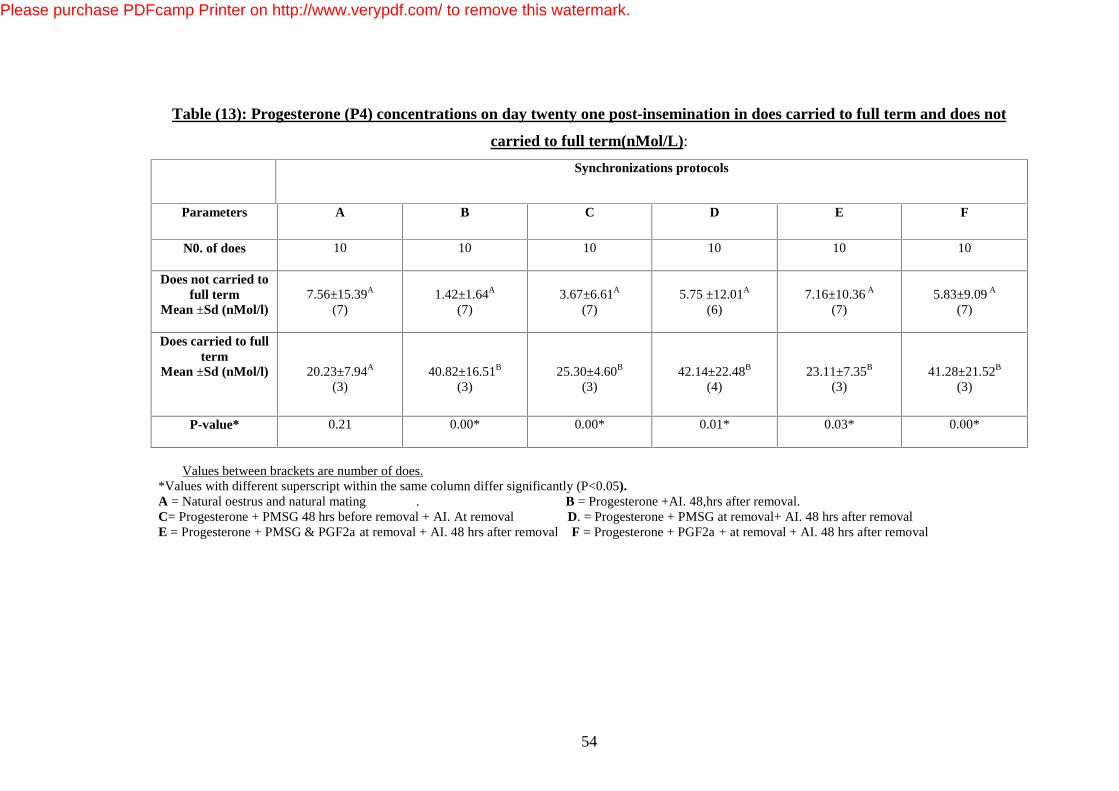
54
Table (13): Progesterone (P4) concentrations on day twenty one post-insemination in does carried to full term and does not
carried to full term(nMol/L): Synchronizations protocols
Parameters A B C D E F
N0. of does 10 10 10 10
10 10
Does not carried to full term
Mean ±Sd (nMol/l)
7.56±15.39A
(7)
1.42±1.64A
(7)
3.67±6.61A
(7)
5.75 ±12.01A
(6)
7.16±10.36 A
(7)
5.83±9.09 A
(7)
Does carried to full term
Mean ±Sd (nMol/l)
20.23±7.94A (3)
40.82±16.51B (3)
25.30±4.60B (3)
42.14±22.48B (4)
23.11±7.35B (3)
41.28±21.52B (3)
P-value* 0.21 0.00* 0.00* 0.01*
0.03* 0.00*
Values between brackets are number of does.
*Values with different superscript within the same column differ significantly (P<0.05). A = Natural oestrus and natural mating . B = Progesterone +AI. 48,hrs after removal. C= Progesterone + PMSG 48 hrs before removal + AI. At removal D. = Progesterone + PMSG at removal+ AI. 48 hrs after removal E = Progesterone + PMSG & PGF2a� at removal + AI. 48 hrs after removal F = Progesterone + PGF2a� + at removal + AI. 48 hrs after removal
Please purchase PDFcamp Printer on http://www.verypdf.com/ to remove this watermark.

55
3.2.7. Comparisons between progesterone (P4) concentrations of the goats that not carried to term/ returned to oestrus and these which carried to term during synchronization, at insemination and at first 21 days after insemination Before progestagen treatment the mean Progesterone concentration of all does
carried to full term (14.04 nMol/l) were insignificantly (P>0.05) higher than
that in total does that not carried to full term (12.91 nMol/l), as illustrated in
table (14). At mid- period of progestagen treatment the mean progesterone
concentration in all does carried to full term (26.92 nMol/l) were higher than
that in the total does not carried to full term (23.70 nMol/l), but without
significance difference (P>0.05) table (14). The mean progesterone
concentration in all does carried to full term at insemination (3.86 nMol/l) were
higher than that in the total does not carried to full term (1.71 nMol/l), but
without significance difference (P>0.05) table (14). At seven days post
insemination the mean Progesterone concentration of all does carried to full
term (33.81 nMol/L) was significantly higher (P<0.05) than that for the total
goats not carried to term (11.56 nMol/L) table (14). The mean progesterone
concentration of all does carried to full term (35.77nMol/L) was still
significantly higher (P<0.05) than that for all does not carried to full term
(19.31±18.29 nMol/L) fourteen days post insemination table (14). The mean
P4 concentration in does carried to full term (33.36±16.65 nMol/L) was
significantly higher (P<0.05) than that for all does not carried to full term
(5.46 ± 9.79 nMol/L), twenty one days post insemination table (14).
Please purchase PDFcamp Printer on http://www.verypdf.com/ to remove this watermark.

56
Table (14):Comparisons between progesterone (P4) concentrations (nMol/L) of the goats that not carried to term/ returned to oestrus and these which carried to term at a selected sampling periods
Parameters P4 concentration
before progestagen treatment
P4 concentration at mid period (day 6) of progestagen
treatment
P4 concentration at the day of
insemination (AI)
P4 concentration 7 days after
insemination (AI)
P4 concentration 14 days after
insemination (AI)
P4 concentration 21 days after insemination
(AI)
Does not carried to full term
Mean ±Sd (nMol/l)
12.91 ± 5.25A
(34)
23.70 ± 9.98A
(34)
3.86±6.02 A
(32)
11.56±7.89A
(34)
19.31±18.29A
(34)
5.46±9.79 A
(34)
Does carried to full term
Mean ±Sd (nMol/l)
14.04 ± 9.63A
(16)
26.92 ± 12.90A
(16)
1.71±0.86A
(16)
33.81±9.97B
(16)
35.77±15.91B
(16)
3.36±16.65B
(16)
P-value
0.82
0.67
0.06
0.00*
0.00*
0.00*
*Values with different superscript within the same column differ significantly (P<0.05).
*Values between brackets are number of does *Tow does, from the does that not carried to term at AI, recorded high progesterone concentrations and had been excluded from statistical analysis
Please purchase PDFcamp Printer on http://www.verypdf.com/ to remove this watermark.

57
3.2.8. Progesterone profile during pregnancy, abortion and early embryonic death During the first days of pregnancy the progesterone concentrations increased gradually with different fluctuating
peaks remaining high (>3.18 nMol/L) until just two to three days before parturition, the serum progesterone
profile of the individual Nubian does during pregnancy was illustrated in figures (4--9), where as figure (10--13)
represent the profiles of does with incompletes pregnancies as a result of abortions or early embryonic death.
Please purchase PDFcamp Printer on http://www.verypdf.com/ to remove this watermark.

58
Please purchase PDFcamp Printer on http://www.verypdf.com/ to remove this watermark.

59
Figure (6). Plasma progesterone concentrations (P4) during gestation in group A. in goats carried to full term.
Please purchase PDFcamp Printer on http://www.verypdf.com/ to remove this watermark.

60
**Arrows refer today of parturition.
Please purchase PDFcamp Printer on http://www.verypdf.com/ to remove this watermark.
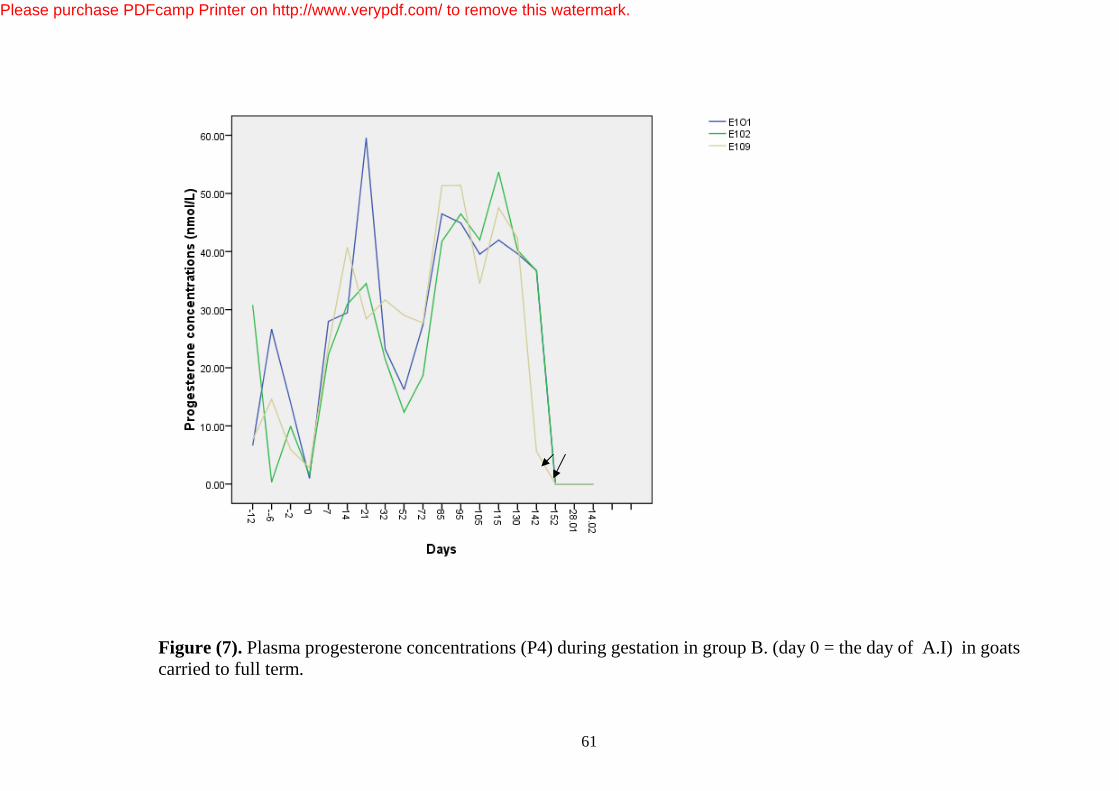
61
Figure (7). Plasma progesterone concentrations (P4) during gestation in group B. (day 0 = the day of A.I) in goats carried to full term.
Please purchase PDFcamp Printer on http://www.verypdf.com/ to remove this watermark.

62
**Arrows refer today of parturition.
.
Please purchase PDFcamp Printer on http://www.verypdf.com/ to remove this watermark.

63
Please purchase PDFcamp Printer on http://www.verypdf.com/ to remove this watermark.

64
Figure (8). Plasma progesterone concentrations (P4) during gestation in group C. in goats carried to full term. ** (day 0 = the day of A.I) **Arrows refer today of parturition.
Please purchase PDFcamp Printer on http://www.verypdf.com/ to remove this watermark.

65
Figure (9). Plasma progesterone concentrations (P4) during gestation in group D. in goats carried to full term. ** (day 0 = the day of A.I)
Please purchase PDFcamp Printer on http://www.verypdf.com/ to remove this watermark.

66
**Arrows refer today of parturition.
Please purchase PDFcamp Printer on http://www.verypdf.com/ to remove this watermark.
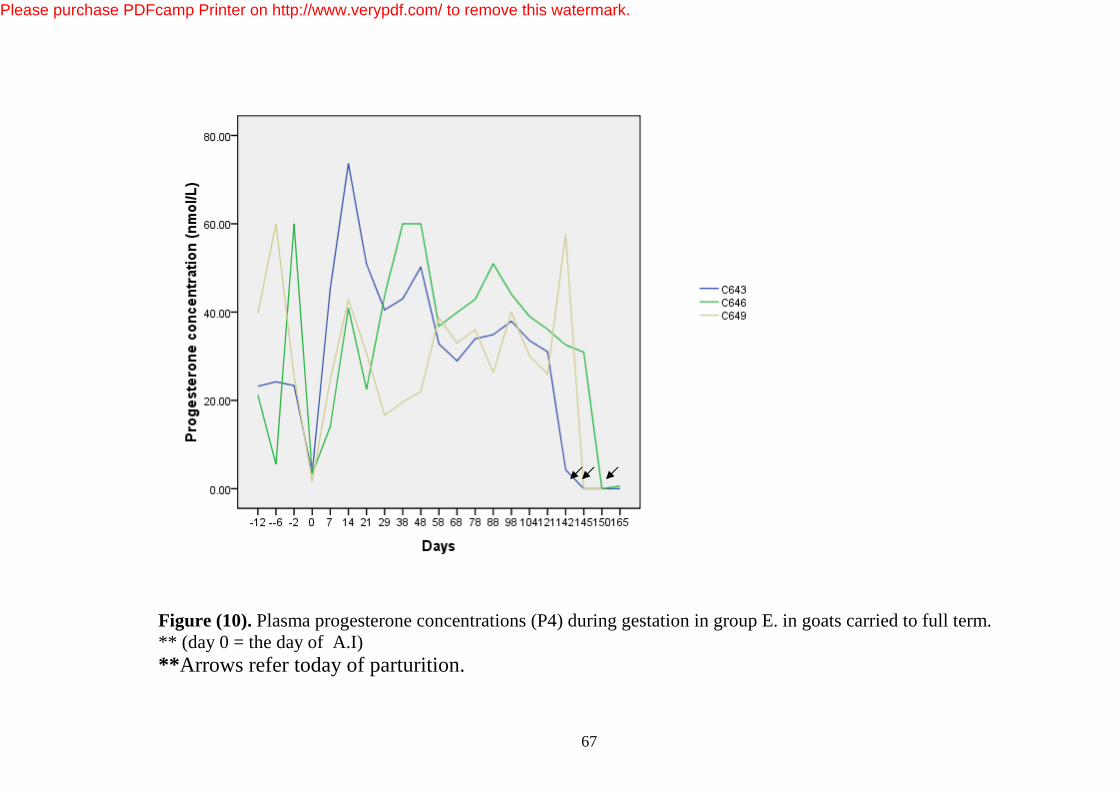
67
Figure (10). Plasma progesterone concentrations (P4) during gestation in group E. in goats carried to full term. ** (day 0 = the day of A.I) **Arrows refer today of parturition.
Please purchase PDFcamp Printer on http://www.verypdf.com/ to remove this watermark.

68
Please purchase PDFcamp Printer on http://www.verypdf.com/ to remove this watermark.
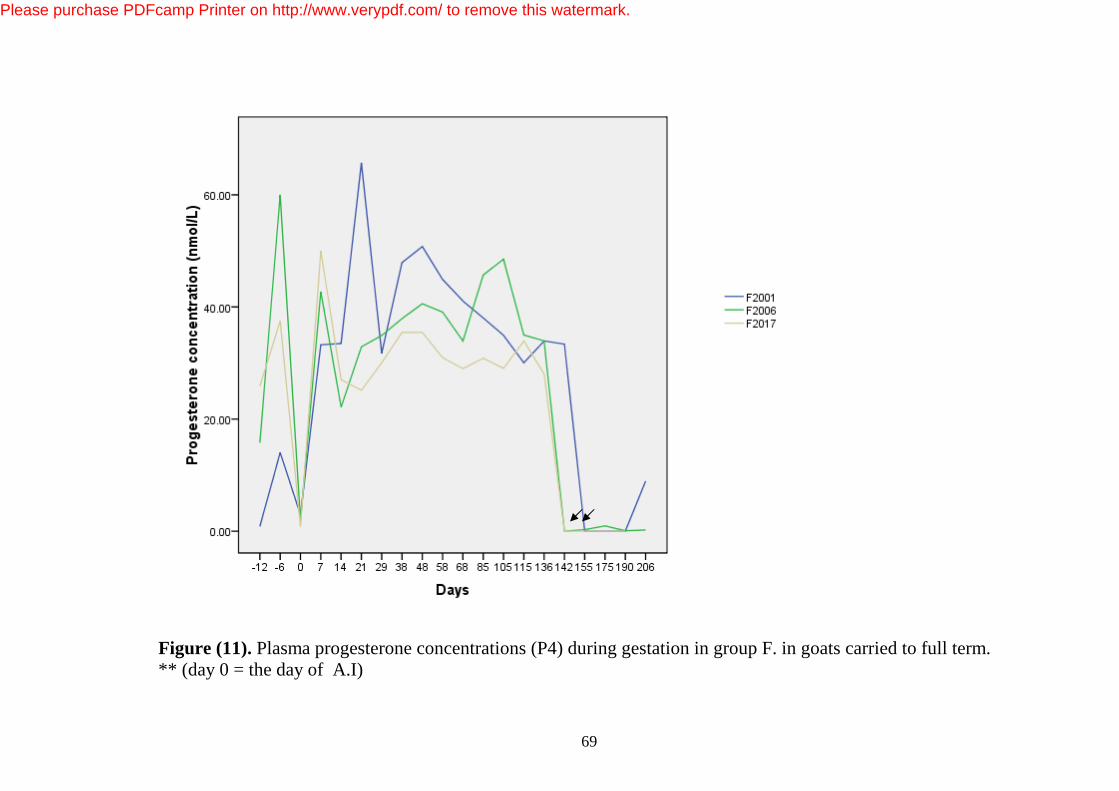
69
Figure (11). Plasma progesterone concentrations (P4) during gestation in group F. in goats carried to full term. ** (day 0 = the day of A.I)
Please purchase PDFcamp Printer on http://www.verypdf.com/ to remove this watermark.
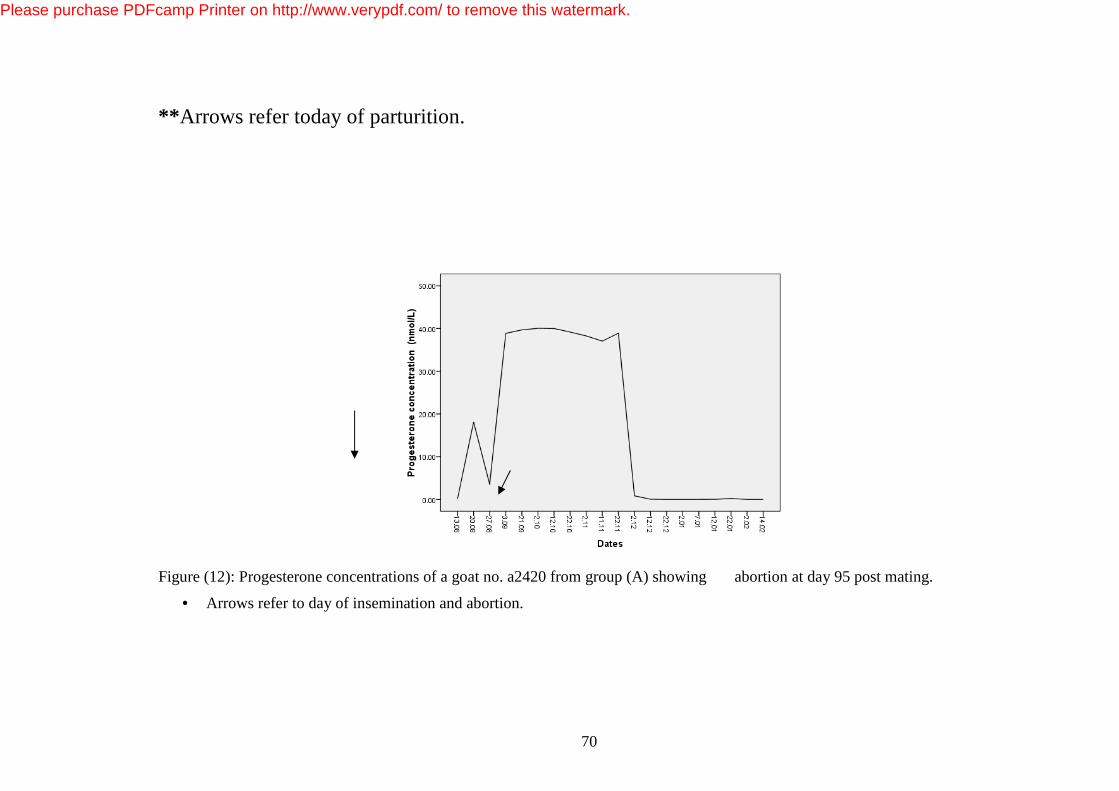
70
**Arrows refer today of parturition.
Figure (12): Progesterone concentrations of a goat no. a2420 from group (A) showing abortion at day 95 post mating.
• Arrows refer to day of insemination and abortion.
Please purchase PDFcamp Printer on http://www.verypdf.com/ to remove this watermark.
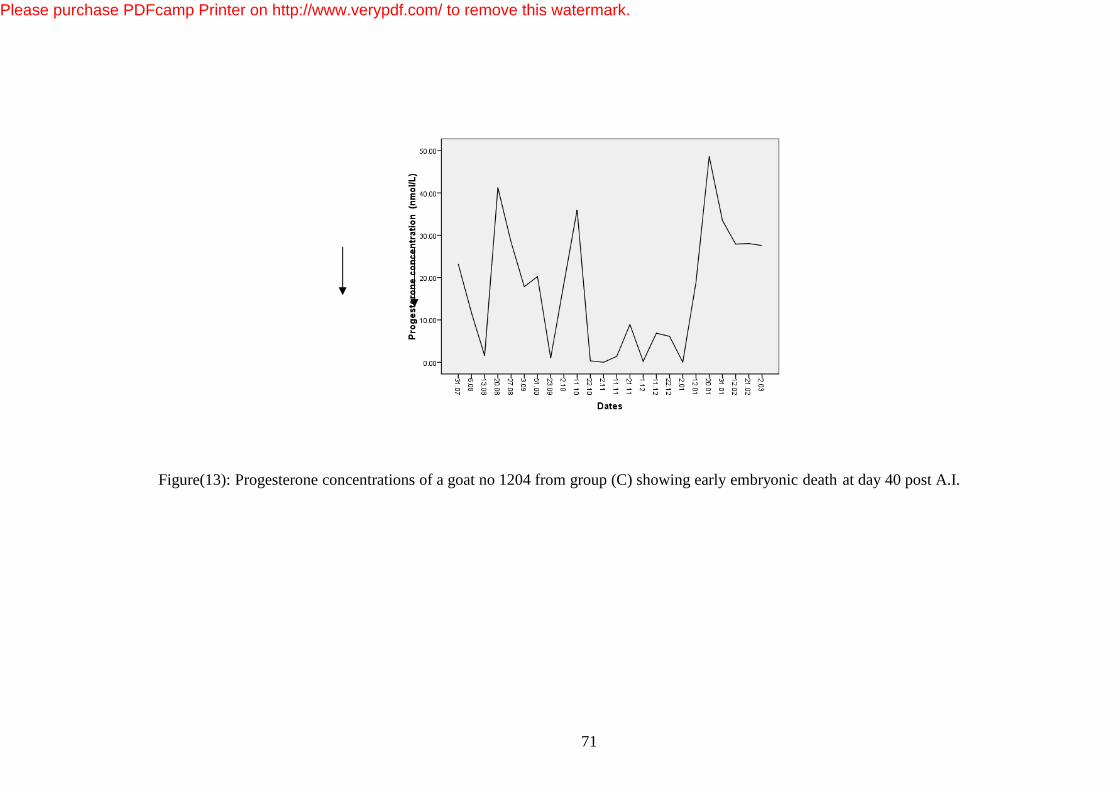
71
Figure(13): Progesterone concentrations of a goat no 1204 from group (C) showing early embryonic death at day 40 post A.I.
Please purchase PDFcamp Printer on http://www.verypdf.com/ to remove this watermark.
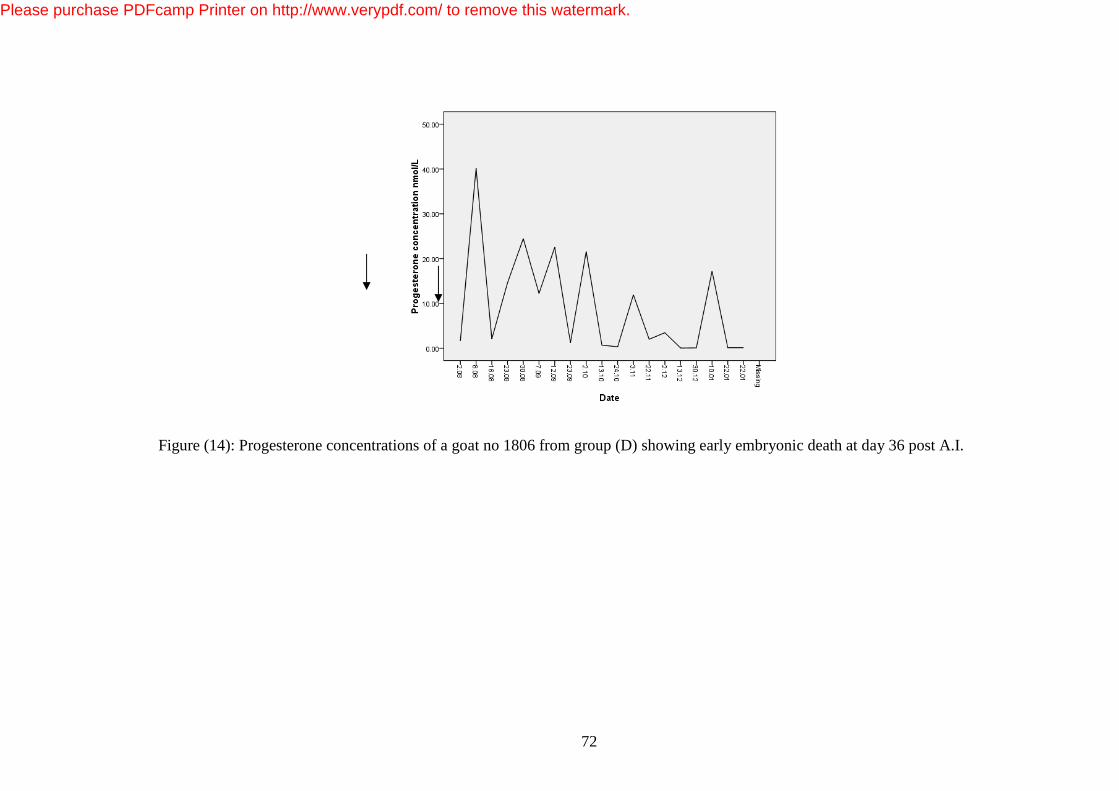
72
Figure (14): Progesterone concentrations of a goat no 1806 from group (D) showing early embryonic death at day 36 post A.I.
Please purchase PDFcamp Printer on http://www.verypdf.com/ to remove this watermark.

73
Figure (15): Progesterone concentrations of a goat no 644 from group (E) showing early embryonic death
At 36 day and pregnancy after reinsemination
Chapter Four
DISSCUTION 4.1 Non Return Rate:
Treatment with progesterone is known to significantly improve the conception rate in ovulation synchronization
protocols applied to anestrus does. Our findings (40%-60%) were in range with that registered by Muna et al.
(1998), Elmansory (2008) and Babiker et al. (2010) for the Sudanese Nubian goats; Ali (2004) and Elmubark
Please purchase PDFcamp Printer on http://www.verypdf.com/ to remove this watermark.
74
(2010) for Sudanese Desert goats and Motlomelo et al. ( 2002) in Boer and Indigenous goats. The low
conception rate recorded could be attributed to the insemination being executed too late in some goats in the flocks
or in early stages of the luteal phase at the time of synchronization (Chao et al., 2008; Karikari et al., 2009).
4.2 Pregnancy rate:
In this study, does treated with progesterone with or without eCG showed higher pregnancy rates, compared to the
control group. This probability of pregnancy at first AI in the present study is consistent with other estimates after
using progesterone device mentioned by Motlomelo et al. ( 2002) in Boer and Indigenous goat and was in
agreement with what was recorded by Eppleston et al. (1991); Shalapy et al. (2000) and Yousif (2008) in Nubian
goats, but lower than that obtained by Fonseca et al. (2005). Moreover, progestagen treatment plus eCG injected
48 hours before the removal of progestagen (group D) had better results than when injected at the time of the
removal (group C) and this is similar to what had been described by Leboeuf et al. (2000). While some authors
found that injection of eCG at the time of the progesterone removal had better results (Ritar et al. 1984).
4.3 Kidding rate%
As shown in this study, the injection of eCG, 48 hours before the termination of progestagen treatment, had better
Kidding rate results (40%) than that injected at the time of progestagen removal (30%), this result was similar to
that obtained by Ahmed et al. (1998) that the fertility rate for Sudanese Nubian does treated with progesterone
impregnated sponges plus eCG was 33% and Leboeuf et al. (2000). In contrast Amarantidis et al. (2004) reported
that administration of eCG at termination, or 48h before the termination of intra- vaginal FGA treatment did not
Please purchase PDFcamp Printer on http://www.verypdf.com/ to remove this watermark.
75
improved fertility. The combination of progesterone plus eCG and PGF2a� had the same effect on kidding rate as
progesterone alone. This confirmed what was reported by Krisher et al. (1993); Hafez and Hafez (2000). Kidding
Rate obtained in this study were less than that reported by Martinez et al.(2005) for the Nubian does (71.4%) and
Kausar et al. (2009) who registed 87.5 Kidding rate % in (Beetal x Dwarf). Kidding rates was less than pregnancy
rates, and that could be due to early embryonic death, or unnoticed abortions. These observations were also
reported by Elmubark, (2001) and Soumia (2002).
4.4. Fecundity rate:
There is a paucity of information concerning fecundity rates in African goat breeds. In the present study the
overall average fecundity rate, across the treatment and control groups, ranged between 0.4 (group F) and 1 (group
D). These values were close to that reported for Northern Kenyan goats, (Hans Meyer et al., 2004), where
fecundity reached 1.18 kids per doe, and lower than that recorded for Nadooshani goats by Bitaraf et al., (2007)
who found the fecundity to be 1.38. Fecundity was not significantly influenced by the oestrous synchronization
methods used in this study, this fact was similarly mentioned by ( Ahmed et al,. 1998) and (Babiker et al., 2010)
when they studied fertility in the same breed.
4.5. Twining rate
There was no significant variations in twining rates between the different treatment groups. The results reveled by
group A, D and E were higher than that reported by Al-Merestani et al. (2003) for Damascus goat and Elmoubark
(2010) for Sudanese Desert Goats, but in agreement with the fact reported by Shahneh et al. (2008) that flushing,
Please purchase PDFcamp Printer on http://www.verypdf.com/ to remove this watermark.
76
especially coupled with eCG treatment increased twining rate, and Kusina et al. (2000), who found that
combination of three hormones (progesterone, PGF2a� and eCG) increased twining rate.
4.6. litter size:
The litter size in this study ranged between 1.3 - 2.5. These values were also reported by Song et al. (2006) who
found the mean litter size in the Korean Native goat was 1.69, Lehloenya et al. (2005) who reported mean litter
size of 2.2 and 2.0, in Boer and Nguni goats, respectively, Imasuen and ikhimioya (2009) who found litter size of
1.75, 2.25 and 2.0 for West African Dwarf Goat treated with 25mg MAP, 5mg MAP and 10mg MAP, respectively.
Martinez et al. (2005) reported a lower litter size for the Nubian does (1.1) when he compared the prolificacy of the
Nubian does with that of Creole and Celtiberians goats.
4.7. Gestation period
The range of gestation periods for the Nubian does found in this study is between 142.25±2.1 and 152±1.9 days. |It
is similar to that found by Devendra and Mcleory (1982), Kudouda (1985) , Jubara (1996) ; Salim et al. (2002) and
Elmubark, (2010) in Sudanese Nubian goats, and Kusina et al. (2000) in Mashona goats. Lehloenya et al. (2005),
in Boer and Nguni goats. Length of gestation period (144.8 days) observed in Dwarf goats by (Amoah et al. 1996)
and Khanum et al. (2007) is comparatively shorter than some other breeds of goat such as 152.1 days in
Toggenburg, 151.1 days in Nubian and 150.5 days in Saanen breed.
The gestation length of does, pregnant with male kids were longer (1-2 days) than in those bearing female kids.
This observation was also recorded by Kudouda (1985) in Sudanese Nubian goats, and (Hafez and Hafez, 2000).
Please purchase PDFcamp Printer on http://www.verypdf.com/ to remove this watermark.
77
4.8. Progesterone (P4) Concentrations before Synchronization ( Day of Hormonal Application):
The serum progesterone concentrations before synchronization were highly variable according to the physiological
state of each doe. Does which were in the luteal phase of oestrus showed higher concentrations, while those in
the follicular phase showed lower concentrations of the hormone. This difference in the progesterone concentration
according to the stage of oestrus was also reported by Leyva-Ocariz et al. (1995), when they compared the
progesterone profiles of native and cross-bred goats in a tropical semiarid zone during the oestrus cycle, on day 0,
one, tow and 20 progesterone concentrations were less than 1 ng/ml (o.5±o.2ng/ml), and presenting highest values
on days 15 and 12 ( 12 ng/ml and 10ng/ml, respectively). For both native and cross-bred does, progesterone
concentrations (2.0±1.2ng/ml and 1.8± 0.2ng/ml, respectively) on day 19 indicated that luteal regression had
started. A significant difference (P<o.o5) between day 4 (2± 0.49ng/ml) and day 2 in progesterone levels was
found, indicating that the luteal phase was established from day 4 until day 19. These finding were in agreement
with progesterone blood levels found previously ( Thibier et al., 1981; Bono et al., 1983). A similar data were
also obtained by Greyling and Van der Nest, (2000), that, the mean serum progesterone concentrations for the
observation period varied between 0.01 and 6.19 ng/ml for Indigenous and 0.01 and 9.05 ng/ml for Boer goat. In
Damascus goats, Khadiga et al. (2005) reported that the progesterone level during luteal phase ranged from 2.6 to
5.4 ng/ml. Khanum et al. (2008) reported that, the Progesterone started to increase from the mean basal value of
0.1 ± 0.03 ng/ml on day-0 to 3.0 ± 0.9 ng/ml on day-6 of oestrus cycle and reached the peak value of 7.7 ± 0.6
ng/ml on day-12. From day-15, a decline was observed in progesterone values till the end of the cycle.
Please purchase PDFcamp Printer on http://www.verypdf.com/ to remove this watermark.
78
4.9. Progesterone (P4) concentrations in does carried to full term & does not carried to full term at mid-
period (day 6) of Synchronizations:
The progesterone concentrations at the mid-period (day 6) of treatment were commonly high, reach up to 36.09
nmol/l (11.35 ng/ml) for the does not carried to full term & 40.63 nmol/l (12.77 ng/ml) for does carried to full
term, without significance differences between the type of does (P>0.05). These results were similar to those
reported by Kusina et al. (2000) who found that the progesterone concentrations increased sharply following
insertion of sponges to peak at 6 to 7 ng/ml within 3 to 5 days after sponges insertion. These levels were
maintained thereafter until removal of sponges. Those results were also obtained in studies in ewes (Kusina et al.,
2000), and in cows ( Walsh et al., 2007., McDougall et al., 2004) that intravaginal treatment of anovulatory
anestrus cows with 1.56g of progesterone has been reported to increase circulating progesterone concentrations to
a peak of 1.2 ng/ml within 24 h and maintain an average serum progesterone concentrations greater than 1 ng/ml
for seven days. In contrast, El-Moristany et al. ( 2000) reported a decrease in the progesterone concentrations
throughout the progesterone sponge treatment (0.25±0.15 nmol/litre and 0.15±0.05 nmol/ litre for MAP and FAG
respectively).
4.10. Progesterone (P4) concentrations in Nubian does carried to full term and does not carried to full term
in the day of oestrus / AI Application:
Please purchase PDFcamp Printer on http://www.verypdf.com/ to remove this watermark.
79
The mean progesterone concentrations at the day of insemination of goats that came in oestrus and show clear
signs were decreased without significant difference between the different treatments, the mean progesterone
concentrations at the day of insemination for the does does carried to full term were decreased below 2.82
nmol/l(0.89 ng/ml) and for the does not carried to full term were decreased below 3.67 nmol/l (1.15 ng/ml) without
significant difference (P>0.05). These results were similar to the basal levels of progesterone in oestrus that
found in other goat breeds ( Zarkawi and Soukouti, 2001; Khadiga et al., 2005; Khanum et al., 2008).
Musadin et al., (1996) reported mean progesterone concentrations during the follicular phase of oestrus cycle as
0.19 and 0.26 ng/ml in Dorset Horn-Malin (DHM) and Malin ewes respectively, but the mean p4 concentation for
group B from non- pregnant does is relatively high (14.99 nmol/l or 4.71 ng/ml) as a result of high readings of the
hormone for tow does in this group (27.29 &56.22 nmol/l i.e 8.58& 17.71 ng/ml) which may be due to a
persistence corpus luteum or assay sensitivity.
4.11. Progesterone (P4) concentrations on day 7,14,21 post-insemination, and during pregnancy in does
carried to full term and does not carried to full term
Progesterone concentration in day 7-post insemination were significantly higher in the does carried to full term
than does not carried to full term (p<0.05). This is due to the presence of the a functional corpus luteum that
secretes progesterone through-out the gestation period to maintain pregnancy. This fact is similar to what was
reported by Kanuya et al. (2000). Some does that does from ones that not carried to full term recorded an elevated
levels of progesterone on day seven after insemination but seems to expose to an early embryonic death. The
Please purchase PDFcamp Printer on http://www.verypdf.com/ to remove this watermark.

80
serum progesterone concentration on day 14 post breeding was higher in both does that carried to full term and that
not does carried to full term, the later assume to be in the luteal phase, these findings were in line with that
reported by (Khadiga et al., 2005), in Damascus goats, where progesterone level during luteal phase ranged from
2.6 to 5.4 ng/ml.
On day 21 post breeding the P4 concentrations of the does carried to full term (20 ng/ml) was higher than that of
does not does carried to full term which assume to return to oestrus. These values were similar to that reported by
Elmobark (2010) and in close agreement with the progesterone profile reported by Zarkawi and Al- Masri
(2002) ,7.24 ± 2.80 ng/ml, and higher than that registered by Selvaraju (2007), 2.5-4.8ng/ml.
In this study and during gestation, higher levels of progesterone were maintained with wide variations between
does like that reported for Dwarf goats (Khanum et al., 2008). Sousa et al., (1999); Humblot et al., (1990);
Thorburn & Schneider., (1972) and Irving et al., (1972) also reported a weekly variation among the does and
during the stage of pregnancy. These authors established that there are no trends for a continuous increase or
decrease of mean progesterone concentrations throughout pregnancy. In indigenous Small East African goats, the
mean plasma progesterone concentration ranged from 2.6 to 10.8 ng/ml from conception to the mid gestation
(Kanuya et al., 2000).
The inconsistency in the magnitude of progesterone in the pregnant does (does carried to full term) is also
reported for the Nubian goats by Elmansoury (2008), in his study the maximum progesterone concentrations was
reached at days 120-135 of pregnancy before it started to decrease significantly in the last tow weeks pre-partum.
Please purchase PDFcamp Printer on http://www.verypdf.com/ to remove this watermark.
81
The same results were also reported by Ezzo and Shalaby, (1990) in sheep and goat. They assumed the decrease as
a result of corpus luteum regression. The progesterone profiles in this experiment is close to the findings of
Llewelyn et al. (1995); Ahmed et al. (1998) and Kanuya et al. (2002), who stated that does exhibited serum
progesterone concentration > 2 ng/ml and maintained these elevated levels during the the gestation period were
considered to be pregnant and were confirmed to be so after kidding.
The overall increase in progesterone levels during gestation and a decline towards the prepartum or parturition,
observed in this study was similar to that reported by (Kadzere et al., 1997; Ozpinar and Firat, 2003; Khanum et
al., 2008). The prepartum decline in the progesterone levels was correlated with the onset of parturition (Laura et
al., 2004). In this study the mean progesterone concentrations were not affected by the litter size (number of foeti ).
These findings were similar to that reported by Jarrell and Dziuk (1991).
4.12. Progesterone profiles in does exposed to abortion or early embryonic death
In this study the kidding rates were less than pregnancy rates which indicate a high loss of embryos. This fact was
also reported by Ahmed et al. (1998), Romano, (2002) and Lu Meng et al. (2008). Johnson et al. (1996) who
observed that two ewes that received 5 mg of progesterone had live fetuses 25 days after mating but returned to
estrus before 40 days of gestation. These researchers indicated that treatment with a low concentration of
progesterone increased the concentration of estradiol and that the low pregnancy rate was attributed to the high
concentration of estradiol. This notification was also suggested by Lu Meng et al., (2008), that the high incidence
of embryonic loss could be attributed to the high concentration of estradiol caused by the low concentration of
Please purchase PDFcamp Printer on http://www.verypdf.com/ to remove this watermark.

82
progesterone and the pregnancy that was supposed to be carried to term was impeded by functionally poor
luteinization. Battye et al., (1988), reported that premature release of PGF2a� from the endometrium might be the
cause of premature regression of the CL in superovulated goats. Hooper et al., (1986) reported that uterine release
of PGF2a� was associated with the secretion of oxytocin by the ovary which controlled luteal regression. It was
suggested that the high embryo loss after synchronization treatment and mating was caused by a functionally poor
CL bringing low doses of progesterone. Further study should be conducted using other methods such as high doses
of progesterone to improve the reproductive performance of goats.
Please purchase PDFcamp Printer on http://www.verypdf.com/ to remove this watermark.
83
Conclusion and Recommendation
1. All the hormonal treatments employed in this study, successfully induced and synchronized oestrus in the Nubian does.
2. Progesterone concentrations during synchronizations were not affected by the different
hormonal methods used to induce oestrus.
3. No significance differences in the progesterone concentrations between goats carried to full term and goats not carried to full term before progesterone impregnated sponges treatment, at the mid-period of sponges treatment and at inseminations. But there is a significant differences in the progesterone concentrations between goats carried to full term and goats not carried to
Please purchase PDFcamp Printer on http://www.verypdf.com/ to remove this watermark.

84
full term seven days post insemination, fourteen days post insemination and at day twenty one post insemination. So blood samples taken at these days can play very important role in controlled breeding programs.
4. Litter size and sex of conceptus had no effect on progesterone profile during pregnancy.
5. Progesterone analysis after artificial insemination proved to be a useful tool for fertility
managements and efficient in early detection of pregnancy, early embryonic loses and abortion.
6. A sustained use of progesterone radioimmunoassay technique in conjunction with A.I.
programs is highly recommended to improve reproductive efficiency in goats.
7. More studies can be establish to know and eradicate causes of infertility in goats in Sudan. Chapter Five
References Abu, A.H., Iheukwumere, F. C. and Onyekwere, M. U. (2008). Effect of exogenous
progesterone on oestrus response on West African Dwarf ( WAD) goats. African Journal of
Biotechnology Vol. 7(1), pp. 059-062.
Please purchase PDFcamp Printer on http://www.verypdf.com/ to remove this watermark.
85
Adams, G. P. (1999). Comparative patterns of follicle development and selection in ruminant.
Reprod. Fertil. Suppl.54: 17-32.
Ahmed, M. M. M., Makawi, S. E and Jubara, A. S. (1998). Synchronization of Oestrus in Nubian
Goats. Small Rumin. Res. 30: 113- 120.
Akusu, M.O and Egbunike, G.N. (1990). Effect on oestrous duration of
west African Dwarf goats. Small Ruminant Research., 3 (4) : 413-418.
Ali, M. H. E. (2004). Reproductive performance of Desert goats under semi-intensive system in the
Sudan. M.Sc. Thesis. University of Khartoum.
Al-Merestani, M. R., Zarkawi, M. and Wardeh, M. F. (2000). Control reproduction, pregnancy
diagnosis, and monitoring of progesterone secretion in Damascus goats. ACSAD/AS/P
241/2000 and Atomic Energy Commission of Syria AECS-A/FRSR 221/2000.
Al-Merestani, M. R., Zarkawi, M. and Wardeh, M. F. (2003). Improving the reproductive
efficancy, pregnancy diagnosis and monitoring the resumption of luteal activity in indigenous
Damascus goat. Reproductive Domestic Animals, 38:36-40.
Please purchase PDFcamp Printer on http://www.verypdf.com/ to remove this watermark.
86
Al-Sobaiyl, K. A. (2010). Effect of breeding season and pregnancy status on serum progesterone ,
Na, K, Cu and Fe of oestrus synchronized Aradi goat does. Saudi J. of Bio. Sci. 17(3). J, 259-
263.
Amarantidis, I., Karagiannidis, A., Saratsis, Ph. And Brikas, P. (2004). Efficiency of methods
used for estrous synchronization in indigenous Greek goats. Small Rumin. Res, 52:247-252.
Amoah, E. A and S. Gelaye (1990). Reproductive performance of female goats in South Pacific
countries. Small Rumin. Res, 3:257-267.
Amoah, E. A and S. Gelaye (1992). Control of reproduction in goat. Goat Production Symp. P. 51.
Fort Valley, GA.
Amoah, E. A., Gelaye, S. Guthrie, P. and Rexroad, C. E. (1996). Breeding season and aspects of
reproduction of female goat. Journal of Animal Science, 7:723-728.
Arnstadt, K. I. and Cleere, W. F (1981). Enzyme –immunoassay for determination of
progesterone in milk from cows. J. Reprod. Fert. 62: 173-180.
Arnstadt, K. I., Grunert, E., Prokopp, S. and Schulte, B (1982). Weiterentwicklung des Enzym-
Immuntests (EIA) fur progesterone und Anwendung auf Blut, Milch- und Speichelproben vom
Please purchase PDFcamp Printer on http://www.verypdf.com/ to remove this watermark.

87
Rind (Improvement of an enzyme immunoassay ( EIA) for progesterone and its application to
blood, milk and saliva samples from cows). Zbl. Vet. Med. A 29: 387- 394.
Babiker, E. A., SH-E. A. Makawi and Sumia, H. Hussein (2010). Fertility response of Nubian
goats after oestrous synchronization with progesterone, PGF2a� and ECG. Assiu Vet, Med. J.
Vol. 56 No. 125 April 2010.
Baril, G., Leboeuf, B and Sumande. J. (1993). Synchronization of Oestrus in Goats: The
relationship between time of occurrence of estrus and fertility following artificial insemination.
Theriogenology. 40: 621-628.
Baril, G. (1995). Proceedings of XI Congresco Brasileiro de repoduccao Animal, Belo Horizonte,
pp. 110-20.
Battye, K. M., Fairclough, R. J., Cameron, A. W. and, Trounson, A. O. (1988). Evidence for
prostaglandin involvement in early luteal regression of the superovulated nanny goat (Capra
hircus). J Reprod Fertil, 84, 425-430.
Benitez-Ortiz, W. ( 1992). Diagnostic de gestation et etude de la mortalite embryonnarie Chez les
rumminants par dosage de la prganancy associated glycoprotein (PAG). Ph.D. Thesis, Institute
de Medicine Tropicale Prince Leopold, Antwerp, Belgium.
Please purchase PDFcamp Printer on http://www.verypdf.com/ to remove this watermark.

88
Bisson, B. (1992). Diagnostic de gestation chez la vache per dosage d une proteine tropoh-Plastique
associee a la gestation (PAG): Bovine pregnancy associated glycopr-Otein, Ph.D. Thesis, Ecole
Nationale Veterinaire de Nantes, France.
Bitaraf, A., Zammiri, M. J., Kafi, M. and Izadifard, J. (2007). Efficiency of CIDR, flurogestone
acetate sponges and cloprostenol for oestrus synchronization of Nadooshani goat during the
breeding season. Iranian Journal of Veterinary Research, University of Shiraz, 8(3):218-224.
Blood, D. C., Studdert, V. P and Gay, C. C. (2007). Saunders Comprehensive Veterinary
Dictionary (3rd edition), Elsevier.
Bono, G., Cairoli. F., Tamanini, C and Abrate. L. (1983). Progesterone, Estrogen, LH, FSH and
PRL concentration in plasma during the oestrus cycle in the goat. Reprod. Nutr. Dev., 23:217-
222.
Booth, J. M. (1988). Vet. Rec. 123, 437.
Boscos, C. M., Samartiz, F. C., Lymberopoulos, A. G., Stefanakis, A. and Belibasaki, S. (2003).
Assessment of progesterone concentration using ELISA, for early pregnancy diagnosis in
sheep and goats. Repro. Domes. Anim., 38(3): 170-174
Please purchase PDFcamp Printer on http://www.verypdf.com/ to remove this watermark.

89
Bosu, W. T. K., Serna, J. and Barker, C. A. V. (1978). Peripheral plasma levels of progesterone in
goats treated with flurogestone acetate and prostaglandin F2a� during the oestrus cycle .
Theriogenology. 9: 371-390.
Braun, W. F., Solorzano, N. M and Bierschwal, C. J (1988). Characterization of carpine estrous
cycle using enzyme immunoassay for the determination of whole blood progesterone
concentration. Theriogenology, 29:1155-1162.
Bretzlaff, K. N and Marid, N. (1989). Clinical use of norgestomet-ear implant or intra-vaginal or
pessaries for synchronization of oestrus in unoestrus dairy goats. Theriogenology, 31: 419-423.
Bretzlaff, K. ( 1995). Goat breeding and infertility in Meredith, M. J (ed). Animal breeding and
infertility. Blackwel Science Ltd. London.
Bretzlaff, K. (1997). Control of the oestrus cycle. In: R. S. Yougnquist, Current Therapy in large
animals Theriogenology. (ed) W.P. Saunder Company, Philadeliphia. Pp.510-514.
Calisti, V. (1943). Il corpo luteo in rapporto alla gravindaza nello pecore. nuova Vet. 21, 63-70.
Camp, J. C., Wildt, D. E., Howard, P. K., Stuart, L. and Chakraborty, P. K ( 1980). Behavioral,
endocrine and ovarian relationships during the oestrus cycle of the Nubian goat. Proc. 3rd Int.
Conf. on Goat Production and Disease. Tucson, Arizona, 310 pp.
Please purchase PDFcamp Printer on http://www.verypdf.com/ to remove this watermark.

90
Carlson, K. M., Pohl, H. A, Mercek, J. M., Muser, R. K., Wheaton, J. E. (1989). Evaluation of
progesterone controlled internal drug release dispensers for synchronization of oestrus in
sheep. Anim. Reprod. Sci . 18:205-218.
Chauhan, F. S., Sandabe, U. K and Oyedipe, E. O (1991). Predicting number of fetus(es) in small
ruminants. Ind. Vet. J. 68: 751-754.
Chao, Lu Meng., Takayama, K., Nakanishi, Y., Hamana, K., Takagi, M., Kubota, C. and
kojima, T. (2008). Luteal lifespan and fertility after oestrus synchronization in goats. J.Vet.
Sci. 9(1): 95-101.
Chemineau, P., Gauthier, D., Poirir, J. C. and Saumande, J (1982). Plasma levels of LH, FSH,
prolactin, oestradiol-17 � and progesterone during natural and induced oestrus in the dairy
goats. Theriogenology, 17: 313 -323
Chemineau, P., G. Baril., B. Leboeuf., M. C. Maurel ., Roy, F., Pellice-Rbio, M., Malpaux, B
and Y. Cognie (1999). Implications of recent advances in reproductive physiology for
reproductive management of goats. Reprod. Fertil. Suppl, 54: 129-142.
Corteel, J. M., Gonzales, C. and Nunnes, J. F. (1982). Research and Prod Dis, Tucson Arizona.
584-601.
Please purchase PDFcamp Printer on http://www.verypdf.com/ to remove this watermark.
91
Currie, W. B., Kelly, P. A., Friesen, H. G., and Thorburn, G. D. (1977). Caprine placental
lactogen : Growth Hormone-like activities in the circulation of pregnant goats determined by
Radio Receptors Assays. J. of Endocr 73, 215-226.
Currie, W. B., Card, C. E., Michel, F. J. and Ignotz, J. (1990). J. Reprod. Fertil. 90, 25-36.
Darwash, A. O., G. E. Lamming and M. D. Royal (2001). A protocol for initiating oestrus and
ovulation early post partum in dairy cows, J. Anim. Sci. 72:539-546.
Delgadillo, J. A.,M. T. Hochereau- De-Riviers., A. Daveau and P. Chemineau (1995). Effect of
short photoperiodic cycles on male genital tract and testicular parameters in male goats (Capra
hircus). Reprod. Nutr. Dev. 35: 549.
Devendra, C. and Mcleory, G. B. (1982). Goat and sheep production in the tropics. Longman
Singapore Publishers London, UK, pp. 26, 37-45.
Dhara, K. C., Ray, N., Samanta, A. K. and Senapati, P. K. (2008).**8
Dogan, Z., Nur, U., Gunay, H., Sagirkay, M. K., Soylu, C and Sonmez, C (2005). Oestrus
synchronization during the natural breeding season in Anatolian Black Does. Vet. Med-Czeh,
50 (1) :33-38
Please purchase PDFcamp Printer on http://www.verypdf.com/ to remove this watermark.

92
Eckersall, P.D. and Harvey, M. J. A (1987). The use of bovine plasma progesterone ELISA kit to
measure progesterone in equine, ovine and canine plasmas. Vet. Rec., 120: 5-8.
Ectors, F. J., Schmidt, M.,Sulon, J., Deval, A., Remy, B., Avery, B and Beckes, J. F. (1996) .
PAG profiles in recipient heifers after IVF and nuclear transfer embryos. Theriogenology,
45.283.
Ethling, C., Wirth, P., Schindler, L., Hadler, K. G., Dopke, H. H., Iemm, E., Hrrmann, D. and
Niemann, H. (2003). Lacrascopical intrauterine insemination with different doses of fresh,
conserved and frozen semen for the production of ovine zygote. Theriogenology, 60:777-787.
Elmansoury, Y. H. A. (2008). Effect of feeding different levels of protein in the reproductive and
productive performance of Nubian goats in Sudan. Phd. Thesis. University of Khartoum.
Elmubark, A. A. (2001). Fertility rate after oestrous synchronization and artificial insemination in
Desert sheep under extensive system in the Sudan. M.V.Sc. Thesis, University of Khartoum.
Elmoubark, A. A. (2010). The effect of improved feeding and hormonal treatments on reproductive
performance of Desert goats in the Sudan. PHD. Thesis. University of Khartoum.
El Naim, Y. A. (1979). Some reproductive traits of Sudanese Nubian goats. M. V. Sc. Thesis.
University of Khartoum. Sudan.
Please purchase PDFcamp Printer on http://www.verypdf.com/ to remove this watermark.
93
Eppleston, J., Evan, G. and Roberts, E. M. (1991). Effect of time of PMSG and GnRH injection
on the time of ovulation, LH secretion and reproductive performance after intrauterine
insemination with frozen ram semen. Anim. Repro. Sci. 26: 3-4.
Evans, G. and Maxwell, W. M. C. (1987). Salamon’s Artificial Insemination of sheep and goats.
Butterworths, Sydney.
Ezzo, O. H. and Shalapy, S. I. A. (1990). Peripheral concentration of progesterone and cortisol in
plasma of Bakri ewes and Baladi goats during pregnancy and postpartum period. Egyptian. J.
Vet. Sci., 27: 47-56.
FAO (1990). Training Manual of A.I in Sheep and Goats.
FAO/IAEA (1999). Radioimmunoassay Procedure Protocol. Version 3.1 Joint Programme Animal
Production and Health, Agriculture and Biotechnology Laboratory, Seibersdroof-Austeria.
Fleming, S. A., Camp, S. D., Van, and Chapin, H. M. (1990). Serum progesterone determination
as an aid for pregnancy diagnosis. Cana. Vet. J. 13(2):104-107.
Fonseca, J. F., Bruschi, J. H., I. C. C., Vianna, J. H. M. and Magalhes, A. C. M. (2005).
Induction of estrus in non-lactating dairy goats with different estrous synchrony protocols.
Animal reproduction Science, 85: 117-124.
Please purchase PDFcamp Printer on http://www.verypdf.com/ to remove this watermark.

94
Foulkes J A.(1986) Improving oestrus detection through milk progesterone testing . State Vet J 40:
31-39.
Foulkes J A and Goody R G. (1988) Fertility of Friesian cows after insemination on the second,
third and fourth days of low milk progesterone concentration. Vet Rec 122:
Freitas, V. J. F., G. Baril., M. Bosc and Saumande, J (1996a). The influence of ovarian status on
response to oestrus synchronization treatment in dairy goats during the breeding season.
Theriogenolgy, 45: 1561-1567.
Freitas, V. J. F., G. Baril., M. Bosc and Saumande, J (1996b). Induction and
synchronization of oestrus in goats: the relative efficiency of one versus two flurogestone
acetate- impergenated vaginal sponges. Theriogenolgy, 46:1251-1256.
Freitas, V. J. F., G. Baril., M. Bosc and Saumande, J (1997). Oestrus synchronization in dairy
goat: use of flurogestone-acetate vaginal sponges or norgestomet ear implants. Animal
Reproduction Science, 46: 237-244.
Freitas, V. J. F., Rodina, D., Teixeria, D. l., Lopes Jr E. S . R and Paula, N. R. O. (2004).
Hormonal treatment for the synchronization of oestrus in dairy goats raised in the tropics,
Reproduction and Fertility. Dev, 16(4): 415-420.
Please purchase PDFcamp Printer on http://www.verypdf.com/ to remove this watermark.

95
Garica, M and Edqvist, L. E. (1990).Theriogenology. 33, 1091.
Gonzalez, F., Sulon, J., Garbayo, J. M., Batista, M., Cabrera, F., Calero, P., Gracia, A. and
Beckers, J.F. (1999). Early pregnancy diagnosis in goat by determination of pregnancy-
associated glycoprotein concentrations in plasma samples. Theriogenology, 522(4): 717-725.
Gonzelez, F., Cabrera, F., Batista, M., Rodriguez, N., Alamo, D., Sulon, J., Beckers, J.F and
Gravcia, A. (2004). A comparison of diagnosis of pregnancy in the goat via transrectal-
ultrasound scanning, progesterone & pregnancy associated glycoprotein assay.
Theriogenology, 15: 62-68.
Gordon, I. (1997). Controlled reproduction in sheep and goats. CAB International, UK.
Greyling, J. P. C and C. H. Niekerk (1990). Ovulation in Boer goat doe. Small Ruminant
Research, 3: 457-464.
Greyling, J. P. C and M. van der Nest (2000). Synchronization of oestrus in goats: dose effect of
progestagen. Small Ruminant Research. 36(2): 201-207.
Guillbault, L. A., Beckes, J. F., Lapierre, S., Zoli, A. P., Benitez-Ortiz, W and Roy, G. L
(1991). Peripartum concentration of placental proteins hormones ( bPL and Bpag) in Holstein
Please purchase PDFcamp Printer on http://www.verypdf.com/ to remove this watermark.

96
and Hereford recipients carrying purebred Holstein fetuses, Theriogenology,35 (suppl l),
208(Abstract ).
Hafez E. S. E (1993). Reproduction in farm Animals. 6th Edition.
Hafez, E. S. and Hafez, B. (2000). Reproduction in farm animals. (7th ed.). Lippincott Wiliams and
Wilkins. Awolters Kluwer Company – Philadelphia. Baltimore, New York, London, Buennos
Aires, Hong Kong, Sydney, Tokyo.
Hamra, A.H., McNally, J. M., Carlson, K. M., Pohl, H. A, Mercek, J. M., Muser, R. K and
Wheaton, J. E.(1989). Comparison of progesterone sponges and controlled internal drug
release dispensers on fertility in anestrous sheep. Anim. Reprod. Sci. 18: 219-226.
Hans Mayer (2004). Effects of seasonality on the reproductively of Pastoral goat herds. edoc-hu-
berlin-de/dissertationen/hary-ingo/ hary.pdf.
Harison. R. J (1948). The change occurring in the ovary of the goat during the oestrus cycle and in
early pregnancy. J. Anat. 82: 21-48.
Haugher, R. L., Karsch, F. J. and Foster, D. L (1977). A new concept for the Control of the estrus
cycle of the ewe based on the relationships between the LH, estradiol-17 � and progesterone
Please purchase PDFcamp Printer on http://www.verypdf.com/ to remove this watermark.

97
in the peripheral serum and evidence that progesterone inhibits tonic LH secretion.
Endocrinology, 101: 807-817.
Hayden, T. J., Thomas, C. R., Smith, S. V and Forsyth, A. A (1980). Placental Lactogen in the
goat in relation to stage of gestation, number of fetuses, metabolites, progesterone and time of
the day. J. Endocrin. 86: 279-290.
Heap, R. B and Linzell, J. L. ( 1966). Arterial concentration / ovarian secretion and mammary up
take of progesterone in goats during the reproductive cycle .J. Endocr. 52: 23-36.
Heap, R. B. and Holdworth, R. J. (1981). Modern diagnostic methods in practice. Hormone
methods in reproduction and fertility, Brit. Vet. J., 137:561-571.
Hendrson, D. C., Downing, J. M., Beck, N. F. G., Lees, J. L (1984). Estrous synchronization in
ewes: a comparison of prostaglandin F2a� with a progestagen pessary. Anim Prod. 39: 229-
233.
Holdworth, R. J & Davies, J. L. (1979). Measurement of progesterone in goats milk for early
pregnancy test. Vet, Rec. 105, 535.
Please purchase PDFcamp Printer on http://www.verypdf.com/ to remove this watermark.

98
Hooper, S. B., Watkins, W. B. and Thorburn, G. D.(1986). Oxytocin, oxytocin-associated
neurophysin, and prostaglandin F2a� concentrations in the utero-ovarian vein of pregnant and
non pregnant sheep. Endocrinology 1986, 119, 2590-2597
Humbolt, P., De Montigny, G., Jeanguyot, N., Tetedoie, F., Payen, B., Thibier, M. and Sasser,
R. G. (1990). Pregnancy-specific protein B and progesterone concentrations in French alpine
goats throughout gestation. J. Reprod. Fert. 89: 205-212.
Hunter, m. G., R. S. Robinson., G. E. Mann and R. Webb (2004). Endocrine and paracrine
control of follicular development and ovulation rate in farm species. Anim. Reprod. Sci.82-83/
461-477.
IAEA, International Atomic Energy Agency, (1984). Laboratory training manual on
radioimmunoassay in animal reproduction. Technical report series No. 233, Vienna, Austria.
Imasuen, J. A. and Ikhiimioya, I. (2009). An assessment of the reproductive performance of estrus
synchronized West African Dwarf (WAD) does using medroxyl-progesterone acetate (MAP).
African Journal of Biotechnology, 8(1): 103-106.
Irving, G., Jones, D.E and Kinfont, A (1972). Progesterone concentration in the peripheral plasma
of pregnant goats. J. Endocrin. 53: 447-452.
Please purchase PDFcamp Printer on http://www.verypdf.com/ to remove this watermark.
99
Ishwar, A .K. (1995). Pregnany diagnosis in sheep and goats. Small Rumin. Res. 17: 37-44.
Jarrel, V. L. and Dziuk, P. J. (1991). Effect of number of corpora lutea and fetuses on
concentration of progesterone in blood of goats. J. Anim. Sci. 669: 770-773.
Joe Bearden, H., John and W. Fuquay (2000). Applied Animal Reproduction.5th edition.
Jones, D.E and Knifton, A. (1977). Progesterone concentration in the peripheral plasma in goats
during the estrus cycle. Res. Vet. Sci., 13: 193- 195.
Johnson, S. K., Dailey, R. A., Inskeep, E. K and Lewis, P.E. (1996). Effect of peripheral
concentrations of progesterone on follicular growth and fertility in ewes. Domest Anim
Endocrinol 13, 69-79.
Jubara, A. S. (1996). Conception rates following oestrus synchronization and artificial insemination
in the Nubian goats. M.Sc, thesis. University of Khartoum.
Kadzere, C. T., C. A. Llewelyn and E. Chivandi (1997). Plasma progesterone, calcium,
magnesium and zinc concentrations from ostrous synchronization to weaning in indigenous
goats in Zimbabwe. Small Rumin. Res., 24:21-26.
Kakusya, G. R. E. (1980). Reproductive Hormone Patterns in female Pygmy Goats. J. Reprod.
Fert., 39:464- 473.
Please purchase PDFcamp Printer on http://www.verypdf.com/ to remove this watermark.
100
Kausar. R., Khanum, S. A., M. Hussain and Shah, M. S. (2009). Oestrus synchronization with
medroxyprogesterone acetate impregnated sponges in goats (Capra Hircus). Pakistan Vet. J.,
29(1): 16- 18.
Khadiga, M. G., K. G. Mohamed and F. T. Doaa (2005). The hormonal profile during the estrous
cycle and gestation in Damascus goats. Small Rumin. Res.,57: 85-93.
Khanum, S. A., M. Hussain and R. Kausar (2008). Progesterone and oestradiol profile during
oestrous cycle and gestation in Dwarf goats (Capra Hircus). Pakistan Vet. J., 28(1): 1-4
Khanum, S. A., M. Hussain and R. Kausar (2008). Assessment of reproductive parameters in
female Dwarf goat (Capra Hircus) on the basis of progesterone profiles. Animal Reproduction
Science, 102(3-4):267-275.
Kanuya, N. L., B. M. Kessy, R. Nkya and P. F. Mujuni (2000). Plasma progesterone
concentrations and fertility of indigenous small East African goats bred after treatment with
cloprostenol. Small Rumin. Res., 35: 157–161.
Karatzas, G., Karagiannidis, A., Varsakelis, S and Brikas, P. (1997). Ovulation Rate, Zygote
Recovery and Follicular Population in FSH-super ovulated Goats Treated with PGF2a� and\ or
GnRH. Theriogenology, 41:491-498.
Please purchase PDFcamp Printer on http://www.verypdf.com/ to remove this watermark.
101
Karikari, P. K., Blasu, E. Y. And Osafa, E, L, K, (2009). Reproductive respones of West African
Dwarf Does to prostaglandin adminstration. J. World appl. Sci. 6(4): 542-545.
Karg, H., Claus, R., Hoffmann, B., Schallenberg, E and Schams, D. (1976). In: Nuclear
Techniques in Animal Production and Health, p. 487, IAEA, Vienna.
Kinne, M. (2006). Pregnancy diagnosis techniques: http// Kinne. net/pregdig. htm.
Kramer, D. C. (1989). Embryo Collection and Transfer in small ruminants. Theriogenology. 31:
141-148.
Krisher, R. L., Gwazdauskas, F. C., Page. R. L., Rusell, C. G., Canseco, R.S., Sparks, A. E. T.,
Velander, W H., Jonhon, J., Mahmood, S., Kcul, G.L and Biswas, J. C. (1991). Efficacy of
FSH-P and PMSG on Super ovulation in Pashmina goats. Theriogenology. 35 : 1191-11960.
Krisher, R.L.; Gwazdauskas, F.C.; Page, R.L.; Russel, C.G.; Canseco, R.S.; Sparks, A.E.T.;
Velander, W.H.; Johnson, J.L. and Pearson, R.E. (1993). Ovulation rate, zygote recovery
and follicular populations in FSH-super ovulated goats treated with PGF2a� and/or GnRH.
Theriogenology., 41: 491-498.
Kudouda, M.M. (1985). Growth reproductive and productive performance of Sudanese Nubian
goats. M.V.Sc.Thesis, U.of K.
Please purchase PDFcamp Printer on http://www.verypdf.com/ to remove this watermark.

102
Kusina, N. T., F. Tarwire., H. Hamudikuwaanda., G. Agumba and J. Mukkwena (2000). A
comparison of the effects of progesterone sponges and ear implants, PGF2a� , and their
combination on efficacy of estrus synchronization and fertility of Mashona Goats Does.
Theriogenology, 53: 1567-1580.
K?�ster, J., Lorest, J., Landmann,D. and Holz, W (1987). Milchprogesteron-bestimmung mit dem
enzymimmunoassay auf Miktotiterplatten verc-hiedener Hersteller ( Comperation of four
microtiter- plate enzyme immunoassays for milk determination in cows). Zuchthygiene.,
22:247-252
Laing, J. A. and Heap, R. B. ( 1971).The concentration of progesterone in the milk of cows During
reproductive cycle. Br. Vet. J., 127: xix- xxii.
Lassala, A., Hernandez-Ceron, J., Rodriguez- Maltos, R. and Gutierrez, C. G. (2004). The
influence of the corpus luteum on ovarian follicular dynamics during oestrus synchronization
in goats. Anim. Reprod. Sci. 84: 369-375.
Laura, A. S., M. S. Kumar, G. William and L. A. Sandra (2004). Predicting the onset of
parturition in the goat by determining progesterone levels by enzyme immunoassay. Small
Rumin. Res., 52: 203-209.
Please purchase PDFcamp Printer on http://www.verypdf.com/ to remove this watermark.
103
Leboeuf B., Renuad G ., De Fontaubert Y., Brogua B., Chemineau P (1994).Echographie et
pseudogestation chez la chevre. 7th Inter. Meeting on Animal Reprod. Pp 251-255
Leboeuf, B., E. Manfredi., P. Boue., A. Piacere., G. Brice., G. Baril., C. Borqua., P. Humbolt
and M. Terqui (1997). Artificial insemination of dairy goats in France.. EAAP Sheep and
Goat production. Session. V. 48TH Annual Meeting of European Association for Animal
production. Vienna, Austria.
Leboeuf, B., E. Manfredi., P. Boue., A. Piacere., G. Brice., G. Baril., C. Borqua., P. Humbolt
and M. Terqui (1998). Artificial insemination of dairy goats in France. Livestock Production
Science, 55: 193-203.
Leboeuf, B., Restall, B. and Salamon, S. (2000). Production and storage of goat semen for artificial
insemination. Animal Reproduction Science. 62(1-3):113-141.
Leboeuf, B., Forgergerit. Y., Pougnard, J. L., Senty. E., Bernelas, D and Driancourt, M. A.
(2003). Efficacy of two types of vaginal sponges to control onset of oestrus, time of
preovulatory LH peak and kidding rate in goats inseminated with variable numbers of
spermatozoa. Theriogenology. 60: 1371-1378.
Please purchase PDFcamp Printer on http://www.verypdf.com/ to remove this watermark.

104
Lehloenya, K. C., Grelying, J. P. and Schwalbach, L. M. J. (2005). Reproductive performance of
South African indigenous goats following oestrous synchronization and AI. Small Ruminant
Research, 57(2-3):115-120.
Leyva-Ocariz, C., Munro, G and H. Stabenfeldt ( 1995). Serum LH, FSH, estradiol-17� and
progesterone profiles of native and crossbred goats in a tropical semiarid zone of Venezuela
during the estrous cycle. Animal Reproduction Science, 39: 49-58.
Linzell, J. L and Heap, R. B. (1968). A comparision of progesterone metabolism in the pregnant
sheep and goat: soures of production and estimation of up take by some target organs. J. Endo.
41:433-438.
Lionel, J. D. (1990). Pregnancy diagnosis in goats. www. /edu/veterinary/links. Xnl.
Llewelyn, C.A., Lukins, A. G., Munro, C. B. and Perrie, J. (1987). Plasma progesterone in
pregnant and non-pregnant goats in Br. Vet. J. 143: 423-431.
Llewelyn, C. A., Ogga, J. S and Obwolo, M. J. (1992). Plasma progesterone concentrations during
pregnancy and pseudopregnancy and onset of ovarian activity post- partum in indigonus goats
in Zimbabwe. Trop Anim Health Prod. Nov, 24 (4):242-250.
Please purchase PDFcamp Printer on http://www.verypdf.com/ to remove this watermark.

105
Llewelyn, C.A., Ogga, J. S and Obwolo, M. J. (1995). Influence of season and housing on ovarian
activity of Indigenous goat in Zimbabwe. Tropical Animal Health and Production. 27: 175-
185.
Lopes Jr E. S. Teixeria ,N. R. O.(2004). Hormonal treatment for the synchronization of oestrus in
dairy goats raised in the tropics, Reprod. Fertil. Dev. 16(4). 415-420.
Lopez, H., L. D. Satter and M. C. Wiltbank (2004). Relationship between level of milk production
and progesterone concentration. Anim. Reprod. Sci. 81: 209-223.
Lorest, J and Holtz, W (1984). Anwendung des Enzymimmunoassays (EIA) zur Feststellung des
Milchprogesterongehalts bei Stuten (Application of an enzyme immunoassay (EIA) for the
determination of milk prog-esterone in mares). Zuchthygiene., 19: 1-6.
Lorest, J and Holtz, W (1987). Nachgeburtliche Milchoprogesteronprofile Bei Stuten ( Post-partum
progesterone patterns in mares0. Zuchthygie-Ne., 22: 24 29
Lorest, J., Landmann, D., K?�ster, J and HolTz, W. (1986). Vergleich zweier
Enzymimmunoassays zur Progesteronebestimmung in Milch und Blut Serum von Pferd und
Rind und im blutserum vom Schewein ( Compa-Rison of tow enzymeimmunoassays for
Please purchase PDFcamp Printer on http://www.verypdf.com/ to remove this watermark.
106
measuring progesterone conc-Trations in milk and blood serum of horses and cows and in
blood ser-Um of swines). Zuchthygiene, 21: 241-246.
Lu Meng, C., Takayama, K., Nakanishi, Y., Hamana, K., Takag, M., Kubota, C and Kojima,
T. (2008). Luteal lifespan and fertility after oestrus synchoronization in goats. J. Vet. Sci. ,
9(1): 95-101.
Mahmood, S., Koul, G. L and Biswas, J. C. (1991). Comparatives efficacy of FSH and PMSG on
super ovulation in Pashmina goats. Theriogenology. 35: 1191-1196.
Manalu, W., M. Y. Sumaryadi and N. Kusumorini (1997). Effect of fetal number on circulating
maternal serum progesterone and estradiol of does during late pregnancy. Small Rum. Res. 23:
117-127.
Mary, C., Smith, D.V.M. (1987). Fertility of fresh and frozen-thawed goat semen during the non
breeding . Theriogenology. 48 : 1049-1059.
Mari, I. F., A. H. Daader., F. A. Hassan and A. A. Abu-Ela (2000). 7th Int. conf. on goats.
France. 15-21.
Please purchase PDFcamp Printer on http://www.verypdf.com/ to remove this watermark.
107
Martienz, R. R. D., Mastache, L. A. A., Santamaria, L. R. and Mendez, J. V. (2005).
Reproductive performance in three goat breeds under dry tropic condition in Guerrero, Mexico.
Veterinaria Mexico, 36(2): 147-157.
Mats Forsberg (2000). Collection and handling of milk and blood samples for progesterone
determination Notes for the IAEA Workshop (Production of standards and Internal Quality
Control – IQC- Material for Self Coating RIA of Progesterone). Mauritius.
M. A. W. F (2002). Minstry of Animal Wealth and Fisheries year book of statistics, Khartoum,
Sudan.
M. A. W. F. (2005). Ministry of Animal wealth and Fishers, year book of statistics, Khartoum,
Sudan.
M. A. W. F. (2009). Ministry of Animal wealth and Fishers, year book of statistics, Khartoum,
Sudan.
McDougall, S., C. W. Compton, and F. M. Anniss (2004). Effect of exogenous progesterone and
oestradiol on plasma progesterone concentrations and follicle wave dynamics in an-ovulatory
an-oestrus post-partum dairy cattle. Anim. Reporod. Sic. 84: 303-314.
McNitt, J. I. (1983). Livestock, Husbandry Techniques. Granada.
Please purchase PDFcamp Printer on http://www.verypdf.com/ to remove this watermark.

108
Mehmet, B. A. and Mehmet, A. (2006). GNRH-PGF2a� and PGF2a� synchronization in Akkaraman
cross-bred sheep in the breeding season. Bull. Vet. Inst. Pulawy 50:101-104.
Molowukuϭ E. C., Ogunbiyi, P. O and Sooriyamoorthy, T. (1980). Esterus Synchronization and
controlled breeding in goats using PGF2 Theriogenology. 3: 357- 361.
Motlomelo, K.C., J. P. C. Greyling and L. M. J. Schwallbach (2002).Synchronization of oestrus
in goats: the use effect of different progestagen treatments.45: July 45-49.
Muna, M. M., Makawi, , S. E. and Jubara, A. S. (1998). Synchronization of oestrus in Nubian
goats. Small Rum. Res. 30:113-120.
Muna, M. M. (2000). Macromineral profile in plasma of Nubian goats as affected by nutrition.
Small Ruminant Research 38:Nov,249-254.
Murry, R. D and Newstead, R. (1988). Determination of steroid hormone in goats milk and plasma
as an aid to pregnancy diagnosis using ELISA. Vet. Rec. 122: 158-161.
Musaddin, K., H. S. Tan, M. Y. M. Khushry and I. Jasm (1996). Resumption of postpartum
ovarian activity in Malin, Dorset Horn Malin and Long Tail ewes. Mardi Res. J., 24: 31–37.
Noakes, D. E., Parkinson, T. J., England, G. C. W. and Arthur, G. H (2001). Arthur'�s
Veterinary Reproduction and Obstetrics. 8th ed., Bailliere Tindal. London, 868pp.
Please purchase PDFcamp Printer on http://www.verypdf.com/ to remove this watermark.
109
Oltener, R and Edqvist, L.E ( 1982). Changes in plasma progesterone levels during storage of
heparinized whole blood from cow, horse, dog and pig. Acta vet. Scand. 23:1-8.
Ortega, P. A., Montes, P. R., Porres, A. J. F., Aguilar C. A and Avaios, B. E. (1999). Pregnangy
Diagnosis in Crillo goats ( Capra hircus) through blood levels of progesterone and real–time
ultrasonography. Rev. Biomed. 10(4): 229-234.
Ott, R. S., Nelson, D. R. and Hixon, J. E.( 1980). Fertility of goats following Synchronization of
estrus with prostaglandin F2a� . Theriogenology,13: 341-345.
Ozawa, M., D. Tabayashi, T. A. Latief., T. Shimizu, I. Oshima and Y. Kanai. (2005).
Alternations in follicular dynamics and steroidogenic abilities induced by heat stress during
follicular recruitment in goats. Reproduction . 129: 621-630.
Ozpinar, A. and A. Firat (2003).. Metabolic profile of pre-pregnancy, pregnancy and early
lactation in multiple lambing Sakiz ewes. Ann. Nutr. Metab., 47; 139-143.
Pant, H. C., Hopkinson, C. R. N. and Fitzpatricck, R. J. (1977). Concentration Of estradiol,
progesterone, LH and FSH in jugular venous plasma of ewes during the oestrus cycle. J.
Endocrinol., 73: 247-255.
Please purchase PDFcamp Printer on http://www.verypdf.com/ to remove this watermark.
110
Paula, N. R., Galeati, Teixeria, d. l., Lopes Jr E. S., Feritas , V. J. F., Rondina, D.(2005).
Responsiveness to progestagen-eCG-cloprostenol treatments in goats food restricted for long
period an refed. Reprod. Domest. Anim. 40(2): 108-110.
Paulenz, H., S?�derquist, L., Åelony, T., Soltun, K., Sother, P. A., FjellsØy, K. R. and Andersen
Berry, K. (2005). Efect of servical and vaginal insemination with liquid semen stored at room
temperature on fertility of goats. Animal Reproduction Science, 86: 109-117.
Perera, BMAO., Bongso, T. A and Abeynaike. P. (1987). Oestrus Synchronization in goats using
cloprostenol. Vet. Rec. 103: 301-314.Abstr.
Pirre Rioux and Denies Rajote ( 2004). Progesterone in milk: a simple experiment illustrating the
estrus cycle and enzyme immunoassay. Advan. Physiol. Edu. 28: 64-67.
Pope, G. S., Gupta, S. K. and Munro, I. B. (1969). J. Reprod. Fert.20, 369..
Ranillia, M. J., Sulon, J., Carro, M.D., Mantec?�n, A. and Beckers, J.F. (1994). Plasmatic
profiles of pregnancy- associated glycoprotein and progesterone levels during gestation in
churra and marino sheep. Theriogenology, 42: 537- 545.
Please purchase PDFcamp Printer on http://www.verypdf.com/ to remove this watermark.

111
Ranillia, M. J., Sulon, J., Mantec?�n, A. R., Beckers, J. F and Carro, M. D (1997). ). Plasma
pregnancy- associated glycoprotein and progesterone concentrations in pregnant Assaf ewes
carrying single and twin lamb. Small. Rumin. Res, 24:125-131.
Rao, V. H and Bhattacharyya, N. K (1980). Ovulation in Black Bengal Nany goats. J. Reprod.
Fertl., 58: 67-69
Refstal, K. R., Mateniuk, J. V., Williams, C. S. F. and Nachreiner, R. F. (1991). Concentration
of estrerone sulphate in serum, relationship with gestation length, fetal number and the
occurrence of fetal death in uterus Theriogenology., 36(3):449-461.
Riera, S (1982). Reproductive efficiency and management in goats. Proc. Int. Conf. Goat Prod. Dis.
Pp., 162-174.
Ritar , A. J., W. M. C. Maxwell and S. Salmon ( 1984). Ovulation and LH secretion in the goat
after intravaginal progestagen sponge-PMSG treatment. J. Reprod. Fert. 72: 559-563.
Ritar, A. j., S. Salmon., Ball. P. D and May, P. J. (1989). Ovulation and fertility in goats after
intravaginal device-PMSG treatment. Small Rumin. Res. 2:323-331.
Ritar, A.J. and Ball, P.D.O. (1991). Fertility of young Cashmere goats after laproscopic
insemination. J. Agric. Sci., 117: 217-273., Cambridge.
Please purchase PDFcamp Printer on http://www.verypdf.com/ to remove this watermark.

112
Robertson, H. A. and Sadra, I. R ( 1971). J. Endocrinol. 49, 407.
Romano, J.E ( 1996). Effect of service and oxytocin in oestrus duration in goats. Small Rumin.
Res., 23:213-216.
Romano, J. E and Benech, A ( 1996). Effect of service and vaginal- cervical anesthesia on oestrus
duration in dairy goats. Theriogenology, 45: 691-696.
Romano, J. E and Fernandz Abella, D ( 1997). Effect of service on duration of oestrus and
ovulation in dairy goats. Anim. Reprod. Sci., 47: 107-112.
Romano, J. E ( 1998a). The effect of continuous presence of bucks on hastening the onset of oestrus
in synchronized does during the breeding season. Small Rumin. Res., 30: 99-103
Romano, J. E ( 1998b). Effect of two doses of cloprostenol in two schemes for oestrus
synchronization in Nubian Does. Small Rumin. Res., 28: 171-176.
Romano, J. E., Crabo, B. G and Christian, C. J. (2000). Effect of sterile service on oestrus
duration, fertility and prolificacy in artificially inseminated dairy goats. Theriogenology, 5:
1345-1353.
Romano, J. E. ( 2002). Does in proestrus-estrus hasten estrus onset in does estrus synchronized
during the breeding season. App. Anim. Behav. Sci., 77: 329-344.
Please purchase PDFcamp Printer on http://www.verypdf.com/ to remove this watermark.

113
Romano, J. E. ( 2004). Synchronization of oestusr using CIDR, FAG or MAP intravginal pessaries
during the breeding season in Nubian goats. Small Rumin. Res., 55: 15-19.
Russel, A. (1984). Body condition scoring In: Practice, 6: 91-93.
Sahani. K. L and Roy. A(1967). A study on the sexual activity of the Barbari goats ( Capra hricus)
and conception rate through artificial insemination. Ind. J. Vet. Sci. 37:269-276.
Sahlu, T. and Goetsch, A. L. (2005). A Far sight on goat research. Small Rumin. Res. 60(1&2): 7-
12.
Salim, H. M., Shahjala, M., Tareque. A. M. M. and Kabir, F. (2002). Effects of concentrate
supplementation on growth and reproductive performance of female sheep and goat under
grazing condition. Pakistan J. of Nutr., 1(4): 191-193.
Salma. A (1972). Ovarian changes in goats during estrus. Ind. J. Anim. Sci. 42: 436-438.
Schneider, F. A. and Hallford, D. M (1996). Use of rapid progesterone radioimmunoassay to
predict pregnancy and fetal numbers in ewes . Sheep and goat Res. J. 12: 33-38.
Shahneh, Z., Sadedhipanah, A., Barfourooshi, H. J. and Emami-mibod, M. A. (2008). Effects of
equine chorionic gonadotropin (eCG) administration and flushing on reproductive performance
in Nadooshan goats of Iran. African Journal of Biotechnology, 7(18): 3373-3379.
Please purchase PDFcamp Printer on http://www.verypdf.com/ to remove this watermark.

114
Shalaby, A.S., S. M. Sharawy and N. H. Saleh ( 2000). Reproductive performance of Damascus
goats in semi-arid in Egypt .7th international conference on goats. France, 15-21 May 2ooo.
Shelton. M ( 1960a). The influence of the presence of a male goat in the initiation of estrus cycling
and ovulation in Angora does. J. Anim. Sci. 19: 368-375.
Shelton, M ( 1960b). A comparison of the ovulation rate at first three heat periods of Angora does .
J. Anim. Sci. (Abstr.). 19: 1227.
Shelton. M ( 1978). Reproduction and breeding of goats. J. Dairy Sci. 61: 994-1010.
Shemesh, M., Ayalon, N., and Linder, H. R. (1968). J. Reprod. Fert. 15, 161.
Selvaraju, M., Kathiresan, D. and Devanathan, T. G. (2007). Serum progesterone profile during
oestrus and early pregnancy in Malabari goats. Tamilnadu Journal of Veterinary and Animal
Science. 3(1): 47-48.
Smith, M.C. (1986). Synchronization of oestrus and the use of Prevention and Treatment of
Reproductive Diseases in Small and Large Animals. (2nd ed). Philadephia: WB Saunders,
582-583.
Sohnery, B. and Haltz, W. (2005). Transcervical deep cornual insemination of goats. Journal of
Animal reproduction Science, 83:1443-1548.
Please purchase PDFcamp Printer on http://www.verypdf.com/ to remove this watermark.
115
Song, H. B., Jo, I. H. and Sol, H. S. (2006). Reproductive performance of Korean native goats
under natural and intensive conditions. Small Ruminat Research, 65: 284-287.
Sousa, N. M., J. M. Garbayo., J. R. Figueiredo., J. Sulon., P. B. D. ongalves and J. F. Beckers
(1999). Pregnancy- associated glycoprotein and progesterone profiles during pregnancy and
postpartum in native goats from the north- east of Brazil. Small Rumin.Res.32: 137-147.
Sprecher, D. J., Strelow, L.W., and Nebel, R. L ( 1990). Theriogenology 34, 1149..
Sumia, H. Hussein (2002). Reproductive performance of Nubian and Cross-bred does following
oestrus synchronization and artificial insemination with fresh diluted and frozen semen.
M.V.Sc, University of Khartoum.
Thibier, M., Pothelet, D., Jeanguyot, N. and De Montigny, G. ( 1982). Estrus Behavior,
progesterone in the peripheral plasma and milk in dairy goats at onset of breeding season. J.
Dairy Sci., 64: 513-519.
Thorburn, G. D and Schneider, w. (1972). Progesterone concentration in the Peripheral plasma of
goats during the oestrus and pregnancy. J. End, Ocr. 52: 23- 36.
Vallet, J. C., Casamitmitjana, P., P. Brebion, Brebion, P. and Perrin, J. (1991). Rec. Med. Vet.,
Spec. Repro. Rum. 167: 293-301.
Please purchase PDFcamp Printer on http://www.verypdf.com/ to remove this watermark.

116
Vander Westhuysen, J. M., Wentzel, D and Grobler, M. C (1985). Angora goats and and
Mohair in South Africa. NKP printers, Port Elizabeth, South Africa, pp.45-85.
Vasconcelos, J. K. M., Sanqsitavong, S. T., sai, S, J. and Wiltbank MC. (2003). A cute reduction
in serum progesterone concentration after feed intake in dairy cows. Theriogenology. 60:795-
807.
Walkden- Brown, S. W. (2001). Reproduction in Goats. http://WWW.goaton line.
Walkden- Brown, S. W. and Bocquier, F.(2000). Nutritional regulation of reproduction in goats.
The 7th inter. Conf. on goats, France pp. 389-395.
Wani, G.M. (1981). Ultrasonic pregnancy diagnosis in sheep and goats. World Rev.
Anim. Prod., 17(4): 43-48
Webb, E. C. and Mamabolo, M. J. (2004). Production and reproduction characteristic of South
African indigenous goats in communal farming systems. South African Journal of Animal
Science, 34 (Supplement, 1): 236-239.
West, D. M (1986). Pregnancy diagnosis in the ewe. In: Morrow, D. A. (ED), Current Therapy in
Theriogenology. W. B. Saunders Company. Philadelphia, PA, pp. 850-852.
Please purchase PDFcamp Printer on http://www.verypdf.com/ to remove this watermark.

117
Whitley, N. D and D. J. Jackson (2004). An update on oestrus synchoronization in goats: A minor
species. J. Anim. Sci. 82(E. SUPPL.) : E 270- E276.
Wildeus, S. (1999). Current concept in synchronization oestrus: sheep and goat. Proc. Of Am. Soc.
Anim Sci.,
Available:http://www.asas.Org/JAS/symposia/proccedings/0016.pdf.
Williams, C. S. F (1986). Pregnancy diagnosis, caprine section. In: Morrow DA, ed. Current
Therapy in Theriogenology. 2nd ed. Philadelphiaa: WB Saunders, 587-588.
Williamson, G. and Payne, W.J.A. (1978). An introduction to animal husbandry in the tropics
(3rd). Longman London and NY, pp 150-151.
Wiltbank, M., H. Lopez., R. Sartori,, S. Sangsritavong and A. Gumen (2006). Changes of the
reproductive physiology of lactating dairy cows due to elevated steroid metabolism.
Theriogenology 65: 17-29.
Zaimfirescu, A. L and Sonea. H. (2000). In Vivo survival of embryo collected from sheep and goat
donors with varied rates of ovulation. 14th Int. Cong. of Anim. Reprod. Sweden, Autralia, pp.
16-18.
Please purchase PDFcamp Printer on http://www.verypdf.com/ to remove this watermark.
118
Zarkawi, M. and A. Soukouti (2001). Serum progesterone levels using radioimmunoassay during
oestrus cycle of indigenous Damascus does. New Zealand Journal of Agricultural Research,
44:165-169.
Zarkawi, M. and Al- Masri, M. R. (2002). Use of radioimmunoassay to measure progesterone
levels during different reproductive stages in female Damascus goat. Tropical Animal Health
and Production, 34:535-539.
Zoli, A. P., Beckers, J. F. and Ectors, F. ( 1995). Identification and characterization of a new
pregnancy- associated antigen of cattle and its application for pregnancy diagnosis. Proc. 1
Simo Nacional de Biotechnologia de Reproduuio de Mamiferos Domesticios, vol. 1, Fortaleza,
Brazil, pp. 64-76.
Zoli, A. P., Demez, P., Beckers, J .F and Reznik, M (1992). Light and electron microscopic
immunolocalization of bovine pregnancy- associated glycoprotein in the bovine placetome,
Biol. Reprod, 46: 623-629.
Please purchase PDFcamp Printer on http://www.verypdf.com/ to remove this watermark.
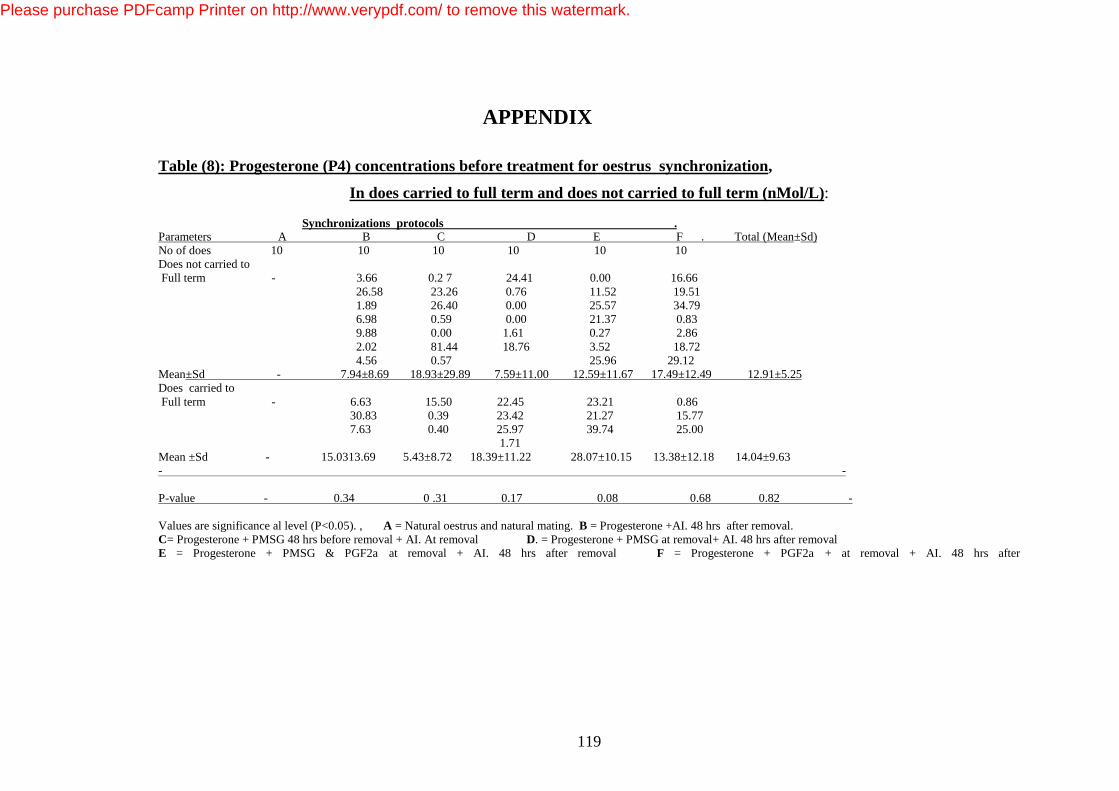
119
APPENDIX
Table (8): Progesterone (P4) concentrations before treatment for oestrus synchronization,
In does carried to full term and does not carried to full term (nMol/L):
Synchronizations protocols . Parameters A B C D E F . Total (Mean±Sd) No of does 10 10 10 10 10 10 Does not carried to Full term - 3.66 0.2 7 24.41 0.00 16.66 26.58 23.26 0.76 11.52 19.51 1.89 26.40 0.00 25.57 34.79 6.98 0.59 0.00 21.37 0.83 9.88 0.00 1.61 0.27 2.86 2.02 81.44 18.76 3.52 18.72 4.56 0.57 25.96 29.12 Mean±Sd - 7.94±8.69 18.93±29.89 7.59±11.00 12.59±11.67 17.49±12.49 12.91±5.25 Does carried to Full term - 6.63 15.50 22.45 23.21 0.86 30.83 0.39 23.42 21.27 15.77 7.63 0.40 25.97 39.74 25.00 1.71 Mean ±Sd - 15.0313.69 5.43±8.72 18.39±11.22 28.07±10.15 13.38±12.18 14.04±9.63 - - P-value - 0.34 0 .31 0.17 0.08 0.68 0.82 - Values are significance al level (P<0.05). , A = Natural oestrus and natural mating. B = Progesterone +AI. 48 hrs after removal. C= Progesterone + PMSG 48 hrs before removal + AI. At removal D. = Progesterone + PMSG at removal+ AI. 48 hrs after removal E = Progesterone + PMSG & PGF2a� at removal + AI. 48 hrs after removal F = Progesterone + PGF2a� + at removal + AI. 48 hrs after
Please purchase PDFcamp Printer on http://www.verypdf.com/ to remove this watermark.
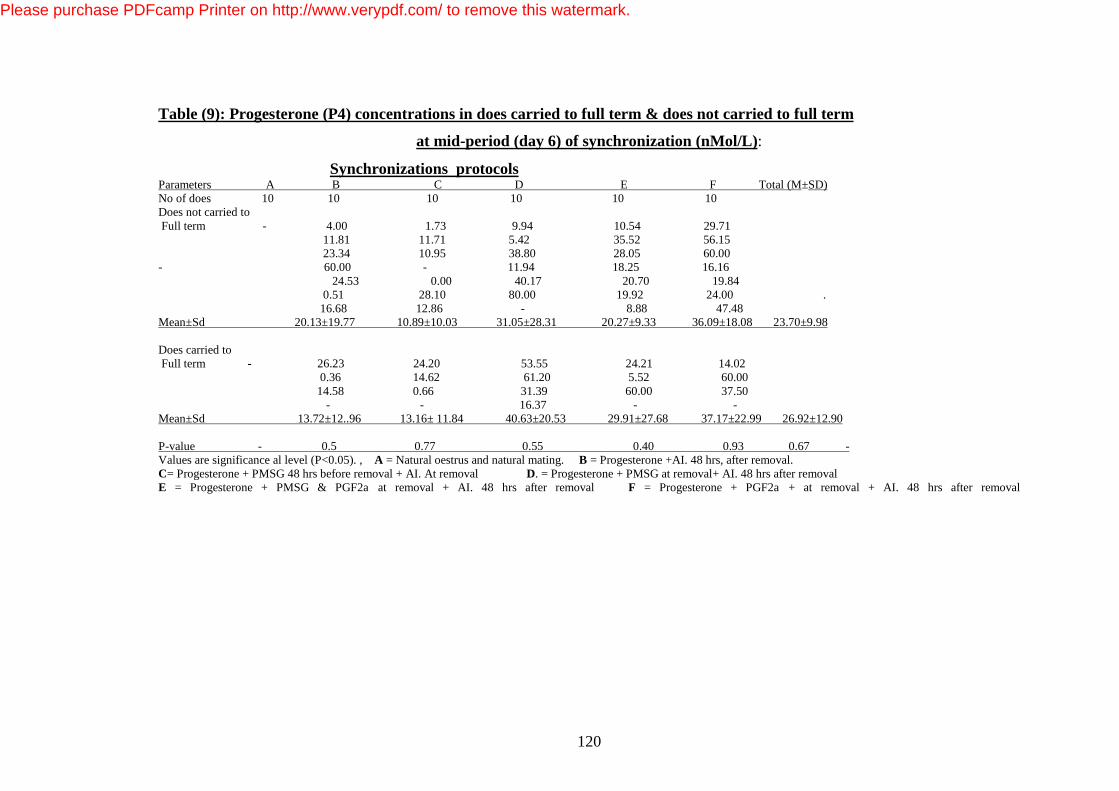
120
Table (9): Progesterone (P4) concentrations in does carried to full term & does not carried to full term
at mid-period (day 6) of synchronization (nMol/L):
Synchronizations protocols Parameters A B C D E F Total (M±SD) No of does 10 10 10 10 10 10 Does not carried to Full term - 4.00 1.73 9.94 10.54 29.71 11.81 11.71 5.42 35.52 56.15 23.34 10.95 38.80 28.05 60.00 - 60.00 - 11.94 18.25 16.16 24.53 0.00 40.17 20.70 19.84 0.51 28.10 80.00 19.92 24.00 . 16.68 12.86 - 8.88 47.48 Mean±Sd 20.13±19.77 10.89±10.03 31.05±28.31 20.27±9.33 36.09±18.08 23.70±9.98 Does carried to Full term - 26.23 24.20 53.55 24.21 14.02 0.36 14.62 61.20 5.52 60.00 14.58 0.66 31.39 60.00 37.50 - - 16.37 - - Mean±Sd 13.72±12..96 13.16± 11.84 40.63±20.53 29.91±27.68 37.17±22.99 26.92±12.90 P-value - 0.5 0.77 0.55 0.40 0.93 0.67 - Values are significance al level (P<0.05). , A = Natural oestrus and natural mating. B = Progesterone +AI. 48 hrs, after removal. C= Progesterone + PMSG 48 hrs before removal + AI. At removal D. = Progesterone + PMSG at removal+ AI. 48 hrs after removal E = Progesterone + PMSG & PGF2a� at removal + AI. 48 hrs after removal F = Progesterone + PGF2a� + at removal + AI. 48 hrs after removal
Please purchase PDFcamp Printer on http://www.verypdf.com/ to remove this watermark.
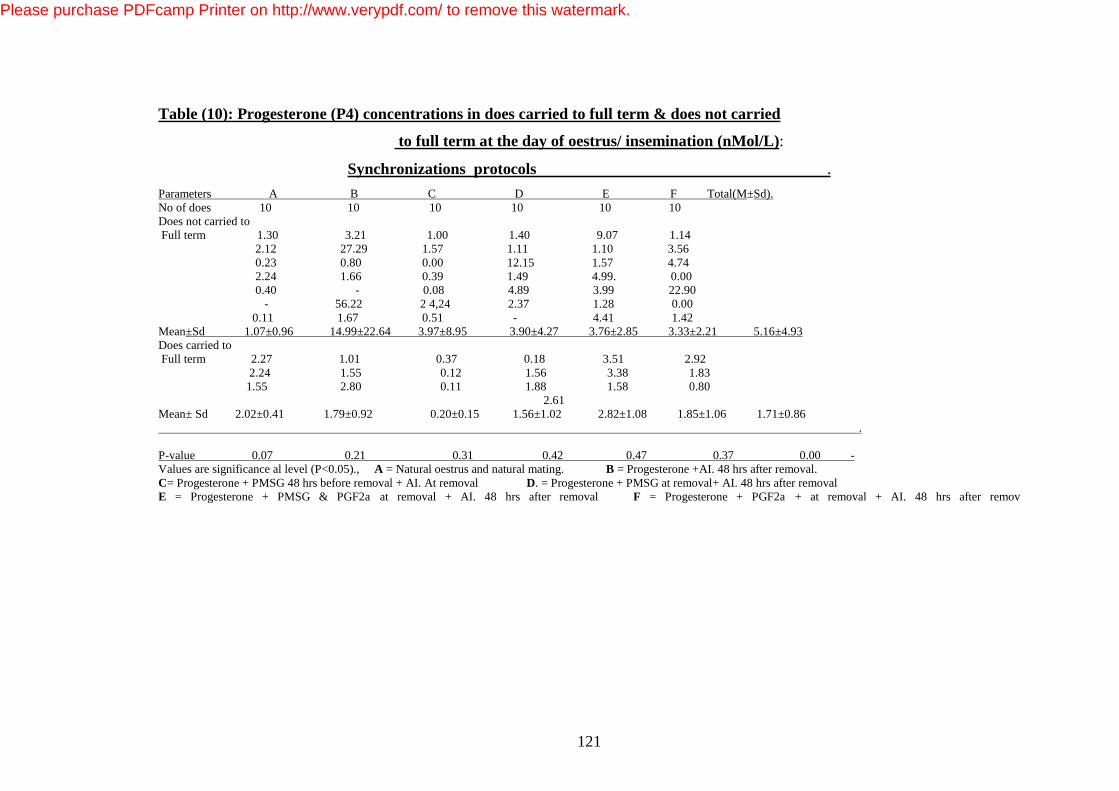
121
Table (10): Progesterone (P4) concentrations in does carried to full term & does not carried
to full term at the day of oestrus/ insemination (nMol/L):
Synchronizations protocols . Parameters A B C D E F Total(M±Sd). No of does 10 10 10 10 10 10 Does not carried to Full term 1.30 3.21 1.00 1.40 9.07 1.14 2.12 27.29 1.57 1.11 1.10 3.56 0.23 0.80 0.00 12.15 1.57 4.74 2.24 1.66 0.39 1.49 4.99. 0.00 0.40 - 0.08 4.89 3.99 22.90 - 56.22 2 4,24 2.37 1.28 0.00 0.11 1.67 0.51 - 4.41 1.42 Mean±Sd 1.07±0.96 14.99±22.64 3.97±8.95 3.90±4.27 3.76±2.85 3.33±2.21 5.16±4.93 Does carried to Full term 2.27 1.01 0.37 0.18 3.51 2.92 2.24 1.55 0.12 1.56 3.38 1.83 1.55 2.80 0.11 1.88 1.58 0.80 2.61 Mean± Sd 2.02±0.41 1.79±0.92 0.20±0.15 1.56±1.02 2.82±1.08 1.85±1.06 1.71±0.86 . P-value 0.07 0.21 0.31 0.42 0.47 0.37 0.00 - Values are significance al level (P<0.05)., A = Natural oestrus and natural mating. B = Progesterone +AI. 48 hrs after removal. C= Progesterone + PMSG 48 hrs before removal + AI. At removal D. = Progesterone + PMSG at removal+ AI. 48 hrs after removal E = Progesterone + PMSG & PGF2a� at removal + AI. 48 hrs after removal F = Progesterone + PGF2a� + at removal + AI. 48 hrs after remov
Please purchase PDFcamp Printer on http://www.verypdf.com/ to remove this watermark.

122
Table (11): Progesterone (P4) concentrations on day 7 post-insemination in does carried to full term and does not carried to full term (nMol/L):
Synchronizations protocols .
Parameters A B C D E F Total(M±SD). No of does 10 10 10 10 10 10 Does not carried to Full term 0.00 6.80 2.51 28.17 60.00 1.15 23.00 - 41.28 - 8.85 4.74 0.00 0.00 1.69 3.00 5.55 0.00 5.38 15.80 60.00 15.81 22.03 22.90 1.52 0.91 33.93 4.61 23.99 0.00 1.06 1.72 4.92 7.94 7.51 3.56 18.11 1.20 12.18 9.69 1.42 Mean±Sd 7.01±0.53 4.40±6.08 22.36±22.86 11.91±10.34 19.66±19.21 4.82±8.16 11.56±7.89 . . Does carried to Full term 25.64 27.99 58.54 54.09 45.38 33.25 31.57 22.20 17.08 80.00 14.08 42.72 19.35 23.75 23.71 30.06 24.69 50.00 33.61 Mean± Sd 25.52±6.11 24.65±3.00 33.11±22.27 49.44±22.96 28.05±15.92 41.98±8.41 33.81±9.97 . P-value 0.01 0.00 0.51 0.01 0.50 0.00 0.00 Values are significance al level (P<0.05). A = Natural oestrus and natural mating. B = Progesterone +AI. 48 hrs after removal. C= Progesterone + PMSG 48 hrs before removal + AI. At removal D. = Progesterone + PMSG at removal+ AI. 48 hrs after removal E = Progesterone + PMSG & PGF2a� at removal + AI. 48 hrs after removal F = Progesterone + PGF2a� + at removal + AI. 48 hrs after removal
Please purchase PDFcamp Printer on http://www.verypdf.com/ to remove this watermark.

123
Table (12): Progesterone (P4) concentrations on day fourteen post-insemination in does carried to full term and does not carried to full term(nMol/L):
Synchronizations protocols .
Parameters A B C D E F . Total (Mean±Sd) No of does 10 10 10 10 10 10 Does not carried to Full term 8.08 3.41 14.98 - 55.93 26.57 60.00 8.99 23.71 24.96 5..01 0.00 21.22 - 1.69 51.90 27.53 0.00 - - 12.18 2.21 1.49 25.04 3.25 34.33 58.54 12.22 0.88 38.08 1.26 - 0.45 38.16 19.33 29.31 13.5 - 4.51 39.37 8.08 Mean±Sd 18.02±22.25 15.58±33.71 16.58±20.25 25.90±19.55 21.36±20.99 18.15±15.27 19.31±18.29 . . Does carried to Full term 32.52 29.47 39.84 14.33 73.64 33.25 26.80 30.93 39.63 69.96 40.94 22.14 10.14 40.72 43.06 20.56 42.88 27.02 42.45 Mean± Sd 23.15±11.63 33.71±6.12 40.84±1.09 25.83±25.17 52.27±17.98 27.47±5.57 35.77±15.91 - P-value 0..66 0.14 0.08 0.59 0.04 0.19 0.00 - Values are significance al level (P<0.05). A = Natural oestrus and natural mating. B = Progesterone +AI. 48 hrs after removal. C= Progesterone + PMSG 48 hrs before removal + AI. At removal D. = Progesterone + PMSG at removal+ AI. 48 hrs after removal E = Progesterone + PMSG & PGF2a� at removal + AI. 48 hrs after removal F = Progesterone + PGF2a� + at removal + AI. 48 hrs after removal
Please purchase PDFcamp Printer on http://www.verypdf.com/ to remove this watermark.

124
Table (13): Progesterone (P4) concentrations on day twenty one post-insemination in does carried to full term and does not carried to full term(nMol/L):
Synchronizations protocols .
Parameters A B C D E F . Total (Mean±Sd) No of does 10 10 10 10 10 10 Does not carried to Full term 0.00 0.00 0.37 0.71 0.02 10.57 0.00 2.89 17.86 0.51 9.11 3.80 1.55 0.00- 0.09 0.81 29.59 0.62 1.76 - 0.25 2.21 1.87 24.29 - 2.80 0.93 0.04 4.08 1.19 3.15 - 6.06 30.23 4.01 0.00 38.87 - 0.12 0.65 0.06 Mean±Sd 7.56±15.39 1.42±1.64 3.67±6.61 5.57 ±12.01 7.16±10.36 5.83±9.09 5.46±9.79 - . Does not carried to Full term 14.62 59.56 30.14 72.94 16.07 65.71 25.85 34.50 20.98 23.22 22.53 32.89 - 28.40 24.77 27.95 30.74 25 .15 44.43 Mean=Sd 20.23±7.94 40.82±16.51 25.30±4.60 42.14±22.48 23.11±7.35 41.28±21.52 33.36±16.65 - P-value 0.21 0.00 0.00 0.01 0.03 0.00 0.00 - Values are significance al level (P<0.05). A = Natural oestrus and natural mating. B = Progesterone +AI. 48 hrs after removal. C= Progesterone + PMSG 48 hrs before removal + AI. At removal D. = Progesterone + PMSG at removal+ AI. 48 hrs after removal E = Progesterone + PMSG & PGF2a� at removal + AI. 48 hrs after removal F = Progesterone + PGF2a� + at removal + AI. 48 hrs after removal
Please purchase PDFcamp Printer on http://www.verypdf.com/ to remove this watermark.

125
Please purchase PDFcamp Printer on http://www.verypdf.com/ to remove this watermark.

126
Please purchase PDFcamp Printer on http://www.verypdf.com/ to remove this watermark.

127
Please purchase PDFcamp Printer on http://www.verypdf.com/ to remove this watermark.

128
Please purchase PDFcamp Printer on http://www.verypdf.com/ to remove this watermark.

129
Please purchase PDFcamp Printer on http://www.verypdf.com/ to remove this watermark.

130
Please purchase PDFcamp Printer on http://www.verypdf.com/ to remove this watermark.

131
Please purchase PDFcamp Printer on http://www.verypdf.com/ to remove this watermark.

132
***
Please purchase PDFcamp Printer on http://www.verypdf.com/ to remove this watermark.


![3 Pankreas Löser [Kompatibilitätsmodus] · Darm - Ernährung kritisch Kranker Souba et al. ( 1988 ), Baskin et al. ( 1992 ), Sigurdsson et al. ( 1997 ) größte Grenzfläche zur](https://static.fdocuments.net/doc/165x107/5e1b026682064b30a13b86d5/3-pankreas-lser-kompatibilittsmodus-darm-ernhrung-kritisch-kranker-souba.jpg)
