![Dimensional Fund Advisors Canada ULC (“DFA Canada”) is not affiliated with [insert name of Advisor]. DFA Canada is a separate and distinct company. Quarterly.](https://static.fdocuments.net/doc/165x107/56649dc65503460f94aba197/dimensional-fund-advisors-canada-ulc-dfa-canada-is-not-affiliated-with.jpg)
AZL® DFA Multi-Strategy Fund/media/files/allianz/... · funds: AZL DFA International Core Equity...
4
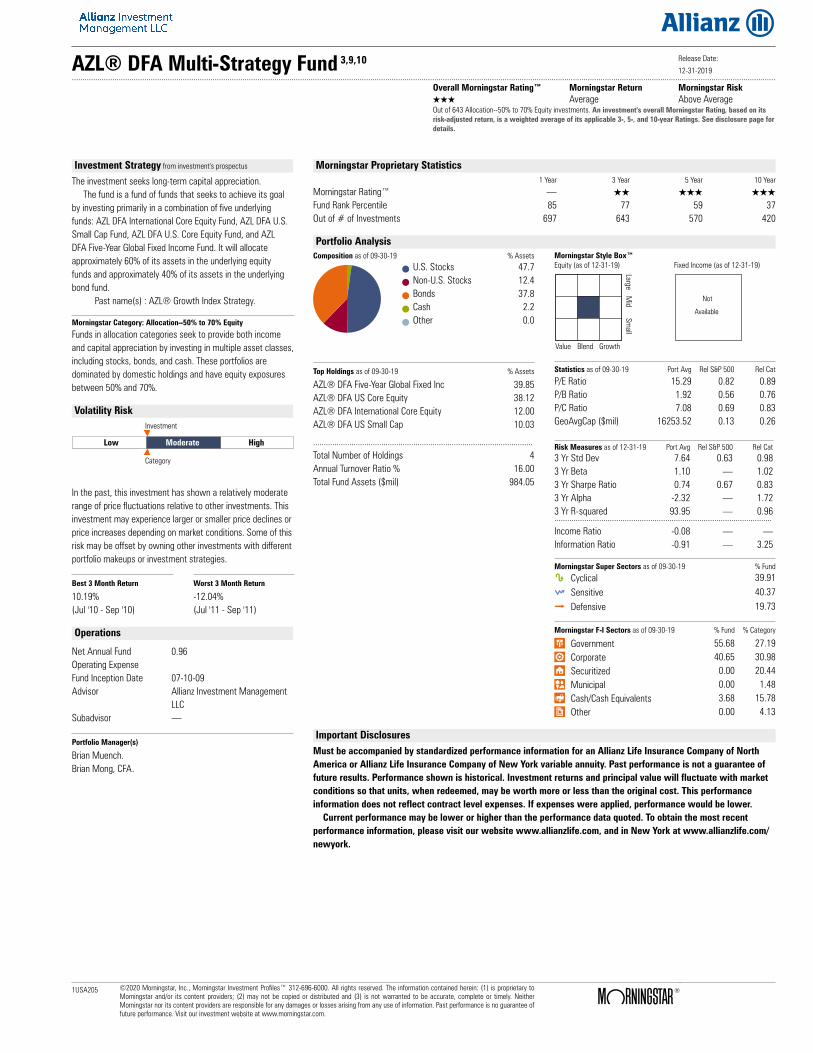
AZL® DFA Multi-Strategy Fund 3,9,10 Release Date: 12-31-2019 .......................................................................................................................................................................................................................................................................................................................................... Overall Morningstar Rating™ Morningstar Return Morningstar Risk QQQ Average Above Average Out of 643 Allocation--50% to 70% Equity investments. An investment's overall Morningstar Rating, based on its risk-adjusted return, is a weighted average of its applicable 3-, 5-, and 10-year Ratings. See disclosure page for details. Investment Strategy from investment's prospectus The investment seeks long-term capital appreciation. The fund is a fund of funds that seeks to achieve its goal by investing primarily in a combination of five underlying funds: AZL DFA International Core Equity Fund, AZL DFA U.S. Small Cap Fund, AZL DFA U.S. Core Equity Fund, and AZL DFA Five-Year Global Fixed Income Fund. It will allocate approximately 60% of its assets in the underlying equity funds and approximately 40% of its assets in the underlying bond fund. Past name(s) : AZL® Growth Index Strategy. Morningstar Category: Allocation--50% to 70% Equity Funds in allocation categories seek to provide both income and capital appreciation by investing in multiple asset classes, including stocks, bonds, and cash. These portfolios are dominated by domestic holdings and have equity exposures between 50% and 70%. Volatility Risk Low Moderate High Investment Category In the past, this investment has shown a relatively moderate range of price fluctuations relative to other investments. This investment may experience larger or smaller price declines or price increases depending on market conditions. Some of this risk may be offset by owning other investments with different portfolio makeups or investment strategies. Best 3 Month Return Worst 3 Month Return 10.19% -12.04% (Jul '10 - Sep '10) (Jul '11 - Sep '11) Operations Net Annual Fund Operating Expense 0.96 Fund Inception Date 07-10-09 Advisor Allianz Investment Management LLC Subadvisor . Portfolio Manager(s) Brian Muench. Brian Mong, CFA. Morningstar Proprietary Statistics 1 Year 3 Year 5 Year 10 Year Morningstar Rating™ . QQ QQQ QQQ Fund Rank Percentile 85 77 59 37 Out of # of Investments 697 643 570 420 Portfolio Analysis Composition as of 09-30-19 % Assets U.S. Stocks 47.7 Non-U.S. Stocks 12.4 Bonds 37.8 Cash 2.2 Other 0.0 Morningstar Style Box™ Equity (as of 12-31-19) Fixed Income (as of 12-31-19) Large Mid Small Value Blend Growth Not Available Top Holdings as of 09-30-19 % Assets AZL® DFA Five-Year Global Fixed Inc 39.85 AZL® DFA US Core Equity 38.12 AZL® DFA International Core Equity 12.00 AZL® DFA US Small Cap 10.03 ....................................................................................................... Total Number of Holdings 4 Annual Turnover Ratio % 16.00 Total Fund Assets ($mil) 984.05 Statistics as of 09-30-19 Port Avg Rel S&P 500 Rel Cat P/E Ratio 15.29 0.82 0.89 P/B Ratio 1.92 0.56 0.76 P/C Ratio 7.08 0.69 0.83 GeoAvgCap ($mil) 16253.52 0.13 0.26 Risk Measures as of 12-31-19 Port Avg Rel S&P 500 Rel Cat 3 Yr Std Dev 7.64 0.63 0.98 3 Yr Beta 1.10 . 1.02 3 Yr Sharpe Ratio 0.74 0.67 0.83 3 Yr Alpha -2.32 . 1.72 3 Yr R-squared 93.95 . 0.96 ...................................................................................................... Income Ratio -0.08 . . Information Ratio -0.91 . 3.25 Morningstar Super Sectors as of 09-30-19 % Fund h Cyclical 39.91 j Sensitive 40.37 k Defensive 19.73 Morningstar F-I Sectors as of 09-30-19 % Fund % Category ⁄ Government 55.68 27.19 › Corporate 40.65 30.98 € Securitized 0.00 20.44 ‹ Municipal 0.00 1.48 fi Cash/Cash Equivalents 3.68 15.78 ± Other 0.00 4.13 Important Disclosures Must be accompanied by standardized performance information for an Allianz Life Insurance Company of North America or Allianz Life Insurance Company of New York variable annuity. Past performance is not a guarantee of future results. Performance shown is historical. Investment returns and principal value will fluctuate with market conditions so that units, when redeemed, may be worth more or less than the original cost. This performance information does not reflect contract level expenses. If expenses were applied, performance would be lower. Current performance may be lower or higher than the performance data quoted. To obtain the most recent performance information, please visit our website www.allianzlife.com, and in New York at www.allianzlife.com/ newyork. 1USA205 ©2020 Morningstar, Inc., Morningstar Investment Profiles™ 312-696-6000. All rights reserved. The information contained herein: (1) is proprietary to Morningstar and/or its content providers; (2) may not be copied or distributed and (3) is not warranted to be accurate, complete or timely. Neither Morningstar nor its content providers are responsible for any damages or losses arising from any use of information. Past performance is no guarantee of future performance. Visit our investment website at www.morningstar.com. ß ®
Transcript of AZL® DFA Multi-Strategy Fund/media/files/allianz/... · funds: AZL DFA International Core Equity...
AZL® DFA Multi-Strategy Fund 3,9,10 Release Date:
12-31-2019..........................................................................................................................................................................................................................................................................................................................................
Overall Morningstar Rating™ Morningstar Return Morningstar RiskQQQ Average Above AverageOut of 643 Allocation--50% to 70% Equity investments. An investment's overall Morningstar Rating, based on itsrisk-adjusted return, is a weighted average of its applicable 3-, 5-, and 10-year Ratings. See disclosure page fordetails.
Investment Strategy from investment's prospectus
The investment seeks long-term capital appreciation. The fund is a fund of funds that seeks to achieve its goal by investing primarily in a combination of five underlying funds: AZL DFA International Core Equity Fund, AZL DFA U.S. Small Cap Fund, AZL DFA U.S. Core Equity Fund, and AZL DFA Five-Year Global Fixed Income Fund. It will allocate approximately 60% of its assets in the underlying equity funds and approximately 40% of its assets in the underlying bond fund. Past name(s) : AZL® Growth Index Strategy.
Morningstar Category: Allocation--50% to 70% Equity
Funds in allocation categories seek to provide both incomeand capital appreciation by investing in multiple asset classes,including stocks, bonds, and cash. These portfolios aredominated by domestic holdings and have equity exposuresbetween 50% and 70%.
Volatility Risk
Low Moderate High
Investment
Category
In the past, this investment has shown a relatively moderaterange of price fluctuations relative to other investments. Thisinvestment may experience larger or smaller price declines orprice increases depending on market conditions. Some of thisrisk may be offset by owning other investments with differentportfolio makeups or investment strategies.
Best 3 Month Return Worst 3 Month Return
10.19% -12.04%(Jul '10 - Sep '10) (Jul '11 - Sep '11)
Operations
Net Annual FundOperating Expense
0.96
Fund Inception Date 07-10-09Advisor Allianz Investment Management
LLCSubadvisor .
Portfolio Manager(s)
Brian Muench.Brian Mong, CFA.
Morningstar Proprietary Statistics1 Year 3 Year 5 Year 10 Year
Morningstar Rating™ . QQ QQQ QQQFund Rank Percentile 85 77 59 37Out of # of Investments 697 643 570 420
Portfolio AnalysisComposition as of 09-30-19 % Assets
U.S. Stocks 47.7Non-U.S. Stocks 12.4Bonds 37.8Cash 2.2Other 0.0
Morningstar Style Box™Equity (as of 12-31-19) Fixed Income (as of 12-31-19)
LargeM
idSm
all
Value Blend Growth
Not
Available
Top Holdings as of 09-30-19 % Assets
AZL® DFA Five-Year Global Fixed Inc 39.85AZL® DFA US Core Equity 38.12AZL® DFA International Core Equity 12.00AZL® DFA US Small Cap 10.03
.......................................................................................................Total Number of Holdings 4Annual Turnover Ratio % 16.00Total Fund Assets ($mil) 984.05
Statistics as of 09-30-19 Port Avg Rel S&P 500 Rel Cat
P/E Ratio 15.29 0.82 0.89P/B Ratio 1.92 0.56 0.76P/C Ratio 7.08 0.69 0.83GeoAvgCap ($mil) 16253.52 0.13 0.26
Risk Measures as of 12-31-19 Port Avg Rel S&P 500 Rel Cat3 Yr Std Dev 7.64 0.63 0.983 Yr Beta 1.10 . 1.023 Yr Sharpe Ratio 0.74 0.67 0.833 Yr Alpha -2.32 . 1.723 Yr R-squared 93.95 . 0.96......................................................................................................Income Ratio -0.08 . .Information Ratio -0.91 . 3.25
Morningstar Super Sectors as of 09-30-19 % Fund
h Cyclical 39.91j Sensitive 40.37k Defensive 19.73
Morningstar F-I Sectors as of 09-30-19 % Fund % Category
⁄ Government 55.68 27.19› Corporate 40.65 30.98€ Securitized 0.00 20.44‹ Municipal 0.00 1.48fi Cash/Cash Equivalents 3.68 15.78± Other 0.00 4.13
Important DisclosuresMust be accompanied by standardized performance information for an Allianz Life Insurance Company of NorthAmerica or Allianz Life Insurance Company of New York variable annuity. Past performance is not a guarantee offuture results. Performance shown is historical. Investment returns and principal value will fluctuate with marketconditions so that units, when redeemed, may be worth more or less than the original cost. This performanceinformation does not reflect contract level expenses. If expenses were applied, performance would be lower. Current performance may be lower or higher than the performance data quoted. To obtain the most recentperformance information, please visit our website www.allianzlife.com, and in New York at www.allianzlife.com/newyork.
1USA205 ©2020 Morningstar, Inc., Morningstar Investment Profiles™ 312-696-6000. All rights reserved. The information contained herein: (1) is proprietary toMorningstar and/or its content providers; (2) may not be copied or distributed and (3) is not warranted to be accurate, complete or timely. NeitherMorningstar nor its content providers are responsible for any damages or losses arising from any use of information. Past performance is no guarantee offuture performance. Visit our investment website at www.morningstar.com.
ß®
This material must be preceded or accompanied by acurrent prospectus for variable annuities. Call yourfinancial professional or Allianz Life at 800.624.0197 toobtain a prospectus from Allianz Life InsuranceCompany of North America (Allianz Life®) and, in NewYork, from Allianz Life Insurance Company of NewYork (Allianz Life® of NY) variable annuities andvariable investment options. The prospectuses containdetails on investment objectives, risks, fees, andexpenses, as well as other information about thevariable annuity and underlying investment options,which you should carefully consider. Please read theprospectuses thoroughly before sending money.
The advisor or subadvisor of the investment options may havea public mutual fund with an investment objective that issimilar to that of the listed investment option. These areseparate portfolios that will have different investmentperformance due to differing fees, expenses, relative cashflows, portfolio sizes, and other factors.
The investment options are available only as investmentoptions in variable annuity contracts and certain other tax-qualified investments. They are not made available to thegeneral public directly.
Allianz Life and Allianz Life of NY work exclusively withregistered representatives to help them meet their clients’financial goals. We offer innovative financial products,responsive customer service, and the financial strength of ourparent company, Allianz SE.
Not FDIC insured • May lose value • No bank or creditunion guarantee • Not a deposit • Not insured by anyfederal government agency or NCUA/NCUSIF
All contract and rider guarantees, including optional benefitsare backed by the claims-paying ability of Allianz Life andAllianz Life of NY. They are not backed by the broker/dealerfrom which this annuity is purchased, by the insuranceagency from which this annuity is purchased, or any affiliatesof those entities, and none makes any representations orguarantees regarding the claims-paying ability of Allianz Lifeand Allianz Life of NY.
Guarantees do not apply to the performance of the variablesubaccounts, which will fluctuate with market conditions.
Products are issued by Allianz Life Insurance Company ofNorth America, 5701 Golden Hills Drive, Minneapolis, MN55416-1297. 800.542.5427. www.allianzlife.com. In NewYork, products are issued by Allianz Life Insurance Companyof New York, 28 Liberty Street, 38th Floor, New York, NY10005-1422. www.allianzlife.com/new-york Variable productsare distributed by their affiliate, Allianz Life Financial Services,LLC, member FINRA, 5701 Golden Hills Drive, Minneapolis,MN 55416-1297. Only Allianz Life Insurance Company of NewYork is authorized to offer annuities and life insurance in thestate of New York.
Volatility Risk
The term volatility is used to mean standard deviation.Standard deviation of fund returns measures how much afund’s total returns have fluctuated in the past.
Prospectus Net Expense RatioThe expense ratio is the annual fee that all funds charge theirshareholders. It expresses the percentage of assets deductedeach fiscal year for fund expenses, including 12b-1 fees,management fees, administrative fees, operating costs, andall other asset-based costs incurred by the fund. Portfoliotransaction fees, or brokerage costs, as well as front-end ordeferred sales charges are not included in the expense ratio.The expense ratio, which is deducted from the fund's averagenet assets, is accrued on a daily basis. The gross expenseratio, in contrast to the net expense ratio, does not reflectany fee waivers in effect during the time period.
Overall Morningstar Rating™The Morningstar Rating™ for funds, or "star rating", iscalculated for managed products (including mutual funds,variable annuity and variable life subaccounts, exchange-traded funds, closed-end funds, and separate accounts) withat least a three-year history. Exchange-traded funds andopen-ended mutual funds are considered a single populationfor comparative purposes. It is calculated based on aMorningstar Risk-Adjusted Return measure that accounts forvariation in a managed product's monthly excessperformance, placing more emphasis on downward variationsand rewarding consistent performance. The MorningstarRating does not include any adjustment for sales loads. Thetop 10% of products in each product category receive 5 stars,the next 22.5% receive 4 stars, the next 35% receive 3 stars,the next 22.5% receive 2 stars, and the bottom 10% receive1 star. The Overall Morningstar Rating for a managed productis derived from a weighted average of the performancefigures associated with its three-, five-, and 10-year (ifapplicable) Morningstar Rating metrics. The weights are:100% three-year rating for 36-59 months of total returns,60% five-year rating/40% three-year rating for 60-119 monthsof total returns, and 50% 10-year rating/30% five-yearrating/20% three-year rating for 120 or more months of totalreturns. While the 10-year overall star rating formula seemsto give the most weight to the 10-year period, the mostrecent three-year period actually has the greatest impactbecause it is included in all three rating periods.
Morningstar ReturnThis statistic is a measurement of a fund's excess return overa risk-free rate (the return of the 90-day Treasury bill), afteradjusting for all applicable loads and sales charges. In eachMorningstar Category, the top 10% of funds earn a HighMorningstar Return, the next 22.5% Above Average, themiddle 35% Average, the next 22.5% Below Average, and thebottom 10% Low. Morningstar Return is measured for up tothree time periods (three-, five-, and 10-years). Theseseparate measures are then weighted and averaged toproduce an overall measure for the fund. Funds with less thanthree years of performance history are not rated.
Morningstar RiskThis statistic evaluates the variations in a fund's monthlyreturns, with an emphasis on downside variations. In each
Morningstar Category, the 10% of funds with the lowestmeasured risk are described as Low Risk, the next 22.5%Below Average, the middle 35% Average, the next 22.5%Above Average, and the top 10% High. Morningstar Risk ismeasured for up to three time periods (three-, five-, and 10-years). These separate measures are then weighted andaveraged to produce an overall measure for the fund. Fundswith less than three years of performance history are notrated.
Investment Risk Fidelity Institutional Asset Management is a registeredservice mark of FMR LLC. Used with permission. 1. Small-cap and mid-cap stocks are more volatile than large-cap or more established companies' securities.
2. This investment option seeks to match the performance ofthe specified market index. Investors cannot invest directlyinto indexes.
3. The AZL®, RCM, and PIMCO investment options aremanaged by an affiliate of Allianz Life Insurance Company ofNorth America, Allianz Life Insurance Company of New Yorkand Allianz Life Financial Services, LLC. All are affiliatedcompanies.
4. This investment option is subadvised by the listed firm. Thesubadvisor may have a public mutual fund with an investmentobjective that is similar to that of this investment option.These are separate portfolios that will have differentperformance due to differing fees, expenses, relative cashflows, portfolio sizes, and other factors.
5. International investing involves some risks not present withU.S. investments, such as currency fluctuation and politicalvolatility.
6. High-yield securities inherently have a high degree ofmarket risk in addition to credit risk and potential illiquidity.
7. Bond funds are subject to credit risk and inflation risk. Theyare also subject to interest rate risk. Generally, when interestrates rise, bond prices fall. Bonds with longer maturities tendto be more sensitive to changes in interest rates.
8. Money invested in a specific sector or industry is subjectto a higher degree of risk than money that is diversified.
9. This investment option invests in derivative instrumentssuch as futures, options, and swap agreements. Derivativescan increase the investment option’s share price volatility andcould magnify losses. Certain derivative instruments alsoinvolve costs that could reduce returns. Certain derivativesmay involve risk of default.
10. Manager Allocation Risk: The risk refers to the possibilitythat the manager could allocate assets in a manner that willcause the funds to underperform other funds with similarinvestment objectives. The manager may have a potentialconflict of interest in allocating assets among and between
Disclosure
©2020 Morningstar, Inc., Morningstar Investment Profiles™ 312-696-6000. All rights reserved. The information contained herein: (1) is proprietary to Morningstar and/orits content providers; (2) may not be copied or distributed and (3) is not warranted to be accurate, complete or timely. Neither Morningstar nor its content providers areresponsible for any damages or losses arising from any use of information. Past performance is no guarantee of future performance. Visit our investment website atwww.morningstar.com.
ß®
the permitted underlying funds because the subadvisory feerate it pays to the subadvisors of the permitted underlyingfunds is different.
11. “Standard & Poor’s®,” “S&P®,” “S&P 500,” “Standard &Poor’s 500,” “500,” “Standard & Poor’s SmallCap 600,” “S&PSmallCap 600,” and “S&P MidCap 400” are trademarks ofStandard & Poor’s Financial Services LLC and have beenlicensed for use by the Allianz Variable Insurance ProductsTrust and Allianz Investment Management LLC. The product isnot sponsored, endorsed, sold, or promoted by Standard &Poor’s and Standard & Poor’s makes no representationregarding the advisability of purchasing the product.
12. The Russell 1000® Value Index is a market-capitalizationweighted index of those firms in the Russell 1000 with lowerprice-to-book ratios and lower forecasted growth values. TheRussell 1000 includes the largest 1,000 firms in the Russell3000®, which represents approximately 98% of theinvestable U.S. equity markets.
13. The Russell 1000® Growth Index is a market-capitalization weighted index of those firms in the Russell1000 with higher price-to-book ratios and higher forecastedgrowth values. The Russell 1000 includes the largest 1,000firms in the Russell 3000®, which represents approximately98% of the investable U.S. equity markets.
14. MSCI EAFE® Index is a free float-adjusted marketcapitalization index that is designed to measure developedmarket equity performance, excluding the U.S. and Canada.EAFE is a registered service mark of MSCI, Inc.
15. Generally under normal conditions, 5% (up to 20%) of theinvestment option is invested in the MVP risk managementoverlay. When overall market volatility is generally moderateor low, the MVP risk management process will look toparticipate with the market using derivatives equal to the riskof the investment options and minimizes its protectionaspect. During periods of higher market volatility, the MVPrisk management process will seek to reduce volatility usingderivatives with the goal to minimize extreme negativeoutcomes. Derivatives are contracts used as underlyingassets and play an important role in hedging risk. They limitthe need to buy or sell assets within the underlying funds inperiods of volatility. They also include the risks related tofutures and options, which may be different from and greaterthan the risks of direct investments in securities or othertraditional investments. The MVP process does not ensure aprofit or protect against losses. Success of the hedgingstrategy or fund objectives cannot be guaranteed.
16. Each AZL® MVP fund utilizes the MVP risk managementprocess, which could cause the equity exposure of the fundsto fluctuate, but equity exposure will generally not be lowerthan 10%.
17. Because growth stocks have higher valuations and lowerdividend yields than slower-growth or cyclical companies, theshare price volatility may be higher. As such, fund pricescould decline further in market downturns than non-growth-oriented funds.
18. The value approach carries the risk that the market willnot recognize a security’s true worth for a long time, or that astock judged to be undervalued may actually be appropriatelypriced. As with all equity funds, the fund’s share price can fallbecause of weakness in the broad market, a particularindustry, or specific holdings.
19. Due to the fund’s concentration in health sciencescompanies, its share price will be more volatile than that ofmore diversified funds. Further, these firms are oftendependent on government funding and regulation and arevulnerable to product liability lawsuits and competition fromlow-cost generic products.
20. Equity funds are subject generally to market, marketsector, market liquidity issuer, and investment style risks,among other factors and varying degrees.
The Barclays Capital U.S. Aggregate Bond Index is comprisedof U.S. investment-grade, fixed-rate bond market securities,including government agency, corporate and mortgage-backed securities.
Allianz products are not sponsored, endorsed, sold, orpromoted by Barclays Capital. Barclays Capital makes norepresentation or warranty, express or implied, to the ownersof Allianz products or any member of the public regarding theadvisability of investing in securities generally or in Allianzproducts particularly or the ability of the Barclays CapitalIndices, including without limitation, the Barclays Capital U.S.Aggregate Bond Index, to track general bond marketperformance. Barclays Capital's only relationship to AllianzLife Insurance Company of North America and its affiliates(“Allianz”) is the licensing of the Barclays Capital U.S.Aggregate Bond Index and Barclays US Dynamic BalanceIndex which are determined, composed and calculated byBarclays Capital without regard to Allianz or Allianz products.Barclays Capital has no obligation to take the needs of Allianzor the owners of Allianz products into consideration indetermining, composing or calculating the Barclays CapitalU.S. Aggregate Bond Index. Barclays Capital is notresponsible for and has not participated in the determinationof the timing of, prices at, or quantities of Allianz products tobe issued or in the determination or calculation of theequation by which Allianz products are to be converted intocash. Barclays Capital has no obligation or liability inconnection with the administration, marketing or trading ofAllianz products.
BARCLAYS CAPITAL DOES NOT GUARANTEE THE QUALITY,ACCURACY AND/OR THE COMPLETENESS OF THE BARCLAYSCAPITAL INDICES, OR ANY DATA INCLUDED THEREIN, OROTHERWISE OBTAINED BY ALLIANZ, OWNERS OF ALLIANZPRODUCTS, OR ANY OTHER PERSON OR ENTITY FROM THEUSE OF THE BARCLAYS CAPITAL INDICES, INCLUDINGWITHOUT LIMITATION, THE BARCLAYS CAPITAL U.S.AGGREGATE BOND INDEX, IN CONNECTION WITH THERIGHTS LICENSED HEREUNDER OR FOR ANY OTHER USE.BARCLAYS CAPITAL MAKES NO EXPRESS OR IMPLIEDWARRANTIES, AND HEREBY EXPRESSLY DISCLAIMS ALLWARRANTIES OF MERCHANTABILITY OR FITNESS FOR A
PARTICULAR PURPOSE OR USE WITH RESPECT TO THEBARCLAYS CAPITAL INDICES, INCLUDING WITHOUTLIMITATION, THE BARCLAYS CAPITAL U.S. AGGREGATEBOND INDEX, OR ANY DATA INCLUDED THEREIN. WITHOUTLIMITING ANY OF THE FOREGOING, IN NO EVENT SHALLBARCLAYS CAPITAL HAVE ANY LIABILITY FOR ANY SPECIAL,PUNITIVE, INDIRECT, OR CONSEQUENTIAL DAMAGES(INCLUDING LOST PROFITS), EVEN IF NOTIFIED OF THEPOSSIBILITY OF SUCH DAMAGES.
The licensing agreement between Allianz Life InsuranceCompany of North America and Barclays is solely for thebenefit of Allianz Life Insurance Company of North Americaand Barclays and not for the benefit of the owners of theAllianz products, investors or other third parties.
BARCLAYS SHALL HAVE NO LIABILITY TO THE ISSUER,INVESTORS OR TO OTHER THIRD PARTIES FOR THE QUALITY,ACCURACY AND/OR COMPLETENESS OF THE BARCLAYS USAGGREGATE BOND INDEX OR ANY DATA INCLUDED THEREINOR FOR INTERRUPTIONS IN THE DELIVERY OF THE BARCLAYSUS AGGREGATE BOND INDEX. BARCLAYS MAKES NOWARRANTY, EXPRESS OR IMPLIED, AS TO RESULTS TO BEOBTAINED BY THE ISSUER, THE INVESTORS OR ANY OTHERPERSON OR ENTITY FROM THE USE OF THE BARCLAYS USAGGREGATE BOND INDEX OR ANY DATA INCLUDED THEREIN.BARCLAYS MAKES NO EXPRESS OR IMPLIED WARRANTIES,AND HEREBY EXPRESSLY DISCLAIMS ALL WARRANTIES OFMERCHANTABILITY OR FITNESS FOR A PARTICULARPURPOSE OR USE WITH RESPECT TO THE BARCLAYS USAGGREGATE BOND INDEX OR ANY DATA INCLUDED THEREIN.BARCLAYS RESERVES THE RIGHT TO CHANGE THE METHODSOF CALCULATION OR PUBLICATION, OR TO CEASE THECALCULATION OR PUBLICATION OF THE BARCLAYS USAGGREGATE BOND INDEX, AND BARCLAYS SHALL NOT BELIABLE FOR ANY MISCALCULATION OF OR ANY INCORRECT,DELAYED OR INTERRUPTED PUBLICATION WITH RESPECT TOANY OF THE BARCLAYS US AGGREGATE BOND INDEX.BARCLAYS SHALL NOT BE LIABLE FOR ANY DAMAGES,INCLUDING, WITHOUT LIMITATION, ANY SPECIAL, INDIRECTOR CONSEQUENTIAL DAMAGES, OR ANY LOST PROFITSAND EVEN IF ADVISED OF THE POSSIBILITY OF SUCH,RESULTING FROM THE USE OF THE BARCLAYS USAGGREGATE BOND INDEX OR ANY DATA INCLUDED THEREINOR WITH RESPECT TO THE ALLIANZ PRODUCT.
None of the information supplied by Barclays Risk Analyticsand Index Solutions Limited and used in this publication maybe reproduced in any manner without the prior writtenpermission of Barclays Risk Analytics and Index SolutionsLimited. Barclays Risk Analytics and Index Solutions Limited isregistered in England No. 08934023.
"FTSE", "FT-SE", "Footsie", "FTSE4Good", and "techMARK" aretrademarks jointly owned by the London Stock Exchange Plcand the Financial Times and are used by the FTSEInternational Limited ("FTSE") under license. "All-World", "All-Share", and "All-Small" are trademarks of FTSE. The FTSE 100is calculated by FTSE. FTSE does not sponsor, endorse, orpromote this product and is not in any way connected to itand does not accept any liability in relation to its issue,operation, and trading.
Disclosure
©2020 Morningstar, Inc., Morningstar Investment Profiles™ 312-696-6000. All rights reserved. The information contained herein: (1) is proprietary to Morningstar and/orits content providers; (2) may not be copied or distributed and (3) is not warranted to be accurate, complete or timely. Neither Morningstar nor its content providers areresponsible for any damages or losses arising from any use of information. Past performance is no guarantee of future performance. Visit our investment website atwww.morningstar.com.
ß®
Portfolio AnalysisThe weighting of the portfolio in various asset classes,including "Other" is shown in the table. "Other" includessecurity types that are not neatly classified in the other assetclasses, such as convertible bonds and preferred stocks.
Morningstar Style Box™For equity funds the vertical axis shows the marketcapitalization of the long stocks owned and the horizontal axisshows investment style (value, blend, or growth). For fixed-income funds, the vertical axis shows the credit quality of thelong bonds owned and the horizontal axis shows interest ratesensitivity as measured by a bond's effective duration.
Morningstar seeks credit rating information from fundcompanies on a periodic basis (e.g., quarterly). In compilingcredit rating information Morningstar accepts credit ratingsreported by fund companies that have been issued by allNationally Recognized Statistical Rating Organizations(NRSROs). For a list of all NRSROs, please visitwww.sec.gov/divisions/marketreg/ratingagency.htm.Additionally, Morningstar accepts foreign credit ratings fromwidely recognized or registered rating agencies. If two ratingorganizations/agencies have rated a security, fund companiesare to report the lower rating; if three or more organizations/agencies have rated a security, fund companies are to reportthe median rating, and in cases where there are more thantwo organization/agency ratings and a median rating does notexist, fund companies are to use the lower of the two middleratings. PLEASE NOTE: Morningstar, Inc. is not itself anNRSRO nor does it issue a credit rating on the fund. AnNRSRO or rating agency ratings can change from time-to-time.
For credit quality, Morningstar combines the credit ratinginformation provided by the fund companies with an averagedefault rate calculation to come up with a weighted-averagecredit quality. The weighted-average credit quality is currentlya letter that roughly corresponds to the scale used by aleading NRSRO. Bond funds are assigned a style boxplacement of "low", "medium", or "high" based on theiraverage credit quality. Funds with a low credit quality arethose whose weighted-average credit quality is determinedto be less than "BBB-"; medium are those less than "AA-", butgreater or equal to "BBB-"; and high are those with aweighted-average credit quality of "AA-" or higher. Whenclassifying a bond portfolio, Morningstar first maps theNRSRO credit ratings of the underlying holdings to theirrespective default rates (as determined by Morningstar'sanalysis of actual historical default rates). Morningstar thenaverages these default rates to determine the averagedefault rate for the entire bond fund. Finally, Morningstarmaps this average default rate to its corresponding creditrating along a convex curve.
For interest-rate sensitivity, Morningstar obtains from fundcompanies the average effective duration. Generally,Morningstar classifies a fixed-income fund's interest-ratesensitivity based on the effective duration of the MorningstarCore Bond Index (MCBI), which is currently three years. Theclassification of Limited will be assigned to those funds
whose average effective duration is between 25% to 75% ofMCBI's average effective duration; funds whose averageeffective duration is between 75% to 125% of the MCBI willbe classified as Moderate; and those that are at 125% orgreater of the average effective duration of the MCBI will beclassified as Extensive.
For municipal bond funds, Morningstar also obtains from fundcompanies the average effective duration. In these casesstatic breakpoints are utilized. These breakpoints are asfollows: (i) Limited: 4.5 years or less; (ii) Moderate: morethan 4.5 years but less than 7 years; and (iii) Extensive: morethan 7 years. In addition, for non-US taxable and non-USdomiciled fixed income funds static duration breakpoints areused: (i) Limited: less than or equal to 3.5 years; (ii)Moderate: greater than 3.5 and less than equal to 6 years;(iii) Extensive: greater than 6 years.
Fixed Income Portfolio Statistics:Average Effective Duration is a measure of a fund's interest-rate sensitivity--the longer a fund's duration, the moresensitive the fund is to shifts in interest rates. Averageeffective duration is a weighted average of the duration of theunderlying fixed income securities within the portfolio.Average Effective Maturity is a weighted average of all thematurities of the bonds in a portfolio, computed by weightingeach bond's effective maturity by the market value of thesecurity. Average effective maturity takes into considerationall mortgage prepayments, puts, and adjustable coupons.Longer-maturity funds are generally considered more interest-rate sensitive than their shorter counterparts.Average Weighted Price is calculated from the fund’s portfolioby weighing the price of each bond by its relative size in theportfolio. This number reveals if the fund favors bonds sellingat prices above or below face value (discount or premiumsecurities, respectively). A higher number indicates a biastoward premiums. This statistic is expressed as a percentageof par (face) value.
StatisticsThe Price/Earnings Ratio for a fund is the asset-weightedaverage of the prospective earnings yields of all the domesticstocks in a fund’s portfolio. The P/E ratio of a stock iscalculated by dividing the current price of the stock by itstrailing 12 months’ earnings per share. The P/E ratio relatesthe price of the stock to the per-share earnings of thecompany. A high P/E generally indicates that the market willpay more to obtain the company because it has confidence inthe company’s ability to increase its earnings. Conversely, alow P/E indicates that the market has less confidence thatthe company’s earnings will increase, and therefore will notpay as much for its stock.The Price/Book Ratio for a fund is the asset-weighted averageof the prospective book value yields of all the domesticstocks in the fund’s portfolio. P/B ratio of a company iscalculated by dividing the market price of its stock by thecompany’s per-share book value. A high P/B ratio indicatesthat the price of the stock exceeds the actual worth of thecompany’s assets. A low P/B ratio would indicate that thestock is a bargain, priced below what the company’s assetscould be worth if liquidated.The Price/Cash Ratio for a fund represents the weighted
average of the price/cash-flow ratios of the stocks in a fund'sportfolio. Price/cash-flow represents the amount an investoris willing to pay for a dollar generated from a particularcompany's operations. Price/cash-flow shows the ability of abusiness to generate cash and acts as a gauge of liquidityand solvency.Geometric Average Cap ($mil) is the overall "size" of a stockfund's portfolio, or the geometric mean of the marketcapitalization for all of the stocks it owns.
Risk MeasuresR-squared reflects the percentage of a fund's movementsthat are explained by movements in its benchmark index,showing the degree of correlation between the fund and thebenchmark. Beta is a measure of a fund's sensitivity tomarket movements. A portfolio with a beta greater than 1 ismore volatile than the market, and a portfolio with a beta lessthan 1 is less volatile than the market. Alpha measures thedifference between a fund's actual returns and its expectedperformance, given its level of risk (as measured by beta).Sharpe ratio uses standard deviation and excess return todetermine reward per unit of risk. Standard deviation is astatistical measure of the volatility of the fund's returns.
SectorsThe fixed income sector framework consists of three levels:Super Sector, Primary Sector, and Secondary Sector. Thereare six Super Sectors, Government, Corporate, Securitized,Municipal, Cash & Equivalents, and Other, which divide into17 Primary Sectors, which in turn are formed by 72Secondary Sectors. The Government Super Sector includesGovernment and Government Related Primary Sectors;Municipal includes Municipal Taxable and Municipal Tax-Exempt sectors; Corporate includes Bank Loan, Convertible,Corporate Bond and Preferred Stock sectors; Securitizedincludes Agency Mortgage-Backed, Non-Agency ResidentialMortgage-Backed, Commercial Mortgage-Backed, CoveredBond, and Asset-Backed sectors; Cash & Equivalents includesCash & Equivalents; Other includes Swap, Future/Forward,and Option/Warrant sectors.Equity sectors are consolidated in three Super Sectors:Cyclical, Defensive and Sensitive. These Super Sectors are abroader representation of Morningstar's 11 equity sectors.The Defensive Super Sector includes Consumer Defensive,Healthcare, and Utilities sectors; Cyclical includes BasicMaterials, Consumer Cyclical, Financial Services, and RealEstate sectors; Sensitive includes Communication Services,Energy, Industrials, and Technology sectors.
Disclosure
©2020 Morningstar, Inc., Morningstar Investment Profiles™ 312-696-6000. All rights reserved. The information contained herein: (1) is proprietary to Morningstar and/orits content providers; (2) may not be copied or distributed and (3) is not warranted to be accurate, complete or timely. Neither Morningstar nor its content providers areresponsible for any damages or losses arising from any use of information. Past performance is no guarantee of future performance. Visit our investment website atwww.morningstar.com.
ß®