AZHAR PROJECT
181
SECURITY ANALYSIS AND PORTFOLIO MANAGEMENT OF FIVE MAJOR PLAYERS IN BANKING SECTOR MAJOR PROJECT REPORT Submitted by AZHAR K.P UNDER THE GUIDANCE OF Mr.BIJU M.K. Sr. Lecturer In partial fulfillment of the requirement for the Degree of MASTER OF BUSINESS ADMINISTRATION University of Calicut DEPARTMENT OF MANAGEMENT SCIENCE MES COLLEGE OF ENGINEERING (Affiliated to University of Calicut) KUTTIPURAM, KERALA, INDIA
Transcript of AZHAR PROJECT

SECURITY ANALYSIS AND PORTFOLIO MANAGEMENT OF FIVE MAJOR PLAYERS IN BANKING SECTOR
MAJOR PROJECT REPORT
Submitted by
AZHAR K.P
UNDER THE GUIDANCE OF
Mr.BIJU M.K.
Sr. Lecturer
In partial fulfillment
of the requirement for the Degree of
MASTER OF BUSINESS ADMINISTRATION
University of Calicut
DEPARTMENT OF MANAGEMENT SCIENCEMES COLLEGE OF ENGINEERING
(Affiliated to University of Calicut)KUTTIPURAM, KERALA, INDIA
2010

Project Report 2010 Cochin Stock Exchange
DEPARTMENT OF MANAGEMENT SCIENCE
MES COLLEGE OF ENGINEERING
KUTTIPPURAM, KERALA
PIN: 679573
(AFFILIATED TO UNIVERSITY OF CALICUT)
CERTIFICATE.
.
.
.
.
.
.
.
.
..
Department of Management Science [2] MES College of Engineering

Project Report 2010 Cochin Stock Exchange
DECLARATION
I hereby declare that this project report titled “Security analysis and Portfolio
Management of Five major players in Banking Sector” is the original work
done by me under the guidance of BIJU M.K, faculty, MES College of
Engineering, Kuttipuram and submitted to the Calicut University in the partial
fulfilment of the requirement of the Master of Business administration degree.
I further declare that this report has not been submitted earlier either to this
institution or any other institution for the fulfilment of the requirement for any
course of studies. I also declare that no chapter of this manuscript in whole or
in part is lifted and incorporated in this report from any earlier work done by
others or me.
Date:
Place: Kuttipuram Azhar
K.P
Department of Management Science [3] MES College of Engineering
Project Report 2010 Cochin Stock Exchange
ACKNOWLEDGEMENT
“Behind every successful effort, there lies a contribution from numerous sources
irrespective of their magnitude. My project is no exception and I take this opportunity to
express my sincere thanks to those helping hands wholeheartedly”.
First and foremost I thank God for his almighty support and mercy drop of blessings upon
me to complete my project successfully.
The satisfaction that accompanying the successful completion of the task would be
incomplete without mentioning the people who made it possible with the constant guidance
and encouragement all through the period of study.
I am indebted to my Project Guide Mr. Biju M.K (Faculty Guide), and all other faculties
and staff members of Department Of Management science for their valuable suggestions
and sincere co-operation rendered to me during the academic period.
I am profoundly thankful to Shri. Thomas George M.A GDIM (UK) PhD (External
Guide), Cochin Stock Exchange who was generous with time and effort to explain the
theoretical and practical aspects of Security Analysis and Portfolio Management.
I wish to pay my gratitude to my parents without whose support and inspiration, this
project would have remained a dream. Last but not least; I take this opportunity to thank all
my friends and others who have helped me directly or indirectly for the successful
completion of the project.
AZHAR K.P
Department of Management Science [4] MES College of Engineering
Project Report 2010 Cochin Stock Exchange
TABLE OF CONTENTS
SERIAL NO
LIST OF CONTENTS PAGE NO
List of Tables
List of Charts
1 Chapter I – INTRODUCTION
Introduction to Study 2-3
Objective of the Study 3-4
Statement of the Problem 4
Significance of the Study 4
Scope of the Study 5
2 Chapter II Industry Profile 6-21
3 Chapter III Company Profile 22-27
4 Chapter IV Literature Review 28-31
5 Chapter V Research Methodology 32-43
6 Chapter VI Analysis and Interpretation 44-103
7 Chapter VII Findings, Suggestions and Conclusion 104-110
8 Chapter VIII Bibliography 111-112
9 Chapter IX Annexure 113-123
Department of Management Science [5] MES College of Engineering

Project Report 2010 Cochin Stock Exchange
EXECUTIVE SUMMARY
This study was carried out at Cochin Stock Exchange during the month
of May 2010. The report is an outcome of a study undertaken in CSE on the
topic “Security Analysis and Portfolio Management of five major players in
Banking Sector”.
Out of the ten companies, which were taken on the basis of market
capitalization from the BSE list and ranked accordingly, five were selected to
conduct a detail study. The banks selected for the study are State Bank of
India, ICICI Bank, Punjab National Bank, AXIS Bank and HDFC Bank.
Indian banking companies is analyzed by taking up fundamental
analysis and technical analysis along with creating different mix of portfolio
within the selected securities. Fundamental analysis involves finding the
intrinsic value of the selected banking shares. It is also done to indentify the
misprice share there by assisting the prospective investor in making the buy or
sell decision.
Technical analysis was conducted to find the movement of stock price
over the period of time. Mathematical indicators used for Technical Analysis
are Exponential Moving Average, ROC and MACD.
It is rare to find investor investing their entire savings in a single
security. Instead, they tend to invest in a group of securities called portfolio.
Creation of portfolio helps to reduce risk without sacrificing returns. Portfolio
was constructed on the basis of Equal Weight, PE Ratio and Market
Capitalization. To find the optimal Portfolio Sharpe and Treynor Ratio were
used to evaluate the Portfolio.
Department of Management Science [6] MES College of Engineering
Project Report 2010 Cochin Stock Exchange
All the data collected are secondary. The data were absorbed from
websites, magazines and books. For conducting Fundamental Analysis five
years data were taken. Technical analysis was conducted with eighteen
months of data. Portfolio was constructed on the basis of five years of data.
Fundamental Analysis revealed that all the banks have shown
consistently good performance and the performance is improving every year.
Therefore the performances of all these banks are likely to be much better in
the years to come. After analysing the Mathematical indicators it was found
that most of the companies are in bullish trend. After evaluating the three
portfolios which were constructed with the different proportions of the five
selected securities and measuring performance based on Sharpe and Treynor
Ratios, it has been found that, the portfolio based on P/E Ratio ranks highest.
From the overall study it is found that Banking Industry is booming in
India and it is the best time to invest in banking industry. It is viable for
investors to invest in the sector on a long term basis.
Department of Management Science [7] MES College of Engineering
Project Report 2010 Cochin Stock Exchange
CHAPTER I
INTRODUCTION
Department of Management Science [8] MES College of Engineering

Project Report 2010 Cochin Stock Exchange
INTRODUCTION TO THE STUDY
The banking scenario has witnessed significant development in the
recent years with the entry of private banks and their focus on retail banking and
convergence of services. The ongoing reforms process, growing use of technology,
increased competition and product innovation has all put the banking sector on a high
growth trajectory. Advancement in communication and information technology has
facilitated growth in internet banking, ATM network, and Electronic transfer of funds and
quick dissemination of information. Structural reforms in the banking sector have improved
the health of the banking sector. The forms recently introduced include the enactment of the
Securitization Act to step up loan recoveries, establishment of asset reconstruction
companies, initiatives on improving recoveries from Non-performing Assets(NP As)and
change in the basis of income recognition has raised transparency and efficiency in the
banking system. Spurt in treasury income and improvement in loan recoveries has helped
Indian Banks to record better profitability.
In the year 2002, return on assets in Indian banking was higher
compared to many emerging economies and the Moody's Bank Financial strength Index
(2002) placed India at 27.5, which is much better than 16.7 of Korea, 15.8 of Thailand and
12.5 of Japan. Similar to experience in other rapidly growing countries, India is making
sizable gains in expanding into consumer credit with tightening of credit administration
procedures. Major policy actions that led to sharp fall in the interest rates enabled banks to
post significant rise in operational profits. For instance trading profits of the public sector
banks shot up by Rs.3749 crores taking their net profits to an all time high of Rs.8301
crores in FY02.The enactment of Securitization Bill offered great opportunities to set up
loan recoveries that could further enhance the scope of greater profitability. These
developments have impacted the performance of bank stocks significantly and the bank
stocks are emerging as a major segment in the equity market.
The project titled “Security Analysis and Portfolio Management of Five Major
Players in Banking Sector is an attempt to analyze the Indian banking companies by
taking up fundamental analysis and technical analysis along with creating different mix of
portfolio within the selected securities. Fundamental analysis involves finding the intrinsic
Department of Management Science [9] MES College of Engineering

Project Report 2010 Cochin Stock Exchange
value of the selected banking shares. It is also done to indentify the misprice share there by
assisting the prospective investor in making the buy or sell decision.
It is rare to find investor investing their entire savings in a single security. Instead,
they tend to invest in a group of securities called portfolio. Creation of portfolio helps to
reduce risk without sacrificing returns. The risk and return characteristics of portfolio differ
from those of individual securities combining to form a portfolio.
The project also examines the performance of various portfolio based on (1) Equal
Weight (2) P/E Ratio (3) Market Capitalization along with the performance evaluation by
Sharpe and Treynor Ratio.
Out of the ten companies, which were taken on the basis of market capitalization
from the BSE list and ranked accordingly, five were selected to conduct a detail study. Thus
the study is limited to five selected banking companies in India, they are;
STATE BANK OF INDIA
ICICI BANK
HDFC BANK
AXIS BANK
PUNJAB NATIONAL BANK
STATEMENT OF THE PROBLEM
A study on Security analysis, Portfolio construction and selection of securities from
the Indian banking Industry is undertaken to construct, analyze, select and evaluate a
portfolio consisting of five scrips from this sector to check whether the security analysis
and portfolio construction and selection helps an investor to reduce risk and achieve
efficiency in investment.
Department of Management Science [10] MES College of Engineering

Project Report 2010 Cochin Stock Exchange
OBJECTIVES OF THE STUDY
To construct analyse, select and evaluate a portfolio consisting of five major selected
players in the Banking Industry.
To compute the intrinsic value of selected securities from Banking industry using
fundamental analysis and recommend for buy or sell option
To undertake the technical analysis of the securities and interpret them.
To recognize the suitability of the share for investment in long term.
SIGNIFICANCE OF THE STUDY
This demands the investors to be rational and scientific in his investment activity.
As such he needs to evaluate a lot of information about the past performance and the
expected future performance of the company, industry as a whole before taking the
investment decision. So the study will be helpful in finding the intrinsic value of the shares
and make decisions in their investments in Banking Sector. Optimal portfolio can be
selected using this study among the different portfolio basis in the Banking Sector. The
study will be a guide to other scholars and researchers in doing similar study in other
industries.
SCOPE OF THE STUDY
The scope of the study is limited to five selected banking companies in India. Investor
will be able to take right decision in case of investment which is already made in the
scrip of banking companies whether it is wise to hold on or to sell the shares.
The study helps the CSE in making assumptions regarding the performance of banking
industry in the stock market
The project will be helpful for other researchers and scholars in having a detailed study
regarding the performance of banking industry.
The study is done from April 18th to June 2nd 2010.
Department of Management Science [11] MES College of Engineering

Project Report 2010 Cochin Stock Exchange
LIMITATIONS
The study was conducted only for a short period of 45 days.
Data collected were from secondary sources.
The effect of speculation, which has a direct bearing on security price is not considered.
The fundamental analysis considered the quantitative effects of company factors only,
even though the economy and industry factors significantly affect the share prices of the
shares.
The securities market, being a highly volatile one, the advice on investment options
based on this study is subject to changes.
Technical analysis was carried out using only the past eighteen month’s data.
Only five securities are used in the portfolio construction
Department of Management Science [12] MES College of Engineering

Project Report 2010 Cochin Stock Exchange
CHAPTER II
INDUSTRY PROFILE
Department of Management Science [13] MES College of Engineering

Project Report 2010 Cochin Stock Exchange
ABOUT THE INDUSTRY
CAPITAL MARKET
CAPITAL MARKET INTRODUCTION
The capital market is a market for financial assets, which have longer or
indefinite maturity. Generally, it deals with long-term securities which have maturity
period of above one year. The capital market may be further divided into three namely.
1. Industrial securities market
2. Government securities market
3. Long-term loan market
The industrial market, which deals with shares and debentures, can further
be divided into:
1. Primary market
2. Secondary Market
NEW ISSUE MARKET (PRIMARY MARKET)
Stocks available for the first time are offers through new issue market. The
issuer may be new company or an existing company. These issues may be of new type or
the security used in the past. In the new issue market the issuer can be considered as a
manufacturer. The issuing houses, investment bankers’ and brokers act as the channel of
distribution for the new issue.
SECONDARY MARKET
Secondary Market refers to a market where securities are traded after being
initially offered to the public in the primary market and / or listed on the stock Exchange.
Majority of the trading is done in the secondary market. Secondary market comprises of
equity markets and the debt markets.
Department of Management Science [14] MES College of Engineering

Project Report 2010 Cochin Stock Exchange
STOCK EXCHANGE
Stock Exchange is an organized marketplace where securities are traded. These
securities are by the government, semi-government Bodies, Public sector undertakings and
companies for borrowing funds and raising resources. Securities are defined as monetary
claims and include stock, shares, debentures, bonds etc. If these securities are marketable
as in the case of Government stock, they are transferable by endorsement and are like
movable property. Under the securities Contract Regulation Act of 1956, securities trading
are regulated by the Central Government and such trading can take place only in Stock
Exchange recognized by the Government under this Act. At present there are 23 recognized
stock Exchanges in India. Of these major Stock Exchange, like Mumbai, Calcutta, Delhi,
Chennai, Hyderabad, Bangalore etc. are permanently recognized while a few are
temporarily recognized.
NATIONAL STOCK EXCHANGE (NSE)
With the liberalization of the Indian economy, it was found inevitable to lift the
Indian stock market trading system on par with the international standards. On the basis of
the recommendations of high powered Pherwani Committee, the National Stock Exchange
was incorporated in 1992 by Industrial Development Bank of India, Industrial Credit and
Investment Corporation of India, Industrial Finance Corporation of India, all Insurance
Corporations, selected commercial banks and others.
Trading at NSE can be classified under two broad categories:
(a) Wholesale debt market and
(b) Capital market.
Wholesale debt market operations are similar to money market operations -
institutions and corporate bodies enter into high value transactions in financial instruments
such as government securities, treasury bills, public sector unit bonds, commercial paper,
certificate of deposit, etc.
There are two kinds of players in NSE:
(a) Trading members
Department of Management Science [15] MES College of Engineering

Project Report 2010 Cochin Stock Exchange
(b) Participants.
Recognized members of NSE are called trading members who trade on behalf of
themselves and their clients. Participants include trading members and large players like
banks who take direct settlement responsibility.
Trading at NSE takes place through a fully automated screen based trading
mechanism, which adopts the principle of an order driven market. Trading members can
stay at their offices and execute the trading, since they are linked through a communication
network. The prices at which the buyer and seller are willing to transact will appear on the
screen. When the prices match the transaction will be completed and a confirmation slip
will be printed at the office of the trading member.
OVER THE COUNTER EXCHANGE OF INDIA (OTCEI)
The traditional trading mechanism prevailed in the Indian stock markets gave way
to many functional inefficiencies, such as, absence of liquidity, lack of transparency,
unduly long settlement periods and binami transactions, which affected the small investors
to a great extent. To provide improved services to investors, the country's first ring less,
scrip less, electronic stock exchange OTCEI - was created in 1992 by country's premier
financial institutions – UTI, ICICI, and IDBI etc.
Trading at OTCEI is done over the centers spread across the country. Securities
traded on the OTCEI are classified into:
i. Listed Securities
The shares and debentures of the companies listed on the OTC can be bought or
sold at any OTC counter all over the country and they should not be listed anywhere else
ii. Permitted Securities
Certain shares and debentures listed on other exchanges and units of mutual funds
are allowed to be traded
iii. Initiated debentures
Department of Management Science [16] MES College of Engineering
Project Report 2010 Cochin Stock Exchange
Any equity holding at least one lakh debentures of particular scrip can offer them
for trading on the OTC.
BOMBAY STOCK EXCHANGE (BSE)
The Stock Exchange, Mumbai, popularly known as "BSE" was established in 1875
as "The Native Share and Stock Brokers Association". It is the oldest one in Asia, even
older than the Tokyo Stock Exchange, which was established in 1878. It is a voluntary non-
profit making Association of Persons (AOP) and is currently engaged In the process of
converting itself into demutualised and corporate entity. It has evolved over the years into
its present status as the premier Stock Exchange in the country. It is the first Stock
Exchange in the Country to have obtained permanent recognition in 1956 from the Govt. of
India under the Securities Contracts (Regulation) Act, 1956.
The Exchange, while providing an efficient and transparent market for trading in
securities, debt and derivatives upholds the interests of the investors and ensures redresses
of their grievances whether against the companies or its own member- brokers. It also
strives to educate and enlighten the investors by conducting investor education
programmers and making available to them necessary informative inputs.
A Governing Board having 20 directors is the apex body, which decides the policies
and regulates the affairs of the Exchange. The Governing Board consists of 9 elected
directors, who are from the broking community (one third of them retire every year by
rotation), three SEBI nominees, six public representatives and an Executive Director &
Chief Executive officer and a Chief Operating Officer. The Executive Director as the Chief
Executive Officer is responsible for the day-to-day administration of the Exchange and he
is assisted by the Chief Operating Officer and other Heads of Departments.
BANKING IN INDIA
Banking in India originated in the last decades of the 18th century. The oldest bank
in existence in India is the State Bank of India, a government-owned bank that traces its
origins back to June 1806 and that is the largest commercial bank in the country. Central
Department of Management Science [17] MES College of Engineering
Project Report 2010 Cochin Stock Exchange
banking is the responsibility of the Reserve Bank of India, which in 1935 formally took
over these responsibilities from the then Imperial Bank of India, relegating it to commercial
banking functions. After India's independence in 1947, the Reserve Bank was nationalized
and given broader powers. In 1969 the government nationalized the 14 largest commercial
banks; the government nationalized the six next largest in 1980.
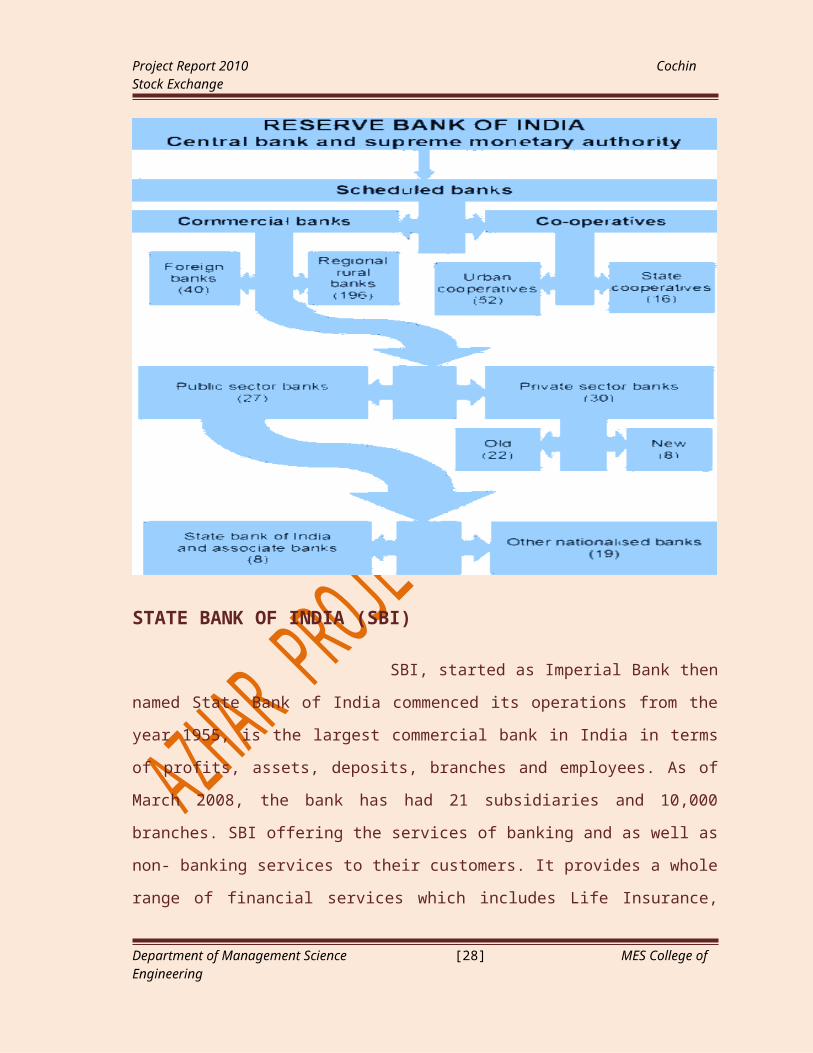
Currently, India has 88 scheduled commercial banks (SCBs) - 27 public sector
banks (that is with the Government of India holding a stake), 31 private banks (these do not
have government stake; they may be publicly listed and traded on stock exchanges) and 38
foreign banks. They have a combined network of over 53,000 branches and 17,000 ATMs.
According to a report by ICRA Limited, a rating agency, the public sector banks hold over
75 percent of total assets of the banking industry, with the private and foreign banks
holding 18.2% and 6.5% respectively.
Currently (2007), banking in India is generally fairly mature in terms of supply, product
range and reach-even though reach in rural India still remains a challenge for the private
sector and foreign banks. In terms of quality of assets and capital adequacy, Indian banks
are considered to have clean, strong and transparent balance sheets relative to other banks
in comparable economies in its region. The Reserve Bank of India is an autonomous body,
with minimal pressure from the government. The stated policy of the Bank on the Indian
Rupee is to manage volatility but without any fixed exchange rate-and this has mostly been
true.
Department of Management Science [18] MES College of Engineering

Project Report 2010 Cochin Stock Exchange
CHART No.1
STATE BANK OF INDIA (SBI)
SBI, started as Imperial Bank then named State Bank of India commenced
its operations from the year 1955, is the largest commercial bank in India in terms of
profits, assets, deposits, branches and employees. As of March 2008, the bank has had 21
subsidiaries and 10,000 branches. SBI offering the services of banking and as well as non-
banking services to their customers. It provides a whole range of financial services which
includes Life Insurance, Merchant Banking, Mutual Funds, Credit Cards, Factoring,
Security Trading & Primary dealership in the Money market. The Bank is actively involved
in non-profit activity called community services banking apart from its normal banking
activity.
Department of Management Science [19] MES College of Engineering

Project Report 2010 Cochin Stock Exchange
The bank also concentrate in agriculture, for that it took initiative spotlight kharif
and spotlight rabi campaigns for higher disbursement. It introduced Automated Teller
Machine with Kishan Credit Cards in all circles to assist agriculture peoples, cumulatively
the bank has credit linked 7.68 Lac. Self Help Groups and disbursed loans to the extent of
Rs 3,468 Crs. so far. In the year 2001 the SBI Life was started. SBI is the only Bank to
have been permitted a 74% stake in the insurance business. The Bank's insurance
subsidiary "SBI Life Insurance Company" is a joint venture with Cardif S.A holds 26%
stake. SBI Life enjoys the unique distinction of being the first private sector life insurance
company in India to make profits for two consecutive years.
During the year 2004-05 SBI was the only one bank in India to ranked among top
100 banks in the world and also among the top 20 banks in Asia in the annual survey by
"The Banker" as well as in the same year bank received two prestigious awards for
technology from the same The Banker magazine. In the year 2005-06 the bank introduced
"SBI e-tax" an online tax payments facility for direct and indirect tax payment, the
centralized pension processing center also launched during the year. SBI made a
partnership with Tata Consultancy Services for setup C-Edg Technologies and consulting
services to the banking, financial services and insurance industry. The bank noted as The
most preferred bank in a survey by TV 18 in association with AC Nielsen-ORG Marg
along with SBI voted as The most preferred housing loan provider in AWAAZ consumer
awards for 2006. In the customer loyalty survey 2006-07 conducted by "Business World",
SBI has been ranked number One in all parameters of customer satisfication, service
orientation, customer care/ call center, customer loyalty and home loans. SBI Funds
(SBIFMPL) was judged "Mutual fund of the year" by CNBC/TV-18/CRISL. SBI FMBL
Equity schemes won 11 awards and ranging of the AMC in terms of Assets under
management remained at 7th position during the year 2006-07. SBI cards is in 2nd position
in the country under market share. During the year 2006-07 14.81 lac additional cards were
issued by SBI and they crossed the landmark of 3 million cards totally.
The strategic initiatives that SBI have launched business groups in 2007 namely
rural and agri business; treasury and marketing; corporate strategy and new business; and
fourth mid corporate group is on the anvil. They also introduced new products and services
Department of Management Science [20] MES College of Engineering
Project Report 2010 Cochin Stock Exchange
such as web-based remittance, instant fund transfer, online-trading, comprehensive cash
management.
SBI opened its 10,000th branch in March 2008; it becomes only the second bank in
the world to have more than 10,000 branches after China's ICBC. SBI is pursuing
aggressive IT policy, where the Automated Teller Machines are now also enabled to pay
utility bills, college fees, book air-line tickets and accept donations, further bilateral sharing
of ATMs was extended to thirteen banks covering 15,700 Automated Teller Machines and
an Memorandum of Understanding has been signed with the Indian railways for installing
ATMs at 682 railway stations. Infrastructure fund, private equity, venture capital and
pension fund management are under in process to assist the customer in time. SBI is
targeting to emerge as the best rated bank among public, private, foreign and state -owned
banks by the end of the next fiscal. Employee Stock Option Scheme, where employees
have the option to pick up shares as per their needs is avail in SBI. SBI plans to implement
the mobile banking technology will soon with aim of customer will no be just "Branch
customers" but will be "Bank customer
ICICI BANK LTD.
ICICI Bank, a private sector bank under the house of ICICI was incorporated in the
year of 1994. It is a multi-specialist financial service provider with leadership position
across the spectrum of financial services in India. ICICI Bank is the 2nd largest bank in
India and Bank breaking into the top 100 financial institutions in the world, in terms of
market capitalization. It got this position in short time, because the bank doing what
customers want. ICICI running its business with six principal groups, such as Retail
Banking, Wholesale Banking, International Banking, Rural, Micro Banking and Agri-
Business, Government Banking and Corporate Centre. The Bank offers a wide spectrum of
domestic and international banking services to facilitate trade, investment
banking ,Insurance, Venture Capital, asset management, cross border business & treasury
and foreign exchange services besides providing a full range of deposit and ancillary
services for both individuals and corporate through various delivery Channels and
specialized subsidiaries. ICICI Bank has 14 subsidiaries, out of that 10 in domestic and rest
Department of Management Science [21] MES College of Engineering

Project Report 2010 Cochin Stock Exchange
of 4 in international level such as UK, Canada and Russia. To efficiently distribute its
products and services, the bank has developed multiple access channels comprising lean
brick and mortar branches, ATMs, call centers and Internet banking. The Bank has
introduced the concept of mobile ATMs in the remote/rural areas. It has also extended its
mobile banking services to all cellular service providers across India and NRI customers in
USA, UK, Middle-East and Singapore.
The merger and acquisition are the key kind to bank. The Bank of Madura (BOM)
got merged with ICICI Bank during the period 2000-01 and in 2001 ICICI (Financial
Institution) merged with ICICI Bank. The two subsidiaries of ICICI Ltd viz ICICI Personal
Financial Services and ICICI Capital Services were also merged with the ICICI Bank on
March 2002. During May,2003 the bank has acquired Transamerica Apple Distribution
Finance Private Ltd and renamed it to ICICI Distribution Finance Private Limited which is
primarily engaged in financing in the two-wheeler segment.
Bank received many awards and recognitions during the year 2005-06. Some of
them are Best Bank in India by Euro money, Best Integrated Consumer Bank Site in Asia
by Global Finance, Best Cash Management-Country Awards in India by The Asset and
Best Secondary Offering by Finance Asia. ICICI Bank noted as Bank of the year 2006
India by The Banker, it was a award to ICICI Bank at second time from last year. During
the year 2006-07 also Bank acquired the number of awards. Samples are, Best Transaction
Bank in India by Asset Triple AAA, Best Bank of the Year 2006 by Business India,
National Award for Excellence in Energy Management by CII and Excellence in Multi
Channel Distribution by Asian Banker.
As on April 2007 Sangli Bank Ltd was merged with ICICI Bank Ltd. In the
Wholesale Banking segment, the bank has achieved a significant milestone in the market
making activity by expanding the product suite to include foreign exchange options. As on
May 2007 the bank have market capitalization of Rs 77,834 crore. In 2007 June ICICI
Bank has entered into an agreement with networking solutions provider GTL Ltd to lease
out its call centre facility at Mayhap worth of around Rs 100 crore for a period of 25 years.
In August of 2007 the bank has availed of a $200-million worth Line of Credit (LoC) from
The Export-Import Bank of Korea (Korea Exim bank) for the purpose of the Hong Kong
Department of Management Science [22] MES College of Engineering

Project Report 2010 Cochin Stock Exchange
branch of ICICI Bank gets funds from Korea Exim bank, and the bank lends foreign
currency loans to domestic companies investing in Korea and the bank had taken a similar
LoC of $200 million from the Japan Bank for International Cooperation (JBIC) last year. In
2008 ICICI Bank, come a cropper in the global stage when it comes to their brand value,
which is $2,603 million, it reveals by the study of London-based consultancy Brand
Finance.
HDFC BANK LTD.
HDFC Bank, a private sector bank was incorporated in the year of 1994 by Housing
Development Finance Corporation Limited (HDFC), India's premier housing finance
company. HDFC was amongst the first to receive an 'in principle' approval from the
Reserve Bank of India (RBI) to set up a bank in the private sector. The Bank commenced
its operations as a Scheduled Commercial Bank in January 1995 with the help of RBI's
liberalization. HDFC Bank deals with three key business segments - Wholesale Banking
Services, Retail Banking Services, Treasury. It has entered the banking consortia of over 50
corporate for providing working capital finance, trade services, corporate finance and
merchant banking. It is also providing sophisticated product structures, sound advice and
fine pricing mainly in areas of foreign exchange and derivatives, money markets and debt
trading and equity research through its state-of-the-art dealing room.
Notable event was happened in the history of bank as well as Indian banking sector
in Feb. 2000, the Times Bank was amalgamated with HDFC bank. This was an important
milestone, being the first merger of two private sector banks. HDFC Bank was the first
Bank to launch an International Debit Card in association with VISA (Visa Electron). The
Bank launched its Credit Card business in 2001. In the same year HDFC Bank has became
the first private sector bank to be authorized by the Central Board of Direct Taxes (CBDT)
as well as the RBI to accept direct taxes. The taxes accepted at specified branches of the
bank. Also it has announced a strategic tie-up with a Bangalore-based business solutions
software developer Tally Solutions Pvt (TSPL) for developing and offering products and
services facilitating on-line accounting and banking services to SMEs (Small and Medium
Enterprises). In 2001-02 the bank was listed on the New York Stock Exchange in the form
Department of Management Science [23] MES College of Engineering
Project Report 2010 Cochin Stock Exchange
of ADS and bank had alliance with LIC for provide online payment of insurance premium
to the customers.
Bank received plenty of awards to its credit, in the year 2003 bank received "Best
Local Bank in India" by Finance Asia, "Best Domestic Bank in India Region" in The Asset
Triple A Country Awards 2003. Apart from this, 'Best Bank in the Private Sector' for the
year 2003 in the Outlook Express Awards, 'Best New Private Sector Bank 2003' by the
Financial Express in the FE-Ernst & Young Best Bank's survey 2003. It was also figured in
the 'Best Under a Billion, 200 Best Small Companies for 2003' by Forbes Global and for
use of information technology the bank was awarded with 'Best IT user in Banking' at the
IT User Awards 2003 conferred by Economictimes.com & Nasscom. In the year of 2004 to
2005, "Best Domestic Commercial Bank" & "Best Cash Management Bank"- India- Asia
money Awards for Corporate Excellence of 2004-05, "Best Bank" - India - Finance Asia,
"Company of the Year "- The Economic Times Awards for Corporate Excellence 2004-05,
"Best Domestic Bank in India" - The Asset Triple A Country Awards 2005, "Most
Customer Responsive Company- Banking and Financial Services" - The Economic Times -
Avaya Global Connect Customer Responsiveness Awards 2005. During the year of 2006-
07 also bank received number of awards, The Asian Banker Achievement Award, Best
Listed Bank of India in 2006 by Business World, Euro money Award as Best Bank in
India, One of Asia Pacific's Best 50 Companies in 2006 by Forbes Magazine, Asia money
Award for Best Local Cash Management in Large and Medium segments, other than above
bank received " Best Bank in India " award continuously from the year 2003 to 2007
conferred by the magazine Business Today. The Financial Express rated 1st in India's Best
Banks 2007 under New Private Sector Bank under along with Axis Bank.
As on 2007 May, The Reserve Bank of India has allowed HDFC Bank to start a non
banking finance company. The NBFC, to be set up by HDFC Bank as a wholly owned
subsidiary and will undertake retail operations such as auto, personal loans etc.. As part and
apart from the regular banking activity, HDFC Bank and The Institute for Technology and
Management (ITM), Chennai gone under Memorandum of Understanding to promote co-
operation advancement of academic and business exchanges between the two.
Department of Management Science [24] MES College of Engineering
Project Report 2010 Cochin Stock Exchange
AXIS BANK LTD.
AXIS Bank is one of the fastest growing bank in private sector. It was incorporated
in the year 1993 as "The Bank (UTI BANK LIMITED) ", which provided corporate and
retail banking products and was among the few banks to be granted a license under the new
guidelines issued in 1993 to carry on banking business in India. AXIS Bank formerly
known as UTI Bank is being promoted by Unit Trust of India (UTI), Life Insurance
Corporation of India (LIC), General Insurance Corporation of India (GIC) and its four
subsidiaries. The bank had two subsidiaries namely UBL Sales Limited and UBL Asset
Management Company and were incorporated in the year 2005 and 2006 respectively.
The bank has restructured its business into four strategic profit centers such as
Corporate, Retail, Merchant & Treasury Banking and Further the bank also provide mobile
banking services and mobile refill facilities for Airtel,Hutch, Orange and Idea cellular
service providers. In fact the bank is among the few Indian banks to have completely
centralized its database which enables possible for the bank to increasingly e-enable its
transaction processing capabilities.
In the year 2001,the bank along with Global Trust Bank (GTB) had a merger
proposal to create the largest private sector bank in swap ratio of 9 shares of UTI Bank for
4 shares of GTB but due to media's issues both the banks withdraw he merger proposal.
2003 was the year to AXIS, the bank was authorized to handle Government transactions
such as collection of Government taxes, to handle the expenditure related payments of
Central Government Ministries and Departments and pension payments on behalf of Civil
and Non-civil Ministries such as defense, posts, telecom and railways and AXIS is the first
private sector bank to be authorized for collection of Commercial Taxes in twin cities of
Hyderabad & Secunderabad. The bank has launched pre-paid Dollar denominated card
which is useful for outbound travelers and has tied up with 14 major full-fledged
moneychangers to market the cards and the 1st Indian bank to offer the International Travel
Currency Card and.
The bank raised $239.3 million through Global Depositary Receipts in 2005 and in
the same year the bank has won the award 'Outstanding Achievement Award' for the year
2005 from Indian Banks Association for IT Infrastructure, delivery capabilities and
Department of Management Science [25] MES College of Engineering
Project Report 2010 Cochin Stock Exchange
innovative solutions. In the year of 2007 the bank again raised $218.67 million through
Global Depository Receipts. The bank has rated 1st rank under new private sector banks in
India's Best Banks for the year 2007 by The Financial Express magazine (The Express
Group).
In 2007, the bank has opened 153 new branches. This includes 43 extension
counters that have been upgraded to branches and the setting up of 8 Service
branches/CPCs. The Bank has opened four new overseas offices, with branches at
Singapore, Dubai and Hong Kong and a representative office in Shanghai and has signed
an agreement with the Luxembourg-based bank Banque Privee Edmond de Rothschild
Europe provide wealth management solutions to overseas Indians. 450 ATMs are opened
during the year of 2007. The total network of the bank as on April 2008, a customer base of
90 lakh, 655 branches in more than 407 cities and towns, 20 extension counters and 2778
ATMs across the
PUNJAB NATIONAL BANK
Punjab National Bank (PNB), established in the year 1895 at Lahore, undivided
India, has the distinction of being the first Indian bank to have been started solely with
Indian capital. The bank was nationalized in July 1969 along with 13 other banks. From its
modest beginning, the bank has grown in size and stature to become a front-line banking
institution in India at present. With its presence virtually in all the important centers of the
country, Punjab National Bank offers a wide variety of banking services which include
corporate and personal banking, industrial finance, agricultural finance, financing of trade
and international banking. Among the clients of the Bank are Indian conglomerates,
medium and small industrial units, exporters, non-resident Indians and multinational
companies.
A package was developed for corporate customers for fast remittance of funds from
different up-country branches to the controlling office during the year 1996. The Bank has
introduced a scheme for providing finance against mortgage of immovable property in the
year 2000. It commenced its Gold Business in the form of Gold Import Scheme in
September of the same year 2000. An International Co-branded Credit Card of Punjab
National Bank and Hongkong & Shanghai Banking Corporation (HSBC) was launched in
Department of Management Science [26] MES College of Engineering

Project Report 2010 Cochin Stock Exchange
New Delhi in November of the year 2000. The scheme offers international quality gold for
sale to the Bank's clientele consisting of exporters and others at competitive prices. PNB
came out with its first Initial public offer (IPO) in March 2002 for 5,30,60,700 equity
shares of Rs 10 each. During the year 2002, the bank started its branch in M.G. Road,
Bangalore named as Mid-Corporate Branch (MCD) to provide its corporate clients with a
credit limit of Rs 3.5 crore and above. PNB made joint venture with Infosys for the
implementation of a Centralized Banking Solution for it. The Bank received the Best Bank
Award' for excellence in banking technology. PNB tied up with Cisco Systems for
networking 3,870 branches as part of its Rs 150 crore plan.
PNB has taken over Kozhikode-based Nedungadi Bank Ltd (NBL) in February of
the year 2003. The Bank has entered into an alliance with New India Assurance for selling
its general insurance products in the same year 2003. In June of the year 2003, PNB made
Memorandum of Understanding (MoU) with Principal Financial Services Inc. (USA) and
Vijaya Bank for joint venture partnership in Life Insurance, Pensions and Asset
Management’s (MF) business. The Bank has formed a strategic alliance with Infrastructure
Leasing and Financial Services Ltd (IL&FS) to set up a private equity fund for investing in
domestic companies. Entered an agreement with Oriental Bank of Commerce, Indian Bank,
UTI Bank and Global Trust Bank for sharing ATMs spread across the country. In the year
2004, PNB acquired the assets of Hindustan Transmission Product Limited (HTPL) under
Sarfaesi. The Bank had signed a corporate agency agreement with Export Credit Guarantee
Corporation of India Ltd (ECGC) for marketing ECGC's export credit insurance products
through the network of the bank's branches. A MoU was signed for the deployment of
various IT-related solutions between the bank and Intel. PNB and ICICI Bank had signed a
MoU for ATM network sharing. PNB implements Loans and Advances Data Desk for
Evaluations and Reports, (LADDER) system for rationalization of returns, asset
classification and provisioning, credit monitoring and NPA management.
The Bank has mandated the project worth of Rs 5-10 crore to Tata Consultancy
Services (TCS) for implement human capital management and payroll solution in the year
2004. The Bank branch at Kabul, Afghanistan has commenced soft opening on July 26th of
2004. PNB has launched its corporate Internet banking facility during November of the
Department of Management Science [27] MES College of Engineering
Project Report 2010 Cochin Stock Exchange
year 2004. PNB has coveted as Best IT User in Banking & Financial Services Industry -
2004 - by NASSCOM in partnership with Economic Times. The Bank had unveiled ATM
at Edappal in the year of 2005. PNB had adjudged with Golden Peacock Award - for
Excellence in Corporate Governance - 2005 by Institute of Directors. During 2005-06, the
bank revamped its organizational structure. Seven new Zonal Offices were created. The
Bank received 'Best IT Team of the Year Award' - at the IDRBT Banking Technology
awards for the year 2005-06.
During the year 2006, PNB had tied up with MasterCard International to launch a
signature-based debit card and opened one new branch in Uttaranchal. Also during the
same year of 2006, the bank has made tie up with Indian Airlines for online booking of air
tickets and ties up with IDBI Capital. PNB had entered into MoU with India Infrastructure
Finance Company (IIFC) in October of the year 2007 with an aim to extend its cooperation
and support to IIFC in areas of creating a deal flow of infrastructure projects. RBI rejected
Punjab National Bank's proposal to float a credit card joint venture with insurer American
International Group Inc. (AIG) and Venture InfoTech Global Pvt. Ltd, a third-party
processor for credit card companies.
PNB aims to expand its base in the entire northern India region for providing
banking facilities at the doorsteps of the peoples. The Bank is serving over 3.5 crores
customers through 4540 Offices including 421 extension counters - largest amongst
Nationalized Banks. PNB is moving with the vision, to be India's most profitable Universal
Bank. Also wants to profitably serve the banking and the financial services needs of the
nation everyday and everywhere.
Department of Management Science [28] MES College of Engineering

Project Report 2010 Cochin Stock Exchange
CHAPTER III
COMPANY PROFILE
ABOUT THE COMPANY
COCHIN STOCK EXCHANGE (CSE)
Cochin Stock Exchange limited is one of the premiers Stock Exchange in India.
Established in 1978, the exchange has undergone tremendous transformation over the
years. The exchange had a humble start with just 5 companies getting listed in 1978-79 and
at time of its incorporation it had only 14 members. Today the exchange has 508 members
and 240 listed companies. In 1989 the company went for computerization of its offices. In
order to keep pace with the changing scenario in the capital market CSE took various
Department of Management Science [29] MES College of Engineering

Project Report 2010 Cochin Stock Exchange
initiatives including initiating trading in dematerialized shares. This has effected in the
purpose of bad deliveries coming down.
CSE introduced the facility of computerized trading called" Cochin Online Trading.
(COLT) on March 17, 1997. CSE also became a member with an objective of consolidating
the small, fragmented and less liquid markets into a national legal integrated liquid market.
With the enforcement of efficient margin system and surveillance CSE has successfully
prevented major defaults. Introduction of Fast Track System made CSE the stock exchange
with shortest settlement cycle in the country. The Cochin Stock Exchange (CSE) has been
playing a very vital role in the economic development of the country in general and Kerala
in particular.
Right from the beginning CSE has been striving hard so as to achieve the following
goals:
Providing investors with high level of liquidity where by the cost and time involved
in the entry and exit from the market becomes the least.
Bring in high tech solutions and make possible absolute transparency of all
operations.
Spread equity cult and to serve investors of the region.
Professional stock broking and investment management function.
Impart capital market knowledge to all intermediaries on a continuous basis.
ORGANISATIONAL STRUCTURE
Chart No.2
ORGANIZATIONAL STRUCTURE
Department of Management Science [30] MES College of EngineeringLegal Systems Members
hipSettlement
Listing Listing
BOARD OF DIRECTORS
EXECUTIVE DIRECTOR
Marketing and Public Relations
Finance
Project Report 2010 Cochin Stock Exchange
DEPARTMENTAL PROFILE
LEGAL DEPARTMENT
CSE has a full-fledged Legal Department, headed by Manager-Legal and is primarily
engaged in advising the management in the merits and demerits of legal issues involving the
exchange.
A major function undertaken by the department is to ensure that the various rules,
regulations and directives of SEBI with regard to trading in the Capital Market by brokers and
sub-brokers, are brought to the notice to members and the investing public. Manager-Legal is
the compliance officer as per the provisions of SEBI regulations and ensures strict compliance
of SEBI directives and guidelines.
Manager-Legal also functions as secretary to the board of directors. The three
important areas being looked after by the legal department are:
(a) Investor Grievance Service
(b) Arbitration
(c) Default
SYSTEM DEPARTMENT
It is the heart of the various operations of CSE. The department provides the
necessary technical supports for screen based trading and the computerized functioning of
all other departments.
Department of Management Science [31] MES College of Engineering

Project Report 2010 Cochin Stock Exchange
The various activities of the department include: -
Developments of various software needed for the functioning of the
exchange.
Maintenance of Multex software, which provides online trading with NSE
and BSE.
The major back office system soft wares used are NESS and BOSS for NSE and
BSE trades calculations respectively. These soft wares are developed in-house by CSE.
These soft wares are used to maintain the entire records of all the trades that occur each day.
It also does all the required calculations for deductions and also creates all kinds of reports
needed by the brokers and their clients.
SETTLEMENT DEPARTMENT
Settlement department is a key department of the CSE. It is dealing with cash and
securities. It helps the broker in setting the matters related to their pay-in and payout,
recovery of dues and settling the matters related to the bad deliveries. This department is
headed by a Deputy Manager and assisted by two senior officers who look into the
operations involved in the settlement activities in CSE. CSE is following T+2 settlement
system (where T- dates of transaction).
SURVEIALLANCE DEPARTMENT
The Exchange has set up Surveillance Department to keep close watch on price
movements of scrip, detect market abuses like price rigging, monitor abnormal prices and
volumes which are not consistent with normal trading pattern etc. The main objectives of
the department are to provide a free and fair market, to arrest unsystematic risk from
entering into the system and to manage risks. The surveillance function at the exchange has
assumed greater importance in the last few years. SEBI has directed the stock exchanges to
setup a separate surveillance department with staff exclusively assigned for this function.
It also offers services like:
Department of Management Science [32] MES College of Engineering

Project Report 2010 Cochin Stock Exchange
Keeping a close watch on the price movement of scrip’s.
Detect market manipulations like price rigging.
ADMINISTRATION DEPARTMENT
A legal officer with two Deputy Managers for administration and compliance and
management information system heads the department. Two senior officers looking after
public relations and administration form part of administration.
The major activities of this department include: -
Organizing council meeting, annual general meeting, extra ordinary general
meeting, council meetings etc.
Looking after the admission and expulsion of members.
Taking care of all related functions needed for the smooth functioning of the
exchange including regular payments of rent, bills, taxes, public relations etc.
Giving necessary guidelines and support to students and other who visit the
exchange for various activities.
LISTING
Listing means admission of the securities of a company to trading privileges on a
Stock Exchange. The principal objectives of listing are to provide ready marketability and
impart liquidity and free negotiability to stocks and shares; ensure proper supervision and
control of dealings therein; and protect the interests of shareholders and of the general
investing public.
FINANCE DEPARTMENT
This department takes care of the various financial transactions of CSE thus acting
as the life line of the organization. The department is headed by a Finance officer and
assisted by a Deputy Manager and several senior and junior officers.
The major activities of the department include:
Annual Report Generation
Fund Management
Interaction with bankers
Department of Management Science [33] MES College of Engineering
Project Report 2010 Cochin Stock Exchange
Keeping general accounts of the CSE and Taxation
Maintaining of payrolls and cash register
Budgeting and Expense research
Maintenance of internal control system
Interaction with external and internal audits
Department of Management Science [34] MES College of Engineering
Project Report 2010 Cochin Stock Exchange
CHAPTER IV
LITERATURE REVIEW
LITERATURE RIVIEW
As per the study of P Janaki Rao and S Durga Rao Investment decisions, in all
sectors, have been gaining paramount importance, warranting the investors to be
continuously cautious of risk and return involved in the same. The faculty ‘investment
analysis’ calls for planned and meaningful appraisal of both internal and external factors
affecting the returns. Ever since Indian economy opened its doors to MNCs, the Indian
banking sector has been witnessing bizarre changes in terms of new products and services
and stiff competition as well. The sort of IPOs that have been taking place in banking
sector are amazing. In the light of these recent developments, a careful analysis of the
profitability of Indian banking sector is inevitable. The present study attempts to analyze
the profitability of the three major banks in India: SBI, ICICI, and HDFC. The variables
taken for the study are Operating Profit Margin (OPM), Net Profit Margin (NPM), Return
Department of Management Science [35] MES College of Engineering

Project Report 2010 Cochin Stock Exchange
on Equity (RoE), Earnings per Share (EPS), Price Earnings Ratio (PER), Dividends per
Share (DPS), and Dividends Payout Ratio (DPR). The study brings out the comparative
efficiency of SBI, ICICI, and HDFC.
As per the study of Prof VR Ganesh in his article ‘Analysis Of Banking Industries’
he explains, the banking industry is and always has been one of the most important aspects
of all industries. The reason being, every other industry needs banks to take part in any
investments or financial movements as a way to better their position in their industries.
We will look at how and why the banking industry has been able to hold this position for so
long through the Competitive Landscape, Porter’s Five Forces Analysis, Major Segments
of the Industry, the Industry Life cycle, and The PESTEL Factors. These tools will help
provide data and a thorough analysis of the performance in the banking industry. Within
the banking industry there are a lot of competitors which offer the same services but for
some reason some are doing better than others. A Strategic Group Analysis has been done
to show the comparison between top competitors.
As per the study of Sree Ram G Banking Sector in India is one of the growing
sectors with great dynamics. There are various factors which affect the share prices of
Banking Companies. This report is all about how various factors (Internal and External)
affect the Banking Sector Share Prices. In this report a detailed analysis of the factors
affecting the share prices is carried on and a model is developed to study the effect of
various factors on the share prices. Here, various internal factors (Bank‟s Profitability,
Income, Expenses, and News about the Bank.) and external factors (Government policies,
CRR, Repo Rate, Reverse Repo Rate, Rules and Regulations.) are considered which affect
the prices of the shares of Bank. Data‟s are collected for all the quantifiable factors and for
the rest factors a theoretical explanation is given in detail. Using SPSS a model is
developed which shows the regression and correlation co-efficient between the share prices
and various factors affecting the same.
According to Daniel Giamodiurs and Laonnis D Vrontos in their article studies
the impact of modeling time-varying covariances/correlations of hedge fund returns in
terms of hedge fund portfolio construction and risk measurement. We use a variety of static
and dynamic covariance/correlation prediction models and compare the optimized
Department of Management Science [36] MES College of Engineering

Project Report 2010 Cochin Stock Exchange
portfolios’ out-of-sample performance. We find that dynamic covariance/correlation
models construct portfolios with lower risk and higher out-of-sample risk-adjusted realized
return. The tail-risk of the constructed portfolios is also lower. Using a mean-conditional-
value-at-risk framework we show that dynamic covariance/correlation models are also
successful in constructing portfolios with minimum tail-risk.
According to Kwan, Clarence C.Y.A simple ranking model for optimal portfolio
construction under institutional procedures for short selling is introduced. The study
justifies this approach and offers economic insights, including those concerning short
selling's hedging impact in a portfolio context. The ranking model can be used to analyze
various treatments of the short-sale proceeds and margin deposits. It is also found to be
superior to other portfolio models in that it does not rely on assumptions that exaggerate
short-sale benefits for maintaining analytical tractability.
THEORETICAL PERSPECTIVE
SECURITY ANALYSIS
Securities analysis refers to the analysis of trading securities from the point of view
of their prices, returns and risks. All investments are risky and the expected return is related
to their risk. Their analysis will help in understanding the behavior of security prices and
the market in decision-making for investment. If it is an analysis of only one scrip, it is
called microanalysis of a company. If it is an analysis of market of securities, it is referred
to as a macro picture of the behavior of the market.
It is mainly out in two approaches namely: Fundamental analysis and Technical
analysis. Under fundamental analysis the share value depends on the intrinsic worth of the
share. It is basically an economy industry-company analysis. It considers the external as
Department of Management Science [37] MES College of Engineering

Project Report 2010 Cochin Stock Exchange
well as the internal factors that determine a company’s efficient functioning. In technical
analysis the price moves in a predictable manner and in waves and trends. The present
prices are the result of past trends and can accordingly be predicted. Thus securities
analysis forms the first step towards devising an efficient portfolio of securities
FUNDAMENTAL ANALYSIS
Fundamental Analysis is really a logical and a systematic approach to estimating
the future dividends and share price. It is based on the economic premise that shares price
is determined by a number of fundamental factors relating to the economy, industry and
company. Hence, the economy fundamentals, industry fundamentals and company
fundamentals have to be considered while analyzing a security for investment purpose
Each of the shares is assumed to have an economic worth based on its present and
future earning capacity. This is called its intrinsic value or fundamental value. The purpose
of fundamental analysis is to evaluate the present and future –earning capacity of the share
based on the economy, industry and company fundamentals and there by assess the
intrinsic value of the share with the prevailing market price to arrive at an investment
decision. If the market price of the share is lower than the intrinsic value, as the investor is
decide to buy the share as it is under priced. The price of such share is expected to move up
in future to match with its intrinsic value.
On the contrary, when the market price of the share is higher than its intrinsic
value, it is perceived to be over priced the market price of such share is expected to come
down in the future and hence the investor would decide to sell such a share. Fundamental
Analysis thus provides an analytical frame work for investment decision making. This
analytical frame work is known as E-I-C framework (Economy-Industry-Company
Analysis).
The fundamental Analysis insists that no one should purchase or sell a share on the
basis of tips or rumors. The fundamental approach calls up on the investor to make his buy
or sell decision on the basis of a detailed analysis of the information about the company,
Department of Management Science [38] MES College of Engineering
Project Report 2010 Cochin Stock Exchange
industry to which the company belongs, and economy. This results in informed investing.
For this the fundamental Analysis makes use of EIC framework of analysis.
Fundamental Analysis involves three steps:
1. Economy Analysis
2. Industry Analysis
3. Company Analysis
ECONOMY ANALYSIS
The performance of the company depends on the performance of the economy. If
the economy is booming, incomes rise and demand for goods will increase, the industries
and companies in general tend to be prosperous. On the other hand, if the economy is in
recession, the performance of companies will be generally bad.
Investors are considered with those variables in the economy, which affect the
performance of the company in which they tend to invest. A study of these economic
variables would give an idea about future corporate earnings and payment of dividend and
interest to investors.
Macro Economic Analysis
The macro economy is the overall economic environment in which all firms operate.
The key variables commonly used to describe the state of the macro economy are:
Growth rate of gross domestic product
Industrial growth rate and interest rates
Agriculture and monsoons
Savings and Investments
Government Budget and deficit
Price level and inflation
Balance of Payments, Forex reserves and exchange rate
Infrastructural Facilities and arrangements
Department of Management Science [39] MES College of Engineering

Project Report 2010 Cochin Stock Exchange
INDUSTRY ANALYSIS
An investor ultimately invests his money in the securities of one or more specific
companies. Each company can be characterized as belonging to an industry. The
performance of the companies would therefore, be influenced by the fortunes of the
industry to which it belongs.
At any stage of economy, there are some industries, which are fast growing and
others are stagnating or declining. If an industry is growing the companies within the
industries may also be prosperous. The performance of the companies will depend, among
other things, upon the state of industry to which they belong. Industry analysis refers to the
evaluation of the relative strength and weakness of particular industries.
COMPANY ANALYSIS
It is the final stage of fundamental analysis. The economy analysis helps the
investor a broad outline of the prospects of the growth in the economy. The industry
analysis helps the investor to select the industry in which investment would be rewarding.
Now he has to decide the company in which he should invest his money. Company
Analysis provides the answer to this question.
It deals with the estimation of return and risk of individual shares. This calls for
information. Many pieces of information influence investment decisions. Information
regarding companies can be broadly classified into two broad categories: Internal &
External. Internal information consists of data and events made public by companies
concerning their operations. The internal information sources include annual reports to
shareholders, public and private statements of officers of the company, the company’s
financial statements etc. External sources of information are those generated independently
outside the company. These prepared by investment services and the financial press.
TECHNICAL ANALYSIS
Technical analysis is the name given to forecasting technique that utilize historical
share price data. Prices of securities in the stock market fluctuate daily on account of
continuous buying and selling. Stock prices move in trend and cycles and are never stable.
Department of Management Science [40] MES College of Engineering

Project Report 2010 Cochin Stock Exchange
The rationale behind technical analysis is that share price behavior repeats itself over time
and analysts attempt to derive methods to predict this repetition. He looks at current price
data to see if any of the established patterns are applicable and, if so, extrapolations can be
made to predict the future price movements. The data used is primarily past share prices.
Other statistics such as volume of trading and stock market indices are also utilized to some
extent.
TOOLS FOR TECHNICAL ANALYSIS
Charting is the key in technical analysis and security prices are what is charted. The
charts form patterns which are studied to reveal the underlying trends. Often share price
movements are erratic and gauging the underlying trend becomes difficult. So as to
smoothen out the apparent erratic movements of share price and highlight the underlying
trend, mathematical tools are used.
EXPONENTIAL MOVING AVERAGE (EMA)
Moving averages are mathematical indicators of the underlying trend of the price
movement. An exponential moving average, also called Exponential Weighted Moving
Averages(EWMA), applies weighing factors which decrease exponentially. The weighing
for each older data point decreases exponentially, giving much importance to recent
observations while still not discarding older observations entirely.
EMA= (Current Closing Price – Previous EMA) x Factor + Previous EMA
Where Factor = 2/(n+1)
The EMA for the first day is taken as the closing price of that itself. The EMA from
the second day onwards is calculated using the above formula. A 5 day average would
indicate the short term trend. A 50 day average would indicate medium term trend and a
200 day average would represent the trend line. When the prices of the share intersects and
moves above or below this trend line, it may be taken as the sign of trend reversal.
RATE OF CHANGE INDICATOR (ROC)
Department of Management Science [41] MES College of Engineering

Project Report 2010 Cochin Stock Exchange
ROC is a popular oscillator which measure the rate of change of the current price as
compared to the price a certain number of days or weeks back.The formula used is
ROC = Current Price Price ‘n’ period ago
MOVING AVERAGES CONVERGANCE AND DIVERGENCE (MACD)
MACD is an oscillator that measures the convergence and divergence between two
exponential moving averages. It is called so as it continuously converges and diverges
away from the horizontal reference line. The reference line represents the points, where the
two EMAs have identical values. A short term EMA and long term EMA are calculated
with help of the closing price data.12 day and 48 day EMAs constitute a popular
combination. The difference between the short term EMA and long term EMA represents
the MACD.
The MACD values for different days are derived by deducting the long term EMA
for each day from the corresponding short-term EMA for the day. These MACD values are
plotted on an XY graph with MACD values on the Y axis and tome periods on X axis. The
MACD line would oscillate across the zero line.
PORTFOLIO CONSTRUCTION
Portfolio construction is the process of blending securities in a manner that they
give maximum return at a minimum of risk.
Now that the securities for inclusion in the Portfolio, we proceed with the portfolio
construction, by deciding on how much amount should the investor allocate to each
security. In the present study three different ways of allocation are chosen, based on:
1. Equal amount to the five scrips.
2. Amount in proportion to their projected Price Earnings Ratio.
3. Amount in proportion to their projected EPS.
Department of Management Science [42] MES College of Engineering
Project Report 2010 Cochin Stock Exchange
PORTFOLIO ANALYSIS
From a given set of securities, any number of portfolios can be constructed by an
investor, by choosing different set of securities and also varying the proportion of
investment in each security. A rational investor attempts to find out most efficient one from
those portfolios. The efficiency of each portfolio can be evaluated only in terms of the
expected return and risk of the portfolio as such. Thus, determining the expected return and
risk of different portfolios is a primary step in portfolio management designated Portfolio
Analysis.
PORTFOLIO RETURN
All investment are characterized by the expectation of a return. In fact, investment
is made with the primary objective of deriving a return. The return may be in the form of
yield plus capital appreciation. Different types of investment promise different rates of
return. The return from an investment depends upon the nature of the investment, the
maturity period etc.
Portfolio returns refers to the total return that may be received if the entire securities
are put together. It need not be the integration of the returns of individual securities. If the
portfolio is well diversified, the returns from the portfolio will be higher than those from
individual securities.
Portfolio return can be calculated using the following formula:
Portfolio return, Rp = ap +βp Rm
Rm = market return
PORTFOLIO RISK
Risk is the potential for variability in returns. An investment whose returns are fairly stable
is considered to be a low-risk investment where as an investment whose returns fluctuate
significantly is considered to be a high risk investment.Risk can be mainly classified into
‘systematic’ and ‘unsystematic’.Systematic risk is expressed as beta(β) and unsystematic
risk is expressed as (a).
Department of Management Science [43] MES College of Engineering

Project Report 2010 Cochin Stock Exchange
Portfolio risk refers to the risk faced due to the ivestment in the entire portfolio. The more
the diversification of the investment in various securities, the lower will be the risk.
Portfolio risk can be calculated using the following formula:
Portfolio Risk σ²p= β²p σ²m + σ²ει
CHAPTER V
RESEARCH METHODOLOGY
Department of Management Science [44] MES College of Engineering

Project Report 2010 Cochin Stock Exchange
RESEARCH METHODOLOGY
This is basically an Analytical research depends on the publicly available data.
The method used in the study is the fundamental and technical analysis of some specific
companies in banking industry. The companies are selected based on market
capitalization. The fundamental analysis includes Economic analysis, Industry analysis
and Company analysis.
SOURCES OF DATA
Data for the study is collected from the secondary sources. Data is collected from
the websites like www.bseindia.com, www.indiabulls.com, www.capitaline.com. Company
websites, books, newspapers and periodicals is also be referred to during the study.
POPULATION AND SAMPLE
According to the Indian Banking Industry estimates there are a total of 274
commercial banks operating in India out of which 223 banks are in the public sector and 51
banks are in the private sector. This total 274 banks have been taken as the population for
the study. On the basis of high market capitalization, the top five were selected to perform
the detailed study. Financial data which is relevant to 5 years is taken as the sample size
for fundamental analysis and eighteen months for technical analysis.
PERIOD OF STUDY
Department of Management Science [45] MES College of Engineering

Project Report 2010 Cochin Stock Exchange
The period of study is conducted for a period of 45 days from April 18th to June 2nd 2010.
BASIS FOR SELECTION OF COMPANIES
Out of the ten companies which were taken on the basis of high market
capitalization, the top five were selected to perform the detailed study. The ten banking
companies and their market capitalizations in the order of their ranking are given in the
table below.
Table No.1
Banks and Market Capitalization Rate
SL.NO BANKING COMPANIESMARKET CAPITALISATION as
on 31st March 2010
1 STATE BANK OF INDIA 1,31.991.55
2 ICICI BANK 97,210.81
3 HDFC BANK 84,458.26
4 AXIS BANK 67,386.42
5 PUNJAB NATIONAL BANK 51,954.08
6 BANK OF INDIA 49,632.96
7 KOTAK MAHINDRA BANK 48,376.23
8 BANK OF BARODA 42,039.21
9 CANARA BANK 33,369.75
Department of Management Science [46] MES College of Engineering

Project Report 2010 Cochin Stock Exchange
10 UNION BANK 27,329.29
TOOLS OF ANALYSIS
Fundamental Analysis: Ratios Used
Earnings per share = Profit after tax No of Equity Shares
Dividend per share = Amount declared as dividendNo. Of equity shares
Payout Ratio = Dividend Per ShareEarnings per share
Return on equity = Profit after tax Net worth
Net worth = Share capital + Reserves and Surplus
Price earnings ratio = Market price of share Earning per share
Price Earning Average = Average of the price earning range
THE INTRINSIC VALUE CALCULATION
Dividend Pay Out Ratio [DPOR] = Dividend Per Share Earnings Per Share
Department of Management Science [47] MES College of Engineering

Project Report 2010 Cochin Stock Exchange
Average DPOR for 5 years = Sum of DPOR for 5 years 5
Average Retention ratio = 1-Average DPOR
Average return on Equity = Sum of ROE for 5 years 5
Growth in equity [g] = Average Retention Ratio Average Return on Equity
Normalized Average Price Earnings ratio = Sum of PE ratios for 5 years 5
Long Term Growth Rate InDividends and Earnings = Normalized PE Ratio X Average Retention Ratio
Projected earnings per share
= Earnings per share for current year X (1+growth in equity[g])
Intrinsic value = Projected Earnings per Share Normalized Average Price Earnings RatioProjected Dividend per share = Dividend for the current year X (1+ growth in equity[g])
TECHNICAL TOOLS:
1. Mathematical Indicators:
a. Exponential Moving Average (MA):
EMA = [(current closing price – previous EMA)*factor] + previous EMA
2. Oscillators:
a. Rate of Change Indicator (ROC):
ROC = (current price / price ‘n’ periods ago.) * 100
b. Moving Average Convergence and Divergence
Department of Management Science [48] MES College of Engineering

Project Report 2010 Cochin Stock Exchange
PORTFOLIO ANALYSIS AND CONSTRUCTION
1. SHARPE RATIO
Sharpe Ratio = Rp -Rf / σp
Where,
Rp = Realized return on the portfolio
Rf = Risk free rate of return
.σp = Standard deviation of portfolio return
4. TREYNOR RATIO
Treynor Ratio = Rp – Rf / βp
Where,
Rp = Realized return on the portfolio
Rf = Risk free rate of return
.βp = Portfolio Beta
TOOLS FOR PRESENTATION
Pie Diagram
Bar Diagram
Line Graph
( Microsoft Excel 2007 and AnalyzerXL was used for making charts)
Department of Management Science [49] MES College of Engineering

Project Report 2010 Cochin Stock Exchange
CHAPTER VI
ANALYSIS
AND
INTERPRETATION
Department of Management Science [50] MES College of Engineering

Project Report 2010 Cochin Stock Exchange
The analysis is done using Fundamental analysis and technical analysis and
Portfolio Construction and evaluation is conducted to find the optimal portfolio. Five
companies were selected for the study on the basis of Market Capitalization. Five years of
data are used to do the fundamental Analysis and Eighteen months of data are selected to
do the Technical Analysis. Portfolio is constructed on the basis of Equal Weight, Market
Capitalization and PE Ratio. Treynor and Sharpe Ratio is used to evaluate the Portfolio.
ANALYSIS AND INTERPRETATION OF SBI
Table No.2
SHARE HOLDING PATTERN OF SBI
SHARE HOLDING PATTERNSHARES [%]
Foreign 94243276.00 14.84426
Institutions 93464733.00 14.72163
Govt. Holding 122428.00 0.019284
Non Promoter Corp. Hold. 28339401.00 4.46374
Promoters 377207200.00 59.41392
Public and Others 41503184.00 6.537168
Total 63,48,80,222.00 100.00
(Source: Secondary Data)
Chart No.3
Department of Management Science [51] MES College of Engineering

Project Report 2010 Cochin Stock Exchange
(Source: Secondary Data)
STATE BANK OF INDIA - RATIO ANALYSIS
Table No.3
BOOK VALUE
ITEMS 2004 – 05 2005 – 06 2006 - 07 2007 - 08 2008 – 09
Mkt.: High
Low
961.95
552.50
1378.70
684.15
2475.25
845.00
2540.00
991.10
1376.40
894.00
EPS 80.01 81.77 83.91 103.94 133.16
DPS 12.5 14.0 14.0 21.5 21.5
(Source: Secondary Data)
CHART No. 4
Department of Management Science [52] MES College of Engineering

Project Report 2010 Cochin Stock Exchange
(Source: Secondary Data)
Table No.4
PAY-OUT POLICY
ITEMS 2004 – 05 2005 – 06 2006 - 07 2007 - 08 2008 – 09
Reported EPS 80.01 81.77 83.91 103.94 133.16
DPS 12.50 14.0 14.0 21.50 21.5
PAY-OUT RATIO 0.1562305 0.171212 0.166845 0.206850 0.161460
(Source: Secondary Data)
CHART No.5
Department of Management Science [53] MES College of Engineering
Project Report 2010 Cochin Stock Exchange
(Source: Secondary Data)
Table No. 5
RETURN ON EQUITY
ITEMS 2004 - 05 2005 - 06 2006 - 07 2007 - 08 2008 – 09
Equity Share Capital 526.3 526.3 526.3 631.47 634.88
Reserves and Surplus 23545.84 27117.79 30772.26 48401.19 48401.19
NET WORTH 24072.14 27644.09 31298.56 49032.66 49036.07
PAT 4304.52 4406.67 4541.31 6729.12 8505.24
ROE (%) 17.881750 15.940731 14.509645 13.723751 17.344865
(Source: Secondary Data)
CHART No.6
Department of Management Science [54] MES College of Engineering

Project Report 2010 Cochin Stock Exchange
(Source: Secondary Data)
Table No.6
NORMALIZED PRICE EARNING RATIO
ITEMS 2004 – 05 2005 - 06 2006 - 07 2007 - 08 2008 – 09
Reported EPS 80.01 81.77 83.91 103.94 133.16
Mkt.: High
Mkt.: Low
961.95
552.50
1378.70
684.15
2475.25
845
2540.00
991.10
1376.40
894.00
Mkt.: High/EPS
Mkt.: Low/EPS
12.022872
6.905387
16.860707
8.366760
29.498868
10.070313
24.437175
9.535309
10.336437
6.713728
Average P/E 9.464130 12.613734 19.784591 16.986242 8.525083
(Source: Secondary Data)
CHART No.7
Department of Management Science [55] MES College of Engineering
Project Report 2010 Cochin Stock Exchange
(Source: Secondary Data)
INTRINSIC VALUE CALCULATION:
Dividend declaredDividend Pay-Out Ratio = ------------------------
EPS
Dividend Pay-out Ratio for 5 YearsAvg. Dividend Pay-out Ratio = ------------------------------------------------
5
0.156231+0.171212+0.166845+0.206850+0.16146
= ------------------------------------------------------------- 5
= 0.172520
Average Retention Ratio = 1 - Average Dividend Pay-out Ratio
= 1 – 0.172520
= 0.82748
Sum of ROE for 5 Years
Department of Management Science [56] MES College of Engineering

Project Report 2010 Cochin Stock Exchange
Average Return on Equity = ------------------------------- 5
17.88175+15.940731+14.509645+13.723751+17.344865
= ----------------------------------------------------------- 5
= 15.8801484
Long term Growth Rate in Equity (g) = Average Retention Ratio x Avg. ROE
= 0.82748 x .15880
= .1314050
Sum of PE Ratios for 5 YearsNormalized Avg. PE Ratio = -------------------------------------
5
9.464130+12.613734+19.784591+16.986242+8.525083
= ----------------------------------------------------------------------- 5
= 13.474756
Projected EPS for = EPS for Current year x (1+g)
= 133.16 x (1+.1314050)
= 150.657890
Intrinsic Value = Projected EPS x Normalized Avg. PE Ratio
= 150.657890x 13.474756
= 2030.07830
Projected DPS = Dividend for Current Year x (1+g)
= 21.5 x (1+.1314050)
= 24.3252075
INTERPRETATION
The stock is said to be over priced as the intrinsic value of the security
(2030.07830) is lesser than current market price2269.45 (31st March2010). This means that
Department of Management Science [57] MES College of Engineering
Project Report 2010 Cochin Stock Exchange
the investor should sell the share as the price of the security may go up in future. The short
term and long term solvency of the company is unsatisfactory. The projected earnings per
share (EPS) and the dividend per share (DPS) of the security is estimated to be 150.65 and
24.32 respectively.
SBI TECHNICAL ANALYSIS
CHART No: 8
(Source: Secondary Data)
INFERENCE
The 200 day EMA is rising, shows a long term bullish trend for the stock. The
increasing 50 day EMA shows medium term bullish trend as well. Only the 5 day EMA
Department of Management Science [58] MES College of Engineering
Project Report 2010 Cochin Stock Exchange
shows a small downturn, which is not very significant for the long term investors. From the
chart it is clear that both medium term and long term trend of this scrip is bullish.
CHART No: 9
(Source: Secondary Data)
INFERENCE
It is very clear from the chart the ROC line is above the zero line, which is the
overbought zone. Ideally, one should sell a share that is overbought. Hence it is highly
advisable to sell this share at this level.
CHART No: 10
Department of Management Science [59] MES College of Engineering

Project Report 2010 Cochin Stock Exchange
(Source: Secondary Data)
INFERENCE
MACD line is above the zero line and do not show any trend of turning down which
means it is bullish and indicates a buying opportunity.
ANALYSIS AND INTERPRETATION OF ICICI BANK
Table No: 7
SHARE HOLDING PATTERN OF ICICI BANK
SHARE HOLDING PATTERNSHARES [%]
Foreign 72,77,84,145.00 65.37469
Institutions 24,64,56,670.00 22.13847
Govt. Holding 0.00 0.00
Non Promoter Corp. Hold. 5,26,12,667.00 4.72604
Promoters 0.00 0.00
Public and Others 8,63,97,160.00 7.7608
Total 1,11,32,50,642.00 100.00
(Source: Secondary Data)
CHART No: 11
Department of Management Science [60] MES College of Engineering

Project Report 2010 Cochin Stock Exchange
(Source: Secondary Data)
ICICI BANK- RATIO ANALYSIS
Table No.8
BOOK VALUE
ITEMS 2004 - 05 2005 – 06 2006 – 07 2007 - 08 2008 – 09
Mkt.: High
Low
615.90
330.05
925.00
440.00
1348.00
791.15
1465.00
282.15
537.95
252.75
EPS 25.99 27.35 32.88 36.02 36.11
DPS 8.5 8.5 10.0 11.0 11.0
(Source: Secondary Data)
CHART No.12
Department of Management Science [61] MES College of Engineering

Project Report 2010 Cochin Stock Exchange
(Source: Secondary Data)
Table No: 9
PAY-OUT POLICY
ITEMS 2004 - 05 2005 – 06 2006 – 07 2007 - 08 2008 -09
Reported EPS 25.99 27.35 32.88 36.02 36.11
DPS 8.5 8.5 10.0 11.0 11.0
PAY-OUT RATIO 0.327049 0.310786 0.304136 0.305386 0.304625
(Source: Secondary Data)
CHART No.13
Department of Management Science [62] MES College of Engineering

Project Report 2010 Cochin Stock Exchange
(Source: Secondary Data)
Table No. 10
RETURN ON EQUITY
ITEMS 2004 - 05 2005 – 06 2006 - 07 2007 - 08 2008 – 09
Equity Share Capital 736.76 889.83 899.34 1112.68 1113.29
Reserves and Surplus 11813.2 21316.16 23413.92 45357.53 48922.00
NET WORTH 12549.96 22205.99 24313.26 46470.21 50035.29
PAT 2005.20 2540.07 3110.22 4157.73 4019.16
ROE (%) 15.9777401 11.4386703 12.7922787 8.9470867 8.032651
(Source: Secondary Data)
CHART No.14
Department of Management Science [63] MES College of Engineering

Project Report 2010 Cochin Stock Exchange
(Source: Secondary Data)
Table No.11
NORMALIZED PRICE EARNING RATIO
ITEMS 2004 - 05 2005 - 06 2006 - 07 2007 - 08 2008 – 09
Reported EPS 25.99 27.35 32.88 36.02 36.11
Mkt.: High
Low
615.90
330.05
925.00
440.00
1348.00
791.15
1465.00
282.15
537.95
252.75
Mkt.: High/EPS
Mkt.: Low/EPS
23.697576
12.699115
33.820841
16.087751
40.997567
24.061740
40.671849
7.833148
14.897535
6.999446
Average P/E 18.198346 24.954296 32.529654 24.252499 10.948491
(Source: Secondary Data)
CHART NO.15
Department of Management Science [64] MES College of Engineering

Project Report 2010 Cochin Stock Exchange
(Source: Secondary Data)
INTRINSIC VALUE CALCULATION:
Dividend declaredDividend Pay-Out Ratio = ------------------------
EPS Dividend Pay-out Ratio for 5 Years
Avg. Dividend Pay-out Ratio = ---------------------------------------------- 5
0.327049+0.310786+0.304136+.305386+0.304625= -------------------------------------------------------------
5
= 0.310396
Average Retention Ratio = 1 - Average Dividend Pay-out Ratio
= 1 – 0.310396
= 0.689604
Sum of ROE for 5 YearsAverage Return on Equity = -------------------------------
Department of Management Science [65] MES College of Engineering

Project Report 2010 Cochin Stock Exchange
5
15.97774+11.43867+12.792279+8.947087+8.032651= -------------------------------------------------------
5
= 11.437685%
Long term Growth Rate in Equity (g) = Average Retention Ratio x Avg. ROE
= 0.68904 x 0.114377
= 0.078875
Sum of PE Ratios for 5 YearsNormalized Avg. PE Ratio = -------------------------------------
5
18.198346+24.954296+32.529654+24.252499+10.948491
= ----------------------------------------------------------------------5
= 22.176657
Projected EPS for = EPS for Current year x (1+g)
= 36.11 x (1+0.078875)
= 38.958176
Intrinsic Value = Projected. EPS x Normalized Avg. PE Ratio
= 38.958176 x 22.176657
= 863.962112
Projected DPS = Dividend for Current Year x (1+g)
= 11.00 x (1+0.078875)
= 11.867625
INTERPRETATION
Department of Management Science [66] MES College of Engineering

Project Report 2010 Cochin Stock Exchange
The stock is said to be over priced as the intrinsic value of the security (863.96) is
less than current market price875.70 (31st March 2010). This means that the investor should
sell the share as the price of the security may come down in future. The short term and long
term solvency of the company is unsatisfactory. The projected earning per share (EPS) and
the dividend per share (DPS) of the security is estimated to be 38.95 and 11.86 respectively
ICICI BANK TECHNICAL ANALYSIS
CHART No: 16
Department of Management Science [67] MES College of Engineering

Project Report 2010 Cochin Stock Exchange
(Source: Secondary Data)
INFERENCE
The 200 day EMA indicates a trend reversal. The medium term EMA shows an upward
trend and is good for investors to hold the shares. The short term EMA also is on the rise,
which further assures the investor to stay invested in this share.
CHART No: 17
Department of Management Science [68] MES College of Engineering

Project Report 2010 Cochin Stock Exchange
(Source: Secondary Data)
INFERENCE
The ROC line is moving from above the zero line, which is the oversold region. Those who
want to invest in this share can now get ready to buy this share, since it is advisable to buy
when the share is oversold.
CHART No: 18
(Source: Secondary Data)
INFERENCE
The MACD line above the zero line indicates a bullish trend. It is showing a decline
in the trend reversal. An investor can hold this share for a lesser period.
ANALYSIS AND INTERPRETATION OF HDFC BANK
Department of Management Science [69] MES College of Engineering

Project Report 2010 Cochin Stock Exchange
SHARE HOLDING PATTERN OF HDFC BANK
Table No.12
SHARE HOLDING PATTERNSHARES [%]
Foreign 20,30,58,960.00 47.76234772
Institutions 4,50,40,249.00 10.59410545
Govt. Holding 6,102.00 0.001435277
Non Promoter Corp. Hold. 4,60,22,249.00 10.82508578
Promoters 8,24,43,000.00 19.39176303
Public and Others 4,85,73,868.00 11.42526276
Total 42,51,44,428.00 100.00
(Source: Secondary Data)
CHART No: 19
(Source: Secondary Data)
HDFC BANK- RATIO ANALYSIS
Department of Management Science [70] MES College of Engineering

Project Report 2010 Cochin Stock Exchange
Table No.13
BOOK VALUE
ITEMS 2004 - 05 2005 – 06 2006 - 07 2007 – 08 2008 – 09
Mkt.: High
Low
748.55
461.15
1150.00
620.00
1799.00
890.00
1825.00
800.00
1124.00
774.00
EPS 20.84 27.04 34.55 43.42 50.67
DPS 4.5 5.5 7.0 8.5 8.5
(Source: Secondary Data)
CHART No: 20
(Source: Secondary Data)
Table No.14
PAY-OUT POLICY
Department of Management Science [71] MES College of Engineering

Project Report 2010 Cochin Stock Exchange
ITEMS 2004 - 05 2005 – 06 2006 – 07 2007 – 08 2008 – 09
Reported EPS 20.84 27.04 34.55 43.42 50.67
DPS 4.5 5.5 7.0 8.5 8.5
PAY-OUT RATIO 0.215931 0.203402 0.202605 0.195762 0.167752
(Source: Secondary Data)
CHART No.21
(Source: Secondary Data)
Table No.15
RETURN ON EQUITY
Department of Management Science [72] MES College of Engineering

Project Report 2010 Cochin Stock Exchange
ITEMS 2004 - 05 2005 - 06 2006 – 07 2007 – 08 2008 – 09
Equity Share 309.88 313.14 319.39 354.43 425.14
Reserves and Surplus 4209.67 4986.39 6113.76 11142.80 11142.8
NET WORTH 4519.85 5299.53 6433.15 11497.23 11567.94
PAT 665.56 870.78 1141.45 1590.18 2152.09
ROE (%) 14.726245 16.431268 17.743252 13.830984 18.603917
(Source: Secondary Data)
CHART No: 22
(Source: Secondary Data)
Table No.16
NORMALIZED PRICE EARNING RATIO
Department of Management Science [73] MES College of Engineering

Project Report 2010 Cochin Stock Exchange
ITEMS 2004 - 05 2005 – 06 2006 – 07 2007 – 08 2008 – 09
Reported EPS 20.84 27.04 34.55 43.42 50.67
Mkt.: High
Mkt.: Low
748.55
461.15
1150
620
1799
890
1825.00
800.00
1124.00
774.00
Mkt.: High/EPS
Mkt.: Low/EPS
35.918906
22.128119
42.529586
22.928994
52.069465
25.759768
42.031322
18.424689
22.182751
15.275311
Average P/E 29.023513 32.729290 38.914617 30.228006 18.729031
(Source: Secondary Data)
CHART No: 23
(Source: Secondary Data)
INTRINSIC VALUE CALCULATION:
Dividend declared
Department of Management Science [74] MES College of Engineering
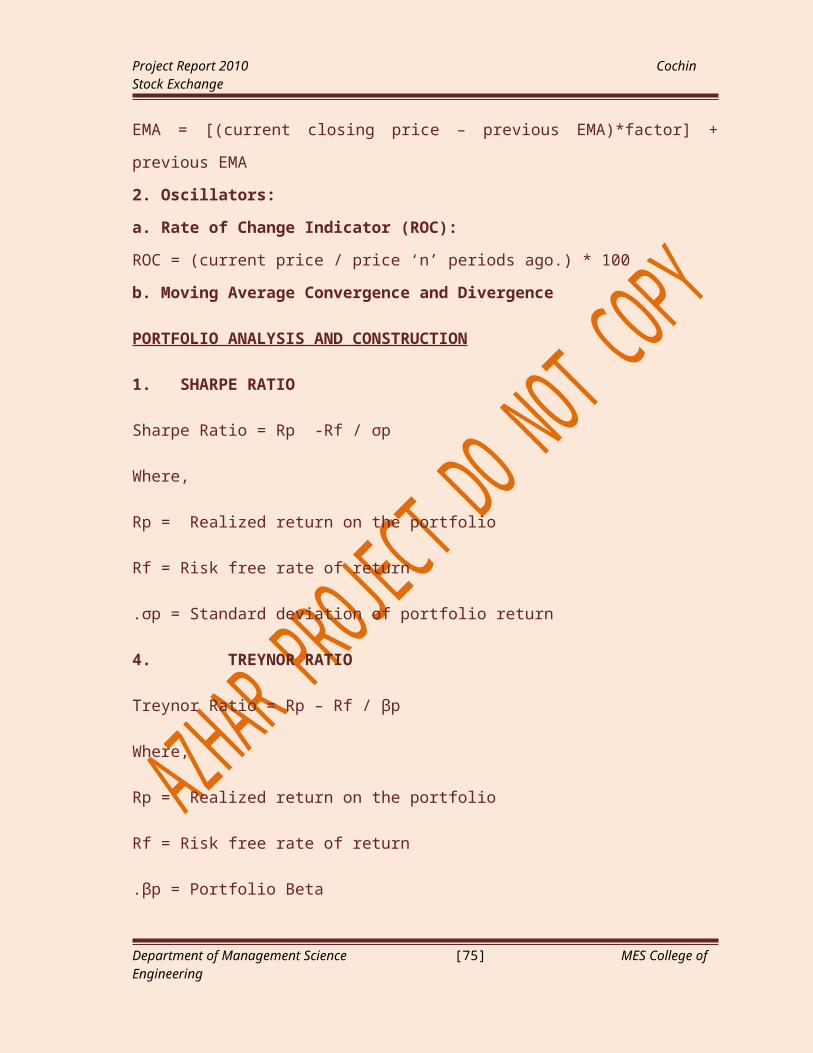
Project Report 2010 Cochin Stock Exchange
Dividend Pay-Out Ratio = ------------------------ EPS
Dividend Pay-out Ratio for 5 YearsAvg. Dividend Pay-out Ratio = --------------------------------------------
5
0.215931+0.203402+0.202605+0.195762+0.167752= ---------------------------------------------------------------
5
= 0.197090
Average Retention Ratio = 1 - Average Dividend Pay-out Ratio
= 1 – 0.197090
= 0.80291
Sum of ROE for 5 YearsAverage Return on Equity = ------------------------------- 5
14.726245+16.431268+17.743252+13.830984+18.603917 = -----------------------------------------------------------
5
= 16.267133
Long term Growth Rate in Equity (g)= Average Retention Ratio x Avg. ROE
= 0.80291 x 0.162671
= 0.130610
Sum of PE Ratios for 5 YearsNormalized Avg. PE Ratio = -------------------------------------
5
29.023513+32.729290+38.914617+30.228006+18.729031= -----------------------------------------------------------------------
5
= 29.924891
Projected EPS for = EPS for Current year x (1+g)
Department of Management Science [75] MES College of Engineering

Project Report 2010 Cochin Stock Exchange
= 50. 67 x (1+0.130610)
= 57.288009
Intrinsic Value = Projected. EPS x Normalized Avg.PRatio
= 57.288009 x 29.924891
= 1714.337425
Projected DPS = Dividend for Current Year x (1+g)
= 85 x (1+0.130610)
= 9.610185
INTERPRETATION
The stock is said to be under priced as the intrinsic value of the security (1714.34)
is higher than current market price 1700.40 (31st March 2010). This means that the investor
should buy the share as the price of the security may come up in future. The short term and
long term solvency of the company is unsatisfactory. The projected earnings per share
(EPS) and the dividend per share (DPS) of the security is estimated to be 57.2 and 9.6
respectively
HDFC BANK TECHNICAL ANALYSIS
CHART No: 24
Department of Management Science [76] MES College of Engineering

Project Report 2010 Cochin Stock Exchange
(Source: Secondary Data)
INFERENCE
The 200 day, 50 day, 5 day EMA lines are showing increasing trend. This is an
indicator of the current upward trend continuing for a longer period either on the short
term, medium term and long term. The investor can stay invested in this share.
CHART No: 25
Department of Management Science [77] MES College of Engineering

Project Report 2010 Cochin Stock Exchange
(Source: Secondary Data)
INFERENCE
The ROC line is in the overbought region at present and indicates a selling
opportunity. But as it is clear from the graph this is slowly changing and is taking a
downward turn.
CHART No: 26
(Source: Secondary Data)
INFERENCE
The MACD line above the zero line is a clear indicator or the bullish trend which is
visible in this share for some time now. It may go even higher. It may go even higher. The
investor can stay invested in this share for now.
ANALYSIS AND INTERPRETATION OF AXIS BANK
Department of Management Science [78] MES College of Engineering

Project Report 2010 Cochin Stock Exchange
Table No.17
SHARE HOLDING PATTERN OF AXIS BANK
SHARE HOLDING PATTERN SHARES [%]
Foreign 12,52,00,444.00 34.877114
Institutions 3,78,47,989.00 10.54332225
Govt. Holding 0.00 0.00
Non Promoter Corp. Hold. 2,40,12,514.00 6.689171073
Promoters 15,22,27,205.00 42.4059645
Public and Others 1,96,87,777.00 5.484428177
Total 35,89,75,929.00 100.00
(Source: Secondary Data)
CHART No: 27
(Source: Secondary Data)
AXIS BANK - RATIO ANALYSIS
Department of Management Science [79] MES College of Engineering

Project Report 2010 Cochin Stock Exchange
Table No.18
BOOK VALUE
ITEMS 2004 – 05 2005 – 06 2006 – 07 2007 - 08 2008 - 09
Mkt.: High
Low
315.00
169.10
512.90
221.50
1025.00
399.00
1291.00
362.80
575.50
278.50
EPS 11.81 16.87 22.62 28.91 45.87
DPS 2.8 3.5 4.5 6.0 6.0
(Source: Secondary Data)
CHART No: 28
(Source: Secondary Data)
Table No.19
PAY-OUT POLICY
Department of Management Science [80] MES College of Engineering

Project Report 2010 Cochin Stock Exchange
ITEMS 2004 – 05 2005 - 06 2006 - 07 2007 - 08 2008 - 09
Reported EPS 11.81 16.87 22.62 28.91 45.87
DPS 2.8 3.5 4.5 6.0 6.0
PAY-OUT RATIO 0.237087 0.207469 0.198939 0.207541 0.130804
(Source: Secondary Data)
CHART No: 29
(Source: Secondary Data)
Table No.20
RETURN ON EQUITY
Department of Management Science [81] MES College of Engineering
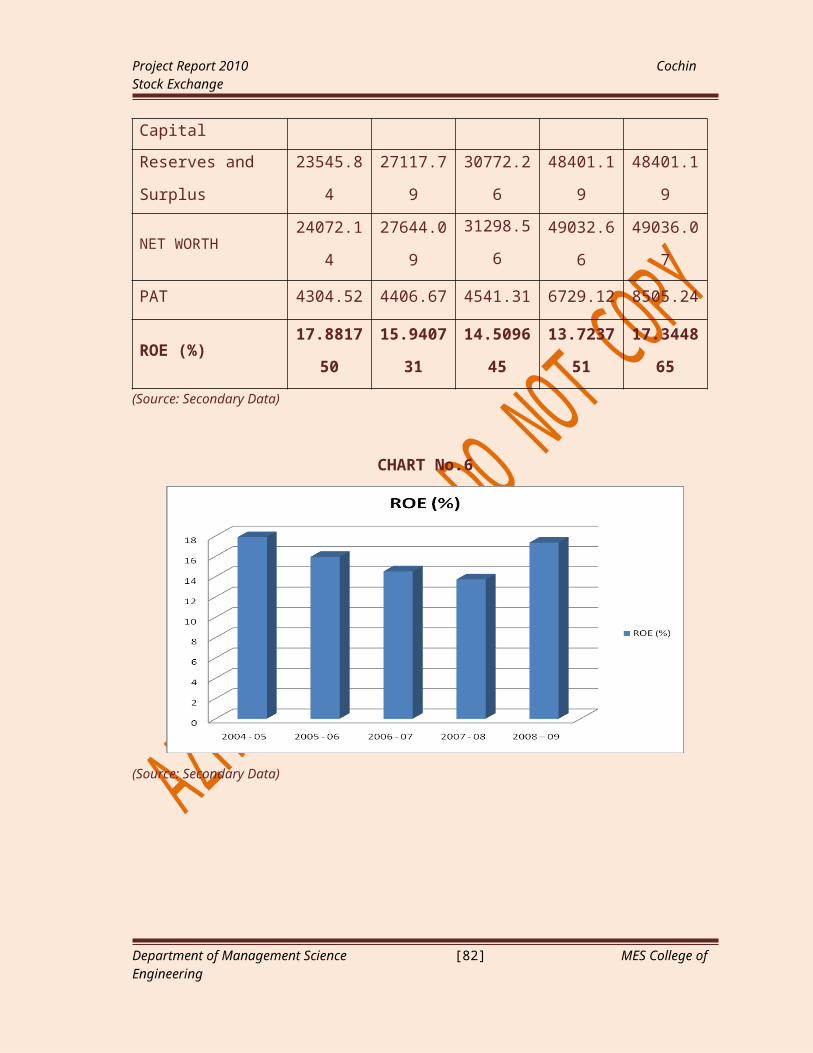
Project Report 2010 Cochin Stock Exchange
ITEMS 2004 - 05 2005 – 06 2006 - 07 2007 - 08 2008 – 09
Equity Share Capital 273.80 278.69 281.63 357.71 358.98
Reserves and Surplus 2134.39 2593.49 3111.60 3410.79 8410.79
NET WORTH 2408.19 2872.18 3393.23 8768.50 8769.21
PAT 334.58 485.08 659.03 1071.03 1645.21
ROE (%) 13.893422 16.888914 19.421907 12.214518 18.761211
(Source: Secondary Data)
CHART No: 30
(Source: Secondary Data)
NORMALIZED PRICE EARNING RATIO OF AXIS BANK
Table No.21
NORMALIZED PRICE EARNING RATIO:
Department of Management Science [82] MES College of Engineering

Project Report 2010 Cochin Stock Exchange
ITEMS 2004 - 05 2005 - 06 2006 - 07 2007 - 08 2008 – 09
Reported EPS 11.81 16.87 22.62 28.91 45.87
Mkt.: High
Mkt.: Low
315.00
169.10
512.90
221.50
1025.00
399.00
1291.00
362.80
575.50
278.50
Mkt.: High/EPS
Mkt.: Low/EPS
26.672312
14.318374
30.403082
13.129816
45.313882
17.639257
44.655828
12.549291
12.546327
6.071506
Average P/E 20.495343 21.766449 31.476570 28.602560 9.308917
(Source: Secondary Data)
CHART No: 31
(Source: Secondary Data)
INTRINSIC VALUE CALCULATION:
Dividend declaredDividend Pay-Out Ratio = ------------------------
EPS
Department of Management Science [83] MES College of Engineering
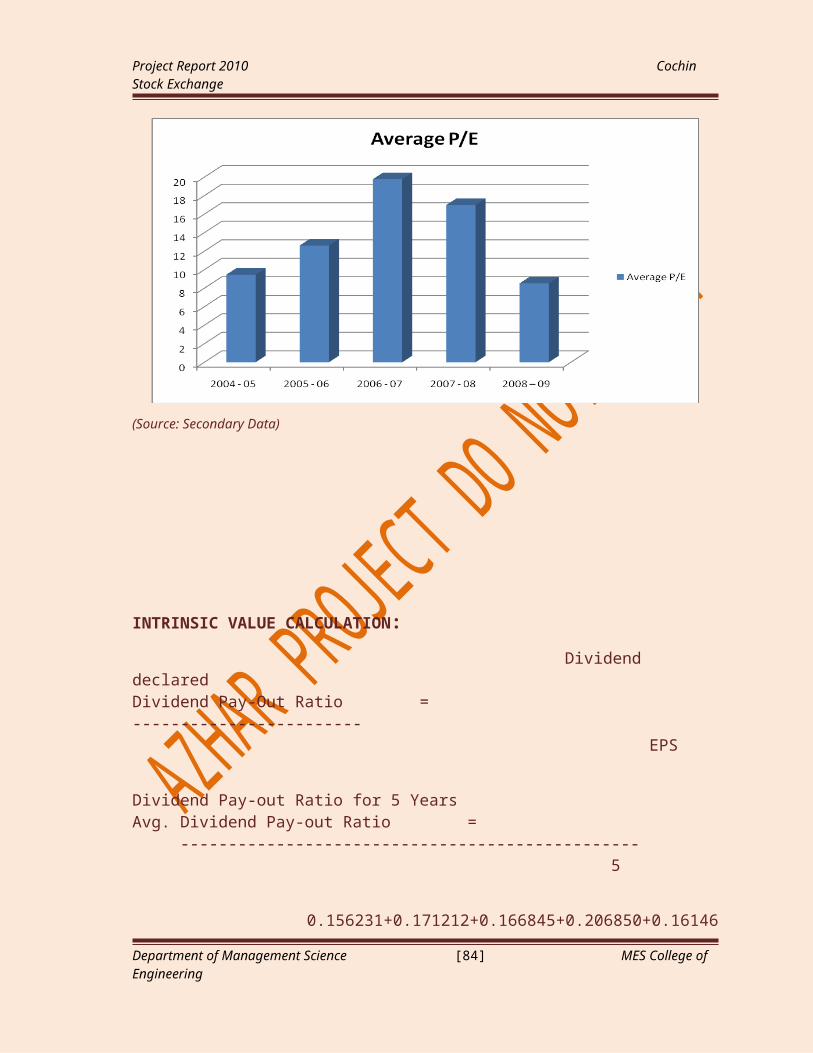
Project Report 2010 Cochin Stock Exchange
Dividend Pay-out Ratio for 5 YearsAvg. Dividend Pay-out Ratio = --------------------------------------------
5
0.237087+0.207469+0.198939+0.207541+0.130804
= ----------------------------------------------------------------5
= 0.196368
Average Retention Ratio = 1 - Average Dividend Pay-out Ratio
= 1 – 0.196368
= 0.803632
Sum of ROE for 5 YearsAverage Return on Equity = ------------------------------- 5
=13.893422+16.888914+19.421908+12.214518+18.761211
---------------------------------------------------5
= 16.235995
Long term Growth Rate in Equity (g) = Average Retention Ratio x Avg. ROE
= 0.803632 x 0.16235995
= 0.130478
Sum of PE Ratios for 5 YearsNormalized Avg. PE Ratio = -------------------------------------
5
20.495343+21.766449+31.476570+28.602560+9.308917
--------------------------------------------------------5
= 22.329978
Department of Management Science [84] MES College of Engineering

Project Report 2010 Cochin Stock Exchange
Projected EPS for = EPS for Current year x (1+g)
= 28.91 x (1+0.130478)
= 32.68212
Intrinsic Value = Projected. EPS x Normalized Avg. PE Ratio
= 32.68212 x 22.329978
= 729.791021
Projected DPS = Dividend for Current Year x (1+g)
= 6 x (1+0.130478)
= 6.782868
INTERPRETATION
The stock is said to be over priced as the intrinsic value of the security (729.79) is
less than current market price 988.70 (31st March 2010). This means that the investor
should sell the share as the price of the security may come down in future. The short term
and long term solvency of the company is unsatisfactory. The projected earnings per share
(EPS) and the dividend per share (DPS) of the security is estimated to be 32.68 and 6.78
respectively.
Department of Management Science [85] MES College of Engineering
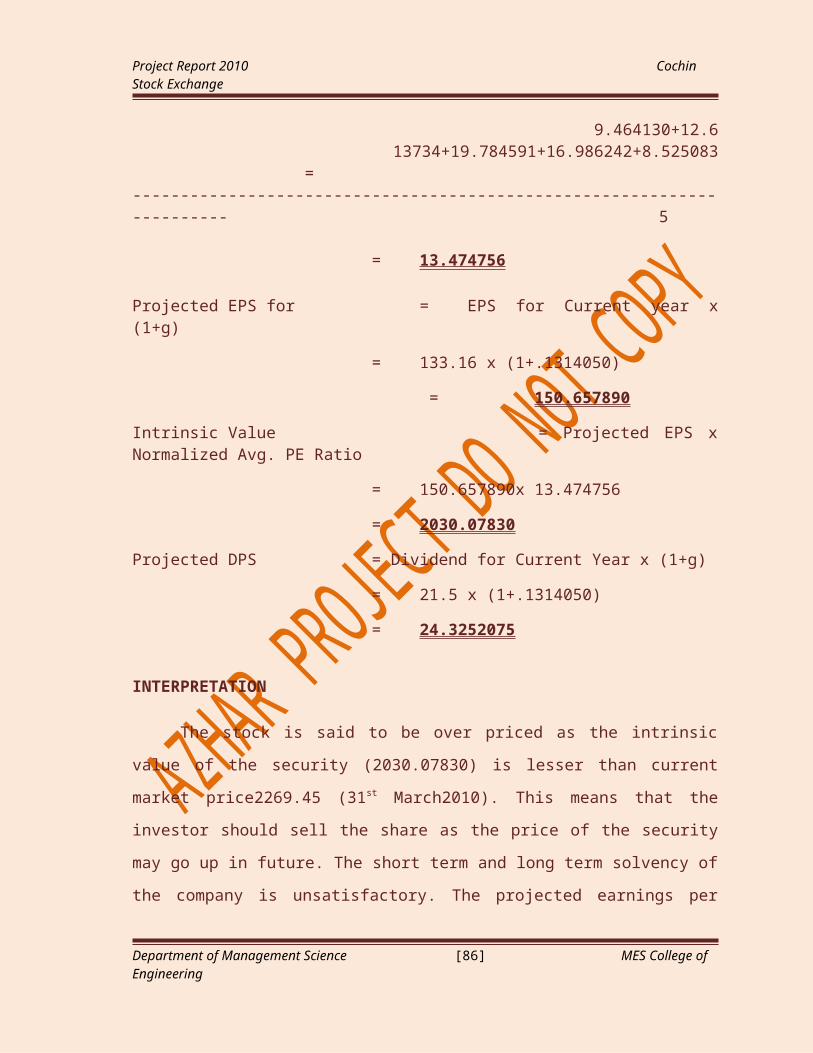
Project Report 2010 Cochin Stock Exchange
AXIS BANK TECHNICAL ANALYSIS
CHART No: 32
(Source: Secondary Data)
INFERENCE
The long, medium and short term EMA are in a bullish trend. All are showing a
upward trend. Investor with a long term investment perspective can still buy this share at
the current rate.
Department of Management Science [86] MES College of Engineering

Project Report 2010 Cochin Stock Exchange
CHART No: 33
(Source: Secondary Data)
INFERENCE
The ROC line is above the zero line at present and if it crosses the zero line from
above to below it is a selling opportunity otherwise it is a buying opportunity.
CHART No: 34
(Source: Secondary Data)
INFERENCE
The MACD line above the zero line and it is a bullish trend. But it may go down as the
MACD is just above the zero line. The investor may hold the share for a short term period.
Department of Management Science [87] MES College of Engineering

Project Report 2010 Cochin Stock Exchange
ANALYSIS AND INTERPRETATION OF PNB
Table No.22
SHARE HOLDING PATTERN OF PNB
SHARE HOLDING PATTERNSHARES [%]
Foreign 5,77,84,916.00 18.32681821
Institutions 5,77,73,633.00 18.32323975
Govt. Holding 0.00 0.00
Non Promoter Corp. Hold. 34,10,941.00 1.081799542
Promoters 18,22,41,300.00 57.79887568
Public and Others 1,40,91,710.00 4.469266815
Total 31,53,02,500.00 100.00
(Source: Secondary Data)
CHART No: 35
(Source: Secondary Data)
Department of Management Science [88] MES College of Engineering

Project Report 2010 Cochin Stock Exchange
PNB - RATIO ANALYSIS
Table No.23
BOOK VALUE
ITEMS 2004 - 05 2005 – 06 2006 – 07 2007 - 08 2008 – 09
Mkt.: High
Low
521.00
337.55
584.90
300.00
700.00
400.00
721.00
332.35
544.00
286.20
EPS 43.98 44.81 47.26 62.77 94.11
DPS 6.0 9.0 10.0 13.0 13.0
(Source: Secondary Data)
CHART No: 36
(Source: Secondary Data)
Department of Management Science [89] MES College of Engineering
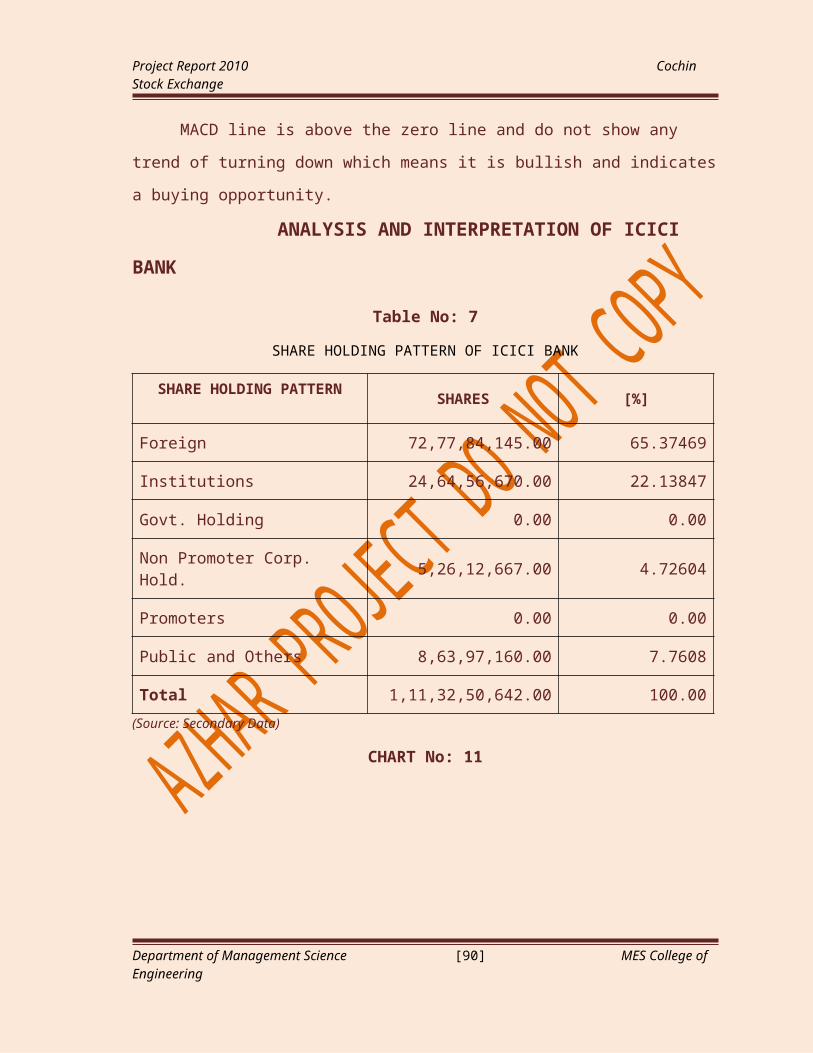
Project Report 2010 Cochin Stock Exchange
Table No.24
PAY-OUT POLICY
ITEMS 2004 - 05 2005 – 06 2006 – 07 2007 - 082008 – 09
Reported EPS 43.98 44.81 47.26 62.77 94.11
DPS 6.0 9.0 10.0 13.013.0
PAY-OUT RATIO 0.136426 0.200848 0.211595 0.2071050.138136
(Source: Secondary Data)
CHART No: 37
(Source: Secondary Data)
Department of Management Science [90] MES College of Engineering

Project Report 2010 Cochin Stock Exchange
Table No. 25
RETURN ON EQUITY:
ITEMS 2004 - 05 2005 – 06 2006 – 07 2007 - 08 2008 – 09
Equity Share Capital 315.30 315.30 315.30 315.30 315.30
Reserves and Surplus 7533.51 8758.68 9796.31 10467.35 10467.35
NET WORTH 7848.81 9073.98 10111.61 10782.65 10782.65
PAT 1410.12 1439.31 1540.08 2048.76 2967.08
ROE (%) 17.966036 15.861948 15.230809 19.000524 27.517169
(Source: Secondary Data)
CHART No: 38
(Source: Secondary Data)
NORMALIZED PRICE EARNING RATIO PNB
Department of Management Science [91] MES College of Engineering
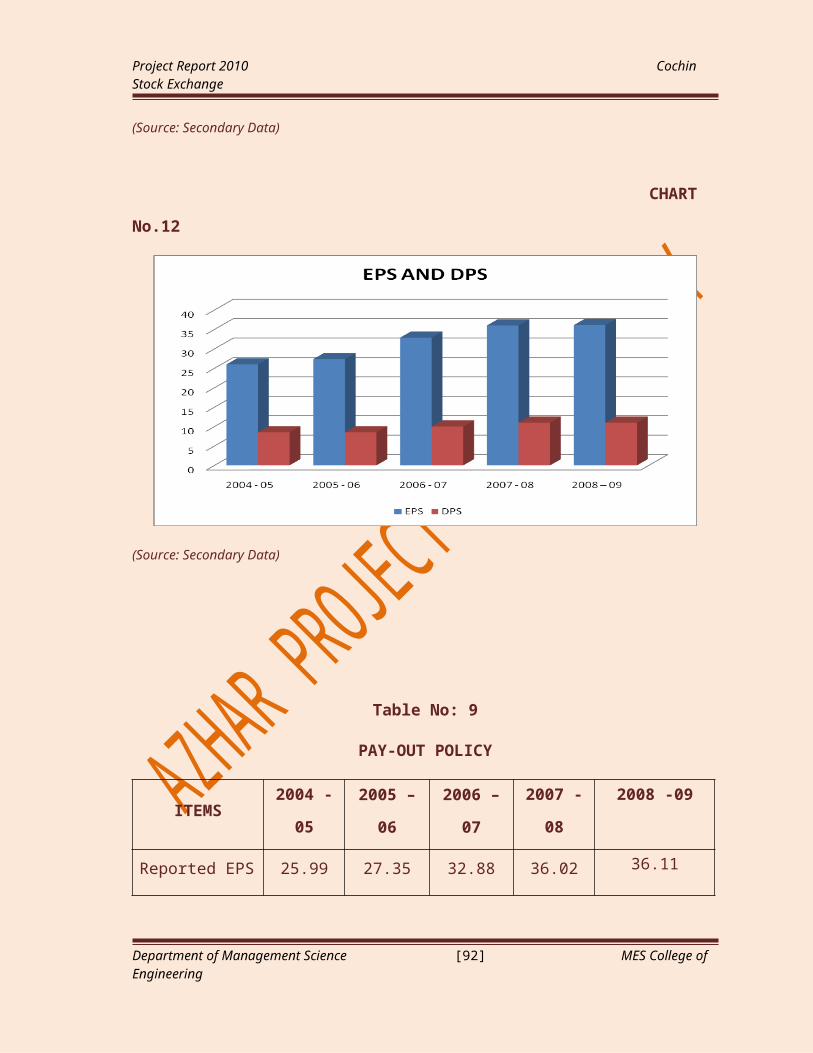
Project Report 2010 Cochin Stock Exchange
Table No.26
NORMALIZED PRICE EARNING RATIO:
ITEMS 2004 - 05 2005 – 06 2006 – 07 2007 - 08 2008 – 09
Reported EPS 43.98 44.81 47.26 62.77 94.11
Mkt.: High
Mkt.: Low
521.00
337.55
584.90
300.00
700.00
400.00
721.00
332.35
544.00
286.20
Mkt.: High/EPS
Mkt.: Low/EPS
11.846294
7.675080
13.052890
6.694934
14.811680
8.463817
11.486379
5.294727
5.780470
3.041122
Average P/E 9.760687 9.873912 11.637749 8.390553 4.410796
(Source: Secondary Data)
CHART No: 39
(Source: Secondary Data)
INTRINSIC VALUE CALCULATION:
Department of Management Science [92] MES College of Engineering

Project Report 2010 Cochin Stock Exchange
Dividend declaredDividend Pay-Out Ratio = ------------------------
EPS
Dividend Pay-out Ratio for 5 YearsAvg. Dividend Pay-out Ratio = --------------------------------------------
5
0.136426+0.200848+0.211595+0.207105+0.138136= ---------------------------------------------------------------
5
= 0.178822
Average Retention Ratio = 1 - Average Dividend Pay-out Ratio
= 1 – 0.178822
= 0.821178
Sum of ROE for 5 YearsAverage Return on Equity = ------------------------------- 5
17.966036+15.861948+15.230809+19.000524+27.517169= ------------------------------------------------------
5
= 19.115297
Long term Growth Rate in Equity (g) = Average Retention Ratio x Avg. ROE
= 0.821178 x 0.191153
= 0.156971
Sum of PE Ratios for 5 YearsNormalized Avg. PE Ratio = -------------------------------------
5
9.760687+9.873912+11.637749+8.390553+4.410796= -----------------------------------------------------------------
5
= 8.814739
Projected EPS for = EPS for Current year x (1+g)
Department of Management Science [93] MES College of Engineering

Project Report 2010 Cochin Stock Exchange
= 62.77 x (1+0.156971)
= 72.623070
Intrinsic Value = Projected. EPS x Normalized Avg. PE Ratio
= 72.623070 x 8.814739
= 640.153407
Projected DPS = Dividend for Current Year x (1+g)
= 13 x ((1+0.156971)
= 15.040623
INTERPRETATION
The stock is said to be over priced as the intrinsic value of the security (640.15) is
less than current market price 906.85 (31st March 2010). This means that the investor
should sell the share as the price of the security may come down in future. The short term
and long term solvency of the company is unsatisfactory. The projected earnings per share
(EPS) and the dividend per share (DPS) of the security is estimated to be 72.62 and 15.04
respectively.
PNB TECHNICAL ANALYSIS
Department of Management Science [94] MES College of Engineering

Project Report 2010 Cochin Stock Exchange
CHART No: 40
(Source: Secondary Data)
INFERENCE
The 200 day EMA is rising, shows a long term bullish trend for the stock. The
increasing 50 day EMA shows medium term bullish trend as well. Only the 5 day EMA
shows a small downturn, which is not very significant for the long term investors. From the
chart it is clear that both medium term and long term trend of this scrip is bullish.
CHART No: 41
Department of Management Science [95] MES College of Engineering

Project Report 2010 Cochin Stock Exchange
(Source: Secondary Data)
INFERENCE
The ROC line is above the zero line, which is the overbought zone. Ideally, one
should sell a share that is overbought. Hence it is highly advisable to sell this share at this
level
CHART No: 42
(Source: Secondary Data)
INFERENCE
Since the MACD line is showing is above the zero line it i still the bullish trend and
it does not show any signs of downward turn now and hence is a buying opportunity.
COMPARISON OF MARKET VALUE WITH INTRINSIC VALUE
Table No: 27
Department of Management Science [96] MES College of Engineering

Project Report 2010 Cochin Stock Exchange
ITEMS SBI ICICI HDFC AXIS PNB
MARKET VALUE 2269.45 875.7 1700.4 988.7 906.85
INTRINSIC VALUE 2030.07 863.96 1714.33 729.79 640.15
(Source: Secondary Data)
CHART No: 43
INTERPRETATION
For all of these Banks except HDFC the market price is higher than the intrinsic
value, the scrip is considered to be over priced and it is not suitable for the investment
purposes. So investor cannot hold his investment in these stock or sell additional shares to
the market. Out of these SBI AXIS and PNB Bank have a significant difference in the
market value and the intrinsic value. So the investment in these two stocks are said to be
less attractive.
Department of Management Science [97] MES College of Engineering

Project Report 2010 Cochin Stock Exchange
PORTFOLIO MANAGEMENT
CALCULATION OF ALPHA AND BETA
STATE BANK OF INDIA
Return = Closing – Opening * 100 Opening
2004-05 2005-06 2006-07 2007-08 2008-09
Opening 642.60 584.80 913.65 1105.25 1776.35
Closing 656.95 968.05 992.90 1598.85 1066.55
(Source: Secondary Data)
SBI Return (Y)
2.23
65.538.6744.65-39.95
Β Calculation
Years Y X (Index Return) X2 XY1 2.23 11.86 140.65 26.442 65.53 63.18 4648.51 4467.833 8.67 11.98 143.52 103.864 44.65 37.35 1395.02 1667.675 -39.95 -36.42 1326.41 1454.97Total 81.13 92.95 7654.11 7720.77(Source: Secondary Data)
B = n∑XY – (∑X) (∑Y = (5 * 7720.77) – (92.95 * 81. 13) = 1.04
n∑X2 - (∑X)2 (5 * 7654.11) – 8639.70
α = y¯ – B¯X¯ = 81.13 – 1.04 * 92.95 = -3.11 5 5
The Expected Return from SBI, when the Index moves up by 18% can be calculated as:
Ri = α+β(Rm) = -3.11 + 1.04(18) = 15.61
Department of Management Science [98] MES College of Engineering

Project Report 2010 Cochin Stock Exchange
ICIC1 BANK
Return = Closing – Opening * 100 Opening
2004-05 2005-06 2006-07 2007-08 2008-09
Opening 315.20 360.20 590.25 865.90 879.90
Closing 393.00 589.25 853.10 770.10 332.60
(Source: Secondary Data)
ICICI Return (Y)
24.68
63.5844.53-11.06-62.17
β Calculation
Years Y X (Index Return) X2 XY1 24.68 11.86 140.65 292.702 63.58 63.18 4648.51 4334.883 44.53 16.98 143.52 533.464 -11.06 37.35 1395.02 -413.095 -62.17 -36.42 1326.41 2264.23Total 59.56 92.95 7654.11 7012.18(Source: Secondary Data)
β = n∑XY – (∑X) (∑Y) = (5 * 7012.18) – (92.95 * 59.56) = 0.996
n∑X2 - (∑X)2 (5 * 7654.11) – 8639.70
α = y¯ – β¯X¯ = 59.56 – 0.97 * 92.95 = 6.6 5 5
The Expected Return from SBI, when the Index moves up by 18% can be calculated as:
Ri = α+β(Rm) = 6.6 + 0.97(18) = 11.32
Department of Management Science [99] MES College of Engineering

Project Report 2010 Cochin Stock Exchange
PUNJAB NATIONAL BANK
Return = Closing – Opening * 100 Opening
2004-05 2005-06 2006-07 2007-08 2008-09
Opening 375.10 346.20 433.05 503.40 550.90
Closing 393.30 471.20 471.65 508.15 410.90
(Source: Secondary Data)
PNB Return (Y)
4.85
36.108.910.94-25.41
β Calculation
Years Y X (Index Return) X2 XY1 4.85 11.86 140.65 57.522 36.10 63.18 4648.51 2461.293 8.91 11.98 143.52 106.744 0.94 37.35 1395.02 35.105 -25.41 -36.42 1326.41 925.43Total 25.39 92.95 7654.11 3586.08(Source: Secondary Data)
β = n ∑XY – (∑X) (∑Y) = (5 * 3586.08) – (92.95 * 25.39) = 0.52
n∑X2 - (∑X)2 (5 * 7654.11) – 8639.70
α = y¯ – β¯X¯ = 25.39 – 0.52 * 92.95 = -4.59 5 5
The Expected Return from SBI, when the Index moves up by 18% can be calculated as:
Ri= α+β(Rm) = -4.59 + 0.52(18) = 4.77
Department of Management Science [100] MES College of Engineering
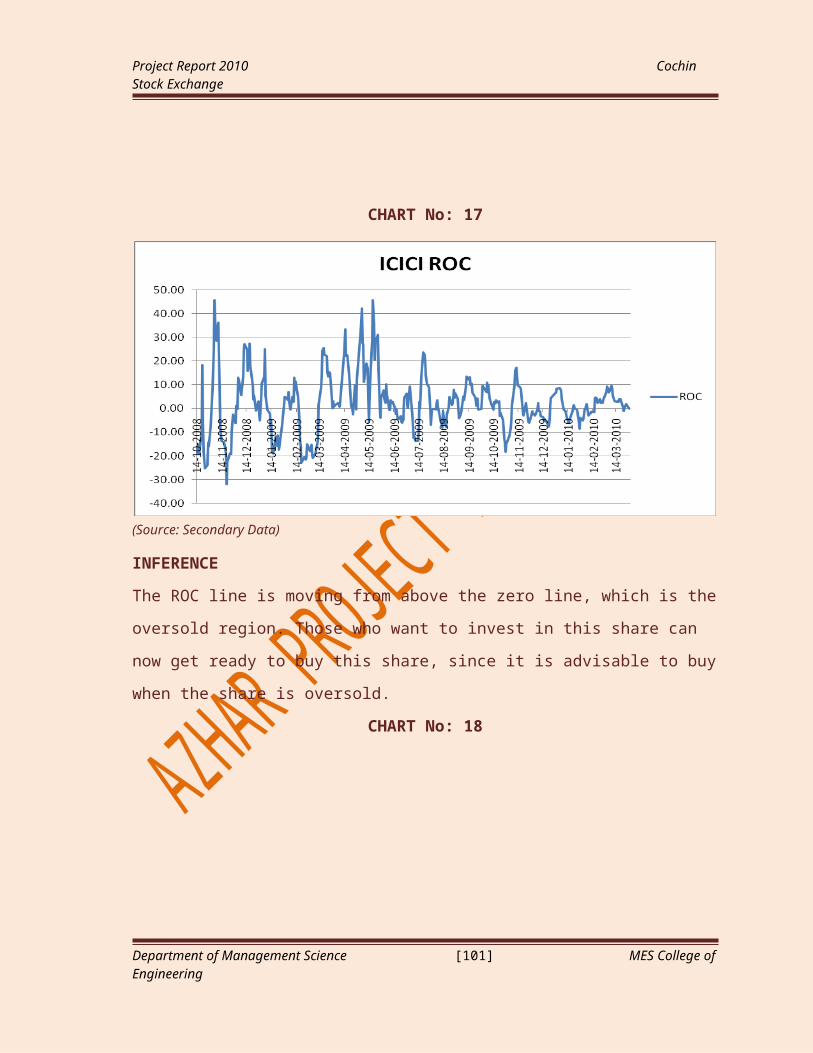
Project Report 2010 Cochin Stock Exchange
AXIS BANK
Return = Closing – Opening * 100 Opening
2004-05 2005-06 2006-07 2007-08 2008-09
Opening 155.15 230.10 347.05 467.85 924.30
Closing 242.05 356.35 490.15 781.15 414.50
AXIS Return (Y)
56.01
54.8641.2366.96-555.15
β Calculation
Years Y X (Index Return) X2 XY1 56.01 11.86 140.65 664.272 54.86 63.18 4648.51 3740.353 41.23 11.98 143.52 493.934 66.96 37.35 1395.02 2500.955 -555.15 -36.42 1326.41 2008.56Total 163.91 92.95 7654.11 9408.03(Source: Secondary Data)
β = n∑XY – (∑X) (∑Y) = (5 * 9408.06) – (92.95 * 163.91) = 1.07
n∑X2 - (∑X)2 (5 * 7654.11) – 8639.70
α = y¯ – β¯X¯ = 163.9 – 1.07 * 92.95 = 12.89 5 5
The Expected Return from SBI, when the Index moves up by 18% can be calculated as:
R i= α+β(Rm) = 12.89 + 1.07(18) = 32.15
Department of Management Science [101] MES College of Engineering

Project Report 2010 Cochin Stock Exchange
HDFC BANK
Return = Closing – Opening * 100 Opening
2004-05 2005-06 2006-07 2007-08 2008-09
Opening 375.90 537.20 826.60 1026.15 1514.85
Closing 544.25 773.50 949.40 1379.95 967.85
(Source: Secondary Data)
HDFC Return (Y)
44.78
43.9814.8528.63-36.10
β Calculation
Years Y X (Index Return) X2 XY1 44.78 11.86 140.65 531.092 43.98 63.18 4648.51 2998.553 14.85 11.98 143.52 177.904 28.63 37.35 1395.02 1069.335 -36.10 -36.42 1326.41 1314.76Total 96.14 92.95 7654.11 6091.63(Source: Secondary Data)
β = n∑XY – (∑X) (∑Y) = (5 * 6091.63) – (92.95 * 96.14) = 0.72
n∑X2 - (∑X)2 (5 * 7654.11) – 8639.70
α = y¯ – β¯X¯ = 96.14 – 0.72 * 92.95 = 5.84 5 5
The Expected Return from SBI, when the Index moves up by 18% can be calculated as:
Ri = α+β(Rm) = 5.84 + 0.72(18) = 18.80
Department of Management Science [102] MES College of Engineering
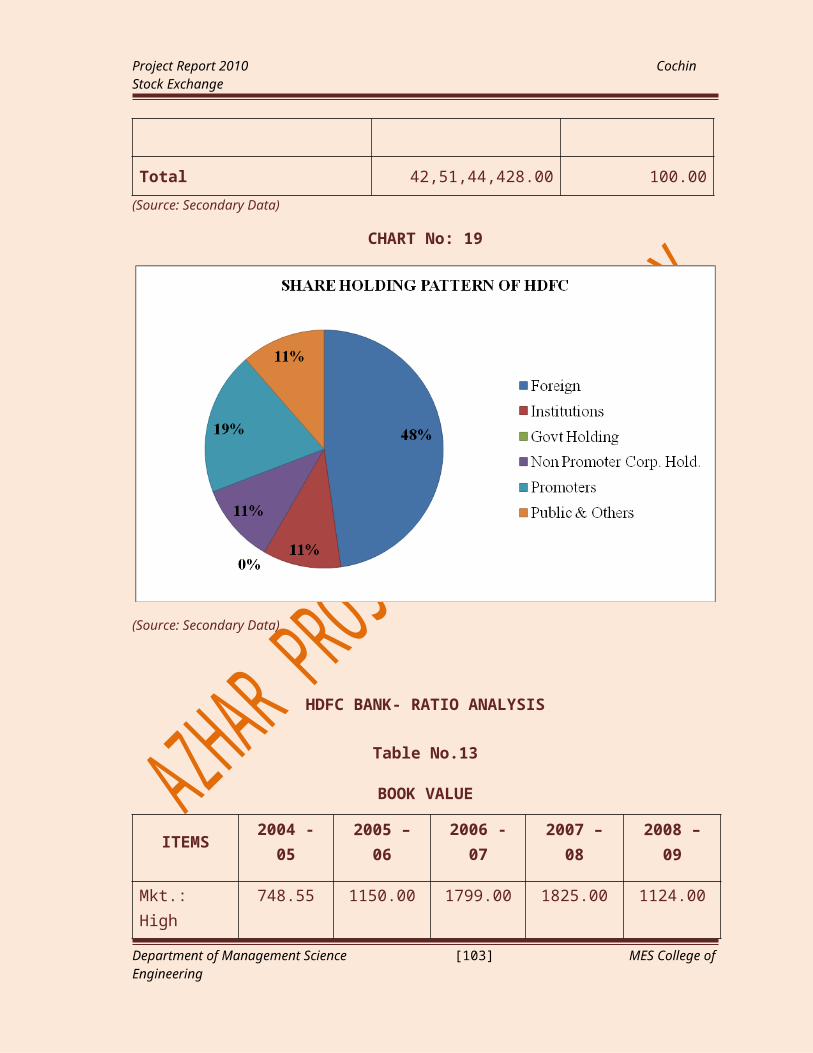
Project Report 2010 Cochin Stock Exchange
CALCULATION OF INDEX RETURNS (X)
2004-05 2005-06 2006-07 2007-08 2008-09
Opening 2074.68 2406.95 4112.59 4379.37 5769.05
Closing 2320.86 4048.24 4605.89 6015.47 3667.79
(Source: Secondary Data)
INDEX Return (X)
11.86
63.18
11.98
37.35
-36.42
Department of Management Science [103] MES College of Engineering

Project Report 2010 Cochin Stock Exchange
PORTFOLIO CONSTRUCTION
1. BASED ON EQUAL WEIGHT
2. BASED ON PE RATIO
3. BASED ON MARKET CAPITALIZTION
ALFHA, BETA AND RETURN
BANKS ALFA BETA RETURN
SBI -3.1 1.04 15.61
ICICI -6.6 0.996 11.32
HDFC 5.84 0.72 18.80
AXIS 12.89 1.07 32.15
PNB -4.89 0.52 4.77
(Source: Secondary Data)
MARKETVARIENCE CALCULATIONS
Market Variance = N∑X² – (∑X)² N²
= 5*7654.11 – 8639.70 25= 1185.2
WORKING NOTEX (INDEX RELATION) X²11.86 140.6563.18 4648.5111.98 143.5237.35 1395.02-36.42 1326.41TOTAL = 92.95 TOTAL = 7654.11(Source: Secondary Data)
Department of Management Science [104] MES College of Engineering

Project Report 2010 Cochin Stock Exchange
PORTFOLIO BASED ON EQUAL WEIGHT
Table No: 28Scrips Weight age PercentageSBI 0.20 20ICICI 0.20 20HDFC 0.20 20PNB 0.20 20AXIS 0.20 20TOTAL 1.00 100(Source: Secondary Data)
PORTFOLIO ALPHA & PORTFOLIO BETACOMPANY α (Alpha) β (Beta) Weight α*W β*WSBI -3.11 1.04 0.20 -0.622 0.208ICICI -6.6 0.966 0.20 -1.32 0.199HDFC 5.84 0.72 0.20 1.168 0.144PNB -4.59 0.52 0.20 -0.918 0.104AXIS 12.89 1.07 0.20 2.578 0.214TOTAL 4.43 4.32 1.00 0.886 0.869(Source: Secondary Data)
PORTFOLIO RETURN
Rp = αp+βpRm
0.886+(0.869*18.59)
= 17.04
PORTFOLIO RISK
σ²p = β²p* σ²m
σp = √0.755*1185.2 = 29.91
(Note: Residual Variance has been ignored)
Department of Management Science [105] MES College of Engineering

Project Report 2010 Cochin Stock Exchange
PORTFOLIO BASED ON P/E RATIO
Table No: 29Scrips P/E Ratio Weight age PercentageSBI 13.47 0.14 14ICICI 22.17 0.23 23HDFC 29.92 0.30 30PNB 22.32 0.23 23AXIS 8.81 0.10 10TOTAL 96.69 1 100(Source: Secondary Data)
PORTFOLIO ALPHA AND BETASecurity Alpha Beta Weight α*weight β *weight
SBI -3.11 1.04 0.14 -0.435 0.145ICICI -6.6 0.966 0.23 -1.518 0.229HDFC 5.84 0.72 0.30 1.752 0.216PNB -4.59 0.52 0.23 -0.459 0.052AXIS 12.89 1.07 0.10 2.964 0.246TOTAL 4.43 4.32 1 2.304 0.888(Source: Secondary Data)
PORTFOLIO RETURN
Rp = αp+βpRm
2.30+(0.888*18.59)
= 18.807
PORTFOLIO RISK
σ²p = β²p* σ²m
σp = √0.8570*1185.2 = 30.57
(Note: Residual Variance has been ignored)
Department of Management Science [106] MES College of Engineering

Project Report 2010 Cochin Stock Exchange
PORTFOLIO BASED ON MARKET CAPITALIZATIONTable No: 30
Scrip’s Market Capitalization Weight age PercentageSBI 1,31.991.55 0.30 30
ICICI 97.210.81 0.22 22
HDFC 84,458.26 0.20 20
PNB 51,954.08 0.12 12
AXIS 67,386.42 0.16 16
TOTAL 433001.12 1 100
(Source: Secondary Data)
Security Alpha Beta Weight α*weight β *weightSBI -3.11 1.04 0.30 -0.933 0.312
ICICI -6.6 0.966 0.22 -1.452 0.212
HDFC 5.84 0.72 0.20 1.168 0.144
PNB -4.59 0.52 0.12 -0.550 0.062
AXIS 12.89 1.07 0.16 2.062 0.171
TOTAL 4.43 4.32 1 0.295 0.901
(Source: Secondary Data)
PORTFOLIO RETURN
Rp = αp+βpRm
0.295+(0.901*18.59)
= 17.04
PORTFOLIO RISK
σ²p = β²p* σ²m
σp = √0.8118*1185.2 = 31.01
(Note: Residual Variance has been ignored)
Department of Management Science [107] MES College of Engineering

Project Report 2010 Cochin Stock Exchange
PORTFOLIO EVALUATION
It is the last step in the process of portfolio management. Through portfolio evaluation
investors tries to find out how well the portfolio has performed. Portfolio evaluation
comprises of performance measurement and performance evaluation. Sharpe ratio(S.R) and
Treynor ratio(TR) are the two statistical tools used in the performance measurement.
SHARPE RATIO
SR = Rp-Rf σpTREYNOR RATIO
TR = Rp-Rf Bp
RISK FREE (Rf) FACTORS
Rf value is taken as
Rf = 6.76
Department of Management Science [108] MES College of Engineering
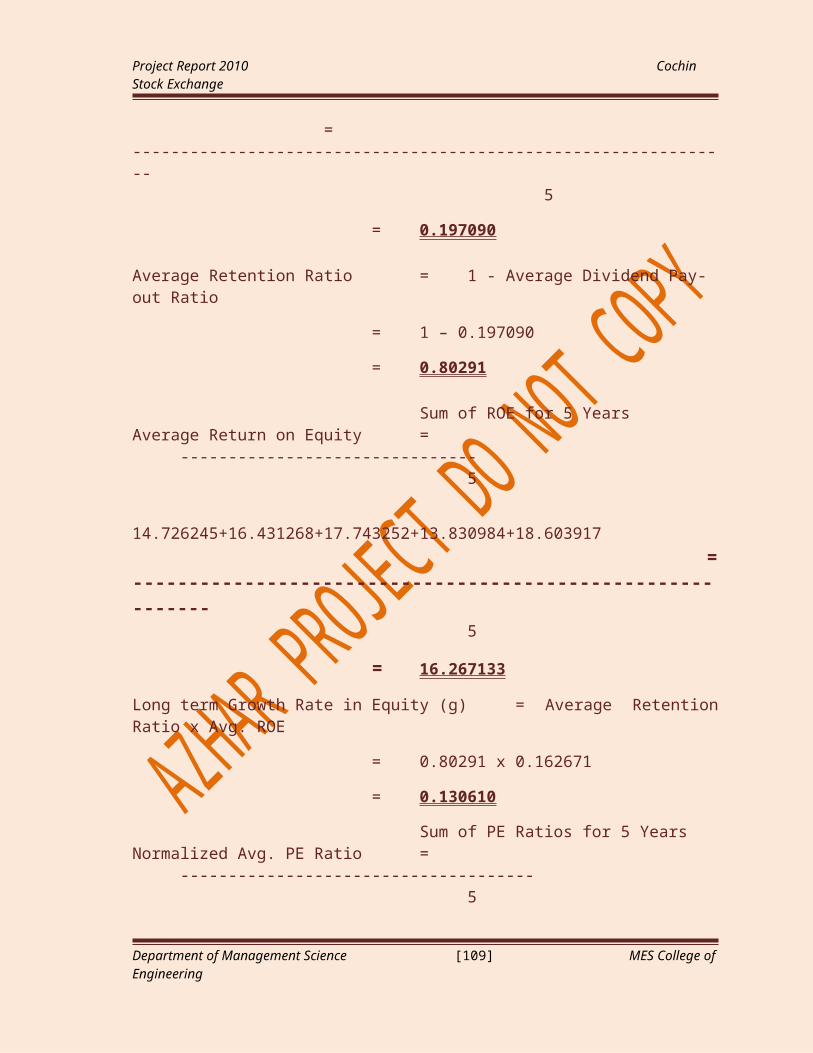
Project Report 2010 Cochin Stock Exchange
SR CALCULATION
Based on Equal Weight
Rp=17.04
σp=29.91
Βp=0.869
S.R = 17.04-6.764 = 0.343 29.91
Based on PE Ratio
Rp=18.80
σp =30.57
βp=0.888
SR = 18.80-6.764 = 0.393 30.57
Based on Market Capitalization
Rp=17.04
σp =31.04
βp=0.926
SR = 17.04-6.764 = 0.331 31.04
Department of Management Science [109] MES College of Engineering

Project Report 2010 Cochin Stock Exchange
T R CALCULATION
Based on Equal Weight
TR = 17.04-6.764 = 11.82 0.869
Based on PE Ratio
TR = 18.80-6.764 = 13.55 0.888
Based on Market Capitalization
TR = 17.04-6.764 = 11.405 0.901
Comparison of SR & TR
SR RANK TR RANK
Bases on Equal Weight 0.343 II 11.82 II
Based on P/E Ratio 0.393 I 13.55 I
Based on Market Capitalization 0.331 III 11.405 III
(Source: Secondary Data)
INFERENCEFrom the portfolio evaluation using Treynor and Sharpe Ratio it is found that Portfolio based on PE Ratio is ranked best among the other types of portfolios.
Department of Management Science [110] MES College of Engineering

Project Report 2010 Cochin Stock Exchange
CHAPTER VII
FINDINGS, SUGGESTIONS
&
CONCLUSION
Department of Management Science [111] MES College of Engineering

Project Report 2010 Cochin Stock Exchange
FINDINGS
1. FUNDAMENTAL ANALYSIS
STATE BANK OF INDIA.
The stock is said to be over priced as the intrinsic value of the security is less than
market price.
This means that the investor should sell the share as the price of the security may
come down in future.
In the year 2009, the Net-profit margin, the Return on Equity (ROE) and Earnings
per Share (EPS) has slightly increased, and Average P/E ratio has decreased
slightly.
The projected Earnings per Share (EPS) and Dividend per Share (DPS) of the
security is estimated to be Rs. 150.68 and Rs. 24.325 respectively.
ICICI BANK.
The stock is said to be over priced as the intrinsic value of the security is less than
market price.
This means that the investor should sell the share as the price of the security may
come down in future.
In the year 2009, the Net-profit margin, Return on Equity (ROE) and Average P/E
ratio has slightly decreased.
Earnings per Share (EPS) have increased slightly.
The projected Earnings per Share (EPS) and the dividend per share (DPS) of the
security is estimated to be 38.96and 118.67 respectively
Department of Management Science [112] MES College of Engineering

Project Report 2010 Cochin Stock Exchange
HDFC BANK
The stock is said to be under priced, as the intrinsic value of the security is higher
than market price.
This means that the investor should buy the share as the price of the security may
come up in future.
In the year 2009, the Net-profit margin has slightly increased, Earnings per Share
(EPS) and the Return on Equity (ROE) has increased slightly.
Average P/E ratio have decreased. .
The projected Earnings per Share (EPS) and the dividend per share (DPS) of the
security is estimated to be 57.29 and 96.1 respectively.
AXIS BANK
The stock is said to be over priced as the intrinsic value of the security is less than
market price.
This means that the investor should sell the share as the price of the security may
come less in future.
In the year 2009, the Net-profit margin has slightly increased, Earnings per Share
(EPS) and the Return on Equity (ROE) has increased.
Average P/E ratio have decreased..
The projected Earnings per Share (EPS) and Dividend per Share (DPS) of the
security is estimated to be Rs. 32.68 and Rs. 67.82 respectively.
Department of Management Science [113] MES College of Engineering
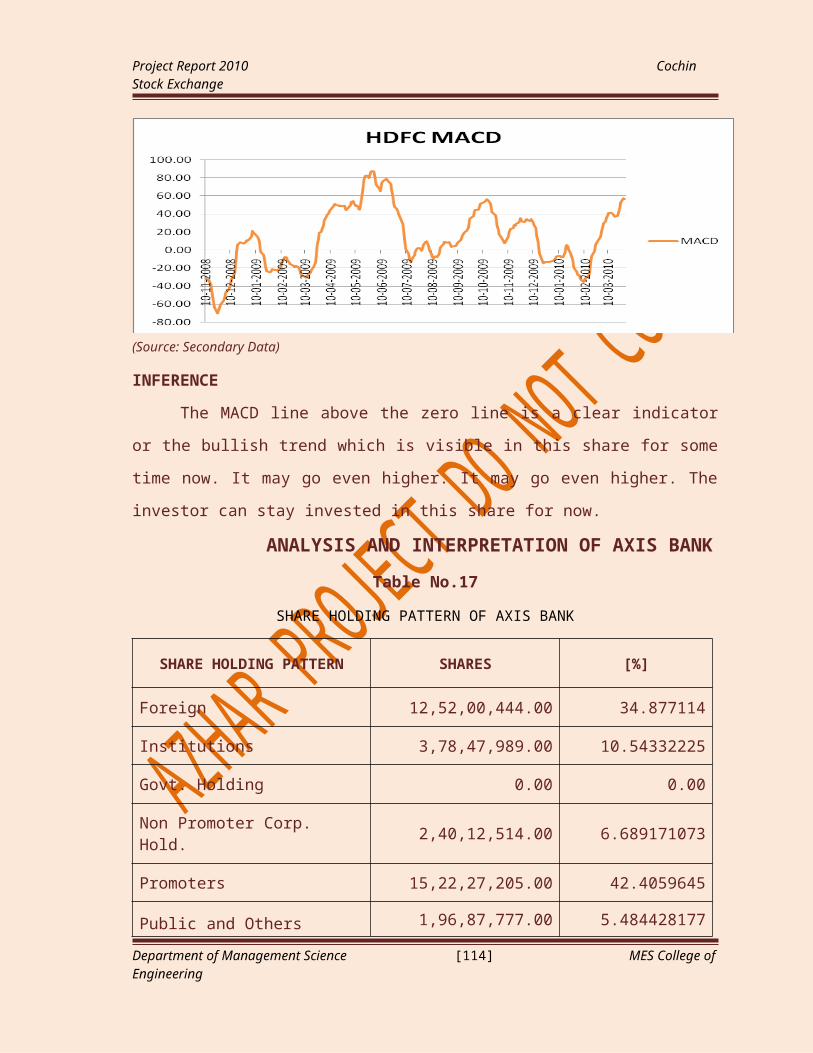
Project Report 2010 Cochin Stock Exchange
PUNJAB NATIONAL BANK
The stock is said to be over priced as the intrinsic value of the security is less than
market price.
This means that the investor should sell the share as the price of the security may
come down in future.
In the year 2009, the Net-profit margin has slightly increased, Earnings per Share
(EPS) and the Return on Equity (ROE) has increased.
Average P/E ratio has decreased.
The projected Earnings per Share (EPS) and Dividend per Share (DPS) of the
security is estimated to be Rs. 72.62 and Rs.150.41 respectively
2. TECHNICAL ANALYSES
The short term EMA 5 days gives a slightly bearish trend for all scrips except SBI
and PNB
The medium and long term EMA is bullish for all scrips.
ROC graphs give sell advice on SBI, PNB, ICICI and HDFC bank scrips and buy
for ICICI.
MACD graphs for all scrips indicate a bullish trend.
The long term and medium term predictions are bullish for all the selected banking
scrips. This means investor can hold the shares or new investor can buy the shares.
Department of Management Science [114] MES College of Engineering

Project Report 2010 Cochin Stock Exchange
3. PORTFOLIO CONSTRUCTION ANALYSIS AND SELECTION
After evaluating the three portfolios which were constructed with the different
proportions of the five selected securities and measuring performance based on Sharpe and
Treynor Ratios, it has been found that, the portfolio based on P/E Ratio ranks highest. This
has a Sharpe ratio of 0.393 and Treynor ratio of 13.55. This confirms investor’s trust in the
PE Ratio in buying a company’s scrip.
Department of Management Science [115] MES College of Engineering
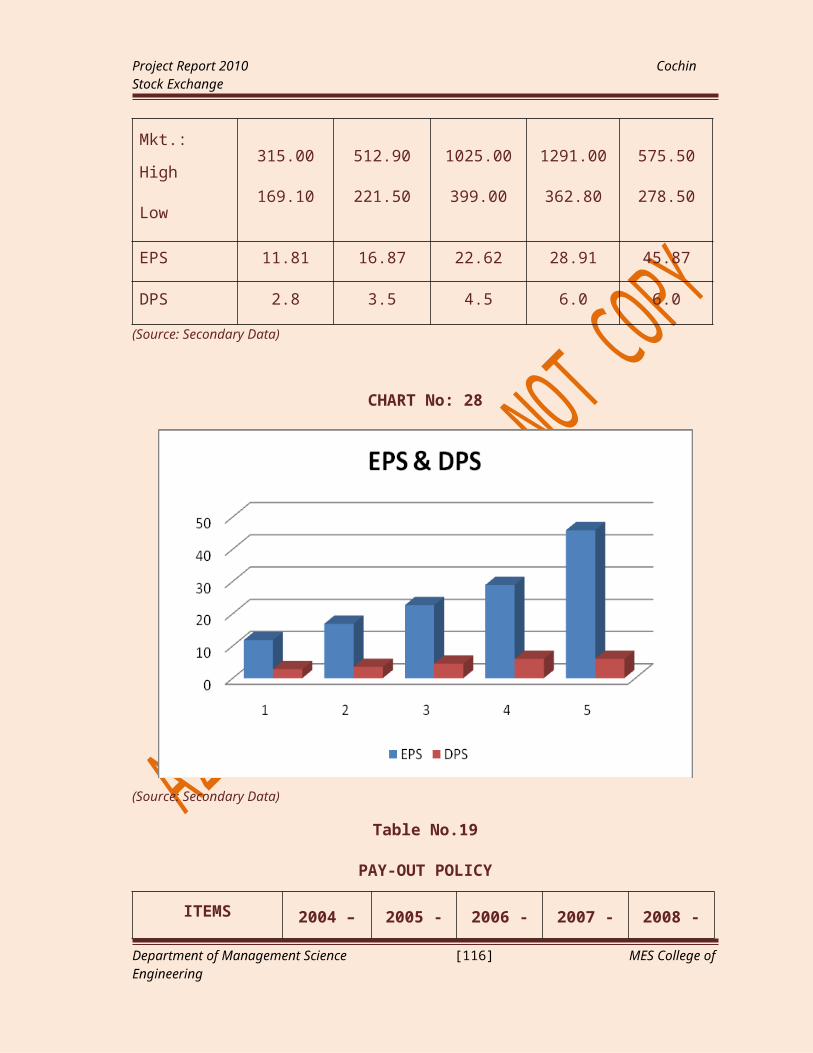
Project Report 2010 Cochin Stock Exchange
SUGGESTIONS
STATE BANK OF INDIA
The present trend suggest the investors to sell the shares for long term investment, as the
intrinsic value of share is lesser than the market value.
ICICI BANK
As the market price of the share is overvalued when compared to the intrinsic value, it is
advisable for the investors to sell the shares for long term investment. Because the market
price of the shares may decrease in future.
HDFC BANK
There has been a significant difference between the market value and the intrinsic
value. Hence the present trend recommends the investors to buy the share for long term
investment.
AXIS BANK
Since the market price is higher than the intrinsic value, such a share is considered to be
over priced and it is suitable for the investment purpose. If necessary more shares can be
sold.
PUNJAB NATIONAL BANK
The stock price is said to be over priced as the intrinsic value of the security is lesser than
the market price. Here the investor cannot hold the existing shares.
Department of Management Science [116] MES College of Engineering
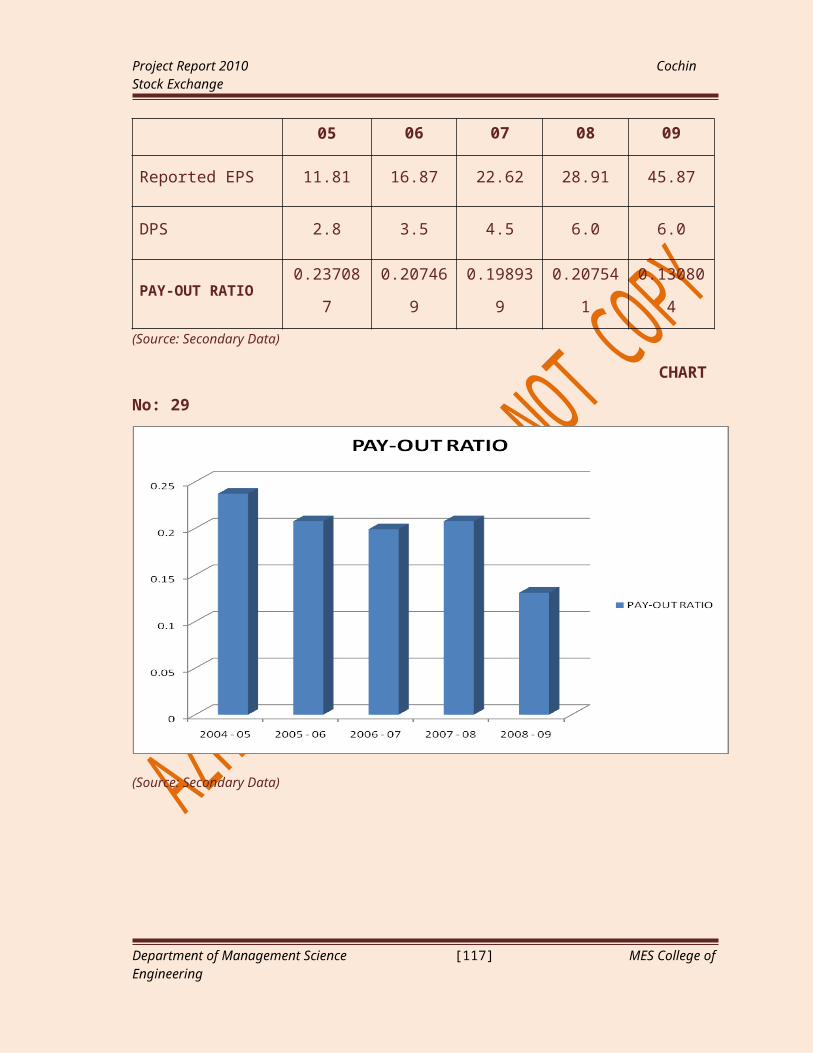
Project Report 2010 Cochin Stock Exchange
CONCLUSION
The focus of the study was construction of Portfolio and its evaluation to find the
optimal portfolio and Security analysis on the selected five securities in the banking sector.
Out of the ten companies, which were taken them on the basis of market capitalization
from the BSE (Bombay Stock Exchange) list, five companies were selected to perform the
detailed study. Data were selected from the secondary sources. The analysis was done with
five years data. Both relevant fundamental and technical analysis were used for the
analysis.
The fundamental analysis had shown the real position of the Indian economy,
which is in a booming stage and the stock market indicating the best buying and selling
opportunities. Selected banks have been analyzed for their performance in the last five
years. This analysis revealed that all the banks have shown consistently good performance
and the performance is improving every year. Therefore the performances of all these
banks are likely to be much better in the years to come.
This is the best time to invest money in shares, especially in banking sector. Now
the market is moving up from the financial crisis. So the investors recommended to buy the
shares. The intrinsic values of shares are higher than the current market price of shares. It
indicates the coming movement of shares. Based on three portfolios (PE ratio Market
Capitalization and Equal Weight), we invest on the basis of PE Ratio was more profitable.
Department of Management Science [117] MES College of Engineering

Project Report 2010 Cochin Stock Exchange
CHAPTER VIII
BIBLIOGRAPHY
Department of Management Science [118] MES College of Engineering

Project Report 2010 Cochin Stock Exchange
BIBLIOGRAPHY
DONALD E. FISCHER AND RONALD J. JORDAN, Security Analysis and
portfolio Management New Delhi: Prentice-Hall of India Private Ltd. 1998.
KWAN, CLARENCE, Optimal Portfolio, bx.businessweek.com/...clarence-
kwan/12078054773844019468-9d5eff11ed4199d58fbb3e424021f9d
P JANAKI RAO & S DURGA RAO, Investment decisions, Work911/article.htm
PRASANNA CHANDRA. Investment Analysis and Portfolio management, New
Delhi: Tata Mc Graw – Hill Publishing Company Limited, 2002
Prof. VR GANESH, Analysis of Banking Industries, www.
Woopdia.com/business_article/095345432.htm
SREE RAM G, Banking sector in Inida, www.jomfp.in/article.asp?issn=0973-
029X;year=2008
DANIEL GIAMODIURS AND LAONNIS S VRONTOS, Impact of modeling
time varying covariance/correlation, www.aueb.gr/pages_en/cv/en/1240.pdf
S. KEVINN, Portfolio Management, New Delhi: Prentice-Hall of India Private Ltd.
2003.
www.bse-inda.com
www.capitaline.com
www.indiabuilts.com
www.equitymaster.com
www.economywatch.com
www.cochinstockexchange.com
www.money.rediff.com
Department of Management Science [119] MES College of Engineering

Project Report 2010 Cochin Stock Exchange
CHAPTER XI
ANNEXURE
Punjab National Bank Industry :Banks - Public Sector
BALANCE SHEET
Department of Management Science [120] MES College of Engineering
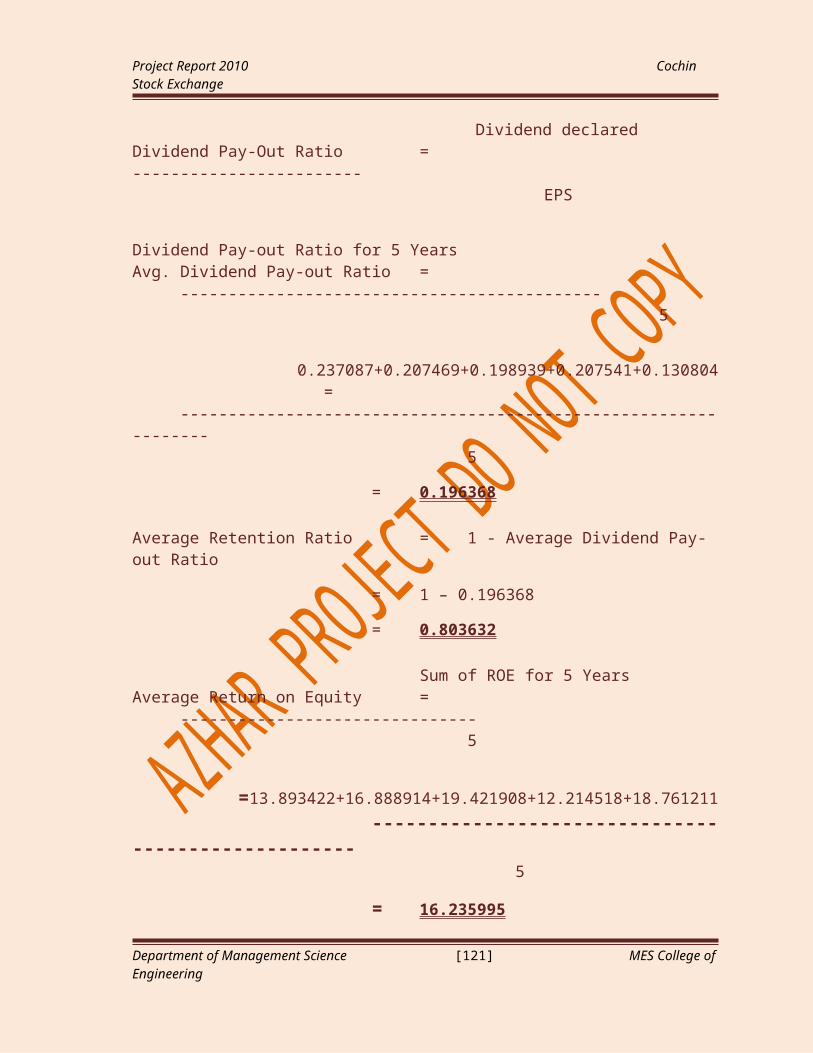
Project Report 2010 Cochin Stock Exchange
Year Mar 09 Mar 08 Mar 07 Mar 06 Mar 05
SOURCES OF FUNDS :
Capital + 315.30 315.30 315.30 315.30 315.30
Reserves Total + 14,338.33 12,003.04 10,120.16 9,061.06 7,846.00
Deposits + 209,760.50 166,457.23 139,859.67 119,684.92 103,166.89
Borrowings + 4,374.36 5,446.56 1,948.86 6,664.87 2,718.29
Other Liabilities & Provisions + 18,151.15 14,826.64 10,285.14 9,623.64 12,222.24
TOTAL LIABILITIES 246,939.64 199,048.77 162,529.13 145,349.79 126,268.72
APPLICATION OF FUNDS :
Cash & Balances with RBI+ 17,058.25 15,258.15 12,372.03 23,394.55 9,460.20
Balances with Banks & money at Call+ 4,354.89 3,572.57 3,273.49 1,397.14 1,628.83
Investments + 63,385.18 53,991.71 45,189.84 41,055.31 50,672.83
Advances + 154,702.99 119,501.57 96,596.52 74,627.37 60,412.75
Fixed Assets + 2,397.11 2,315.52 1,009.82 1,030.23 965.23
Other Assets + 5,041.22 4,409.25 4,087.43 3,845.19 3,128.88
Miscellaneous Expenditure not written off 0.00 0.00 0.00 0.00 0.00
TOTAL ASSETS 246,939.64 199,048.77 162,529.13 145,349.79 126,268.72
Contingent Liability+ 103,650.26 96,951.50 66,758.42 53,035.43 43,001.29
Bills for collection 7,561.84 7,104.56 7,942.25 5,704.17 4,046.07
Punjab National BankIndustry :Banks - Public Sector
PROFIT AND LOSS ACCOUNT
Year Mar 09(12) Mar 08(12) Mar 07(12) Mar 06(12) Mar 05(12)
INCOME :
Interest Earned + 19,326.16 14,265.02 11,236.14 9,584.15 8,459.85
Other Income + 3,224.42 2,026.46 1,932.71 1,901.00 2,186.36
Total 22,550.58 16,291.48 13,168.85 11,485.15 10,646.21
II. Expenditure
Interest expended + 12,295.30 8,730.86 6,022.91 4,917.39 4,453.11
Payments to/Provisions for Employees 2,924.38 2,461.54 2,352.45 2,114.98 2,121.23
Operating Expenses & Administrative Expenses + 663.76 563.61 485.00 455.22 384.44
Department of Management Science [121] MES College of Engineering
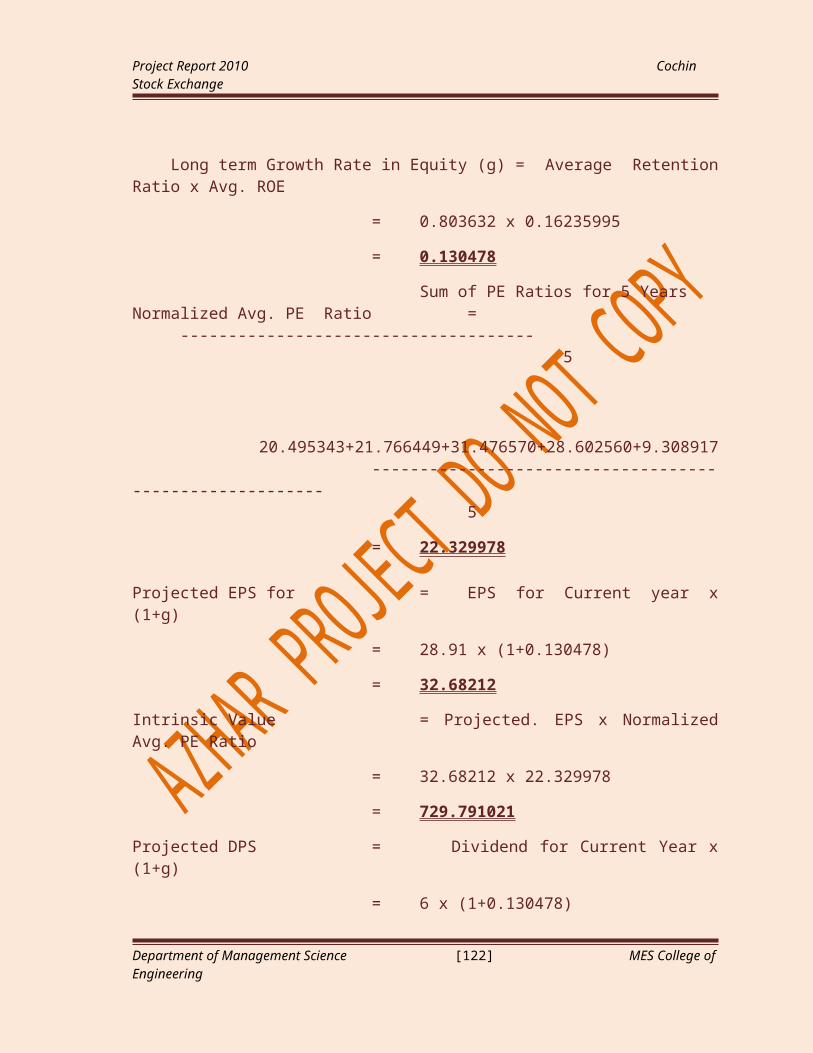
Project Report 2010 Cochin Stock Exchange
Depreciation + 191.06 170.23 194.80 186.64 183.28
Other Expenses, Provisions & Contingencies+ 1,712.66 1,072.78 1,945.94 1,777.05 1,457.07
Provision for Tax + 1,701.32 1,264.75 739.21 412.83 494.64
Deferred Tax + -41.46 -31.50 -120.50 172.73 142.32
Total 19,447.02 14,232.27 11,619.81 10,036.84 9,236.09
III. Profit & Loss
Reported Net Profit 3,090.88 2,048.76 1,540.08 1,439.31 1,410.12
Extraordinary Items + 1.18 0.70 -254.38 1.89 0.46
Adjusted Net Profit 3,089.70 2,048.06 1,794.46 1,437.42 1,409.66
Prior Year Adjustments + 0.00 0.00 -13.27 0.00 0.00
Profit brought forward 0.00 15.52 183.49 0.00 0.00
IV. Appropriations
Transfer to Statutory Reserve + 772.72 512.19 385.02 359.83 352.53
Transfer to Other Reserves + 1,572.74 1,072.54 850.03 680.28 859.93
Trans. to Government /Proposed Dividend + 737.78 479.55 459.73 215.71 197.66
Balance carried forward to Balance Sheet 7.64 0.00 15.52 183.49 0.00
Equity Dividend % 200.00 130.00 100.00 90.00 60.00
Earnings Per Share-Unit Curr 94.63 62.77 47.26 44.81 43.98
Book Value-Unit Curr 416.74 341.98 321.65 287.79 248.93
Axis Bank Ltd Industry :Banks - Private Sector
BALANCE SHEET
Year Mar 09 Mar 08 Mar 07 Mar 06 Mar 05
SOURCES OF FUNDS :
Capital + 359.01 357.71 281.63 278.69 273.80
Reserves Total + 9,854.58 8,410.79 3,111.60 2,593.49 2,134.39
Deposits + 117,374.11 87,626.22 58,785.60 40,113.53 31,712.00
Borrowings + 10,185.48 5,624.04 5,195.60 2,680.93 1,781.41
Other Liabilities & Provisions + 9,985.68 7,606.91 5,935.28 4,117.99 1,898.16
TOTAL LIABILITIES 147,758.86 109,625.67 73,309.71 49,784.63 37,799.76
APPLICATION OF FUNDS :
Cash & Balances with RBI+ 9,419.21 7,305.66 4,661.03 2,429.40 3,448.74
Balances with Banks & money at Call+ 5,597.69 5,198.58 2,257.28 1,212.44 1,054.20
Investments + 46,330.35 33,705.10 26,897.16 21,527.35 15,048.02
Advances + 81,556.77 59,661.15 36,876.48 22,314.23 15,602.92
Fixed Assets + 1,072.89 922.85 673.19 567.71 518.44
Other Assets + 3,781.95 2,832.33 1,944.57 1,733.50 2,127.44
Miscellaneous Expenditure not written off
0.00 0.00 0.00 0.00 0.00
TOTAL ASSETS 147,758.86 109,625.67 73,309.71 49,784.63 37,799.76
Contingent Liability+ 209,260.30 258,895.60 184,164.75 98,565.38 53,185.74
Bills for collection 13,957.31 8,323.39 6,274.63 4,332.20 3,616.98
Department of Management Science [122] MES College of Engineering
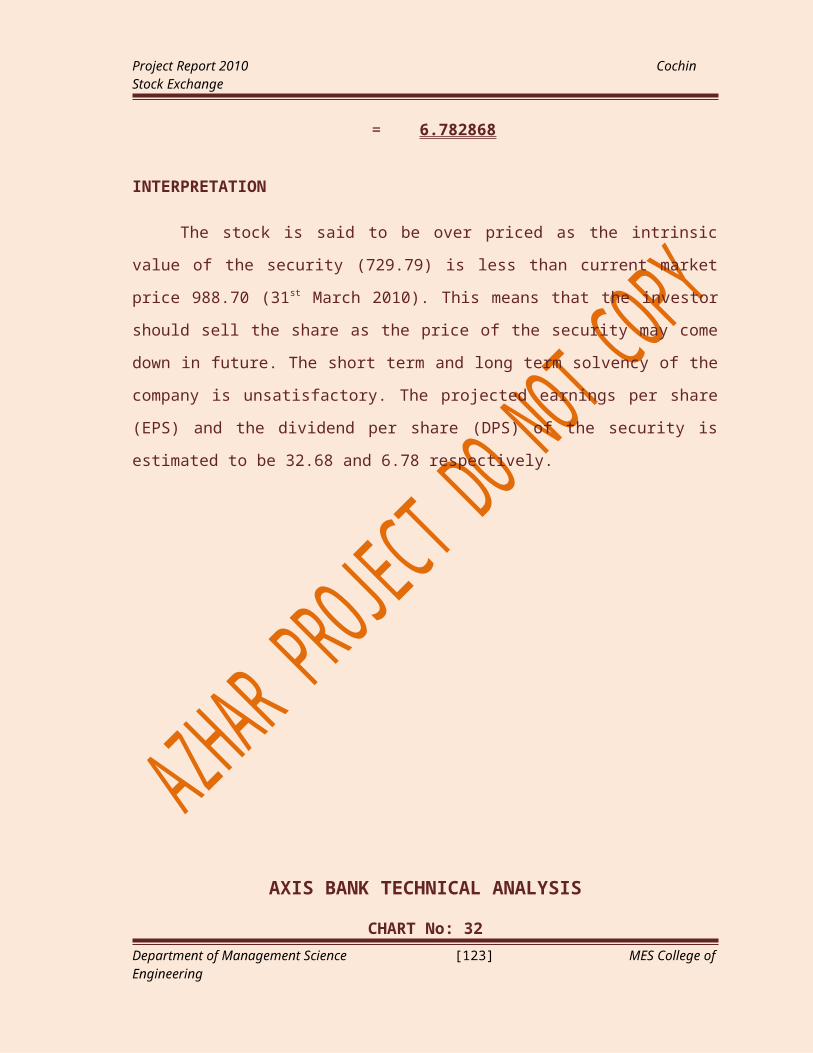
Project Report 2010 Cochin Stock Exchange
Axis Bank Ltd Industry :Banks - Private Sector
PROFIT AND LOSS ACCOUNT
Year Mar 09(12) Mar 08(12) Mar 07(12) Mar 06(12) Mar 05(12)
INCOME :
Interest Earned + 10,835.49 7,005.32 4,461.66 2,888.79 1,924.16
Other Income + 2,977.69 1,810.78 1,013.02 731.73 433.24
Total 13,813.18 8,816.10 5,474.68 3,620.52 2,357.40
II. Expenditure
Interest expended + 7,149.28 4,419.96 2,993.32 1,810.56 1,192.98
Payments to/Provisions for Employees 997.66 670.25 381.35 240.20 176.86
Operating Expenses & Administrative Expenses +
991.58 755.40 487.53 338.11 247.49
Depreciation + 188.67 158.11 111.86 92.19 81.58
Other Expenses, Provisions & Contingencies+ 1,700.79 1,166.10 504.38 408.17 154.79
Provision for Tax + 1,095.52 725.59 412.60 296.11 153.72
Deferred Tax + -137.09 -159.39 -81.36 -55.73 15.40
Total 11,986.41 7,736.02 4,809.68 3,129.61 2,022.82
III. Profit & Loss
Reported Net Profit 1,815.36 1,071.03 659.03 485.08 334.58
Extraordinary Items + -4.97 -8.49 -1.70 -1.01 -1.54
Adjusted Net Profit 1,820.33 1,079.52 660.73 486.09 336.12
Department of Management Science [123] MES College of Engineering

Project Report 2010 Cochin Stock Exchange
Prior Year Adjustments + 0.00 0.00 -31.81 0.00 0.00
Profit brought forward 1,553.87 1,029.07 731.04 197.41 182.10
IV. Appropriations
Transfer to Statutory Reserve + 453.84 267.76 164.76 121.27 83.64
Transfer to Other Reserves + 146.78 26.84 15.64 -282.37 147.88
Trans. to Government /Proposed Dividend + 420.52 251.63 148.79 112.55 87.75
Balance carried forward to Balance Sheet 2,348.09 1,553.87 1,029.07 731.04 197.41
Equity Dividend % 100.00 60.00 45.00 35.00 28.00
Earnings Per Share-Unit Curr 48.85 28.91 22.62 16.87 11.81
Book Value-Unit Curr 284.49 245.13 120.49 103.06 87.95
HDFC Bank Ltd Industry :Banks - Private Sector
BALANCE SHEET
Year Mar 09 Mar 08 Mar 07 Mar 06 Mar 05
SOURCES OF FUNDS :
Capital + 425.38 354.43 319.39 313.14 309.88
Reserves Total + 14,220.95 11,142.81 6,113.76 4,986.39 4,209.97
Deposits + 142,811.58 100,768.59 68,297.94 55,796.82 36,354.25
Borrowings + 2,685.84 4,594.92 2,815.39 2,858.48 4,790.01
Other Liabilities & Provisions + 22,814.00 16,390.26 13,772.81 9,632.04 5,841.87
TOTAL LIABILITIES 182,957.75 133,251.01 91,319.29 73,586.87 51,505.98
APPLICATION OF FUNDS :
Cash & Balances with RBI+ 13,527.21 12,553.18 5,075.25 3,306.61 2,650.13
Balances with Banks & money at Call+ 3,979.41 2,225.16 3,971.40 3,612.39 1,823.87
Investments + 58,817.55 49,393.53 30,564.80 28,393.96 19,349.81
Advances + 98,883.05 63,426.90 46,944.78 35,061.26 25,566.30
Fixed Assets + 1,706.73 1,175.09 966.67 855.08 708.32
Other Assets + 6,444.72 4,477.15 3,796.39 2,357.57 1,407.55
Miscellaneous Expenditure not written off
0.00 0.00 0.00 0.00 0.00
TOTAL ASSETS 183,358.67 133,251.01 91,319.29 73,586.87 51,505.98
Contingent Liability+ 405,981.69 593,008.08 328,148.24 214,782.34 140,777.15
Bills for collection 8,552.24 6,920.71 4,606.83 2,828.89 2,549.68
Department of Management Science [124] MES College of Engineering

Project Report 2010 Cochin Stock Exchange
HDFC Bank Ltd Industry :Banks - Private Sector PROFIT AND LOSS ACCOUNT
Year Mar 09(12) Mar 08(12) Mar 07(12) Mar 06(12) Mar 05(12)
INCOME :
Interest Earned + 16,332.26 10,115.00 6,647.93 4,475.34 3,093.49
Other Income + 3,470.71 2,283.15 1,594.59 1,213.64 731.08
Total 19,802.97 12,398.15 8,242.52 5,688.98 3,824.57
II. Expenditure
Interest expended + 8,911.10 4,887.11 3,179.45 1,929.50 1,315.56
Payments to/Provisions for Employees 2,238.20 1,301.35 776.86 486.82 276.67
Operating Expenses & Administrative Expenses +
1,580.23 1,135.40 856.26 750.19 431.92
Depreciation + 359.91 271.71 219.60 178.59 144.07
Other Expenses, Provisions & Contingencies+ 3,414.28 2,521.93 1,571.60 1,090.37 677.41
Provision for Tax + 1,054.31 866.25 581.88 359.56 333.89
Deferred Tax + 0.00 -192.58 -96.58 12.17 -20.51
Total 17,558.03 10,791.17 7,089.07 4,807.20 3,159.01
III. Profit & Loss
Reported Net Profit 2,244.94 1,590.20 1,141.45 870.78 665.56
Extraordinary Items + 2.85 0.43 -0.68 0.19 0.14
Adjusted Net Profit 2,242.09 1,589.77 1,142.13 870.59 665.42
Department of Management Science [125] MES College of Engineering

Project Report 2010 Cochin Stock Exchange
Prior Year Adjustments + 0.00 0.00 0.00 0.00 0.00
Profit brought forward 2,574.63 1,932.03 1,455.02 602.34 405.32
IV. Appropriations
Transfer to Statutory Reserve + 561.23 397.55 285.36 217.70 166.39
Transfer to Other Reserves + 304.51 197.52 117.16 -395.99 142.44
Trans. to Government /Proposed Dividend + 498.26 352.53 261.92 196.39 159.71
Balance carried forward to Balance Sheet 3,455.57 2,574.63 1,932.03 1,455.02 602.34
Equity Dividend % 100.00 85.00 70.00 55.00 45.00
Earnings Per Share-Unit Curr 51.08 43.42 34.55 27.04 20.84
Book Value-Unit Curr 344.31 324.39 201.42 169.24 145.86
ICICI Bank Ltd Industry :Banks - Private Sector
BALANCE SHEET
Year Mar 09 Mar 08 Mar 07 Mar 06 Mar 05
SOURCES OF FUNDS :
Capital + 1,463.29 1,462.68 1,249.34 1,239.83 1,086.76
Reserves Total + 48,419.73 45,357.53 23,413.92 21,316.16 11,813.20
Deposits + 218,347.82 244,431.05 230,510.19 165,083.17 99,818.77
Borrowings + 67,323.69 65,648.43 51,256.03 38,521.91 33,544.50
Other Liabilities & Provisions + 44,295.07 43,517.43 38,882.96 25,897.60 22,172.11
TOTAL LIABILITIES 379,849.60 400,417.12 345,312.44 252,058.67 168,435.34
APPLICATION OF FUNDS :
Cash & Balances with RBI+ 17,536.33 29,377.53 18,706.88 8,934.37 6,344.90
Balances with Banks & money at Call+ 12,430.23 8,663.60 18,414.44 8,105.85 6,585.08
Investments + 103,058.31 111,454.34 91,257.84 71,547.39 50,487.35
Advances + 218,310.85 225,616.08 195,865.60 146,163.11 91,405.15
Fixed Assets + 3,801.62 4,108.90 3,923.42 3,980.71 4,038.04
Other Assets + 24,712.26 21,196.67 17,144.26 13,327.24 9,574.82
Miscellaneous Expenditure not written off
0.00 0.00 0.00 0.00 0.00
TOTAL ASSETS 379,849.60 400,417.12 345,312.44 252,058.67 168,435.34
Contingent Liability+ 834,683.00 1,211,082.33 562,959.91 395,033.67 268,153.74
Bills for collection 6,000.44 4,278.28 4,046.56 4,338.46 2,392.09
Department of Management Science [126] MES College of Engineering

Project Report 2010 Cochin Stock Exchange
ICICI Bank Ltd Industry :Banks - Private Sector
PROFIT AND LOSS ACCOUNT
Year Mar 09(12) Mar 08(12) Mar 07(12) Mar 06(12) Mar 05(12)
INCOME :
Interest Earned + 31,092.55 30,788.34 21,995.59 14,306.13 9,409.89
Other Income + 8,176.26 8,878.85 6,962.95 5,062.22 3,539.67
Total 39,268.81 39,667.19 28,958.54 19,368.35 12,949.56
II. Expenditure
Interest expended + 22,725.94 23,484.24 16,358.50 9,597.45 6,570.89
Payments to/Provisions for Employees 1,971.70 2,078.90 1,616.75 1,082.29 737.41
Operating Expenses & Administrative Expenses +
1,952.99 1,922.20 1,510.44 1,126.66 850.41
Depreciation + 678.60 578.35 544.78 623.79 590.36
Other Expenses, Provisions & Contingencies+ 6,825.61 6,550.40 5,283.03 3,844.55 1,676.29
Provision for Tax + 1,793.31 1,569.53 944.32 661.87 176.49
Deferred Tax + -471.67 -713.36 -446.43 -134.68 342.51
Total 35,476.48 35,470.26 25,811.39 16,801.93 10,944.36
III. Profit & Loss
Reported Net Profit 3,758.13 4,157.73 3,110.22 2,540.07 2,005.20
Extraordinary Items + 11.37 45.23 85.37 5.60 -1.65
Adjusted Net Profit 3,746.76 4,112.50 3,024.85 2,534.47 2,006.85
Prior Year Adjustments + 0.00 0.00 0.00 0.00 0.00
Profit brought forward 2,436.32 998.27 293.44 188.22 53.09
Department of Management Science [127] MES College of Engineering
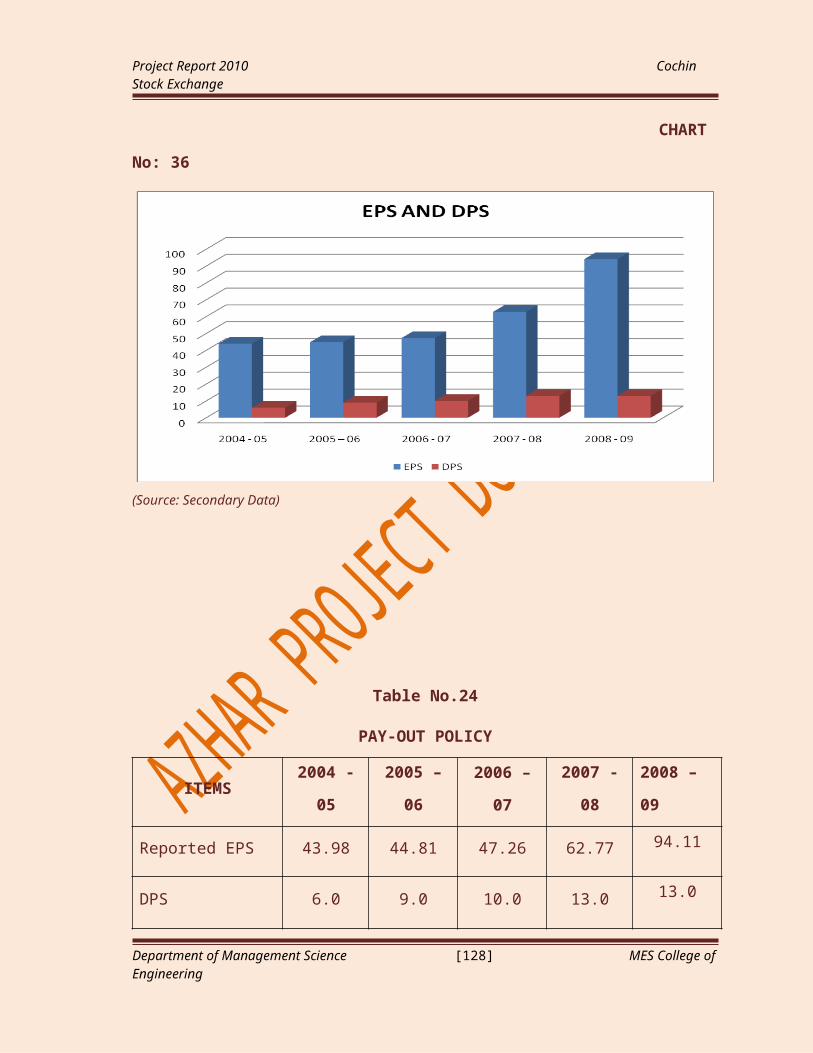
Project Report 2010 Cochin Stock Exchange
IV. Appropriations
Transfer to Statutory Reserve + 940.00 1,040.00 780.00 636.00 502.00
Transfer to Other Reserves + 1,068.43 302.31 571.12 933.02 645.01
Trans. to Government /Proposed Dividend + 1,376.37 1,377.37 1,054.27 865.83 723.06
Balance carried forward to Balance Sheet 2,809.65 2,436.32 998.27 293.44 188.22
Equity Dividend % 110.00 110.00 100.00 85.00 85.00
Earnings Per Share-Unit Curr 32.40 36.03 32.88 27.35 25.99
Book Value-Unit Curr 444.92 417.64 270.35 249.55 170.34
State Bank of India Industry :Banks - Public Sector
BALANCE SHEET
Year Mar 09 Mar 08 Mar 07 Mar 06 Mar 05
SOURCES OF FUNDS :
Capital + 634.88 631.47 526.30 526.30 526.30
Reserves Total + 57,312.82 48,401.19 30,772.26 27,117.79 23,545.84
Deposits + 742,073.13 537,403.94 435,521.09 380,046.06 367,047.52
Borrowings + 53,713.68 51,727.41 39,703.33 30,641.24 19,184.31
Other Liabilities & Provisions + 111,308.44 83,961.07 60,283.15 55,829.23 49,767.97
TOTAL LIABILITIES 965,042.95 722,125.08 566,806.13 494,160.62 460,071.94
APPLICATION OF FUNDS :
Cash & Balances with RBI+ 55,546.17 51,534.61 29,076.43 21,652.70 16,810.33
Balances with Banks & money at Call+ 48,857.63 15,931.72 22,892.26 22,907.30 22,511.77
Investments + 275,953.96 189,501.27 149,148.88 162,534.24 197,097.91
Advances + 542,503.20 416,768.20 337,336.49 261,800.94 202,374.45
Fixed Assets + 3,837.85 3,373.48 2,818.87 2,752.93 2,697.69
Other Assets + 38,344.14 45,015.80 25,533.20 22,512.51 18,579.79
Miscellaneous Expenditure not written off
0.00 0.00 0.00 0.00 0.00
TOTAL ASSETS 965,042.95 722,125.08 566,806.13 494,160.62 460,071.94
Contingent Liability+ 723,699.75 810,796.48 526,954.66 228,881.38 159,397.30
Bills for collection 43,870.57 18,946.80 23,367.51 20,592.95 16,777.31
Department of Management Science [128] MES College of Engineering

Project Report 2010 Cochin Stock Exchange
State Bank of India Industry :Banks - Public Sector
PROROFIT AND LOSS ACCOUNT
Year Mar 09(12) Mar 08(12) Mar 07(12) Mar 06(12) Mar 05(12)
INCOME :
Interest Earned + 63,788.43 48,950.31 37,242.33 35,979.57 32,428.00
Other Income + 12,694.31 9,487.11 7,429.04 7,528.16 7,121.73
Total 76,482.74 58,437.42 44,671.37 43,507.73 39,549.73
II. Expenditure
Interest expended + 42,915.29 31,929.08 22,184.13 20,390.45 18,483.37
Payments to/Provisions for Employees 9,747.31 7,785.87 7,932.59 8,123.05 6,907.35
Operating Expenses & Administrative Expenses +
2,927.84 2,382.81 1,942.13 1,808.99 1,506.06
Depreciation + 763.14 679.98 602.39 763.68 752.21
Other Expenses, Provisions & Contingencies+ 5,949.51 5,221.49 4,385.54 5,516.29 5,379.62
Provision for Tax + 5,971.52 3,823.50 3,014.61 1,682.71 2,447.22
Deferred Tax + -1,055.10 -219.43 -19.83 357.89 -230.62
Total 67,219.51 51,603.30 40,041.56 38,643.06 35,245.21
III. Profit & Loss
Reported Net Profit 9,121.23 6,729.12 4,541.31 4,406.67 4,304.52
Extraordinary Items + -1.71 7.00 4.52 1.37 -0.52
Adjusted Net Profit 9,122.94 6,722.12 4,536.79 4,405.30 4,305.04
Prior Year Adjustments + 0.00 0.00 0.00 0.00 0.00
Profit brought forward 0.34 0.34 0.34 0.34 0.34
IV. Appropriations
Transfer to Statutory Reserve + 5,291.79 4,839.07 3,358.11 2,933.77 2,482.10
Transfer to Other Reserves + 1,740.26 366.52 321.16 632.74 1,070.80
Trans. to Government /Proposed Dividend + 2,089.18 1,523.53 862.04 840.16 751.62
Balance carried forward to Balance Sheet 0.34 0.34 0.34 0.34 0.34
Equity Dividend % 290.00 215.00 140.00 140.00 125.00
Department of Management Science [129] MES College of Engineering
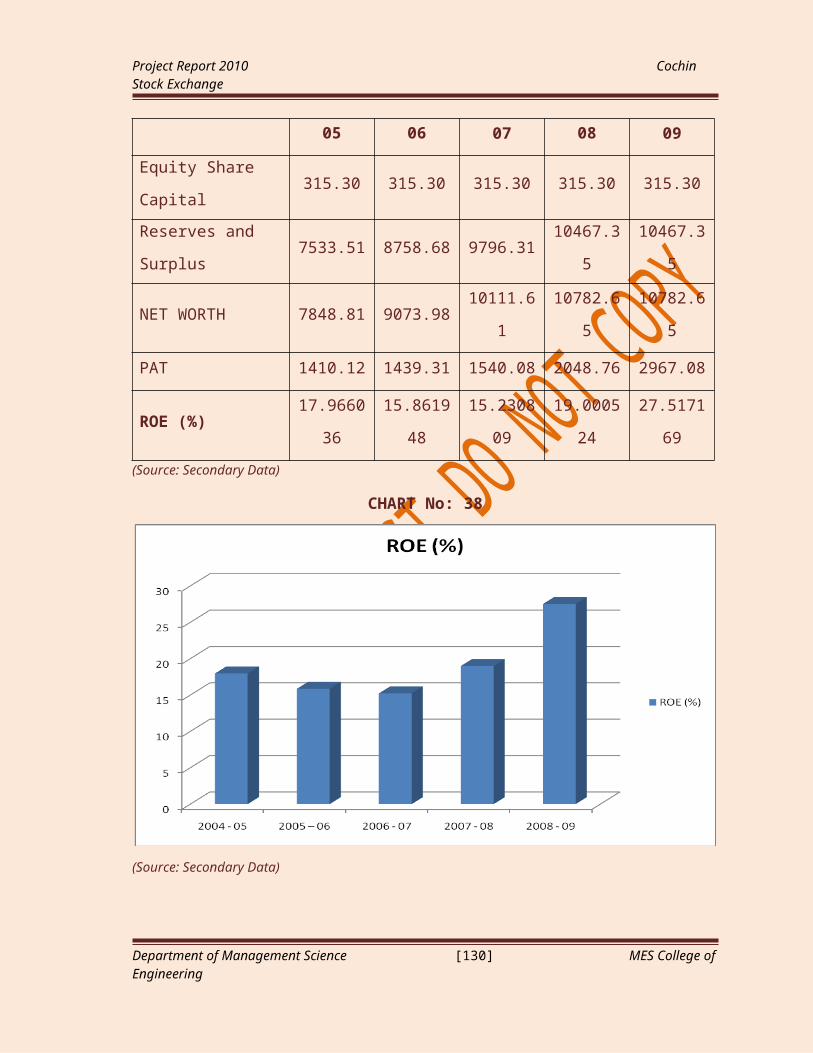
Project Report 2010 Cochin Stock Exchange
Earnings Per Share-Unit Curr 139.76 103.94 83.91 81.77 80.01
Book Value-Unit Curr 912.73 776.48 594.69 525.25 457.38
Department of Management Science [130] MES College of Engineering