
AXP Applied Equity Valuation new version
29
Important disclosures appear on the last page of this report. Financial Krause Fund Research Fall 2014 Recommendation: HOLD Analysts Jiangliang Chen [email protected] Qiao Huang [email protected] Tongxin Xian [email protected] Qiaochu Geng [email protected] Stock Performance Highlights 52 week Range $78.41‐$96.24 Beta Value 1.176 Average Daily Volume (M) 4.228 Share Highlights Market Capitalization (B) $93.83 Shares Outstanding (B) 1.04 Book Value per share $19.4 EPS (yr.) $5.38 P/E Ratio 16.73 Dividend Yield 1.1% Dividend Payout Ratio 18% Company Performance Highlights Return On Assets 3.78% Return On Equity 29.14% Discount Revenue (B) $18.7 Interest Income (B) $7 Financial Ratios Current Ratio 1.00 Debt to Equity 6.87 Earnings Estimates Year 2012 2013 2014E 2015E 2016E EPS 3.89 4.88 5.31 5.93 6.62 DIV 0.8 0.89 1.01 1.10 1.17 Sources: Yahoo! Finance i Amex-World Top Card’s Issuer With the continuing improvement of the economy, American Express had a progressive increase in its net income in 2013. Its net income rose 19.5% to $5,359 million with a 27.92% return on equity. We believe its management team will continue maintaining a high return on equity at a 25.32% in continuing value year. The economy is recovering from the crisis and customers have more resources to pay off their credits. The October Consumer Confidence Survey result showed a new recovery high at 94.5, which indicates better consumer perceptions of employment, business condition and income, and also indicates a stronger consumer spending. We are optimistic about American Express’s future growth of billed business at 7% after drove by the increasing consumer confidence level. Severe competition in the consumer finance industry forces companies to look for opportunities outside U.S. American Express proactively continues its global expansion through international partnerships, which will help American Express gain global consumers and build company name. Therefore, we believe it will boost American Express’ billed business through 4% growth rate of cards-in-force. One Year Return Sources: Bloomberg ii Company Overview American Express Company (AXP) is a global services company offering charge and credit payment card products and travel-related services to consumers and businesses around the world. The Company operates four segments: U.S. Card Services (USCS), International Card Services (ICS), Global Commercial Services (GCS) and Global Network and Merchant Services (GNMS). As of year-end 2013, the Company is the world’s largest card issuer by purchase volume, and recognized as the most innovative company in industries. With $952.3 billion worldwide billed business, the Company operates the world’s largest travel network serving consumers and business. American Express. (NYSE: AXP) Current Price: $90.13 Target Price: $101.37 – 103.41 November 18, 2014
-
Upload
qiaochu-geng -
Category
Documents
-
view
495 -
download
0
Transcript of AXP Applied Equity Valuation new version

Important disclosures appear on the last page of this report.
Financial
Krause Fund Research Fall 2014
Recommendation: HOLD
Analysts
Jiangliang Chen [email protected]
Qiao Huang [email protected]
Tongxin Xian [email protected]
Qiaochu Geng [email protected]
Stock Performance Highlights 52 week Range $78.41‐$96.24 Beta Value 1.176 Average Daily Volume (M) 4.228 Share Highlights Market Capitalization (B) $93.83 Shares Outstanding (B) 1.04 Book Value per share $19.4 EPS (yr.) $5.38 P/E Ratio 16.73 Dividend Yield 1.1% Dividend Payout Ratio 18% Company Performance Highlights Return On Assets 3.78% Return On Equity 29.14% Discount Revenue (B) $18.7 Interest Income (B) $7 Financial Ratios Current Ratio 1.00 Debt to Equity 6.87
Earnings Estimates Year 2012 2013 2014E 2015E 2016E EPS 3.89 4.88 5.31 5.93 6.62 DIV 0.8 0.89 1.01 1.10 1.17
Sources: Yahoo! Finance i
Amex-World Top Card’s Issuer
With the continuing improvement of the economy, American Express had a progressive increase in its net income in 2013. Its net income rose 19.5% to $5,359 million with a 27.92% return on equity. We believe its management team will continue maintaining a high return on equity at a 25.32% in continuing value year.
The economy is recovering from the crisis and customers have more resources to pay off their credits. The October Consumer Confidence Survey result showed a new recovery high at 94.5, which indicates better consumer perceptions of employment, business condition and income, and also indicates a stronger consumer spending. We are optimistic about American Express’s future growth of billed business at 7% after drove by the increasing consumer confidence level.
Severe competition in the consumer finance industry forces companies to look for opportunities outside U.S. American Express proactively continues its global expansion through international partnerships, which will help American Express gain global consumers and build company name. Therefore, we believe it will boost American Express’ billed business through 4% growth rate of cards-in-force.
One Year Return
Sources: Bloombergii
Company Overview American Express Company (AXP) is a global services company offering charge and credit payment card products and travel-related services to consumers and businesses around the world. The Company operates four segments: U.S. Card Services (USCS), International Card Services (ICS), Global Commercial Services (GCS) and Global Network and Merchant Services (GNMS). As of year-end 2013, the Company is the world’s largest card issuer by purchase volume, and recognized as the most innovative company in industries. With $952.3 billion worldwide billed business, the Company operates the world’s largest travel network serving consumers and business.
American Express. (NYSE: AXP)
Current Price: $90.13 Target Price: $101.37 – 103.41
November 18, 2014

Executive Summary
We recommend to hold American Express Company at this time based on our economic, industry, and company analysis. We predict the GDP will continue to increase in 2015 as well as the unemployment rate decrease. Based on our prediction and analysis, these factors stimulate the consumer confidence level to increase. With a consumer purchasing power increase, people will borrow more credit in order to spend more. As the world’s largest cards issuer and its continuous global expansion, American Express will continue increasing its revenue from billed business and maintaining a high total payout ratio around 80%.
ECONOMIC OUTLOOK
GROSS DOMESTIC PRODUCT GDP (Gross Domestic Product) is the monetary value of all the finished goods and services produced within a country’s borders during a specific time period. In the 3rd quarter of 2014, the real GDP, which is inflation adjusted, increased at annual rate of 3.5%iii, which is an indicator of the economic health of United States (U.S.). The following figure indicates the annualized quarterly real GDP from 2007 to 2014. After the 2008 financial crisis, the U.S. economy has gradually recovered since 2010 and experienced a stable and strong growth rate indicated by the dotted red line. U.S. Annualized Quarterly Real GDP (2007-2014)
Sources: bea.goviv
Following this trend, we anticipate that real GDP will experience a growth rate around 3.0 percent over the next 6 months and 2.7 to 3.0 percent over the next 2 to 3 years. Because the consumer finance industry is closely related to consumer spending, and consumer spending is around 70% of GDPv, we expect the consumer finance industry will benefit from the positive U.S. GDP growth trend.
UNEMPLOYMENT RATE The unemployment rate is the percentage rate of the total labor force that is unemployed but actively seeking employment and
willing to work. The following graph from Bureau of Labor Statistics clearly presents a declining unemployment rate from 2010. The latest released actual unemployment rate for October 2014 was 5.8 percent, which is a 0.1 percent decline compared to the September 2014 actual unemployment rate. Unemployment Rate (2004-2014)
Sources: Bureau of Labor Statisticsvi
Monthly Actual Unemployment Rate 2014vii Apr. May. Jun. Jul. Aug. Sep. Oct.
6.3% 6.3% 6.1% 6.2% 6.1% 5.9% 5.8% According to the above table, we predicted the unemployment rate will be around 5.7 percent over the next 6 months and around 6 percent over 2 to 3 years. The short-term improvement of the unemployment rate will encourage personal consumption. On the other hand, a stable and reasonable unemployment rate further increases consumer confidence. Therefore, we expect consumers will be more confident and the consumer finance industry could generate more billed business and card member loans as assets.
CONSUMER CONFIDENCE INDEX The index is based on a random consumer confidence survey provided by The Conference Board. The index that has base year 1985 equal to 100 point and measures U.S. consumers’ optimism and sentiment. Consumer Confidence Index (CCI) increased from last year’s range 58.43 to 82.13 to current year’s 78.3 to 94.48 after adjusting the seasonal effect, even reached the highest point at October as 94.48 after economic crisis of 2008.viii Financial sector, the uptrend of CCI is benefiting the financial sector, especially for the consumer finance industry. U.S. Consumer Confidence Index (1985=100)
Sources: Factset dataix
Page 2

The table above shows the CCI data from 2007 to September, 2014. As higher consumption optimism which dramatically increased from the depression, we expect that the consumer confidence will continue being optimistic and reach 100 to 110 that is similar to the point before crisis. Also, the uphill data, which means higher consumer expenditures, gives the consumer finance industry a positive effect. QUANTITATIVE EASING As the market is in depression, U.S. Federal Reserve announced that the central bank bought back governments bonds from the market to liquidate the cash flow. This quantitative easing strategy also lowers interest rates, which increases the financial services’ lending. When bank lending is more lenient by the lower overnight federal fund’s rate, the increase in commercial and consumer lending stimulates the market.x As interest rates almost reach zero and the economy is outperforming, FOMC announced the end of QE3. However, the bonds buying program of QE3 2014 may not be the end of the story, and we are still looking forward to the market’s reaction. As our perspective, interest rates will not sharply turn upward, and may stay at almost zero for at least three quarters. Financial industry will still have a positive effect from this lower overnight rate. But after that, the short term borrowing rate will increase to 2 percent in early 2016. U.S.Effective Federal Funds Rate
Sources: FREDxi
INDUSTRY ANALYSIS
INDUSTRY DESCRIPTION The financial sector is comprised of four industry groups: banks, diversified financials, insurance, and real estate. The 2008 financial crisis brought about strict credit quality regulations from the Federal Reserve. Therefore, heavy interest-bearing products and business segments, such as mortgage loans and automobile loans, declined since 2008. While banks experienced a hard time since 2008, credit card companies in the consumer finance industry will embrace its growth as consumers have lower debt services and higher savings. The consumer finance industry mainly lends credit to individual consumers. Companies’ major revenue sources are
billed business, card member account receivables, and card member loans, which generate discount revenue and net interest income, respectively. INDUSTRY DEVELOPMENTS AND TRENDS In the past few years, companies in the consumer finance industry invested significantly in social media marketing to attract new customers, build a company name, and expand market share. As the U.S. consumer finance industry has entered a mature stage, major companies strive to balance its account growth, margins, and expenses with strategic growth initiativesxii. Within traditional products and services, the major competitors in this industry are highly competitive, therefore they encounter a relative low threat of new entrants. However, as the consumer finance industry continues to develop competitive new technologies, invest heavily in social media, and create mobile payment platformsxiii, it brings new industry competitors from developing companies in the mobile payment space. Severe competition led credit card companies to seek and develop potential partnership opportunities globally. In August 2012, Discover agreed to help PayPal expand its merchant locations across Discover’s U.S. existing relationship. In return, this partnership added value to Discover’s international businessxiv. Similarly, in April 2014, American Express partnered with China Minsheng Banking Corporation to launch ‘CMBC American Express Multi Currency Platinum Credit Card’xv, which might help American Express build its company name and gain potential high end consumers. We believe this industry trend strongly validates our positive anticipation that consumer finance industry would outperform other financial industries. STRESS TEST Tier 1 Common Ratio Results of the Dodd-Frank Act Stress Test
Sources: Forbesxvi
Page 3

Dodd-Frank Act Stress Test is one important scenario check about whether the financial industrial can survive under the worst economic scenario. As the figure shown above, the average tier 1 ratio is 8.2 percent and under 5 percent is failure in this test. The results showed American Express outperform in financial industry under the hypothetical scenario in tier 1 common ratio. The company will have sufficient weighted risk capital to face the deep economic downturn. Comparing to another consumer finance company, Capital one, American Express and Discover have capability to hold the adverse scenario. Under the Dodd-Frank Act Stress Test, there is one specific test about credit card losses under the depression scenario. As the figure shown below, American Express would have lower loss under credit card in the worse scenario. Base on the structures, Capital One and Discover, which highly rely on the interest income, could not have good performance under depression. Credit Card Loss Rate test in Stress Test
Sources: federalreserve.govxvii
MARKET AND COMPETITION Consumer finance industry set its emphasis on credit card loans and consumer loans. These loans generally are higher margin but higher risk compared to other sub industries inside the financial sector. Competition is relatively more intensive than in regular financial services companies which generate capital by their sizes. The major players under this sub-industry are American Express (AXP), Capital One Financial Corporation (COF) and Discover Financial Service Inc. (DFS). However, revenue from this sub sector mainly relies on their credit card loan, so we also count two card processing companies, Visa (V) and MasterCard (MA), as main competitors. Leading Company Comparison Table
Ticket Cap. P/E ROE EPS P/B AXP 94.39B 16.86 29.14% 5.38 4.69 COF 45.78B 11.14 10.18% 7.34 1.04 DFS 29.47B 12.36 23.02% 5.26 2.77 V 156.34B 28.87 20.04% 8.62 5.68 MA 96.90B 28.95 48.38% 2.90 14.95 Sources: Yahoo.Financexviii According to the comparison within these five leading companies, Visa and MasterCard will be leading companies by higher P/E ratio and higher ROE. But if we isolate these two companies for they are card-processing companies instead of financial companies that make card loan, AXP will be the leading company within consumer finance. ROE ratio is widely used in the financial industry to measure the financial performances, and American Express is not only has higher return on equity, but also has the higher expected return from its highest P/B ratio. Market Comparison
Sources: Yahoo! Finance xix
NET CHARGE OFF RATE Net charge off rate, which is one important economic indicator, measures the proportion of never collectable balance from consumerxx. The higher the ratio is, the worse credit quality is over the economy. Also, if net charge off ratio goes upward, the financial industry has increasing uncollectable balances, which shrinks the account receivable. U.S. Net Charge off Rate for Credit Card
Sources: Bloombergxxi The graph shown above is the net charge off rate for credit card services. The subprime crisis of 2008 lifted the ratio up, and it decreased year by year after that. The net charge off rate, released from 2014 Q2 for credit cards is only 3%. We have confidence that the credit quality will maintain in high level
Page 4

and the ratio will constantly vary at lower range about 2%-3%, and in this range, consumer finance companies have lower risk to expand their business.
COMPANY ANALYSIS
COMPANY BUSINESS DESCRIPTION American Express Company is a global payment, services and travel company, which was founded in 1850 and incorporated in 1965 in New York. American Express provides services, including charge and credit payment card products and travel-related services to both individual customers and institutional business around the world. American Express Company has four reportable segments: U.S. Card Services, International Card Services, Global Commercial Services and Global Network & Merchant Services.xxii 52% of American Express’ revenue comes from U.S. Card Services segment. Revenue component by Segments of American Express
Sources: FactSetxxiii American Express Company has nine subsidiaries, including American Express Ltd, Accertify, Inc., American Express Canada, American Express Financial Corp., Revolution Money, Inc., Harbor Payment Holdings, Inc., American Express Travel Related Services Co., Inc., American Express Centurion Bank, and Rockford Industries, Inc.xxiv People seldom know that American Express has nine subsidiaries because the most well-known product and services American Express provides is its card-issuing business. CORPORATE STRATEGY According to American Express Company’s annual report, its core corporate strategy is “broadening the card member and merchant base for our network worldwide.xxv American Express’s Global Merchant Services business is one of the core focuses to achieve its corporate strategy. In order to broaden its merchant base, American Express carefully select qualified third-party banks and financial institutions and sign partnership contract with them. American Express also spends large amounts of time and effort to acquire and retain high-spending and creditworthy card members through providing different rewards or loyalty programs, high-quality customer services and a safe security system.
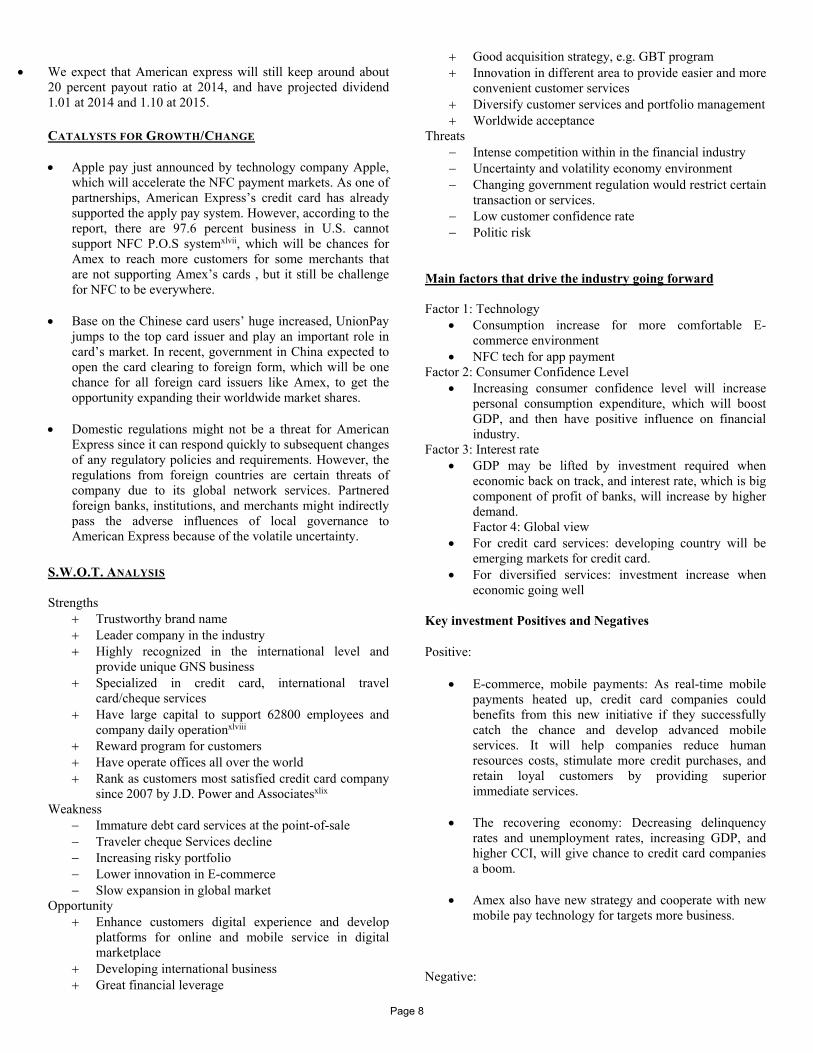
MARKET STRATEGY American Express is unlike other card processers, such as Visa or MasterCard, uses Closed Loop Network strategy, which can place American express’s position in card issuer, network, processor and merchant acquire. The model they used gives them ability to see both sides of the transaction and makes it easier for them to provide perspectives to merchants. Closed Loop Network Model
Sources: American Expressxxvi Not only can they gain on both side’s information, the company also applies a spend-centric model that target customers who are more likely to spendxxvii. Under these two models, its billed business increased 7 percent last fiscal year, and spending per card member is generally higher than competitors in industryxxviii. In our view, the billed business under its advantages of models will constantly growth at 7 percent after, but in this intensive competitive credit card market, the average discount rate bill to each business will decrease due to attracting more businesses join. FINANCIAL SUMMARY American Express Company is classified as Consumer Finance industry under Financial Sector based on Global Industry Classification Standard.xxix According to the Nilson Report published in February 2014, American Express accounted for 12.1 percent of general-purpose credit card outstanding balance.xxxAmerican Express Company has 5.70 percent quarterly revenue growth rate from Q1 to Q2 2014 main resulting from the increase in discount revenue and net card fees.xxxi The increase in new card members and current card members’ spending drive the increase in discount revenue and net card fees, which then increased the total revenue. The company seeks to have an at least 8 percent growth rate on its revenue net of interest expense. However, it only has 3.1% growth in revenue net of interest expense in Q3. The earning per share increased from $3.69 to $4.19. We believe that American Express will have a revenue growth rate close to 3.3 to 3.5 percent for its fiscal year 2014 based on the fact that the growth in consumer confidence in the next 3 to 6 month will drive the consumer credit card spending.
Page 5
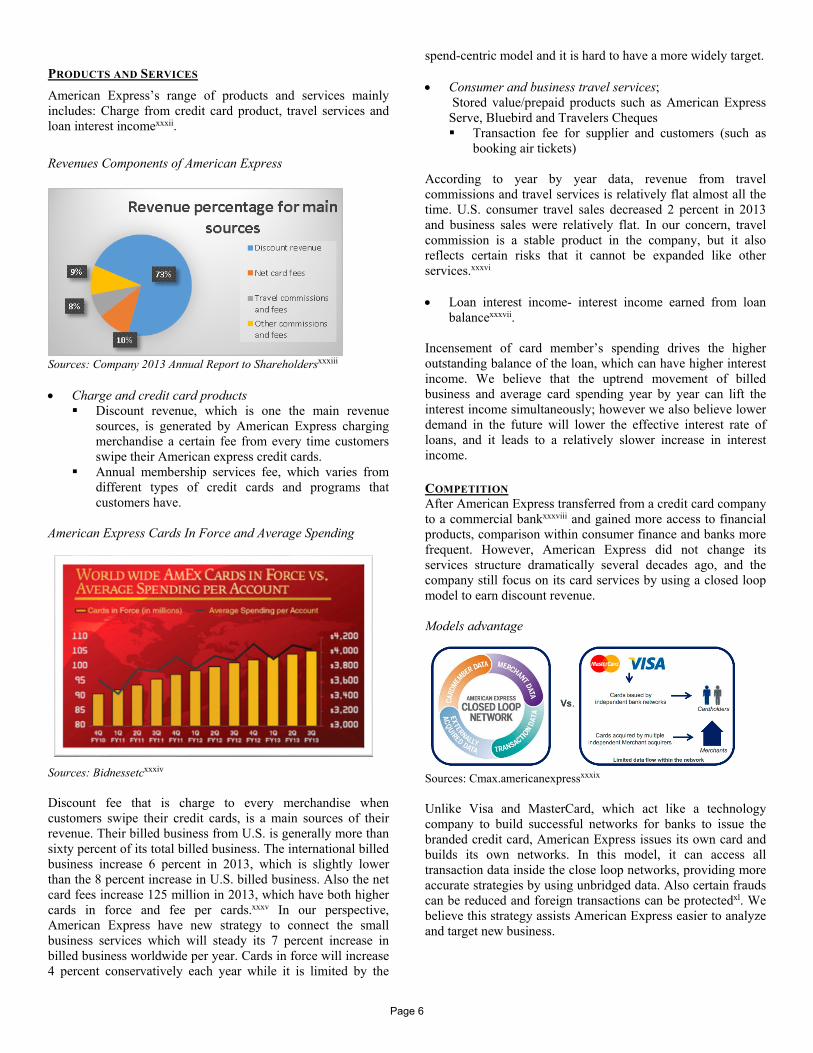
PRODUCTS AND SERVICES
American Express’s range of products and services mainly includes: Charge from credit card product, travel services and loan interest incomexxxii.
Revenues Components of American Express
Sources: Company 2013 Annual Report to Shareholdersxxxiii Charge and credit card products
Discount revenue, which is one the main revenue sources, is generated by American Express charging merchandise a certain fee from every time customers swipe their American express credit cards.
Annual membership services fee, which varies from different types of credit cards and programs that customers have.
American Express Cards In Force and Average Spending
Sources: Bidnessetcxxxiv
Discount fee that is charge to every merchandise when customers swipe their credit cards, is a main sources of their revenue. Their billed business from U.S. is generally more than sixty percent of its total billed business. The international billed business increase 6 percent in 2013, which is slightly lower than the 8 percent increase in U.S. billed business. Also the net card fees increase 125 million in 2013, which have both higher cards in force and fee per cards.xxxv In our perspective, American Express have new strategy to connect the small business services which will steady its 7 percent increase in billed business worldwide per year. Cards in force will increase 4 percent conservatively each year while it is limited by the
spend-centric model and it is hard to have a more widely target.
Consumer and business travel services; Stored value/prepaid products such as American Express Serve, Bluebird and Travelers Cheques Transaction fee for supplier and customers (such as
booking air tickets)
According to year by year data, revenue from travel commissions and travel services is relatively flat almost all the time. U.S. consumer travel sales decreased 2 percent in 2013 and business sales were relatively flat. In our concern, travel commission is a stable product in the company, but it also reflects certain risks that it cannot be expanded like other services.xxxvi Loan interest income- interest income earned from loan
balancexxxvii.
Incensement of card member’s spending drives the higher outstanding balance of the loan, which can have higher interest income. We believe that the uptrend movement of billed business and average card spending year by year can lift the interest income simultaneously; however we also believe lower demand in the future will lower the effective interest rate of loans, and it leads to a relatively slower increase in interest income. COMPETITION After American Express transferred from a credit card company to a commercial bankxxxviii and gained more access to financial products, comparison within consumer finance and banks more frequent. However, American Express did not change its services structure dramatically several decades ago, and the company still focus on its card services by using a closed loop model to earn discount revenue. Models advantage
Sources: Cmax.americanexpressxxxix Unlike Visa and MasterCard, which act like a technology company to build successful networks for banks to issue the branded credit card, American Express issues its own card and builds its own networks. In this model, it can access all transaction data inside the close loop networks, providing more accurate strategies by using unbridged data. Also certain frauds can be reduced and foreign transactions can be protectedxl. We believe this strategy assists American Express easier to analyze and target new business.
Page 6

SPEND-CENTRIC MODEL It is clear that Visa and MasterCard play important roles in the cards market. If we compare credit card purchase volume by independent network type, Visa is steady in almost 45 percent of the market. During recent years, American Express’s credit card purchase volume has higher share in the market and exceeds MasterCard’s. This result is not only based on the increased billed business, but also the higher spending for each American Express card member. Credit Card Market Share by Purchase Volume
Sources: Cardhubxli It is clearer explained at the graph below. If we compare the credit card market by independent issuers, American Express has dramatic outperform in the U.S. market. Base on its spend-centric strategy, which means that the company targets higher spending card members, average cardmember spend per account is remarkably higher than other issuer. Average Cardmember Spending Comparison
Sources: Punchcardblog.wordpressxlii We have confidence that the spend-centric model will provide better spending figures per card base on the economic recovery and the uptrend consumer confidence index. LOYALTY Compare to other credit card issuers or consumer finance companies, like capital one and discover, American express has higher brand reputation. According to the survey shown below, American Express is more reliable and has higher quality compare to other issuerxliii. We define this reputation caused by that the targeted business and partnerships with American Express are always middle to large size business, and it gives
card user’s distinctive experience by using their cards. We have faith in that the brand will still have highest reputation inside the consumer finance industry as credit card issuer; however, that standing at the industry average innovation and creativity level is not a good signal for a traditional credit card company in this E-commerce century. Brand Reputation Comparison
Sources: Punchcardblog.wordpressxliv
Other strengths Regulation As a bank holding company, American Express’s capital actions are regulated under the New Capital Rule forced by Federal Reserve. Dodd-Frank Act enforces straightforward capital ratios that must be achieved by all bank holding companies, including American Express. On March 2014, the released Federal Reserve report of “Supervisory Stress Test Methodology and Results” projected minimum Tier 1 common ratio for all bank holding companies from Q4 2014 to Q4 2015. Among 30 participants, American Express has a 12.1% projected Tier 1 common ratio compared to 8.2% median ratio. This result indicates American Express has strong resistance against adverse economic conditions. Dividend Pay Out Plan: American Express aims to return approximate 50 percent of the returned capital to shareholders through dividends and share buybacks. On March 26, Federal Reserve approved American Express’s capital plan. This capital plan includes 26 cents per share quarterly dividend and 4.4 billion common share buybacks during 2014 with an additional 1 billion in the first quarter of 2015.xlv Strong payout program indicates American Express’s confidence and robust business performances. American Express Dividend Payout Ratio
Sources: bidnessetcxlvi
Page 7
We expect that American express will still keep around about
20 percent payout ratio at 2014, and have projected dividend 1.01 at 2014 and 1.10 at 2015. CATALYSTS FOR GROWTH/CHANGE
Apple pay just announced by technology company Apple,
which will accelerate the NFC payment markets. As one of partnerships, American Express’s credit card has already supported the apply pay system. However, according to the report, there are 97.6 percent business in U.S. cannot support NFC P.O.S systemxlvii, which will be chances for Amex to reach more customers for some merchants that are not supporting Amex’s cards , but it still be challenge for NFC to be everywhere.
Base on the Chinese card users’ huge increased, UnionPay jumps to the top card issuer and play an important role in card’s market. In recent, government in China expected to open the card clearing to foreign form, which will be one chance for all foreign card issuers like Amex, to get the opportunity expanding their worldwide market shares.
Domestic regulations might not be a threat for American Express since it can respond quickly to subsequent changes of any regulatory policies and requirements. However, the regulations from foreign countries are certain threats of company due to its global network services. Partnered foreign banks, institutions, and merchants might indirectly pass the adverse influences of local governance to American Express because of the volatile uncertainty.
S.W.O.T. ANALYSIS Strengths
Trustworthy brand name Leader company in the industry Highly recognized in the international level and
provide unique GNS business Specialized in credit card, international travel
card/cheque services Have large capital to support 62800 employees and
company daily operationxlviii Reward program for customers Have operate offices all over the world Rank as customers most satisfied credit card company
since 2007 by J.D. Power and Associatesxlix Weakness
Immature debt card services at the point-of-sale Traveler cheque Services decline Increasing risky portfolio Lower innovation in E-commerce Slow expansion in global market
Opportunity Enhance customers digital experience and develop
platforms for online and mobile service in digital marketplace
Developing international business Great financial leverage
Good acquisition strategy, e.g. GBT program Innovation in different area to provide easier and more
convenient customer services Diversify customer services and portfolio management Worldwide acceptance
Threats Intense competition within in the financial industry Uncertainty and volatility economy environment Changing government regulation would restrict certain
transaction or services. Low customer confidence rate Politic risk
Main factors that drive the industry going forward Factor 1: Technology
Consumption increase for more comfortable E-commerce environment
NFC tech for app payment Factor 2: Consumer Confidence Level
Increasing consumer confidence level will increase personal consumption expenditure, which will boost GDP, and then have positive influence on financial industry.
Factor 3: Interest rate GDP may be lifted by investment required when
economic back on track, and interest rate, which is big component of profit of banks, will increase by higher demand. Factor 4: Global view
For credit card services: developing country will be emerging markets for credit card.
For diversified services: investment increase when economic going well
Key investment Positives and Negatives
Positive:
E-commerce, mobile payments: As real-time mobile payments heated up, credit card companies could benefits from this new initiative if they successfully catch the chance and develop advanced mobile services. It will help companies reduce human resources costs, stimulate more credit purchases, and retain loyal customers by providing superior immediate services.
The recovering economy: Decreasing delinquency rates and unemployment rates, increasing GDP, and higher CCI, will give chance to credit card companies a boom.
Amex also have new strategy and cooperate with new mobile pay technology for targets more business.
Negative:
Page 8

Government regulation and capital requirement: Since
2008 credit crisis, governmental regulations on financial institutions are strict. If banks are too optimistic about credit quality and overly loose the loan standards, it could trigger regulators’ alerts, which constrains the earnings growth of banks.
Foreign currency exchange rate: The fluctuate currency exchange rate may be a negative factor for international financial companies because it will cause companies reconsider their business structure overseas and may lose some good investment opportunities.
Intense competition within the industry: According to the previous Porter’s 5 forces analysis, we found customers tend to choose financial companies that have long history, trustworthy name and can provide wide range services. Most leading companies in the industry fit these criteria so they will introduce beneficial policy for example provide lower interest rate to customers to stand out in the competition. These kind of policies may lead to malpractice competition that will harm the whole industry,
VALUATION MODEL
STOCK PRICE ESTIMATES Through different valuation models, we generated various estimated stock prices of American Express (partial year adjusted): DCF& EP: $ 101.37 DDM: $ 103.41 Avg. Relative P/E: $ 85.79 Avg. PEG Ratio: $ 75.32 P/B Multiple 2014: $ 76.63 Even though we projected different stock prices from various valuation models, we have more confidence in the stock prices derived from discounted cash flow (DCF) and dividend discount model (DDM). Although the relative valuation models provide a useful industrial outlook for us as we use the average major competitors’ multiplier, we do not value the quality of the output from these models. Because American Express itself stands as an outliner among its major competitors’ multiples, we think relative valuation models are unreliable. In contrary, the DCF valuation model includes several company specific key assumptions, while the DDM valuation model relies on the company’s stable dividend payout ratio. Thus, we are confident about the price projections of $101.37 and $103.41 generated from the DCF and DDM valuation models. KEY ASSUMPTIONS Revenue Decomposition American Express’ revenue is comprised of discount revenue and interest income. In historical average, discount revenue
counts 55% of total revenue, while interest income counts 19% of total revenue. While discount revenue is the main driver of revenue from billed business, interest income is generated from card member loans. We further decomposed interest income into four business segments: U.S. card services, international card services, global network and merchant services, and corporate services. Our assumptions were mainly derived from American Express’ historical performance and adjusted to the current economy and industry trends. Billed Business Discount revenue is composed of fees charged to merchants as consumers use American Express cards at their stores, billed business plays a key role in generating revenue. Billed business is also the original source of interest income on loans. American Express defines card member loans as revolving amounts due on lending card products that are recorded with a merchantl. Since billed business equals cards in force times revenue per card, the number of cards that are issued and outstanding is essential in generating revenue. Based on the historical average growth rate of 5%, we believe cards-in-force will grow at 4%over the next 3 years and 3% over the next 4 years till the continuing value year. This growth rate slowdown indicates that American Express is shifting its strategy from attracting consumers to gaining market share to build more partnerships in the mobile payment revolution. For revenue per card, we anticipated a 1.5% growth rate since consumer confidence level has been enhanced. Thus, we projected a 4.5% growth rate of billed business. Discount Revenue Based on the projected billed business, we believe a 1.7% CV percentage fees charged on billed business from merchants will generate American Express’ discount revenue. This rate is slightly lower than 2013 effective 1.96%, since we believe it is necessary for American Express to lower its rate to build more business agreements with merchants. Cost of Equity In the financial sector, liability management is a core business and not just a source of financing. Therefore, the cost of equity is a more practical and valuable measure than the weighted average cost of capital. Cost of equity accounts for the value from both asset allocation, investment portfolio returns, and liability management. To generate the cost of equity, we adopted CAPM model which requires risk-free rate, the firm’s beta, and the market risk premium. We used 1.176 as American Express’s beta from Bloomberg as of 10/29/2014. For risk-free rate, we believed the 30-year U.S. Treasury bond rate of 3.05% would best guarantee a risk-free investment. To get a more reliable market risk premium, we used the geometric average of historical market risk premiums from 1928-2013, which is 4.64 percent. Consequently, we generate an 8.51% cost of equity. Discounted Cash Flow/Economic Profit Model We believe that the discounted cash flow model and economic profit model projected the best intrinsic value for American Express. As DCF model considers CV year net income, free cash flow to equity, CV growth, CV ROE, and cost of equity, it projected stock price of $97.07 as of 12/31/2013. After partial
Page 9

year adjustment, we predict American Express stock price will reach $103.41 as of 11/17/2014. Dividend Discount Model Since American Express anticipates stable dividend payout ratio, we believe DDM provides a reliable valuation. Historically, American Express distributed 18.2 percent of net income to its shareholders. Following this ratio, we predicted $97.07 stock price as of 12/31/2013. The partial year adjusted stock price is $103.41 as of 11/17/2014.
SENSITIVITY ANALYSIS
Overview The forecasts in our valuation models can be volatile if key assumptions are different from actual values. We tested diverse scenarios and analyzed their impacts on projected stock price, produced several sensitivity tables. ROE/CV Growth First, we tested the combined impact of return on equity and continuing value growth rate. Since return on equity and CV growth are key assumptions in DCF, EP, and DD models, slight upward/downward change will affect current projected stock price. American Express historically had a ROE between 20-29%, so we include a range between 23.5% and 27.5%. CV growth is closely related to the GDP growth rate, therefore we anticipate a CV growth range between 2.75% and 4.25%, which fluctuate around current real GDP. According to the table, we observed that stock price is more sensitive to CV growth. With 0.25% drop in CV growth rate, projected stock price will decrease to $98.44; in contrary, projected stock price will increase to $104.61. Thus, any changes in factors that related to GDP should take into further considerations.
Cost of Equity/CV Growth We also tested the stock price change from fluctuations of cost of equity and CV growth. In calculating the cost of equity, we used the CAPM approach by combining effects of the risk-free rate, company’s beta, and the market risk premium. As Federal Reserve decided to quit QE strategy, we believe Treasury bond yields will rise and affect the risk-free rate, as Treasury bond yield is a proxy of risk-free rate. The following table indicates that a small change in cost of equity has a dramatic impact in projected stock price. When cost of equity increases to 8.75%, stock price will drop to $96.62, which reflects a $5.05 decrease. Therefore, we expect price adjustments as Federal Reserve announces any changes.
MRP/Beta Another two assumptions in CAPM approach are the market risk premium and company specific beta. We are very confident about our 4.64% assumption of MRP in a long-term outlook because it covers a large number of years’ statistics. However, in a short-term, the actual MRP will reflect the change of the risk-free rate. As Fed quits the QE strategy, we expect MRP will decrease as the risk-free rate increases. Thus, stock price will move left toward current projection. Beta measures the systematic risk of AXP in comparison to the whole market. We believe AXP will gradually have a higher beta because it faces more global factors as it continues to expand its global markets. Combining these two possible changes, AXP’s stock price will fall in the left bottom range.
Percentage Fees Charged to Merchants/Billed Business Growth Rate Discount revenue is the major revenue source of American Express that generated from fees charged to merchants on billed business. Historically, American Express had 1.95% to 2.26% fees charged to merchants. We anticipated a 1.7% in CV year because company needs to lower the charged fees in order to survive as the credit card market becomes saturated and competition goes severely. However, because American Express has a diversified products and services relating to its cards, this rate might be higher than our projection as it has more cross selling. Meanwhile, as American Express’ global expansion and partnership strategy achieved superior success compared to industrial competitors, CV billed business would be higher than 4.5%. Therefore, the further price adjustment will fall in the right bottom range.
Page 10

CV Effective Interest Rate on Card Member Loan/CV Card Member Loan Growth Rate Interest income is the second largest source of AXP’s revenue. Although severe competition will force American Express lowers its interest rate as we forecasted 8.72%, credit quality concern might stimulate American Express to increase its interest rate. Similarly, card member loans growth rate might be affected downward as a higher interest rate forces consumers and merchants pay in a timely base. Thus, the projected stock price might fall in left upper range.
IMPORTANT DISCLAIMER
This report was created by students enrolled in the Security Analysis (6F:112) class at the University of Iowa. The report was originally created to offer an internal investment recommendation for the University of Iowa Krause Fund and its advisory board. The report also provides potential employers and other interested parties an example of the students’ skills, knowledge and abilities. Members of the Krause Fund are not registered investment advisors, brokers or officially licensed financial professionals. The investment advice contained in this report does not represent an offer or solicitation to buy or sell any of the securities mentioned. Unless otherwise noted, facts and figures included in this report are from publicly available sources. This report is not a complete compilation of data, and its accuracy is not guaranteed. From time to time, the University of Iowa, its faculty, staff, students, or the Krause Fund may hold a financial interest in the companies mentioned in this report.
Page 11

References i American Express Company (AXP). (n.d.). Retrieved November 18, 2014, from <http://finance.yahoo.com/q/co?s=AXP+Competitors> ii AXP Equity. (n.d.). Retrieved November 18, 2014, from <Bloomberg terminal> iii Mataloni, L., & Aversa, J. (Eds.). (2014, October 30). News Release: Gross Domestic Product. Retrieved November 18, 2014, from <http://www.bea.gov/newsreleases/national/g p/gdpnewsrelease.htm> iv National Economic Accounts. (n.d.). Retrieved November 18, 2014, from <http://www.bea.gov/national/Index.htm> v Graph: Personal Consumption Expenditures/Gross Domestic Product. (n.d.). Retrieved November 18, 2014, from <http://research.stlouisfed.org/fred2/graph/?g=hh3> vi Databases, Tables & Calculators by Subject. (2014, November 8). Retrieved November 18, 2014, from <http://data.bls.gov/timeseries/LNS14000000> vii Economic Calendar. (n.d.). Retrieved November 18, 2014, from <http://www.bloomberg.com/markets/economic-calendar/ > viii Bloomberg L.P. (2014) CONCCONF from 01/01/13 to 11/1/14. Retrieved November 18, 2014, from Bloomberg database. ix FactSet Research Systems. (n.d.). American Express. Retrieved November 18, 2014, from FactSet database. x Prime rate, federal funds rate, COFI. (n.d.). Retrieved November 18, 2014, from <http://www.bankrate.com/rates/interest-rates/prime-rate.aspx> xi Graph: Effective Federal Fund Rates. (n. d.). Retrieved November 18, 2014, from <http://research.stlouisfed.org/fred2/> xii Industry Surveys Financial Services: Diversified. (July 2014). p. 5-6 S&P Capital IQ. McGraw Hill Financial. xiii Industry Surveys Financial Services: Diversified. (July 2014). p. 1 S&P Capital IQ. McGraw Hill Financial. xiv Industry Surveys Financial Services: Diversified. (July 2014). p. 3 S&P Capital IQ. McGraw Hill Financial. xv (n. d.). American Express Company, 15. World Market Intelligence. xvi Stress Test Results: Big Banks Look Healthier As 29 of 20 Pass, Zions Fails. (2014, March 20). Retrieved November 18, 2014, from <http://www.forbes.com/sites/halahtouryalai/2014/03/20/str
ess-test-results-big-banks-look-healthier-as-29-of-30-pass-zion-fails/> xvii (2014, March). Dodd-Frank Act Stress Test 2014: Supervisory Stress Test Methodology and Results. Board of Governors of The Federal Reserve System. Retrieved from <http://www.federalreserve.gov/newsevents/press/bcreg/bcreg20140320a1.pdf> xviii American Express Company (AXP). (n.d.). Retrieved November 18, 2014, from <http://finance.yahoo.com/q/co?s=AXP+Competitors> xix American Express Company (AXP). (n.d.). Retrieved November 18, 2014, from <http://finance.yahoo.com/q/co?s=AXP+Competitors> xx Net Charge-Off Rate Definition | Investopedia. (n.d.). Retrieved November 18, 2014, from http://www.investopedia.com/terms/n/net-charge-off-rate.asp xxi Bloomberg terminal xxii FactSet Research Systems. (n.d.). American Express: Business Description. Retrieved November 18, 2014, from FactSet database. xxiii FactSet Research Systems. (n.d.). American Express: Company Analysis. Retrieved November 18, 2014, from FactSet database. xxiv FactSet Research Systems. (n.d.). American Express: Entity Structure. Retrieved November 18, 2014,from FactSet database. xxv American Express Company. (2014). Annual report 2013. Retrieved from <http://www.sec.gov/Archives/edgar/data/4962/000119312514066777/d656045d10k.htm#tx656045_29> xxvi Closed Loop. (n.d.). Retrieved November 18, 2014, from <https://secure.cmax.americanexpress.com/Internet/International/japa/AU_en/Merchant/Prospect/Why American Express/Insights and Trends/Files/Closed-Loop-Network.pdf> xxvii How American Express Gains A Competitive Advantage From Its Closed-Loop Network. (2014, March 31). Retrieved November 18, 2014, from <http://www.forbes.com/sites/greatspeculations/2014/03/13/how-american-express-gains-a-competitive-advantage-from-its-closed-loop-network/> xxviii Is Interactive Sidoti Research right for you. (n.d.). Retrieved November 18, 2014, from <http://www.trefis.com/stock/axp/model/trefis> xxix Erik Oja, Industry Survey Financial Services: Diversified. Page1. July 2014. Retrieved November 18, 2014 xxx Charts & Graphs Archive. (n.d.). Retrieved November 18, 2014, from
Page 12

<http://www.nilsonreport.com/publication_chart_and_graphs_archive.php#> xxxi American Express Company (AXP). (n.d.). Retrieved November 18, 2014, from <http://finance.yahoo.com/q/ks?s=AXP Key Statistics> xxxii American Express Co. (2014). Form 10-K 2013. Retrieved from SEC EDGAR website <http://www.sec.gov/edgar.shtml> xxxiii American Express Company. (2014). Annual report 2013. Retrieved from <http://www.sec.gov/Archives/edgar/data/4962/000119312514066777/d656045d10k.htm#tx656045_29> xxxiv American Express Stock Price Drivers. (2014, March 15). Retrieved November 18, 2014, from <http://www.bidnessetc.com/business/american-express/stock-price-drivers/> xxxv American Express Company. (2014). Annual report 2013. Retrieved from <http://www.sec.gov/Archives/edgar/data/4962/000119312514066777/d656045d10k.htm#tx656045_29> xxxvi American Express Company. (2014). Annual report 2013. Page 20. Retrieved from <http://www.sec.gov/Archives/edgar/data/4962/000119312514066777/d656045d10k.htm#tx656045_29> xxxvii American Express Company. (2014). Annual report 2013. Page 16. Retrieved from <http://www.sec.gov/Archives/edgar/data/4962/000119312514066777/d656045d10k.htm#tx656045_29> xxxviii Caggeso, M. (2008, November 11). American Express Now a Commercial Bank. Retrieved November 18, 2014, from <http://moneymorning.com/2008/11/11/american-express/> xxxix Closed Loop. (n.d.). Retrieved November 18, 2014, from <https://secure.cmax.americanexpress.com/Internet/International/japa/AU_en/Merchant/Prospect/Why American Express/Insights and Trends/Files/Closed-Loop-Network.pdf> xl Closed Loop. (n.d.). Retrieved November 18, 2014, from <https://secure.cmax.americanexpress.com/Internet/International/japa/AU_en/Merchant/Prospect/Why American Express/Insights and Trends/Files/Closed-Loop-Network.pdf> xli Papadimitriou, O. (n.d.). Market Share by Credit Card Network. Retrieved November 18, 2014, from <http://www.cardhub.com/edu/market-share-by-credit-card-network/> xlii Do Financial Services Companies Have Moats? Part II, American Express. (2014, January 2). Retrieved November 18, 2014, from <http://punchcardblog.wordpress.com/2014/01/02/do-financial-services-companies-have-moats-part-ii-american-express/> xliii Do Financial Services Companies Have Moats? Part II, American Express. (2014, January 2). Retrieved November 18,
2014, from <http://punchcardblog.wordpress.com/2014/01/02/do-financial-services-companies-have-moats-part-ii-american-express/> xliv Do Financial Services Companies Have Moats? Part II, American Express. (2014, January 2). Retrieved November 18, 2014, from <http://punchcardblog.wordpress.com/2014/01/02/do-financial-services-companies-have-moats-part-ii-american-express/> xlv AmEx (AXP) to Increase Dividend by 13%; Plans Buyback Up to $4.4B. (2014, March 26). Retrieved November 18, 2014, from <http://www.streetinsider.com/Corporate News/AmEx (AXP) to Increase Dividend by 13%; Plans Buyback Up to $4.4B/9319947.html> xlvi American Express Dividends. (2014, March 15). Retrieved November 18, 2014, from <http://www.bidnessetc.com/business/american-express/dividends/> xlvii Spots, K. (2014, September 10). Why Apple Pay Could Be a Game-Changer for Small Business. Retrieved November 18, 2014, from https://www.americanexpress.com/us/small-business/openforum/articles/why-apple-pay-could-be-a-game-changer-for-small-business/ xlviii American Express Co. (2014). Form 10-K 2013. Retrieved from SEC EDGAR website <http://www.sec.gov/edgar.shtml> xlix Home. (n.d.). Retrieved November 18, 2014, from <http://www.jdpower.com/> l American Express Company. (2014). Annual report 2013. Page 72. Retrieved from <http://www.sec.gov/Archives/edgar/data/4962/000119312514066777/d656045d10k.htm#tx656045_29>
Page 13

AMERICAN EXPRESS COMPANY Revenue Decomposition
Fiscal Years Ending Dec. 31 2011 2012 2013 2014E 2015E 2016E 2017E 2018E 2019E 2020 CVNon-interest income Discount revenue 16,734 17,739 18,695 19660 20709 21720 22915 23037 23405 23759
Cards-in-force 97 102 107 111 116 121 124 128 132 136Discount revenue per card (in dollars) 172 173 174 176 179 180 184 180 178 175Net card fees 2,183 2,506 2,631 2644 2749 2867 2940 3039 3156 3240Fee per card (in dollars) 22.41 24.47 24.54 23.71 23.71 23.77 23.67 23.76 23.95 23.87 Travel commissions & fees 1,971 1,940 1,913 1901 1873 1853 1890 1906 1896 1890Other commissions & fees 2,269 2,317 2,414 2547 2681 2796 2901 3008 3076 3214Other non-interest revenues 2,164 2,452 2,274 2,177 2,177 2,180 2,193 2,231 2,240 2,210
Total non-interest income 25,321 26,954 27,927 28928 30189 31416 32839 33220 33773 34314
Interest Income Interest income on loans 6,537 6,511 6,718 6966 7125 7150 6878 7279 7705 8156Interest income and dividends on investment securities 327 246 201 186 167 162 158 153 149 147Interest income on deposits with banks and other 97 97 86 105 106 124 141 157 177 271
Total interest income 6,961 6,854 7,005 7257 7398 7436 7177 7589 8031 8574Total revenue 32,282 33,808 34,932 36185 37587 38851 40016 40810 41804 42888
Interest Expense Interest expense from deposits 528 480 442 459 482 506 532 558 586 616Interest expense from short-term borrowings 11 - - - - - - - - -Interest expense from long-term debt & other 1,781 1,746 1,516 1643 1789 1878 1968 2062 2162 2269
Total interest expense 2,320 2,226 1,958 2103 2272 2385 2500 2621 2748 2885Net interest income 4,641 4,628 5,047 5155 5126 5051 4677 4969 5283 5689
U.S. Card ServicesNon-interest income 10,648 11,469 12,123 12526 12981 13352 13792 13786 13847 13897
42.05% 42.55% 43.41% 43.3% 43.0% 42.5% 42.0% 41.5% 41.0% 40.5%Interest Income 5,230 5,342 5,565 5,806 5,992 6,023 5,814 6,223 6,585 7,030
75.13% 77.94% 79.44% 80% 81% 81% 81% 82% 82% 82%Interest Expense 807 765 693 744 804 835 875 917 962 1010
34.78% 34.37% 35.39% 35.40% 35.40% 35.00% 35.00% 35.00% 35.00% 35.00%USCS Net Interest Income 4,423 4,577 4,872 5,061 5,188 5,188 4,939 5,306 5,623 6,021
Total Revenue USCS 15,878 16,811 17,688 18,331 18,974 19,375 19,606 20,010 20,432 20,928
International Card ServicesNon-interest income 4,361 4,561 4,644 4,744 4,981 5,184 5,418 5,481 5,573 5,662
17.22% 16.92% 16.63% 16.4% 16.5% 16.5% 16.5% 16.5% 16.5% 16.5%Interest Income 1,304 1,147 1,118 1,118 1,065 1,071 1,034 1,017 1,076 1,149
18.73% 16.73% 15.96% 15% 14% 14% 14% 13% 13% 13%Interest Expense 426 402 361 399 430 442 461 486 510 538
18.36% 18.06% 18.44% 19.00% 18.93% 18.54% 18.43% 18.54% 18.56% 18.63%ICS Net Interest Income 878 745 757 718 635 629 573 531 566 611
Total Revenue ICS 5,665 5,708 5,762 5,862 6,046 6,254 6,452 6,498 6,649 6,811
Global Commercial ServicesNon-interest income 4,880 4,995 5,085 5,352 5,585 5,875 6,272 6,478 6,721 6,966
19.27% 18.53% 18.21% 18.500% 18.500% 18.700% 19.100% 19.500% 19.900% 20.300%Interest Income 9 11 13 14.5 14.8 14.9 14.4 15.2 16.1 17.1
0.13% 0.16% 0.19% 0.20% 0.20% 0.20% 0.20% 0.20% 0.20% 0.20%Interest Expense 264 257 245 263 295 310 325 341 344 361
11.38% 11.55% 12.51% 12.5% 13.0% 13.0% 13.0% 13.0% 12.5% 12.5%GCS Net Interest Income (255) (246) (232) (248) (281) (295) (311) (326) (327) (343)
Total Revenue GCS 4,889 5,006 5,098 5,366 5,600 5,890 6,287 6,493 6,737 6,983
Global Network & Merchant ServicesNon-interest income 4,713 5,005 5,229 5,438 5,736 6,000 6,305 6,411 6,552 6,691
18.6% 18.6% 18.7% 18.80% 19.00% 19.10% 19.20% 19.30% 19.40% 19.50%Interest Income 5 23 32 29.0 29.6 29.7 28.7 30.4 32.1 34.3
0.07% 0.34% 0.46% 0.40% 0.40% 0.40% 0.40% 0.40% 0.40% 0.40%Interest Expense (224) (243) (252) (284) (307) (329) (345) (362) (379) (398)
-9.66% -10.92% -12.87% -13.50% -13.50% -13.80% -13.80% -13.80% -13.80% -13.80%GNMS Net Interest Income 229 266 284 313 336 359 374 392 411 432
Total Revenue GNMS 4,718 5,028 5,261 5,467 5,765 6,030 6,334 6,442 6,584 6,726
Corporate & OthersNon-interest income 719 924 846 868 906 1,005 1,051 1,063 1,081 1,098
2.84% 3.43% 3.03% 3.00% 3.00% 3.20% 3.20% 3.20% 3.20% 3.20%Interest Income 413 331 277 290.29 295.92 297.43 287.09 303.58 321.23 342.95
5.93% 4.83% 3.95% 4% 4% 4% 4% 4% 4% 4%Interest Expense 1,047 1,045 911 980 1049 1127 1184 1239 1312 1375
45.13% 46.95% 46.53% 46.60% 46.17% 47.26% 47.37% 47.26% 47.74% 47.67%Corporate & Others Net Interest Income (634) (714) (634) (690) (753) (830) (897) (935) (991) (1,032)
Total Revenue Corporate & Others 1,132 1,255 1,123 1,158 1,202 1,303 1,338 1,367 1,402 1,441
Total Revenue 32,282 33,808 34,932 36,185 37,587 38,851 40,016 40,810 41,804 42,888
Net Interest Income 4,641 4,628 5,047 5,155 5,126 5,051 4,677 4,969 5,283 5,689
Page 14

AMERICAN EXPRESS COMPANY Income Statement(In millions)
Fiscal Years Ending Dec. 31 2,011 2,012 2,013 2014E 2015E 2016E 2017E 2018E 2019E 2020 CVRevenue non-interest revenue Discount revenue 16,734 17,739 18,695 19,660 20,709 21,720 22,915 23,037 23,405 23,759 Net card fees 2,183 2,506 2,631 2,644 2,749 2,867 2,940 3,039 3,156 3,240 Travel commissions & fees 1,971 1,940 1,913 1,901 1,873 1,853 1,890 1,906 1,896 1,890 Other commissions & fees 2,269 2,317 2,414 2,547 2,681 2,796 2,901 3,008 3,076 3,214 Securitization income, net - - - - - - - - - - Other non-interest revenues 2,164 2,452 2,274 2,177 2,177 2,180 2,193 2,231 2,240 2,210 Total non-interest revenues 25,321 26,954 27,927 28,928 30,189 31,416 32,839 33,220 33,773 34,314 Interest Income Interest income & fees on loans 6,537 6,511 6,718 6,966 7,125 7,150 6,878 7,279 7,705 8,156 Interest income - other 424 343 287 291 273 286 299 310 326 418 Total interest income 6,961 6,854 7,005 7,257 7,398 7,436 7,177 7,589 8,031 8,574 Total revenues before interest expenses 32,282 33,808 34,932 36,185 37,587 38,851 40,016 40,810 41,804 42,888
Interest Expense Interest expense - deposits 528 480 442 459 482 506 532 558 586 616 Interest expense - short-term borrowings 11 - - - - - - - - - Interest expense - long-term debt & other 1,781 1,746 1,516 1,643 1,789 1,878 1,968 2,062 2,162 2,269 Total interest expense 2,320 2,226 1,958 2,103 2,272 2,385 2,500 2,621 2,748 2,885 Net interest income 4,641 4,628 5,047 5,155 5,126 5,051 4,677 4,969 5,283 5,689 Total revenues, net of interest income 29,962 31,582 32,974 34,082 35,315 36,467 37,517 38,189 39,056 40,003 Total provisions for losses 1,112 1,990 2,110 2,203 2,331 2,466 2,610 2,762 2,923 3,094 Total revenues net of interest expense after provisions for losses 28,850 29,592 30,864 31,879 32,984 34,001 34,907 35,427 36,133 36,910 ExpensesMarketing, promotion, rewards & card member services 9,930 9,971 10,267 10,441 10,684 10,899 11,135 11,368 11,610 11,855 Salaries & employee benefits 6,252 6,597 6,191 6,347 6,378 6,305 6,343 6,342 6,330 6,339 Professional services expense 2,951 2,963 3,102 3,164 3,227 3,292 3,358 3,425 3,493 3,563 Other expenses, net 2,761 3,610 3,416 3,484 3,554 3,625 3,698 3,772 3,847 3,924 Total expenses 21,894 23,141 22,976 23,436 23,843 24,121 24,534 24,907 25,281 25,681 Pretax income from continuing operations 6,956 6,451 7,888 8,444 9,141 9,880 10,373 10,521 10,852 11,229 Income tax provision (benefit) 2,057 1,969 2,529 2,955 3,199 3,458 3,631 3,682 3,798 3,930 Income from continuing operations 4,899 4,482 5,359 5,488 5,942 6,422 6,743 6,838 7,054 7,299 Income (loss) from discontinued operations, net of tax 36 - - - - - - - - - Net income (loss) 4,935 4,482 5,359 5,488 5,942 6,422 6,743 6,838 7,054 7,299 Per Share InformationNet earnings (loss) per share - basic 4.11 3.91 4.91 5.31 5.93 6.62 7.18 7.55 8.08 8.67Dividends declared per common share 0.72 0.8 0.89 1.01 1.10 1.17 1.29 1.36 1.45 1.56Year end shares outstanding (in Millions) 1164 1105 1064 1033 1002 970 939 906 873 842
2.42% 8.26% 8.08% 5.00% 1.42% 3.15% 3.47%
Page 15

AMERICAN EXPRESS COMPANY Common Size Income Statement(In millions)
Fiscal Years Ending Dec. 31 2,011 2,012 2,013 2014E 2015E 2016E 2017E 2018E 2019E 2020 CVRevenue Common Size A1:U39Income Statement(In millions)Discount revenue 10.91% 11.58% 12.19% 12.22% 12.32% 12.38% 12.49% 12.02% 11.69% 11.36%Net card fees 1.42% 1.64% 1.72% 1.64% 1.64% 1.63% 1.60% 1.59% 1.58% 1.55%Travel commissions & fees 1.29% 1.27% 1.25% 1.18% 1.11% 1.06% 1.03% 0.99% 0.95% 0.90%Other commissions & fees 1.48% 1.51% 1.57% 1.58% 1.60% 1.59% 1.58% 1.57% 1.54% 1.54%Securitization income, net 0.00% 0.00% 0.00% 0.00% 0.00% 0.00% 0.00% 0.00% 0.00% 0.00%Other non-interest revenues 1.41% 1.60% 1.48% 1.35% 1.30% 1.24% 1.19% 1.16% 1.12% 1.06% Total non-interest revenues 16.51% 17.60% 18.21% 17.98% 17.96% 17.90% 17.89% 17.33% 16.87% 16.41%Interest Income Interest income & fees on loans 4.26% 4.25% 4.38% 4.33% 4.24% 4.07% 3.75% 3.80% 3.85% 3.90%Interest income - other 0.28% 0.22% 0.19% 0.18% 0.16% 0.16% 0.16% 0.16% 0.16% 0.20% Total interest income 4.54% 4.48% 4.57% 4.51% 4.40% 4.24% 3.91% 3.96% 4.01% 4.10% Total revenues before interest expenses 21.05% 22.08% 22.78% 22.49% 22.37% 22.14% 21.80% 21.29% 20.88% 20.50%
Interest Expense Interest expense - deposits 0.34% 0.31% 0.29% 0.29% 0.29% 0.29% 0.29% 0.29% 0.29% 0.29%Interest expense - short-term borrowings 0.01% 0.00% 0.00% 0.00% 0.00% 0.00% 0.00% 0.00% 0.00% 0.00%Interest expense - long-term debt & other 1.16% 1.14% 0.99% 1.02% 1.06% 1.07% 1.07% 1.08% 1.08% 1.08% Total interest expense 1.51% 1.45% 1.28% 1.31% 1.35% 1.36% 1.36% 1.37% 1.37% 1.38%Net interest income 3.03% 3.02% 3.29% 3.20% 3.05% 2.88% 2.55% 2.59% 2.64% 2.72% Total revenues, net of interest income 19.54% 20.62% 21.50% 21.19% 21.01% 20.78% 20.44% 19.92% 19.51% 19.13%Total provisions for losses 0.73% 1.30% 1.38% 1.37% 1.39% 1.41% 1.42% 1.44% 1.46% 1.48% Total revenues net of interest expense after provisions for losses 18.81% 19.32% 20.12% 19.82% 19.63% 19.38% 19.02% 18.48% 18.05% 17.65% ExpensesMarketing, promotion, rewards & card member services 6.48% 6.51% 6.69% 6.49% 6.36% 6.21% 6.07% 5.93% 5.80% 5.67%Salaries & employee benefits 4.08% 4.31% 4.04% 3.95% 3.80% 3.59% 3.46% 3.31% 3.16% 3.03%Professional services expense 1.92% 1.93% 2.02% 1.97% 1.92% 1.88% 1.83% 1.79% 1.75% 1.70%Other expenses, net 1.80% 2.36% 2.23% 2.17% 2.11% 2.07% 2.01% 1.97% 1.92% 1.88% Total expenses 14.28% 15.11% 14.98% 14.57% 14.19% 13.75% 13.37% 12.99% 12.63% 12.28%Pretax income from continuing operations 4.54% 4.21% 5.14% 5.25% 5.44% 5.63% 5.65% 5.49% 5.42% 5.37% Total current income tax provision 1.01% 1.06% 1.65% 1.84% 1.90% 1.97% 1.98% 1.92% 1.90% 1.88% Total deferred income tax provision (benefit) 0.33% 0.23% 0.00% 0.00% 0.00% 0.00% 0.00% 0.00% 0.00% 0.00%Income tax provision (benefit) 1.34% 1.29% 1.65% 1.84% 1.90% 1.97% 1.98% 1.92% 1.90% 1.88%Income from continuing operations 3.19% 2.93% 3.49% 3.41% 3.54% 3.66% 3.67% 3.57% 3.52% 3.49%Income (loss) from discontinued operations, net of tax 0.02% 0.00% 0.00% 0.00% 0.00% 0.00% 0.00% 0.00% 0.00% 0.00% Net income (loss) 3.22% 2.93% 3.49% 3.41% 3.54% 3.66% 3.67% 3.57% 3.52% 3.49%
Page 16

AMERICAN EXPRESS COMPANY Balance Sheet (In millions)Balance Sheet (In millions)
Fiscal Years Ending Dec. 31 2011 2012 2013 2014E 2015E 2016E 2017E 2018E 2019E 2020CV AssetsCash & cash due from banks 3,514 2,020 2,212 2,983 3,329 3,551 3,948 3,831 3,356 2,796 Interest-bearing deposits in other banks 20,572 19,892 16,776 16,881 17,016 17,187 17,427 17,741 18,096 18,548 Short-term investment securities 807 338 498 473 449 427 406 385 366 348 Cash & cash equivalents 24,893 22,250 19,486 20,337 20,795 21,165 21,780 21,957 21,818 21,691
Accounts receivable - card member receivables 40,890 42766 44163 47,254 50,562 54,102 57,889 61,941 66,277 70,916 Reserve for losses 438 428 386 425 455 487 521 557 596 638 Accounts receivable - card member receivables, net 40452 42338 43777 46829 50107 53615 57368 61383 65680 70278Accounts receivable - other receivables, net 3657 3576 3408 3811 3915 3847 3681 3699 3705 3724 Total Current assets 69002 68164 66671 70977 74817 78626 82829 87040 91203 95693
Loans - card member loans, net 60,747 63,758 65,977 69,276 72,740 76,377 80,195 84,205 88,415 92,836 Loans - other loans, net 419 551 608 620 633 645 658 671 685 698 Investment securities 7,147 5,614 5,016 4,511 4,387 4,263 4,139 4,015 3,961 3,907 Premises & equipment 8,114 9,064 9,853 11,053 12,253 13,503 14,753 16,003 17,303 18,603 Depreciation of premises and equipment 4,747 5,429 5,978 7,118 8,258 9,446 10,633 11,821 13,056 14,291 Premises & equipment, net 3,367 3,635 3,875 3,935 3,995 4,058 4,120 4,183 4,248 4,313 Goodwill 3,172 3,181 3,198 3,198 3,198 3,198 3,198 3,198 3,198 3,198 Deferred tax assets, net 2,875 2,458 2,443 2,443 2,443 2,443 2,443 2,443 2,443 2,443 Prepaid expenses 2,378 1,960 1,998 2,038 2,079 2,120 2,163 2,206 2,250 2,295 Other assets 4,230 3,819 3,589 3,879 3,762 3,744 3,795 3,767 3,769 3,777 Assets of discontinued operations - - - - - - - - - - Total assets 153,337 153,140 153,375 160,878 168,053 175,473 183,541 191,728 200,172 209,160
Liability and Stockholders' Equity Liability Customer deposits 37,898 39,803 41,763 43,851 46,044 48,346 50,763 53,301 55,966 58,765 Travelers Cheques & other prepaid products 5,123 4,601 4,240 3,883 3,555 3,256 3,093 2,938 2,791 2,652 Accounts payable 10,458 10,006 10,615 11,216 11,851 12,521 13,230 13,979 14,770 15,606 Investment certificate reserves - - - - - - - - -Short-term borrowings 3,424 3,314 5,021 5,121 5,224 5,328 5,435 5,544 5,654 5,768 Long-term debt 59,570 58,973 55,330 60,250 63,243 66,266 69,439 72,792 76,397 80,259 Other liabilities 18,070 17,557 16,910 15,835 16,103 16,319 16,677 16,781 16,597 16,460 Liabilities of discontinued operations - - - - - - - - - - Total liabilities 134,543 134,254 133,879 140,156 146,019 152,036 158,637 165,336 172,176 179,510 Stockholders' Equity Common shares 12,449 12,288 12,415 12,653 12,895 13,143 13,396 13,653 13,916 14,185 Retained earnings 7,221 7,525 8,507 9,495 10,564 11,720 12,934 14,165 15,505 16,892 Total accumulated other comprehensive income (loss) (876) (927) (1,426) (1,426) (1,426) (1,426) (1,426) (1,426) (1,426) (1,426) Total shareholders' equity 18,794 18,886 19,496 20,722 22,034 23,437 24,904 26,392 27,995 29,651 Total Liability and Stockholders' Equity 153,337 153,140 153,375 160,878 168,053 175,473 183,541 191,728 200,172 209,160
Page 17

AMERICAN EXPRESS COMPANY Common Size Balance Sheet (In millions)
Fiscal Years Ending Dec. 31 2,011 2,012 2,013 2014E 2015E 2016E 2017E 2018E 2019E 2020CVAssetsCash & cash due from banks 2.29% 1.32% 1.44% 1.85% 1.98% 2.02% 2.15% 2.00% 1.68% 1.34%Interest-bearing deposits in other banks 13.42% 12.99% 10.94% 10.49% 10.13% 9.79% 9.50% 9.25% 9.04% 8.87%Short-term investment securities 0.53% 0.22% 0.32% 0.29% 0.27% 0.24% 0.22% 0.20% 0.18% 0.17% Cash & cash equivalents 16.23% 14.53% 12.70% 12.64% 12.37% 12.06% 11.87% 11.45% 10.90% 10.37%
Accounts receivable - card member receivables, net 26.38% 27.65% 28.54% 29.11% 29.82% 30.55% 31.26% 32.02% 32.81% 33.60%Accounts receivable - other receivables, net 2.38% 2.34% 2.22% 2.37% 2.33% 2.19% 2.01% 1.93% 1.85% 1.78% Total Current assets 45.00% 44.51% 43.47% 44.12% 44.52% 44.81% 45.13% 45.40% 45.56% 45.75%
Loans - card member loans, net 39.62% 41.63% 43.02% 43.06% 43.28% 43.53% 43.69% 43.92% 44.17% 44.39%Loans - other loans, net 0.27% 0.36% 0.40% 0.39% 0.38% 0.37% 0.36% 0.35% 0.34% 0.33%Investment securities 4.66% 3.67% 3.27% 2.80% 2.61% 2.43% 2.26% 2.09% 1.98% 1.87%Premises & equipment, net 2.20% 2.37% 2.53% 2.45% 2.38% 2.31% 2.24% 2.18% 2.12% 2.06%Goodwill 2.07% 2.08% 2.09% 1.99% 1.90% 1.82% 1.74% 1.67% 1.60% 1.53%Deferred tax assets, net 1.87% 1.61% 1.59% 1.52% 1.45% 1.39% 1.33% 1.27% 1.22% 1.17%Prepaid expenses 1.55% 1.28% 1.30% 1.27% 1.24% 1.21% 1.18% 1.15% 1.12% 1.10%Other assets 2.76% 2.49% 2.34% 2.41% 2.24% 2.13% 2.07% 1.96% 1.88% 1.81% Total assets 100.00% 100.00% 100.00% 100.00% 100.00% 100.00% 100.00% 100.00% 100.00% 100.00%Liability and Stockholders' Equity Liability Customer deposits 24.72% 25.99% 27.23% 27.26% 27.40% 27.55% 27.66% 27.80% 27.96% 28.10%Travelers Cheques & other prepaid products 3.34% 3.00% 2.76% 2.41% 2.12% 1.86% 1.69% 1.53% 1.39% 1.27%Accounts payable 6.82% 6.53% 6.92% 6.97% 7.05% 7.14% 7.21% 7.29% 7.38% 7.46%Short-term borrowings 2.23% 2.16% 3.27% 3.18% 3.11% 3.04% 2.96% 2.89% 2.82% 2.76%Long-term debt 38.85% 38.51% 36.07% 37.45% 37.63% 37.76% 37.83% 37.97% 38.17% 38.37%Other liabilities 11.78% 11.46% 11.03% 9.84% 9.58% 9.30% 9.09% 8.75% 8.29% 7.87% Total liabilities 87.74% 87.67% 87.29% 87.12% 86.89% 86.64% 86.43% 86.23% 86.01% 85.82%Stockholders' Equity Common shares 8.12% 8.02% 8.09% 7.86% 7.67% 7.49% 7.30% 7.12% 6.95% 6.78%Retained earnings 4.71% 4.91% 5.55% 5.90% 6.29% 6.68% 7.05% 7.39% 7.75% 8.08%Total accumulated other comprehensive income (loss) -0.57% -0.61% -0.93% -0.89% -0.85% -0.81% -0.78% -0.74% -0.71% -0.68% Total shareholders' equity 12.26% 12.33% 12.71% 12.88% 13.11% 13.36% 13.57% 13.77% 13.99% 14.18% Total Liability and Stockholders' Equity 100.00% 100.00% 100.00% 100.00% 100.00% 100.00% 100.00% 100.00% 100.00% 100.00%
Page 18

AMERICAN EXPRESS COMPANY Cash Flow Statement
Fiscal Years Ending Dec. 31 2007 2008 2009 2010 2011 2012 2013Cash Flows from Operating ActivitiesNet income 4012 2699 2130 4057 4935 4482 5359Loss (income) from discontinued operations, net of tax 36 172 7 - -36 - -Income from continuing operations 4048 2871 2137 4057 4899 4482 5359Provisions for losses 4527 6290 5313 2207 1112 1990 2110Depreciation & amortization 648 712 1070 917 918 991 1020Deferred taxes & other -738 442 -1429 1135 818 218 -283Stock-based compensation 276 229 202 287 301 297 350Accounts receivable -912 - - - - - -Other receivables - 101 -730 -498 663 153 -73Other assets -139 -2223 526 -590 -635 390 335Accounts payable & other liabilities 1005 885 -23 2090 2893 -358 88Travelers Cheques & other prepaid products -22 -770 -449 -317 -494 -540 -359Premium paid on debt exchange - - - - - -541 -Net cash provided by (used in) operating activities attributable to discontinued operations -209 129 -233 - - - -Net cash flows from operating activities 8484 8666 6384 9288 10475 7082 8547
Cash Flows from Investing ActivitiesSale of investments 4901 4657 2930 2196 1176 525 217Maturity & redemption of investments 7100 9620 2900 12066 6074 1562 1292Purchase of investments -10332 -14724 -13719 -7804 -1158 -473 -1348Net decrease (increase) in cardmember loans or receivables -18903 5448 6154 -6389 -8358 -6671 -6301Proceeds from cardmember loan securitizations 5909 9619 2244 - - - -Maturities of cardmember loan securitizations -3500 -4670 -4800 - - - -Loan operations & principal collections, net 25 - - - - - -Purchase of land, buildings & equipment -938 -977 -772 -887 -1189 -1053 -1006Sale of land, buildings & equipment 55 27 50 9 - - -Dispositions (acquisitions), net of cash acquired or sold -124 -4589 - -400 -610 -466 -195Net decrease (increase) in restricted cash - - -1935 -20 3574 31 72Net cash provided by investing activities attributable to discontinued operations -1287 2625 196 - - - -Net cash flows from investing activities -17094 7036 -6752 -1229 -491 -6545 -7269
Cash Flows from Financing ActivitiesNet change in interest-bearing deposits - - 11037 3406 - - -Net increase in customer deposits 3361 358 - - 8232 2300 1195Sale of investment certificates 3427 - - - - - -Redemption of investment certificates -4219 - - - - - -Net increase (decrease) in short-term borrowings 5338 -8693 -6574 1056 -2 -1015 1843Issuance of long-term debt - 19213 6697 5918 13982 13934 11995Principal payments on long-term debt - -13787 -15197 -17670 -21029 -14076 -14763Issuance of American Express Series A preferred shares & warrants - - 3389 - - - -Issuance of American Express common shares - 176 614 663 594 443 721Repurchase of American Express Series A preferred shares - - -3389 - - - -Repurchase of American Express stock warrants - - -340 - - - -Repurchase of American Express common shares -3572 -218 - -590 -2300 -3952 -3943Dividends paid -712 -836 -924 -867 -861 -902 -939Issuance of debt 27353 - - - - - -Principal payments on debt -18390 - - - - - -Issuance of American Express common shares & other financing activities 852 - - - - - -Net cash provided by (used in) financing activities attributable to discontinued operations 2028 -6653 40 - - - -Net cash flows from financing activities 15466 -10440 -4647 -8084 -1384 -3268 -3891
Page 19

AMERICAN EXPRESS COMPANY Cash Flow Statement
Fiscal Years Ending Dec. 31 2011 2012 2013 2014E 2015E 2016E 2017E 2018E 2019E 2020 CV Cash Flows from Operating ActivitiesNet income 4935 4482 5359 5,488 5,942 6,422 6,743 6,838 7,054 7,299 Non-cash itemsDepreciation & amortization 918 991 1020 1,140 1,140 1,188 1,188 1,188 1,235 1,235 Adjustment of assets and liabilitiesChange in account receivable 301 297 350 (3,052) (3,278) (3,508) (3,753) (4,016) (4,297) (4,598) Change in accounts receivable - other receivables, net (403) (104) 68 166 (18) (6) (18) Change in customer deposit 2,088 2,193 2,302 2,417 2,538 2,665 2,798 Change in travelers Cheques & other prepaid products -494 -540 -359 (357) (327) (300) (163) (155) (147) (140) Change in account payable 663 153 -73 601 635 671 709 749 791 836 Other assets -635 390 335 (290) 117 19 (52) 28 (2) (8) other liabilities 2893 -358 88 (1,075) 268 216 358 104 (184) (137) Change in prepaid expense (40) (41) (42) (42) (43) (44) (45) Net cash flows from operating activities 10475 7082 8547 4,099 6,544 7,036 7,570 7,214 7,066 7,222
Cash Flows from Investing ActivitiesSale of investments 1176 525 217 505 124 124 124 124 54 54 Maturity & redemption of investments 6074 1562 1292 25 24 22 21 20 19 18 Proceeds from card member loan securitizations - - - (3,311) (3,476) (3,650) (3,832) (4,023) (4,224) (4,434) Purchase of land, buildings & equipment -1189 -1053 -1006 (1,200) (1,200) (1,250) (1,250) (1,250) (1,300) (1,300) Net cash flows from investing activities -491 -6545 -7269 (3,981) (4,529) (4,753) (4,936) (5,129) (5,450) (5,662)
Cash Flows from Financing ActivitiesNet change in interest-bearing deposits - - - (105) (135) (170) (241) (314) (355) (452) Net increase (decrease) in short-term borrowings -2 -1015 1843 100 102 104 107 109 111 113 Issuance of long-term debt 13982 13934 11995 4,920 2,993 3,023 3,173 3,353 3,605 3,862 Change in accumulated other comprehensive income (loss) - - - - - - - - - - Change in common shares 594 443 721 238 243 247 253 258 263 269 Repurchase of American Express common shares -2300 -3952 -3943 (3,458) (3,773) (4,129) (4,315) (4,377) (4,444) (4,598) Dividends paid -861 -902 -939 (1,043) (1,099) (1,137) (1,214) (1,231) (1,270) (1,314) Net cash flows from financing activities -1384 -3268 -3891 652 (1,669) (2,061) (2,238) (2,202) (2,090) (2,120)
Net increase (decrease) in cash & cash equivalents 8537 -2643 -2764 771 346 222 396 (117) (475) (560) Cash & cash equivalents at beginning of year 16356 24893 22250 2,212 2,983 3,329 3,551 3,948 3,831 3,356 Cash & cash equivalents at end of year 24893 22250 19486 2,983 3,329 3,551 3,948 3,831 3,356 2,796
Page 20
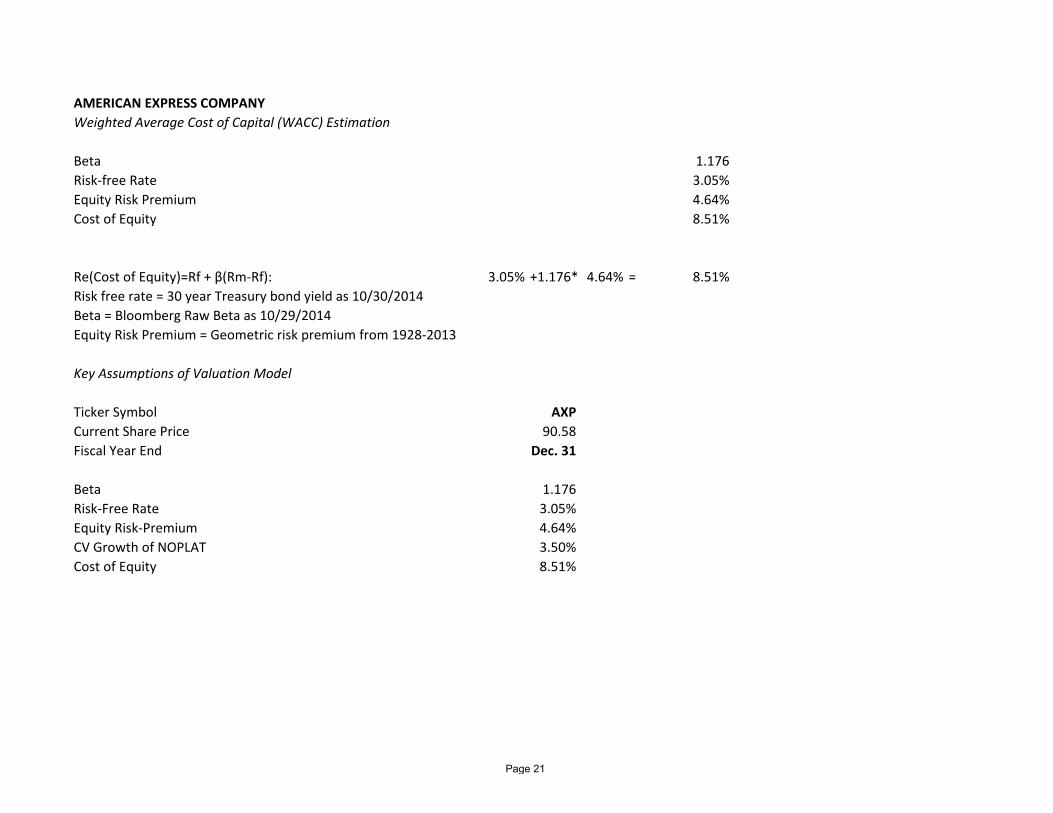
AMERICAN EXPRESS COMPANY Weighted Average Cost of Capital (WACC) Estimation
Beta 1.176Risk-free Rate 3.05%Equity Risk Premium 4.64%Cost of Equity 8.51%
Re(Cost of Equity)=Rf + β(Rm-Rf): 3.05% +1.176* 4.64% = 8.51%Risk free rate = 30 year Treasury bond yield as 10/30/2014Beta = Bloomberg Raw Beta as 10/29/2014Equity Risk Premium = Geometric risk premium from 1928-2013
Key Assumptions of Valuation Model
Ticker Symbol AXPCurrent Share Price 90.58Fiscal Year End Dec. 31
Beta 1.176Risk-Free Rate 3.05%Equity Risk-Premium 4.64%CV Growth of NOPLAT 3.50%Cost of Equity 8.51%
Page 21

AMERICAN EXPRESS COMPANY Value Driver Estimation
Fiscal Years Ending Dec. 31 2011 2012 2013 2014E 2015E 2016E 2017E 2018E 2019E 2020 CV
Net Income 4,935 4,482 5,359 5,488 5,942 6,422 6,743 6,838 7,054 7,299 Total Assets 153,337 153,140 153,375 160,878 168,053 175,473 183,541 191,728 200,172 209,160 Total Liabilities 134,543 134,254 133,879 140,156 146,019 152,036 158,637 165,336 172,176 179,510 Beg. Shareholders' equity 16,230 18,794 18,886 19,496 20,722 22,034 23,437 24,904 26,392 27,995
Return on Equity 30.41% 23.85% 28.38% 28.15% 28.67% 29.15% 28.77% 27.46% 26.73% 26.07%
Net Income 4,935 4,482 5,359 5,488 5,942 6,422 6,743 6,838 7,054 7,299 Less Change in Total Assets 6295 -197 235 7503 7176 7420 8067 8187 8444 8989Plus Change in Liabilities 3731 -289 -375 6277 5864 6017 6601 6699 6841 7333Free Cash Flow Equity - Simple 2371 4390 4749 4263 4630 5018 5276 5350 5451 5643
Free Cash Flow Equity - Formal Total Interest Income 6,961 6,854 7,005 7,257 7,398 7,436 7,177 7,589 8,031 8,574 Less Interest Expense 2,320 2,226 1,958 2,103 2,272 2,385 2,500 2,621 2,748 2,885 Less Provision for Credit Loss 1,112 1,990 2,110 2,203 2,331 2,466 2,610 2,762 2,923 3,094 Plus Non-Interest Revenue 25,321 26,954 27,927 28,928 30,189 31,416 32,839 33,220 33,773 34,314 Less Non-Interest Expense 21,894 23,141 22,976 23,436 23,843 24,121 24,534 24,907 25,281 25,681 Plus Income from Discontinued Operations 36 - - - - - - - - - Less Taxes 2,057 1,969 2,529 2,955 3,199 3,458 3,631 3,682 3,798 3,930
Cash From Operations 4,935 4,482 5,359 5,488 5,942 6,422 6,743 6,838 7,054 7,299
Change in customer deposits 8,171 1,905 1,960 2,088 2,193 2,302 2,417 2,538 2,665 2,798 Change in travelers cheques and other prepaid expenses (495) (522) (361) (357) (327) (300) (163) (155) (147) (140) Change in Investment certificate reserves - Change in accounts payable 767 (452) 609 601 635 671 709 749 791 836 Change in short-term borrowing 10 (110) 1,707 100 102 104 107 109 111 113 Change in long-term debt (6,846) (597) (3,643) 4,920 2,993 3,023 3,173 3,353 3,605 3,862 Change in other liabilities 2,124 (513) (647) (1,075) 268 216 358 104 (184) (137)Change in Discontinued items assets - - - - - - - - - - Sources of Cash 3,731 (289) (375) 6,277 5,864 6,017 6,601 6,699 6,841 7,333 Uses of CashChange in cash and cash due from banks 1,016 (1,494) 192 771 346 222 396 (117) (475) (560)
Change in interest bearing deposits 7,015 (680) (3,116) 105 135 170 241 314 355 452 Change in short-term investments 153 (469) 160 (25) (24) (22) (21) (20) (19) (18) Change in total cash and cash equivalent Change in card member receivables 3,572 1,886 1,439 3,052 3,278 3,508 3,753 4,016 4,297 4,598 Change in other receivables 103 (81) (168) 403 104 (68) (166) 18 6 18 Change in card member loans 3,543 3,011 2,219 3,299 3,464 3,637 3,819 4,010 4,210 4,421 Change in other loans 7 132 57 12 12 13 13 13 13 14 Change in investment securities (6,863) (1,533) (598) (505) (124) (124) (124) (124) (54) (54)Change in premises and equipment 462 268 240 60 60 63 63 63 65 65 Change in other assets (2,713) (1,237) (190) 330 (76) 23 94 15 46 53 Change in Discontinued items - - - - - - - - - - Uses of Cash 6,295 (197) 235 7,503 7,176 7,420 8,067 8,187 8,444 8,989
Free Cash Flow Equity - Formal 2,371 4,390 4,749 4,263 4,630 5,018 5,276 5,350 5,451 5,643
Equity Economic Profit (Equity EP)Net Income 4,935 4,482 5,359 5,488 5,942 6,422 6,743 6,838 7,054 7,299 Beg. Shareholder's Equity 16,230 18,794 18,886 19,496 20,722 22,034 23,437 24,904 26,392 27,995
Return on Equity 30.41% 23.85% 28.38% 28.15% 28.67% 29.15% 28.77% 27.46% 26.73% 26.07%Cost of Equity 8.51% 8.51% 8.51% 8.51% 8.51% 8.51% 8.51% 8.51% 8.51% 8.51%Equity Economic Profit 3554.4 2883.3 3752.4 3830.0 4178.9 4547.5 4748.9 4720.0 4808.9 4917.3
Page 22

AMERICAN EXPRESS COMPANY Discounted Cash Flow (DCF) and Economic Profit (EP) Valuation Models
Key Inputs: CV Growth 3.50% CV ROE 25.32% Cost of Equity 8.51%
Fiscal Years Ending Dec. 31 2014E 2015E 2016E 2017E 2018E 2019E 2020CV
DCF ModelFCFE 4263 4630 5018 5276 5350 5451 5643Net Income 5488 5942 6422 6743 6838 7054 7299Discount Period 1 2 3 4 5 6 6Discount Factor 0.92160 0.84935 0.78276 0.72140 0.66484 0.61272 0.61272CF_CV 125631DCF 3929 3932 3928 3806 3557 3340 76977
V (e) 99469-Employee stock option -1150value of equity 98319Share outstanding 1033Price/Share 95.14
EP ModelEP 3830 4179 4547 4749 4720 4809 4917Discount period 1 2 3 4 5 6 6Discount Factor 0.92160 0.84935 0.78276 0.72140 0.66484 0.61272 0.61272CV_PE 97636PV of EP 3530 3549 3560 3426 3138 2947 59824
PV of EP 79973Beg. TSE 19496V (e) 99469-Employee stock option -1150value of equity 98319Share outstanding 1033Price/Share 95.14
Price/Share Partial Year Adjustment as of 11/17/2014 101.34
Page 23

AMERICAN EXPRESS COMPANY Dividend Discount Model (DDM) or Fundamental P/E Valuation Model
Key Assumptions CV growth 3.50% CV ROE 25.32% Cost of Equity 8.51%
Fiscal Years Ending Dec. 31 2014E 2015E 2016E 2017E 2018E 2019E 2020 CV
EPS 5.31$ 5.93$ 6.62$ 7.18$ 7.55$ 8.08$ 8.67$ DIV 1.01 1.10 1.17 1.29 1.36 1.45 7.47Future Stock Price 149.2DIV Payout Ratio 19.00% 19.00% 19.00% 18.20% 18.20% 18.20% 86.18%Discount period 1 2 3 4 5 6 6Discount Factor 0.92 0.85 0.78 0.72 0.66 0.61 0.61Discount Cash Flow 0.93 0.93 0.92 0.93 0.90 0.89 91.42
Intrinsic Value 96.93Intrinsic Value Partial Year Adjustedas of 11/17/2014 103.26
Page 24

AMERICAN EXPRESS COMPANY Relative Valuation ModelsStock Prices as of : 11/18/2014 EPS EPS Est.Ticker Company Price 2014E 2015E P/E 14 P/E 15 5yr Gr. PEG 14 PEG 15 P/B 14COF CAPITAL ONE FINANCIAL 81.29$ $7.615 $7.734 10.7 10.51 6.77% 1.58 1.55 1.04MA MASTERCARD INCORPORATED 83.90$ $3.003 $3.561 27.9 23.56 16.48% 1.70 1.43 14.98DFS DISCOVER FINANCIAL SERVICES 64.98$ $5.231 $5.596 12.4 11.61 8.07% 1.54 1.44 2.8V VISA Inc 249.73$ $9.000 $10.378 27.7 24.06 20.81% 1.33 1.16 7JPM JPMORGAN CHASE & CO. 60.53$ $5.485 $5.955 11.0 10.16 7.13% 1.55 1.43 1.08BAC BANK OF AMERICA Corp 17.14$ $1.457 $1.500 11.8 11.43 8.00% 1.47 1.43 0.82C CITIGROUP Inc 53.81$ $3.508 $5.417 15.3 9.93 10.06% 1.52 0.99 0.8USB U.S. BANCORP 43.98$ $3.079 $3.317 14.3 13.26 7.21% 1.98 1.84 2.05
Average 16.4 14.32 10.57% 1.58 1.41 3.82
AXP AMERICAN EXPRESS COMPANY 90.58$ $5.31 $5.93 17.1 15.3 8.99% 1.9 1.7 4.71
Implied Value: Relative P/E (EPS14) $ 87.10 Relative P/E (EPS15) 84.92$ Avg: 86.01$ PEG Ratio (EPS14) 75.58$ PEG Ratio (EPS15) 75.02$ Avg: 75.30$ Book Value/Share 20.05$ P/B multiple 3.82 P/B 14 76.62$
Page 25

AMERICAN EXPRESS COMPANY Key Management Ratios
Fiscal Years Ending Dec. 31 2011 2012 2013 2014E 2015E 2016E 2017E 2018E 2019E 2020CV
Profitability RatiosReturn on Equity 28.18% 23.79% 27.92% 27.29% 27.79% 28.25% 27.90% 26.66% 25.94% 25.32%Net Profit Margin 15.29% 13.26% 15.34% 15.17% 15.81% 16.53% 16.85% 16.76% 16.87% 17.02%Net Interest Margin 3.48% 3.42% 3.73% 3.64% 3.45% 3.24% 2.87% 2.90% 2.93% 3.00%Return on Assets 3.29% 2.92% 3.50% 3.49% 3.61% 3.74% 3.76% 3.64% 3.60% 3.57%
Liquidity RatiosCurrent Ratio 1.14 1.12 1.00 1.11 1.12 1.13 1.14 1.15 1.15 1.16Cash ratio 41.26% 36.45% 29.23% 31.74% 31.19% 30.47% 30.03% 28.98% 27.55% 26.20%
Activity or Asset-Management RatiosReceivables Turnover 0.75 0.71 0.72 0.70 0.68 0.66 0.63 0.60 0.57 0.54Total Asset Turnover 0.21 0.22 0.23 0.23 0.23 0.23 0.22 0.22 0.21 0.21
Financial Leverage RatiosDebt-to-Equity Ratio 7.16 7.11 6.87 6.76 6.63 6.49 6.37 6.26 6.15 6.05Debt Ratio 0.877 0.877 0.873 0.871 0.869 0.866 0.864 0.862 0.860 0.858
Payout Policy RatiosDividend Payout Ratio 17.57% 19.21% 16.83% 19.00% 18.50% 17.70% 18.00% 18.00% 18.00% 18.00%Total Payout Ratio 64.05% 108.30% 91.10% 82.00% 82.00% 82.00% 82.00% 82.00% 81.00% 81.00%
Profitability RatiosReturn on Equity= Net Income/ Average Shareholder's EquityNet Profit Margin=Net Income/Total RevenueNet Interest Margin= (Investment Returns- Interest Expense)/Average Earning AssetsReturn on Assets=Net income/Average Total Assets
Liquidity RatiosCurrent Ratio= Current Assets/ Current LiabilitiesCash Ratio=(Cash+Cash Equivalents)/Current Liabilities
Activity or Asset-Management RatiosReceivables Turnover= Total Revenue/Average Account ReceivableTotal Asset Turnover= Total Revenue/Average Total Assets
Financial Leverage RatiosDebt-to-Equity Ratio=Total Debt/Total Shareholders' EquityDebt Ratio = Total Debt/Total Assets
Payout Policy RatiosDividend Payout Ratio= Dividend pay/Net IncomeTotal Payout Ratio = (Common Shares Repurchase + Dividend pay)/Net Income
Page 26

Effects of ESOP Exercise and Share Repurchases on Common Stock Balance Sheet Account and Number of Shares Outstanding
Number of Options Outstanding (shares): 28,193,000Average Time to Maturity (years): 4.26Expected Annual Number of Options Exercised: 6,611,699
Current Average Strike Price: 47.32$ Cost of Equity: 8.51%Current Stock Price: 90.58$
2014E 2015E 2016E 2017E 2018E 2019E 2020CVIncrease in Shares Outstanding: 6,611,699 6,611,699 6,611,699 6,611,699 1,719,042 0 0Average Strike Price: 47.32$ 47.32$ 47.32$ 47.32$ 47.32$ 47.32$ 47.32$ Increase in Common Stock Account: 312,892,944 312,892,944 312,892,944 312,892,944 81,352,165 - -
Change in Treasury Stock 3,457,722,964 3,772,955,422 4,129,206,515 4,315,258,050 4,376,605,855 4,444,031,341 4,598,190,855Expected Price of Repurchased Shares: 90.58$ 98.29$ 106.65$ 115.72$ 125.56$ 136.24$ 147.83$ Number of Shares Repurchased: 38,173,139 38,387,784 38,718,779 37,291,127 34,856,186 32,618,442 31,104,039
Shares Outstanding (beginning of the year) 1,065,000,000 1,033,438,560 1,001,662,475 969,555,395 938,875,967 905,738,823 873,120,381Plus: Shares Issued Through ESOP 6,611,699 6,611,699 6,611,699 6,611,699 1,719,042 0 0Less: Shares Repurchased in Treasury 38,173,139 38,387,784 38,718,779 37,291,127 34,856,186 32,618,442 31,104,039 Shares Outstanding (end of the year) 1,033,438,560 1,001,662,475 969,555,395 938,875,967 905,738,823 873,120,381 842,016,342
Page 27

VALUATION OF OPTIONS GRANTED IN ESOP
Ticker Symbol AXPCurrent Stock Price 90.58 Risk Free Rate 1.30%Current Dividend Yield 1.40%Annualized St. Dev. of Stock Returns 16.24%
Average Average B-S ValueRange of Number Exercise Remaining Option of OptionsOutstanding Options of Shares Price Life (yrs) Price GrantedRange 1 18,615,000 44.98 4.40 42.84$ 797,522,496$ Range 2 9,578,000 51.88 4.00 36.77$ 352,228,238$
Total 28,193,000 47.32$ 4.26 45.93$ 1,149,750,734$
Page 28

ROE $ 101.34 23.50% 24.00% 24.50% 25.32% 25.50% 26.00% 26.50% 27% 27.5%
2.75% 92.63 92.82 93.01 93.30 93.37 93.53 93.70 93.85 94.003.00% 94.97 95.19 95.41 95.74 95.81 96.00 96.19 96.36 96.53
CV 3.25% 97.53 97.78 98.03 98.41 98.49 98.70 98.91 99.11 99.31Growth 3.50% 100.35 100.63 100.91 101.34 101.43 101.67 101.91 102.14 102.36
3.75% 103.46 103.78 104.10 104.58 104.68 104.96 105.22 105.48 105.734.00% 106.92 107.28 107.64 108.18 108.30 108.61 108.91 109.20 109.474.25% 110.78 111.20 111.59 112.20 112.33 112.68 113.02 113.35 113.66
CV Cost of Equity $ 101.34 7.75% 8.00% 8.25% 8.5% 8.75% 9.00% 9.25% 9.50% 9.75%
2.75% 107.65 102.45 97.73 93.31 89.46 85.83 82.48 79.37 76.493.00% 111.17 105.56 100.47 95.74 91.64 87.78 84.23 80.95 77.92
CV 3.25% 115.08 108.98 103.50 98.41 94.02 89.90 86.13 82.66 79.45Growth 3.50% 119.45 112.79 106.84 101.34 96.63 92.22 88.19 84.51 81.11
3.75% 124.37 117.05 110.55 104.58 99.49 94.75 90.45 86.52 82.914.00% 129.95 121.84 114.70 108.18 102.66 97.54 92.91 88.71 84.874.25% 136.32 127.27 119.36 112.21 106.18 100.62 95.63 91.11 87.00
MRP $ 101.34 3.75% 4.00% 4.25% 4.64% 4.75% 5.00% 5.25% 5.50% 5.75%
1.00 153.98 143.10 133.65 121.17 118.06 111.55 105.72 100.47 95.711.05 145.67 135.44 126.55 114.79 111.86 105.72 100.22 95.26 90.771.10 138.22 128.56 120.16 109.05 106.28 100.47 95.26 90.57 86.31
Beta 1.18 128.24 119.34 111.60 101.34 98.78 93.41 88.60 84.25 80.311.20 125.38 116.70 109.14 99.13 96.63 91.38 86.68 82.44 78.591.25 119.81 111.55 104.36 94.81 92.43 87.43 82.95 78.90 75.231.30 114.71 106.84 99.97 90.86 88.58 83.81 79.52 75.65 72.14
CV Percentage Fees Charged on Merchants $ 101.34 1.63% 1.65% 1.68% 1.70% 1.73% 1.75% 1.78% 1.80% 1.83%
3.50% 90.66 93.51 96.36 99.21 102.07 104.92 107.77 110.62 113.48CV 4.00% 91.68 94.54 97.41 100.28 103.14 106.01 108.88 111.74 114.61
Billed Business 4.50% 92.70 95.58 98.46 101.34 104.22 107.10 109.98 112.86 115.74(% growth) 5.00% 93.72 96.62 99.51 102.40 105.30 108.19 111.09 113.98 116.87
5.50% 94.75 97.65 100.56 103.47 106.38 109.28 112.19 115.10 118.016.00% 95.77 98.69 101.61 104.53 107.45 110.38 113.30 116.22 119.146.50% 96.79 99.73 102.66 105.60 108.53 111.47 114.40 117.34 120.27
CV Effective Interest Rate on Card Member Loan101.34$ 8.10% 8.30% 8.50% 8.72% 9.00% 9.20% 9.40% 9.60% 9.80%
3.50% 91.88 93.28 94.67 96.20 98.16 99.56 100.95 102.35 103.744.00% 93.40 94.84 96.28 97.87 99.89 101.33 102.77 104.22 105.66
CV 4.50% 94.96 96.45 97.94 99.58 101.67 103.16 104.65 106.14 107.64Card Member Loan 5.00% 96.56 98.11 99.65 101.34 103.50 105.05 106.59 108.13 109.67
(% growth) 5.50% 98.22 99.81 101.41 103.16 105.39 106.99 108.58 110.17 111.776.00% 99.92 101.57 103.22 105.03 107.34 108.99 110.63 112.28 113.936.50% 101.68 103.38 105.09 106.95 109.34 111.04 112.75 114.45 116.15
Sensitivity Analysis
Page 29


