
AWRA-R version 5.0 Technical Report - Publications
92
CSIRO LAND AND WATER AWRA-R version 5.0 Technical Report Dushmanta Dutta, Shaun Kim, Justin Hughes, Jai Vaze, Ang Yang October 2015 Prepared for the Bureau of Meteorology A water information R & D alliance between the Bureau of Meteorology and CSIRO Land and Water
Transcript of AWRA-R version 5.0 Technical Report - Publications

CSIRO LAND AND WATER
AWRA-R version 5.0 Technical Report
Dushmanta Dutta, Shaun Kim, Justin Hughes, Jai Vaze, Ang Yang
October 2015
Prepared for the Bureau of Meteorology
A water information R & D alliance between the Bureau of Meteorology and CSIRO Land and Water

ii | AWRA‐R version 5.0 Technical Report
CSIRO Land and Water Report series
Australia is founding its future on science and innovation. Its national science agency, CSIRO, is a powerhouse of ideas, technologies and skills.
The work contained in this report is collaboration between CSIRO Land and Water and the Bureau of Meteorology’s Water Division under the Water Information Research and Development Alliance (WIRADA).
WIRADA is an eight‐year, $65 million partnership that will use CSIRO’s R&D expertise to help the Bureau of Meteorology report on availability, condition and use of Australia's water resources.
For more information about the partnership visit http://www.csiro.au/en/Research/LWF/Areas/Water‐resources/Assessing‐water‐resources/WIRADA
For more information about CSIRO Land and Water Initiative visit http://www.csiro.au/en/Research/LWF
Citation
Dutta D, Kim S, Hughes J, Vaze J, Yang A (2015) AWRA‐R v5.0 Technical Report. CSIRO Land and Water, Australia.
Copyright and disclaimer
© 2015 CSIRO To the extent permitted by law, all rights are reserved and no part of this publication covered by copyright may be reproduced or copied in any form or by any means except with the written permission of CSIRO.
Important disclaimer
CSIRO advises that the information contained in this publication comprises general statements based on scientific research. The reader is advised and needs to be aware that such information may be incomplete or unable to be used in any specific situation. No reliance or actions must therefore be made on that information without seeking prior expert professional, scientific and technical advice. To the extent permitted by law, CSIRO (including its employees and consultants) excludes all liability to any person for any consequences, including but not limited to all losses, damages, costs, expenses and any other compensation, arising directly or indirectly from using this publication (in part or in whole) and any information or material contained in it.
This report was reviewed by John Shi (CSIRO), Shishutosh Barua (BoM) and Mohsin Hafeez (BoM).

AWRA‐R version 5.0 Technical Report | 3
Contents
Executive summary ...................................................................................................................................... 6
1. Introduction .................................................................................................................................... 9
1.1 Background and objectives ................................................................................................... 9
1.2 Purpose of Report and Outline ........................................................................................... 11
2 Description of AWRA‐R model version 5.0 ................................................................................... 12
2.1 Conceptual background (history of development and different versions) ........................ 12
2.2 Governing equations of different components of AWRA‐Rv5.0 ........................................ 14
3 Input and output variables and parameters and model parameterisation methods ................... 30
4 Study Area and Data collation ....................................................................................................... 34
4.1 Study Area ........................................................................................................................... 34
4.2 Data collation ...................................................................................................................... 36
5 Model calibration, validation and benchmarking ......................................................................... 43
5.1 AWRA‐R v5.0 Calibration and validation ............................................................................ 43
5.2 Benchmarking of AWRA‐R v5.0 model ............................................................................... 48
6 Conclusions and Recommendations ............................................................................................. 54
6.1 Summary ............................................................................................................................. 54
6.2 Conclusions ......................................................................................................................... 54
6.3 Recommendations .............................................................................................................. 55
Appendix 1: Summary of node‐link network of AWRA‐R v5.0 model built for the MDB ........................... 58
Appendix 2: Benchmarking Report on AWRA‐R v5.0 performance for different regions of MDB ............. 71
Appendix 3: List of inputs and outputs with the variable names used in the model ................................. 89

4 | AWRA‐R version 5.0 Technical Report
Figures
Figure 1.1.AWRA modelling system ........................................................................................................... 10
Figure 2.1. AWRA‐R spatial units ................................................................................................................ 12
Figure 2.2. The conceptual diagram of AWRA‐R v5.0 reach with different modelling components (the symbols are described in relevant sections of the model descriptions in this chapter) ............................ 14
Figure 2.3. The conceptual diagram of AWRA‐R irrigation model ............................................................. 17
Figure 2.4. The conceptual diagram of AWRA‐R irrigation model ............................................................. 25
Figure 4.1.Map showing coverage of AWRA‐R v5.0 modelling regions (MDB and other NWA modelling regions are highlighted in the map) ........................................................................................................... 35
Figure 4.2. Map showing different modelling regions within the Murray‐Darling Basin ........................... 36
Figure 4.3. AWRA‐R v5.0 node‐link network for the Murray‐Darling Basin ............................................... 37
Figure 4.4. Irrigated area mapwithin the Murray‐Darling Basin ................................................................ 39
Figure 4.5. 1:100 yr return period maximum inundation extent map for the Murray‐Darling Basin ........ 40
Figure 4.6. Saturated hydraulic conductivity of soil layer between 10‐100 cm (from AWRA‐L v5.0) (Unit of the values shown in the map: mm/day) ..................................................................................................... 40
Figure 5.1. Boxplots of daily NSE for different regions within MDB in calibration (period: 1970‐1991) of AWRA‐R v5.0............................................................................................................................................... 44
Figure 5.2. Boxplots of daily NSE for different regions within MDB in validation (period: 1992‐2014) of AWRA‐R v5.0............................................................................................................................................... 44
Figure 5.3. Boxplots of annual bias for different regions within MDB during the calibration (period: 1970‐1991) of AWRA‐R v5.0 model ..................................................................................................................... 45
Figure 5.4. Boxplots of annual bias for different regions within MDB during the validation (period: 1992‐2014) of AWRA‐R v5.0 model ..................................................................................................................... 45
Figure 5.5. Summary statistics for system calibration and comparison with that from reach‐by‐reach calibration for the MDB .............................................................................................................................. 47
Figure 5.6. Summary statistics for system calibration and comparison with that from reach‐by‐reach calibration for Campaspe ........................................................................................................................... 47
Figure 5.7. Comparison of AWRA‐R v5.0 model performance against AWRA‐R v4.5 for all model reaches in within MDB ............................................................................................................................................. 49
Figure 5.8. An example of a reach‐level AWRA‐R v5.0 benchmarking report card .................................... 50
Figure 5.9. Summary of performance of the calibrated AWRA‐R irrigation model in 31 irrigation reaches within MDB ................................................................................................................................................. 51
Figure 5.10. Comparison of AWRA‐R simulated ET against monthly ET from CMRSET product for the period of 2000‐2013. .................................................................................................................................. 52
Figure 5.11. Spatial variation in correlations between simulated ET by AWRA‐R irrigation model and CMRSET at monthly scale (for the period of 2000‐2013). The yellow circles represent the correlations with larger circle representing higher correlation and smaller circle representing lower correlations. ... 53

AWRA‐R version 5.0 Technical Report | 5
Tables
Table 2.1. Modelling components of different versions of the AWRA‐R model ........................................ 13
Table 3.1. Time series variables of AWRA‐R v5.0 ....................................................................................... 30
Table 3.2. Parameters of AWRA‐R v5.0 included the calibrated parameters ............................................ 30
Table 3.3. AWRA‐R v5.0 outputs ................................................................................................................ 31
Table 4.1. Number of reaches for different modelling regions in AWRA‐R v5.0 ....................................... 34
Table 4.2. Sources of Temporal data used in AWRA‐R v5.0 modelling ...................................................... 38
Table 4.3. Sources of parameter values used in AWRA‐R v5.0 modelling ................................................. 41
Table 5.1. AWRA‐R evaluation criteria ....................................................................................................... 43
Table 5.2. Long term mass balance in different sub‐regions within the MDB during the calibration and validation periods ....................................................................................................................................... 45
Table 5.3. Computational time for system calibration in different regions/sub‐regions within the MDB 48
Table 5.4. Performance of AWRA‐R floodplain inundation model (approach 2) against Landsat flood maps ........................................................................................................................................................... 51

6 | AWRA‐R version 5.0 Technical Report
Executive summary
This report describes the AWRA‐R v5.0 model and its application and benchmarking. The core objective of the AWRA‐R model is to produce various fluxes and stores associated with river systems in regulated and unregulated systems to support the production of the national water accounts (NWA) by the BoM. The research and development of AWRA‐R model started in FY2011‐12 (Lerat et al., 2012) as part of WIRADA and since then four different versions of AWRA‐R [versions 3.0 (Lerat et al., 2013), 4.0, 4.5 and 5.0] have been developed, tested and implemented so far. The AWRA‐R model produces a large number of fluxes and stores for surface water accounts. This quantitative information provides a detailed understanding of major components of water balances at a reach level for water resources accounting, analyses and reporting purposes.
The technical details of different components of AWRA‐R v5.0 model and their governing equations are presented in section 2. The improvements/changes in AWRA‐R over the period of the development since 2011 are also summarised in this section. A large amount of spatial and temporal data are required for AWRA‐R modelling. The list of all input temporal variables, spatial and other parameters are listed in section 3 with the reference to appropriate governing equations presented in section 2. The model has eight calibration parameters, which are listed in section 3. The two calibration approaches (reach‐by‐reach and system calibration) used for model parameterisation are also described in this section. The system calibration approach has been newly developed and implemented in AWRA‐R v5.0. The AWRA‐R v5.0 model has been calibrated and validated in the MDB using both the reach‐by‐reach and system calibration approaches. Section 4 presents the collation of input data for the application of the model in the MDB. The AWRA‐R v5.0 model in the MDB region included a total of 485 gauges and 33 large and medium size storages. The results of the model calibration and validation against the observed daily streamflow data are presented in section 5. A comprehensive benchmarking of AWRA‐R v5.0 results was undertaken using available data from ground based and remotely sensed observed as well as the results of the earlier version of the model. The results of benchmarking are also presented in this section. A set of benchmarking scripts have been prepared to benchmarking AWRA‐R results in both reach and regional scales for comprehensive understanding of the model performance and water balance.
The results of the reach‐by‐reach calibration and validation of the model in the MDB show highly satisfactory performance of the model with median daily NSE of 0.60 and median annual bias of less than 1% for the period of calibration (1970‐1991) and median daily NSE of 0.69 and median annual bias of 16%for validation period (1992‐2014) for the MDB. Within the MDB region, median daily NSE varied between 0.54‐0.83 in 18 different sub‐regions under the calibration mode and the variation of median daily NSE was between 0.39‐0.83 in the 18 sub‐regions under the validation mode. The model performed best in the Murray catchment and worst in Loddon Avoca, where the quality of the observed stream data was poor with many missing data points. The mass balance error of the AWRA‐R model was negligible.
Overall, the performance of the system calibration in the MDB is poorer than the reach‐by‐reach calibration with patched observed inflow as it is obvious to have better model performance with patched inflow in the MDB with high quality observed streamflow data. However, the model with the system calibration showed better performance than the reach‐by‐reach calibration without patched observed inflow data. This shows that the system calibration is better suited for any predictive analysis by AWRA‐R without observed data. The application of the system calibration with patched inflow in Campaspe region shows that the model performance with the system calibration is similar to that with the reach‐by‐reach calibration. It is important to note that the computational time of the system calibration is quite large compared to the reach‐by‐reach calibration.
The benchmarking results show that the overall performance of AWRA‐Rv5.0 (with calibrated parameters from reach‐by‐reach calibration) is slightly better than AWRA‐Rv4.5.The median monthly NSE of the AWRA‐

AWRA‐R version 5.0 Technical Report | 7
R irrigation model performance are reasonable and median annual bias was very low. The simulated ET by AWRA‐R irrigation model shows good correlation (> 0.5) with the actual ET from CMRSET product at monthly scale. The simulated inundation maps by Approach 2 inundation model show reasonably high cell‐to‐cell correlation (>0.6) with the flood maps derived from Landsat imagery for most of the modelled reaches in different floodplains across the MDB. Overall, the performance of different components of AWRA‐R v5.0 model satisfies the performance evaluation criteria set by BoM.
The AWRA v5.0 model has been operalisationalised in the Bureau of Meteorology using Delft‐FEWS in March 2015.

8 | AWRA‐R version 5.0 Technical Report
Abbreviations
AWRA the Australian Water Resources Assessment
ABARES the Australian Bureau of Agricultural and Resource Economics and Sciences
ABS the Australian Bureau of Statistics
AWRA‐L AWRA Landscape model
AWRA‐Lv3.5.6 AWRA‐L model version 3.5.6 released in FY2012‐13
AWRA‐Lv4.0 AWRA‐L version 4.0 released in FY2013‐14
AWRA‐Lv4.5 AWRA‐L version 4.5 released in FY2014‐15
AWRA‐Lv5.0 AWRA‐L version 5.0 released in FY2014‐15
AWRA‐R the Australian Water Resources Assessment – River model
AWRA‐Rv3.0 AWRA‐R version 3.0 released in FY2012‐13
AWRA‐Rv4.0 AWRA‐R version 4.0 released in FY2013‐14
AWRA‐Rv4.5 AWRA‐R version 4.5 released in FY2014‐15
AWRA‐R v5.0 AWRA‐R version 5.0 released in FY2014‐15
AWRAv3.5 the AWRA modelling system version 3.5 released in FY2012‐13
AWRAv4.0 the AWRA modelling system version 4.0 released in FY2013‐14
AWRAv4.5 the AWRA modelling system version 4.5 released in FY2014‐15
AWRA v5.0 the AWRA modelling system version 5.0 released in FY2014‐15
BAWAP Bureau of Meteorology Australian Water Availability Project
BoM the Bureau of Meteorology
CLUM Catchment scale land use mapping (ABARE‐BRS)
CSIRO the Commonwealth Scientific and Industrial Research Organisation
ET Evapotranspiration
GA Geoscience Australia
IQQM Integrated Quantity and Quality Model
LiDAR Light Detection and Ranging
LT Landsat Thematic Mapper or Landsat 5 sensor
MDB Murray Darling Basin
MDBA the Murray Darling Basin Authority
MODIS Moderate‐Resolution Imaging Spectroradiometer
NSE Nash‐Sutcliffe Efficiency
NSW New South Wales
NWA National Water Accounts
OFS On‐farm storage
PET Potential Evapotranspiration
QLD Queensland
RS Remote Sensing
SRTM Shuttle Radar Topography Mission
TM Thematic Mapper
VIC Victoria
WIRADA the Water Information Research and Development Alliance

AWRA‐R version 5.0 Technical Report | 9
1. Introduction
1.1 Background and objectives
In response to multiple concomitant pressures on Australia’s water resources, the Australian Government,
through the Commonwealth Water Act 2007, has given the Australian Bureau of Meteorology, responsibility
for compiling and delivering comprehensive water information across the water sector (BoM, 2012). To fulfil
its legislative responsibilities, the Bureau requires a water balance modelling system developed using state‐
of‐the‐art hydrological science that quantifies water flux and storage terms and their respective uncertainties
(where applicable and possible) using a combination of data sets (on‐ground metering, remotely sensed data
and model outputs). The system need to be applicable across the continent and it should be flexible enough
to be able to use all available data sources (when modelling data rich and data limited regions) with the most
appropriate modelling techniques and tools suitable for use with the available data to provide nationally
consistent and robust estimates. The outputs from the water balance modelling system are used to underpin
a range of water information products delivered by the Bureau and thus the system needs to generate all the
necessary water flux and storage terms at a spatial and temporal scale appropriate for aggregated reporting.
The Bureau and CSIRO through the Water for a Healthy Country National Research Flagship established
Water Information Research and Development Alliance (WIRADA) in 2008 to collaborate on research
activities in the field of water information (BoM & CSIRO, 2013). As part of this alliance, a continental scale
modelling system representing the Australian terrestrial water cycle, called Australian Water Resource
Assessment (AWRA), was built and operationalised at the BoM for producing Australia’s national water
assessments and water accounts (Vaze et al., 2013). The AWRA modelling system consists of two major
modelling components (Figure 1.1):
i) AWRA landscape (AWRA‐L), the landscape component of the AWRA system, is a daily grid‐based
biophysical model of the water balance between the atmosphere, the soil, groundwater and surface
water stores (Viney et al., 2014), and
ii) AWRA river (AWRA‐R), the river system component of the AWRA system, is a conceptual hydrological
model designed for both regulated and unregulated river systems.
AWRA‐L is a raster model and run on a uniform 0.05 degree x 0.05 degree resolution grid network
(approximately 5km x 5km) covering the entire Australian continent at a daily time step. Details of AWRA‐L
model are presented in Viney et al. (2014) and not discussed in this report.
AWRA‐R is a vector model and it uses non‐uniform sets of nodes and links for routing flows along a river
system and modelling associated components at a daily time step. The core objective of the AWRA‐R model
is to produce various fluxes and stores associated with river systems in regulated and unregulated systems
to support the production of the national water accounts (NWA) by the BoM. The model has been developed
using the following three development principles as identified in Van Dijk et al. (2012).
Observation‐driven design: the water accounting exercise is essentially retrospective, with the
objective of estimating fluxes and storage for the past recent years. The amount of data available in
such a context is much larger than for other traditional modelling exercise (e.g. scenario modelling).

10 | AWRA‐R version 5.0 Technical Report
As a result, observations play a critical role in the AWRA‐R system and are preferred to modelled
quantities.
Modular architecture: the AWRA‐R system integrates several components targeting the different
fluxes and stores associated with a river system. A modular architecture recognises the
heterogeneity in a river system and enables users to implement the model in a modular way using
the components that are required for any particular river reach (e.g., a river reach with or without
river storage or irrigation diversion).
Iterative development: the AWRA‐R system constitutes a complex modelling framework
incorporating all key hydrological processes and anthropogenic water uses/demands and the model
has been built and implemented progressively over the duration of WIRADA. The iterative
development process loops through three phases starting from the model development, moving to
its deployment on a large number of test cases and finally its evaluation against benchmarks. This
process ensures that the performance of the model keeps improving with the addition of any new
components.
Figure 1.1.AWRA modelling system
The research and development of AWRA‐R model started in FY2011‐12 (Lerat et al., 2012) and since then
four different versions of AWRA‐R (versions 3.0, 4.0, 4.5 and 5.0) have been developed, tested and
implemented until end of this financial year (FY 2014‐15). The latest version (AWRA‐R v5.0) has been
operationalised at the BoM in March 2015.
The focus of this technical report is AWRA‐R v5.0. The report describes different components of the model,
the calibration systems, implementation of the model in the Murray‐Darling basin and benchmarking results.

AWRA‐R version 5.0 Technical Report | 11
1.2 Purpose of Report and Outline
This report has been prepared to provide technical information on the AWRA‐R model version 5.0 and to
present the results of calibration, validation and benchmarking of the model in the Murray Darling Basin. The
report incorporates the following:
the background and objectives (Section 1)
Description of AWRA‐Rv5.0model (Section 2)
Input variables, parameters and method for model parameterisations (section 3)
the study area and data collation (Section 4)
the results of calibration and validation and benchmarking (Section 5)
the conclusions and recommendations (Section 6)

12 | AWRA‐R version 5.0 Technical Report
2 Description of AWRA-R model version 5.0
2.1 Conceptual background (history of development and different versions)
The AWRA‐R model has been designed using a node‐link concept (Welsh et al., 2013; Dutta et al., 2013a), where a river system is schematised into a simplified river network using a node‐link structure. The river network begins and ends with a node, and all nodes are interconnected by links. A link is used for transfer of flow between two nodes with routing and transformation. Runoff from gauged or ungauged tributaries or local contributing area between two nodes is fed into the connecting link as an inflow at the relevant location and all other physical processes (such as diversions, groundwater fluxes, overbank flow) occurring between the two nodes are incorporated in the link. For implementation of AWRA‐R, a river basin is schematised into a number of spatial units (called AWRA‐R catchments) based on the river network and locations of streamflow gauges. AWRA‐R catchments in a river basin can be divided into two categories:
i) Headwater catchment (Figure 2.1a): this type of area corresponds to classical catchments with an outlet materialised by a gauging station or a storage outlet.
ii) Residual catchments (or, river reach intermediate area) (Figure 2.1b): this type of area corresponds to the drainage area between a set of upstream points and a downstream point materialised by a gauging station or a storage outlet.
Within these areas, AWRA‐R is built as a node‐link network that connects the different components. Each component can be a source or a sink. It can also route water to the next component. It is important to note that this set‐up allows AWRA‐R to link the simulations from upstream to downstream areas and build a catchment model as illustrated in Figure 2.1c.
Figure 2.1. AWRA-R spatial units
AWRA‐R has evolved over the past three years with incremental development. Developments include
conceptualisation and building of different components, improvements to some of the existing components
and incorporation of additional components to extend the model application to produce various fluxes and
stores for water accounting. During this period, four versions of the AWRA‐R model have been released
(versions 3.0, 4.0, 4.5 and 5.0).

AWRA‐R version 5.0 Technical Report | 13
The current version of the AWRA‐R model (version 5.0) consists of the following components.
i) Streamflow routing
ii) Local ungauged runoff
iii) Storage contribution modelling
iv) Irrigation modelling
v) Urban water use
vi) Water use for stock and domestic
vii) Rainfall to and evaporation from river
viii) Anabranch flow
ix) Floodplain inundation modelling
x) River and groundwater interaction modelling
xi) Headwater catchment modelling
The components i) – x) are developed and implemented in residual catchments/reaches and the component
xi) is built for headwater catchments only.
Table 2.1shows the differences in this version compared to the previous versions in terms of model
components.
Table 2.1. Modelling components of different versions of the AWRA-R model
Components AWRA-Rv3.0 AWRA-Rv4.0 AWRA-Rv4.5 AWRA-Rv5.0
i) Streamflow routing
Muskingum routing Same as earlier version
Same as earlier version
Same as earlier version
ii) Local ungauged runoff
Yes (scaled cookie‐cut runoff from AWRA‐L)
Same as previous version
Same as previous version
Same as previous version
iii) Storage contribution modelling
Use storage balance concept
Same as previous version
Same as previous version
Updated to incorporate urban diversion from storage
iv) Irrigation modelling
Irrigation model using FAO concept
Irrigation model updated for groundwater interaction
Same as previous version
Same as previous version
v) Urban water use
Option for incorporating observed time series
Same as previous version
Same as previous version
Same as previous version
vi) Water use for stock and domestic
None None None Option for incorporating observed time series
vii) Rainfall to and evaporation from river
Based on surface area of river store
Same as previous version
Same as previous version
Same as previous version
viii) Anabranch flow
Based on flow ratio between main and anabranch
Same as previous version
Same as previous version
Same as previous version

14 | AWRA‐R version 5.0 Technical Report
Components AWRA-Rv3.0 AWRA-Rv4.0 AWRA-Rv4.5 AWRA-Rv5.0
ix) Floodplain inundation modelling
Simple concept without partitioning river and floodplain storages
Updated method (Approach 1, Teng et al., 2014) with separate store for river and floodplains
Same as previous version
Same as previous version
x) River and groundwater interaction modelling
Simple Monod concept
Updated to incorporate soil and groundwater characteristics
Same as previous version
Same as previous version
xi) Headwater catchment modelling
Yes (cookie‐cut runoff from AWRA‐L)
Same as previous version
Same as previous version
Updated to calculate groundwater fluxes from river
2.2 Governing equations of different components of AWRA‐Rv5.0
Figure 2.2shows a conceptual diagram of a river reach (in a residual catchment) with different components
of the model. In a headwater catchment, none of the processes (shown in the figure) are modelled except
the back calculation of rainfall to and evaporation from river surface, river volume and groundwater losses
based on the observed or gap‐filled flow data at the outlet of the catchment as explained in section 2.2.11.
As shown in Figure 2.2, in an AWRA‐R simulation of a residual reach, all upstream inflows are routed first and
then, local inflows are added and losses are subtracted to calculate the outflow at the end of the reach.
Figure 2.2. The conceptual diagram of AWRA-R v5.0 reach with different modelling components (the symbols are described in relevant sections of the model descriptions in this chapter)
Inflow from one or multiple u/s reaches (observed/simulated)
Downstream flow (simulated: Main stem)
Downstream flow (Qa)(simulated: Anabranch(es))
Ungauged local runoff (Qr)(AWRA‐L)
Storage contribution (Qs)Diversions (Qd, Qu, Qsd)(irrigation, urban, stock & domestic)Return flow (Qirr)
(irrigation)
Reach rainfall (Qp) Reach evaporation (Qe)
Overbank flow (Qfp)Return flow (Qfpr)(floodplain) Recharge to groundwater (Qgw)
Node
Reach
Qu/s
(Qu/s)rout

AWRA‐R version 5.0 Technical Report | 15
The general form of water balance for a reach (with routed upstream flow) for AWRA‐Rv5.0 can be described
as follows:
Q / Q / Q Q Q Q Q Q Q Q Q Q Q Q
(1)
Where,
/ = simulated flow at the downstream gauge (m3/sec),
/ = concurrent flow at the upstream gauges (including gauged tributaries) (m3/sec),
/ = upstream inflow following routing (m3/sec),
= runoff locally generated from the local ungauged catchment (m3/sec),
= contribution from any storages including rainfall on storage area, evaporation from storage area
and change in storage volume (m3/sec),
= loss due to irrigation diversion (m3/sec),
= total return flow from irrigated area (m3/sec),
= net loss due to urban diversion (m3/sec),
Qsd = rural water use (other than irrigation) for stock and domestic (m3/sec),
= the flux to the river store due to rainfall (m3/sec),
= the flux from the river due to evaporation (m3/sec),
= the flow diverted to anabranches (m3/sec),
= overbank flow to floodplain (m3/sec),
= return flow from floodplain (m3/sec),
= the flux from river to groundwater (m3/sec).
2.2.1 STREAMFLOW ROUTING [ / ]
The streamflow from an upstream gauge of a reach is routed along the reach to the downstream gauge using
a lagged Muskingum routing (Koussis, 1980) method, which can be described by the following set of
equations:
, / (2)
, 1 / (3)
where,
Vmusk = routing volume (m3) (estimated)

16 | AWRA‐R version 5.0 Technical Report
K, x and Lag = Muskingum routing parameters (these three parameters are calibrated)
t = the current timestep.
2.2.2 LOCAL UNGAUGED RUNOFF Qr
AWRA‐R does not include any local rainfall‐runoff model for estimating ungauged local runoff. Instead, locally
generated runoff (Qr) from an ungauged catchment is computed in AWRA‐R using the output from the AWRA‐
Landscape model (AWRA‐L) (Viney et al., 2014). AWRA‐L is run on a 0.05 x 0.05 grid (approximately 5km x
5km) at a daily time step. For each reach in AWRA‐R, a single runoff input is obtained by averaging the gridded
AWRA‐L runoff over the AWRA‐R catchment boundaries of the contributing sub‐catchments. The AWRA‐L
model is continentally calibrated to optimise one set of 21 model parameters for the entire Australian
continent. The final runoff Qr used in AWRA‐R for a reach from the contributing ungauged catchment is given
by the following expression:
∗ ∗ (4)
where,
SF = scaling factor (dimension less) (this parameter is calibrated)
wi = weighting factor (dimension less). This weighting procedure assumes that the contribution of a
grid to the runoff Qr is proportional to the area of the cell over the total area of the catchment
Qtot(i) = gridded runoff simulated by AWRA‐L at any grid I (m/sec)
A = catchment area (m2)
2.2.3 STORAGE CONTRIBUTION MODELLING (Qs)
In AWRA‐R v5.0, the storage contribution modelling method of AWRA‐R v4.5 has been updated to
incorporate the additional process of water transfer (mainly for urban water use) directly from/to a reservoir
or storage. Thus, the contribution from a storage or reservoir located within a reach is computed in AWRA‐R
v5.0 using the following two equations for a modelling time step:
_
Where, _ _ _ (5)
0 0
2 (6)
where,
Qtransfer_in = water directly transfer into the storage (m3/sec) (observed data)
Qtransfer_out = water directly transfer out of the storage (m3/sec) (observed data)
S(δ) = storage volume at the end of the time step (m3) (observed data)

AWRA‐R version 5.0 Technical Report | 17
S(0) = storage volume at the beginning of the time step(m3) (observed data)
= modelling time step duration (sec)
a(δ) = storage area at the end of the time step(m2) (available data or calculated based on observed
volume and level data)
a(0) = storage area at the beginning of the time step(m2) (available data or calculated based on
observed volume and level data)
PS = areal rainfall over the time step (m/sec) (used AWRA‐L outputs)
ES = areal evaporation over the time step (m/sec) (used AWRA‐L outputs)
2.2.4 IRRIGATION MODELLING
AWRA‐R irrigation model has been designed to estimate diversion of surface water from river to irrigated
area ( d), return flow from irrigated area to river ( irr) and other fluxes and stores associated with irrigated
area. AWRA‐R v5.0 model uses the same irrigation model (except two minor changes, which are explained in
this document) that was implemented in AWRA‐R v4.0 (Hughes et al., 2014). A schematic diagram of AWRA‐
R irrigation model is shown in Figure 2.3.
Figure 2.3. The conceptual diagram of AWRA-R irrigation model

18 | AWRA‐R version 5.0 Technical Report
In the irrigation model, the general form of daily water balance equation used for an irrigated area is as
follows:
∗∗ ∗
, ∗ ,
∗∗
(7)
where,
= depth of water in the irrigated area soil moisture store on day of year i (m)
= depth of water in the irrigated area soil store on previous day (i‐1) (m)
= total supplied water for irrigation from SW, GW and OFS (m3/sec, estimated)
timestep = modelling timestep (sec)
= area planted on decision date i (there are 5 decision dates, these are at days 80, 120, 270,
310 and 365) (m2, estimated). It includes crops to be sown later in the current season.
, = area weighted crop factor for crops growing on day i (dimensionless, estimated)
, = reference evapotranspiration (m, it is replaced by Eo obtained from AWRA‐L due to absence
of reference ET data)
= precipitation on irrigated area (m, obtained from AWRA‐L outputs)
= groundwater recharge from irrigated area (m3/sec, estimated)
= proportion of areaCi actively growing crops on day i (dimensionless)
= surface runoff from irrigated area (m3/sec, estimated)
= irrigation efficiency term (dimensionless).
At the start, an initial assessment of soil water ( in m) is calculated before irrigation on the current
time step is calculated or accounted for;
∗
∗ ∗, ∗ ,
(8)
, , ∗ , (9)
∗ ∗
(10)
∗ (11)
where,
= supplied water for irrigation on previous day (i‐1) (m3/sec)

AWRA‐R version 5.0 Technical Report | 19
, = crop factor for crop c on Day of year i (dimensionless, obtained from Table 2.1, Hughes et al.,
2014)
, = proportion of area sown to crop c on Day of year i (dimensionless).
n = number of crop type (dimensionless, known data from field)
= total volume of water resources available at decision date i (m3, estimated)
volMax = maximum available water in any single year (m3, this term is currently derived from time
series of historical records). However, note that in the case of data available, it should be the surface
water licence + groundwater licence + OFS capacity, as these are the maximum water entitlements
that irrigator can use water.
areaMax= maximum area that can be planted in any year (m2, obtained from irrigated area map if
available or estimated)
αand β = irrigation model parameters (dimensionless) that are calibrated for each reach against
observed diversion data (these two parameters are calibrated)
= allocation available for surface water diversion licence on day I (dimensionless, known
data from field)
= annual licence volume for surface water diversion (m3, known data from field)
= volume of on‐farm storage at the end of day i‐1 (m3, known through OFS sub‐model)
(Note: this is a sub‐component of the irrigation model, further described below)
= annual licence volume for groundwater diversion (m3, known data from field)
OFS at the end of timestep, which is available at the beginning of the following timestep is calculated as
follows;
volOFSi‐1 – ,*timestep *timestep – evap‐ rainfall *areaOFSi‐1 (12)
min volOFSmax
volOFS /86400 ,max 0, ∗
(13)
areaOFSi‐1 volOFSi‐1 /ringtankAvgDepth (14)
where,
= amount of on‐farm storage remaining on day (i‐1) (m3)
,= amount of on‐farm storage used on day (i) (m3/sec, estimate; i.e. , will be
discussed later in this section)
= inflow to on‐farm storage on day (i) (m3/sec)

20 | AWRA‐R version 5.0 Technical Report
= maximum capacity of OFS (m3, observed data) (Note: at the moment it is guesswork,
more specifically, estimations based on imagery and mapped CLUM polygons (by reach))
evap and rainfall= fluxes to and from the OFS due to evaporation and rainfall respectively (m,
calculated based on AWRA‐L outputs)
areaOFSi‐1 area of on‐farm storage on day (i‐1) (m2, estimated)
ringtankAvgDepth= average on‐farm storage depth (m, assumed to be 4‐m)
= volume of river flow on day i (m3)
= threshold river flow above which water is diverted from the river into storage (m3, OFS
sub‐model parameter)
= maximum daily pump capacity for the district/reach (m3, OFS sub‐model parameter)
(Note: ideally, it should be used from the observed data if available)
= OFS sub‐model parameter which determines the daily rate at which pumping rises to
its maximum rate (m3)
Maximum area that can be planted in any year (areaMax) is calculated as follows:
/ , ∗ , ∗
(15)
where,
, = average by day of year i(m) (i.e. there will be 365 values for each day based on AWRA‐L
outputs)
= irrigation efficiency (dimensionless, currently used as 2, but can be replaced with
observed data if available)
n= total number of days in a year
At this stage, total irrigation (m3/s) on day i is calculated based on as follows:
√2
∗ ∗ ∗ / 0
√2
∗ ∗ ∗ / 0
0
(16)
where,
µand= parameters of normal distribution function
γ= soil store function parameter (m2) (currently used 7.0e‐04)
σ= soil store function parameter (dimensionless, currently used 0.02)

AWRA‐R version 5.0 Technical Report | 21
= maximum capacity of the soil (m). This is reasonably arbitrary but should reflect the
allowable depletion of the dominant soil types of the district.
At this stage, soil water from the previous time step is updated with the depth of irrigation, rainfall and crop
demand;
, ∗ ,
∗ / ∗ ∗
(17)
Any excess water i.e., greater than soilCap, is considered to be groundwater recharge and runoff,
therefore;
, 0, 0 (18)
, (19)
Leftover water (i.e. "( ‐ )) is balanced through GWRi, and runoffi components. Note that the
balance first done through GWRi component in the model as follows;
min ∗ ∗ /timestep , , ∗ (20)
_
_ 1
if hw_irr = 0, _
(21)
_ (22)
_
_2
If hw_irr = 0, 0
(23)
where,
Iirr = potential infiltration rate from irrigated area m2/day, estimated)
ΔS = total storage available per unit length (m2/day, estimated)
Qirr = maximum volume of water discharging from the aquifer (considered zero, see the above
assumption)
Kc = saturated conductivity of surface layer (m/sec, catchment average value obtained from AWRA‐
L)
xw_irr = lateral extent of irrigated area (m, i.e. total irrigated crop area (i.e. areaC/Pro)/length of the
river)
tw = duration of modelling time step (day)

22 | AWRA‐R version 5.0 Technical Report
dgw = depth to groundwater (m, currently used as 5m)
Sy = aquifer specific yield (dimensionless, catchment average value obtained from AWRA‐L)
Ponding ( _ ) is assumed to be minimal (or zero) under irrigation management. Therefore, Equation 21
is further simplified and in Equation 23 becomes zero.
If ( - ) < , then runoffi= 0
If ( - ) > , then;
∗ ∗ / (24)
Total simulated irrigation diversion (irrii) volume is partitioned into three sources includes surface water,
groundwater and on‐farm storage using the following equations:
min , ∗
(25)
min , ∗
(26)
min , ∗
(27)
where,
= irrigation diversion from surface water on day i (m3/sec)
= u/s observed streamflow with gap‐filled by simulated flow in the reach on day i (m3/s, estimated)
= surface water entitlement (i.e. ) available on the most decision date, d (as mentioned
before, there are 5 decision date, these are at days 80, 120, 270, 310 and 365) (m3)
= volume groundwater entitlement available on the most decision date, d (m3)
= volume on‐farm storage available on the most recent decision date, d (m3)
GWi= irrigation diversion from groundwater on day i (m3/s)
OFSIi= irrigation diversion from OFS on day i (m3/s)
GWi and OFSIi (in Equations 26 and 27, respectively) have been updated in AWRA‐R v5.0 to limit the GW
and OFS extraction based on water availability from these two sources.
The surface water diversion on any day i is calculated as follows:
diversionCarryOveri‐1 (28)

AWRA‐R version 5.0 Technical Report | 23
This is the updated equation in AWRA‐R v5.0 to account for shortfall of surface water diversion in the previous
timestep.
In the case of not enough water available from the river to divert as surface water (i.e., ∗
), shortfall is recorded as diversion Carry Over and added to the following time step surface
water diversion;
diversionCarryOveri‐1= ∗ - (29)
The final surface water diversion (Qd) on any day i is calculated as follows;
(30)
Irrigation return (Qirr), which is considered as part of irrigation efficiency, is calculated based on the simulated
surface water diversion;
(31)
where,
= a dimensionless parameter (currently set 0.1)
2.2.5 URBAN WATER USE Qu
AWRA‐R model does not simulate urban water use. Instead, the model provides option to incorporate daily
time series of observed urban diversion from a river reach (Qu) as input data.
2.2.6 WATER USE FOR STOCK AND DOMESTIC (Qsd)
AWRA‐R v5.0 model does not simulate any other water diversion except irrigation diversion. The model
provides the option to incorporate daily time series of observed diversion for stock and domestic (Qsd) as
input data.
2.2.7 RAINFALL TO AND EVAPORATION FROM RIVER QpANDQe
Rainfall to river (Qp) and evaporation from water surface (Qe) along a river reach are estimated using the
following three equations:
∗ (32)
∗ (33)
/
(34)

24 | AWRA‐R version 5.0 Technical Report
where,
P = Precipitation rate on river surface (m/sec)
E = Evaporation rate from river surface (m/sec)
a = water surface area of a river reach (m2)
α and = parameters obtained by fitting a power law against the rating curve at the streamflow
gauges (these parameters are obtained during model setup using cross‐section data and river
length). Note: in the case of having multiple gauges in a single catchment, the median alpha and
corresponding beta for all available gauging stations (u/s and d/s) is used for residual reaches.
However, for the headwater reaches alphas are scaled by 0.5 as there is only a d/s gauge and it is
assumed that headwater reaches narrows towards zero width at the start point of the river.
2.2.8 ANABRANCH FLOW (Qa)
Many river reaches mostly in flat terrains include anabranches and it is required to partition the flow between
the main stem of the river and anabranches. In AWRA‐R, the partition between the main stem and anabranch
flow a) is computed as a linear relationship expressed as:
/
(35)
where,
Ca= partition factor (dimensionless) determined based on the observed flow at the gauge located at
the main stem below an anabranch and gauge at the anabranch.
Ba= exponent (dimensionless) determined based on the observed flow at the gauge located at the main
stem below an anabranch and gauge at the anabranch.
Both Ca and Ba are estimated by establishing best‐fit power function between observed flow at the gauge
located at the main stem below an anabranch and gauge at the anabranch.
2.2.9 FLOODPLAIN INUNDATION MODELLING
Floodplain inundation modelling is undertaken using approach 1(described in detail in Dutta et al., 2013b;
Teng et al., 2014), which is used in AWRA‐R for estimating fluxes and stores associated with floodplain. A
schematic diagram of flood model component of AWRA‐R is shown in Figure 2.4.

AWRA‐R version 5.0 Technical Report | 25
Figure 2.4. The conceptual diagram of AWRA-R irrigation model
Overbank flooding fp) and flood return fpr) are two components of overall floodplain water balance
equation, which can be presented for a river reach as:
dt A dt (36)
where,
= estimated floodplain storage at current time step t (m3)
= floodplain storage at previous time stept‐1 (m3)
dt= modelling time step (sec)
Pfp= precipitation on floodplain (m/sec) (used AWRA‐L outputs)
Efp= evaporation from floodplain (m/sec) (used AWRA‐L outputs)
= average floodplain inundated area (m2) (estimated based on the volume‐area relationship)
GWRfp= groundwater recharge rate from floodplain (m3/sec)
fp, fpr and Vfp in Equation (36) are calculated using the following equations:
max 0, ∗ , max 0, ∗ 1
max 0, ∗ , max 0, ∗ 1
(37)
∗ (38)
(39)
∗ (40)
(41)
A
B
Flow
rout
ing
Vfp
Ungauged inflowClimatic forcing
Flux to Groundwater
Open water evaporation
Vr
U/S inflow
D/S outflow
Rainfall
GWR
P
ET
Pfp
Efp
GWRfp

26 | AWRA‐R version 5.0 Technical Report
∗ (42)
where,
q*= estimated flow at the downstream gauge of the modelled reach (i.e., / in Equation 1). Note:
at this stage, the components are considered in Equation 1 to get the q* values are: (Q(u/s))rout+Qr+Qs‐
Qd+Qirr‐Qu‐Qsd+Qp‐Qe‐Qa
OT= overbank flow threshold (or, in‐stream capacity) (m3/sec) (this parameter is calibrated). Initial
estimate of this value is done using the river cross‐section, observed flow and water level data during
model setup. For this purpose, the bank height is first identified based on the shape of the cross‐
section. The corresponding flow for the bank full water level from the rating curve for the cross‐
section represents in the initial threshold.
V‐fp and Vfp= floodplain inundation volume at the beginning and end of the time step (m3)
Afp= floodplain inundated area (m2)
Cfp= inverse of the average floodplain depth (m‐1) (assumed constant and derived from floodplain
inundation volume‐area linear relationship which is derived during model setup)
FR= return flow rate (dimensionless) (this parameter is calibrated)
GWRfp in Equation (36) is calculated using the following equation based on Doble et al. (2014):
min , ∗ (43)
1
(44)
(45)
2
(46)
where,
I = potential infiltration rate (m2/sec)
ΔS = total storage available(m2/sec)
Q = maximum volume of water discharging from the aquifer(m2/sec)
Kc = saturated conductivity of surface layer (m/sec) (catchment average, obtained from AWRA‐L)
xw = lateral extent of flooding (m) (calculated as "flooded area (i.e. Afp) /length of the river reach")
hw = depth of flood (m) (assumed constant and derived from floodplain inundation volume‐area
linear relationship which is derived during model setup)
dc = thickness of the surface layer (m)
tw = duration of modelling time step(sec) (i.e. daily)

AWRA‐R version 5.0 Technical Report | 27
dgw = depth to groundwater (m)
Sy = aquifer specific yield (dimensionless) (catchment average, obtained from AWRA‐L)
Kaq = hydraulic conductivity of the aquifer (m/sec) (catchment average, obtained from AWRA‐L)
daq = saturated thickness of the aquifer (m) (catchment average, obtained from AWRA‐L)
2.2.10 RIVER AND GROUNDWATER INTERACTION MODELLING
This module is used in AWRA‐R to calculate the flux from river to groundwater ( gw) along a reach. Gain from
groundwater to a river reach (i.e., baseflow) is calculated as part of the total runoff estimated by AWRA‐L.
The following equations, based on Doble et al. (2014), are used to calculate the flux from a river reach to the
underlying groundwater store of AWRA‐L.
min / , , ∗ (47)
(48)
1
(49)
(50)
2
(51)
where,
Qgwmonod = groundwater loss (m3/sec) as function of streamflow (Qstream) (i.e. / in Equation 1) using
a Monod function. At this stage, all the components are considered except the Qgw in Equation 1 to
get the / value.
Iriv = potential infiltration rate from river (m2/sec)
ΔSriv = total storage available(m2/sec)
Qriv = maximum volume of water discharging from the aquifer (m2/sec)
M1and M2 = Monod parameters (m3/sec) (these two parameters are calibrated)
Krivc = river bed hydraulic conductivity (m/sec) (in AWRA‐R v5.0, this value is derived from the
hydraulic conductivity value of AWRA‐L v5.0 soil layer).
xrivw = width of the river (m). This is obtained from flow‐width relationship (αd*(streamflow)βd, where
αd: river depth alpha, βd: river depth beta]. It is the median width of all the gauging stations available
within the catchment.

28 | AWRA‐R version 5.0 Technical Report
hrivw = depth of river water (m). Used from observed data if available, otherwise, obtained from flow‐
depth relationship. It is the median depth at all the gauging stations available within the catchment.
2.2.11 HEADWATER CATCHMENT MODELLING
This method is designed to calculate some of the fluxes and stores in headwater (HW) catchments in AWRA‐
R v5.0 modelling.
As there is no upstream observed data in HW catchment, we can’t calibrate any AWRA‐R parameters (k, x,
lag, floodplain return flow coefficient, GW monod alpha, beta and overbank flow threshold) except the runoff
scaling factor for AWRA‐L runoff based on the observed d/s gauge flow. Instead, the following fluxes/stores
are back calculated using AWRA‐L runoff, PET and observed data (streamflow and water level).
Rainfall on river water surface
Evaporation from river water surface
River storage
Groundwater seepage from river
The first two items (rainfall and evaporation) are calculated using Equations 32 and 33. Where, water surface
area for a headwater catchment (ahw) for this calculation is obtained using the following equation.
0.5 / (52)
Where,
L: Length of stream in a headwater catchment (m)
Wd/s: width of river at downstream of a headwater catchment (m)
Equation 53 is used to estimate headwater catchment river reach water volume using the river depth alpha,
river depth beta, river area alpha and river area beta (these are adjusted to account for streams decreasing
in size as you go upstream). These parameters are derived from flow and water level data.
_ ∗ α ∗ / β ∗ β 1 (53)
Where,
: river area alpha
: river depth alpha
: river area beta
: river depth beta
D: river depth

AWRA‐R version 5.0 Technical Report | 29
The method used for modelling groundwater seepage from river in a headwater catchment is the same as
that used for residual river reaches (described in section 2.2.10) except that MONOD parameters are not
calibrated but taken from the immediate downstream reach.

30 | AWRA‐R version 5.0 Technical Report
3 Input and output variables and parameters and model parameterisation methods
3.1.1 INPUT AND OUTPUT VARIABLES AND PARAMETERS OF AWRA-R V5.0
The input data required for AWRA‐R v5.0 are of two categories: variables (time series) and parameters. Table
3.1 presents the time series variables and Table 3.2 presents the parameters, including the parameters that
are calibrated. In these tables, the inputs for the AWRA‐R irrigation model are not included as those are listed
in Hughes et al. (2014). Table 3.3 presents the list of outputs simulated by AWRA‐R v5.0. This list doesn’t
include the list of irrigation model outputs, which are listed in Hughes et al. (2014).
Table 3.1. Time series variables of AWRA-R v5.0
Temporal variable (symbol) Unit of input data Reference equation
Rainfall at river (P) mm/day Equation 32
Evaporation from river (E) mm/day Equation 33
Rainfall at floodplain (Pfp) mm/day Equation 36
Evaporation from floodplain (Efp) mm/day Equation 36
Irrigation diversion (Qd) m3/s Equations 1, 30
Irrigation return flow (Qirr) m3/s Equations 1, 31
Urban diversion (Qu) m3/s Equation 1
AWRA-L runoff (Qr) m3/s Equations 1, 4
Reservoir volume (S) m3 Equation 6
Reservoir area (a) m2 Equation 6
Depth to groundwater (dgw) m Equations 22, 45, 50
River water depth(hrivw) m Equations 49, 51
River water width (Xrivw) m Equation 49, 50, 51
Reservoir net diversion (Qnet_transfer) m3/s Equation 5
Other river diversion(Qsd) m3/s Equation 1
Inflow from each of the upstream nodes (Qu/s)
m3/s Equations 1 & 2
Rainfall at reservoir (Ps) mm/day Equation 6
Evaporation from reservoir (Es) mm/day Equation 6
Outflow at downstream nodes m3/s For calibration
Table 3.2. Parameters of AWRA-R v5.0 included the calibrated parameters
Parameter (symbol) Unit Reference equation
River area alpha (α) ‐ Equation 34
River area beta (β) ‐ Equation 34
Flood beta (Cfp) m‐1 Equation 39
Anabranch partition factor (Ca) ‐ Equation 35
Anabranch exponent(Ba) ‐ Equation 35
Total river length (L) m Equations 34, 43

AWRA‐R version 5.0 Technical Report | 31
Parameter (symbol) Unit Reference equation
River depth alpha (αd) ‐ Equation 49 (to determine hrivw)
River depth beta (βd) ‐ Equation 49 (to determine hrivw)
Overbank flow threshold (OT) [calibrated] m3/sec Equation 37
Floodplain surface layer conductivity (Kc) m/sec Equation 44
Aquifer specific yield (Sy) ‐ Equation 45
Aquifer hydraulic conductivity (Kaq) m/sec Equations 46, 51
Aquifer thickness (daq) m Equations 46, 51
Surface layer thickness (dc) m Equations 44, 49
Riverbed conductivity (Krivc) m/sec Equation 49
Area of residual catchment (A) m2 Equation 4
Length of reach inflow stream m Equation 34
Flood return flow coefficient (FR) [calibrated] ‐ Equation 41
Monod parameter (M1) [calibrated] m3/sec Equation 48
Monod parameter (M2) [calibrated] m3/sec Equation 48
Runoff correction factor (SF) [calibrated] ‐ Equation 4
Lag [calibrated] sec Equation 3
K [calibrated] sec Equation 3
X [calibrated] ‐ Equation 3
Table 3.3. AWRA-R v5.0 outputs
Variables (symbol) Unit Reference equation
Outflow ( / ) m3/sec Equation 1
Overbank flow (Qfp) m3/sec Equations 1, 37
Floodplain volume (Vfp) m3 Equation 42
Flood plain area (Afp) m2 Equations 39, 40
Flood plain return flow (Qfpr) m3/sec Equations 1, 41
River rainfall flux (Qp) m3/sec Equations 1, 32
River evaporation flux (Qe) m3/sec Equations 1, 33
Floodplain rainfall flux m3/sec Equation 36
Floodplain evaporation flux m3/sec Equation 36
Floodplain groundwater loss (GWRfp) m3/sec Equations 36, 43
River groundwater loss (Qgw) m3/sec Equations 1,
Anabranch loss (Qa) m3/sec Equations 1, 35
Reservoir rainfall flux m3/sec Equation 6
Reservoir evaporation flux m3/sec Equation 6
Reservoir contribution (Qs) m3/sec Equations 1, 5
River water volume m3
Floodplain groundwater max change storage (S) m2/sec Equation 43
Floodplain groundwater outflow (Q) m3/sec Equation 43
Floodplain groundwater max potential infiltration (I) m2/sec Equation 44
River groundwater max change storage (Sriv) m2/sec Equation 47, 50
River groundwater outflow (Qriv) m3/sec Equation 47, 51
river.groundwater.max.infiltration (Iriv) m2/sec Equation 49
River groundwater max monod loss (Qgwmond) m3/sec Equation 48

32 | AWRA‐R version 5.0 Technical Report
3.1.2 AWRA-R V5.0 PARAMETERISATION
AWRA‐Rv5.0 model has the following two auto‐calibration tools to calibrate model parameters of different
components.
1. Irrigation model calibration tool
2. River model calibration tools
Irrigation model calibration tool
AWRA‐R irrigation model is designed to produce a number of fluxes and stores related to irrigated area
connected to a model reach. For any reach with irrigation diversion, the irrigation model is calibrated first
using monthly diversion data and then, the simulated daily diversion time series from the calibrated irrigation
model is used to calibrate AWRA‐R parameters for the reach. The irrigation model has 2 calibration
parameters. The irrigation model calibration tool is used to calibrate those parameters against monthly
observed diversion data. The details of AWRA‐R irrigation model, the irrigation model calibration tool, and
the model application in the MDBA irrigation districts are described in the irrigation model report (Hughes et
al. 2014) and are not repeated here.
River model calibration tools
AWRA‐R model has 8 calibration parameters: Lag, K, x, OT, FR, M1, M2, SF.
Two calibration approaches have been developed for optimising reach‐level model parameters using user‐
defined objective functions. They are:
Reach‐by‐reach calibration
System calibration
Reach-by-reach calibration approach
This approach was first developed for AWRA‐R v3.0 and subsequently updated for AWRA‐R v4.0 and v4.5.
The reach‐by‐reach calibration approach used in the current version of AWRA‐R is the same as the earlier
version (v4.5) except the objective function. The objective function in AWRA‐R v4.5 is changed to the
following objective function (OF) to align it with the newly developed system calibration approach.
1∑
∑1
∑ ∑∑
(54)
Where,
= observed stream flow on day i,
= simulated streamflow on day i,
n= total number of days.
Following Coron et al. (2012), the objective function used a combination of square error applied to the square
root transform of flow and bias. The function is minimised in optimisation and a perfect goodness of fit will
return a score of 1. The higher the score the poorer the fit.

AWRA‐R version 5.0 Technical Report | 33
In this calibration approach, reach‐level model parameters for every reach are optimised at the downstream
main gauge of the reach in a cascading manner from upstream to downstream reaches using the Nelder‐
Mead optimiser (Nelder and Mead, 1965).Observed daily streamflow data at the downstream gauge
corresponding to the main stem outflow of the reach is used for parameter optimisation.
System calibration approach
The system calibration approach is newly designed and implemented for AWRA‐R v5.0. In this approach, all
model parameters for a region (consisting of multiple reaches) are optimised simultaneously using a system‐
wide global objective function and the Shuffled Complex Evolution (SCE) optimiser (Duan et al., 1992).There
are a number of advantages of the new approach, such as it allows to optimise parameters for multiple
reaches in a given region and it uses relative weights for calibrating nodes. In addition, a single regional
objective function can be easily combined with the objective function of AWRA‐L for the joint calibration of
AWRA‐R and AWRA‐L at a regional scale towards their integration from calibration through to operational
use in the future.
Due to high computational requirements for optimising a large set of parameters using SCE optimiser, in the
current version of system calibration, four of the eight reach parameters (FR, M1, M2, SF) are calibrated in
system calibration using the global objective function (GOF), the rest are obtained from initial reach‐by‐reach
calibration (Lag, K, x, OT).
(55)
∑ ,
∑ ∑ ,
(56)
Where,
m = total number of gauges for optimisation
wi = weight assigned for gauge i (refer to Equation 56). The sum of all weights of m gauges will be 1.
OFi = objective function for model parameter optimisation at any gauge i (shown in Equation 54)
Qj,i = Observed flow at gauge i on each day j.
nx = Total number of days for period of calibration.
This approach has been termed “utility" function (Cohon, 1978), and aims to improve goodness of fit at
observation points both individually and system‐wide.
The two calibration approaches are presented in detail in the companion report on AWRA‐R calibration
(Dutta et al., 2015).

34 | AWRA‐R version 5.0 Technical Report
4 Study Area and Data collation
4.1 Study Area
AWRA‐R v5.0 model was applied to 39 large catchments (with median catchment area > 15,000 km2) covering
seven regions with different climatic characteristics across Australia. The regions are: Carpentaria Coast (CC),
North East Coast (NEC), Pilbara‐Gascoyne (PG), Tasmania (TAS), Lake Eyre Basin (LEB), Murray‐Darling Basin
(MDB) and Tanami – Timor Sea Coast (TTSC). Table 4.1 presents the spatial density of AWRA‐R networks in
the selected catchments within the seven regions, which include 624 nodes covering a total contributing
catchment area of about 1.5 million km2. In addition, AWRA‐R v5.0 is being implemented in a number of
other national water accounting regions by the BoM. Figure 4.1 shows the geographic locations of the
modelled catchments. The spatial resolutions of node‐link networks in different catchments were based on
the number of available observed streamflow gauges, which varied significantly from catchment to
catchment.
Table 4.1. Number of reaches for different modelling regions in AWRA-R v5.0
Catchment (Region) Modelled area (km2)
Number of nodes
Average sub catchment area (km2)
Flinders (CC) 105872 22 4812
Gilbert (CC) 38679 23 1682
Lynd (CC) 4434 2 2217
Walsh (CC) 8468 2 4234
Wenlock (CC) 3209 2 1605
Bulloo (LEB) 27061 2 13531
Thomson (LEB) 75571 2 37785
BarwonDarling (MDB) 108151 19 6759
BorderRivers (MDB) 44190 35 1381
Campaspe (MDB) 3496 11 318
CondamineBalonne (MDB) 147288 36 4603
GoulburnBroken (MDB) 19907 34 603
Gwydir (MDB) 21602 27 900
Lachlan (MDB) 79002 45 2026
LoddonAvoca (MDB) 15140 34 459
MacquarieCastlereagh (MDB) 83671 58 1641
Moonie (MDB) 15424 3 5141
Mountlofty (MDB) 1475 13 113
Murray (MDB) 213363 80 3138
Murrumbidgee (MDB) 66054 58 1201
Namoi (MDB) 39793 30 1421
Ovens (MDB) 6242 17 367
Paroo (MDB) 36731 4 9183
Warrego (MDB) 53203 10 6650
Wimmera (MDB) 8523 19 473
Barron (NEC) 1938 3 646
Burnett (NEC) 5441 4 1360
Mary (NEC) 679 2 340

AWRA‐R version 5.0 Technical Report | 35
Catchment (Region) Modelled area (km2)
Number of nodes
Average sub catchment area (km2)
Nogoa (NEC) 27514 2 13757
Greenough (PG) 10793 3 3598
Leven (TAS) 470 2 235
Meander (TAS) 1018 2 509
SouthEsk (TAS) 3233 2 1616
Swan (TAS) 452 2 226
Adelaide (TTSC) 1013 2 507
Daly (TTSC) 40481 2 20240
Finniss (TTSC) 1136 2 568
Fitzroy (TTSC) 90939 6 15156
Lennard (TTSC) 1143 2 572
Out of the different modelled regions, the Murray‐Darling Basin (MDB) is the largest region with an area of
approximately 1 million km2. The MDB river system is a highly complex and mostly regulated system covering
four states (Queensland, New South Wales (NSW), Victoria and South Australia) and one territory (Australian
Capital Territory) (CSIRO, 2008). Out of all modelled regions, the MDB region has the best available data and
hence, the MDB was selected for the model calibration, validation and benchmarking. For the purpose of
AWRA‐R modelling, the entire MDB was divided into 18 contiguous regions based on the divisions used in
the Murray‐Darling Basin Sustainable Yields Project (CSIRO, 2008). These regions, namely Paroo, Warrego,
Condamine‐Balonne, Moonie, Border Rivers, Gwydir, Namoi, Macquarie‐Castlereagh, Barwon‐Darling,
Lachlan, Murrumbidgee, Murray, Ovens, Goulburn‐Broken, Campaspe, Loddon‐Avoca, Wimmera and Eastern
Mount Lofty Ranges, are primarily the drainage basins of the Murray and the Darling rivers and their
tributaries (Figure 4.2). All 18 regions are included in AWRA‐Rv5.0 model. Within the MDB, the irrigated areas
are mainly located within Condamine‐Balonne, Border Rivers, Gwydir, Namoi, Barwon Darling, Macquarie
Castlereagh, Lachlan, Murrumbidgee, Murray, Goulburn‐Broken and Loddon‐Avoca.
Figure 4.1.Map showing coverage of AWRA-R v5.0 modelling regions (MDB and other NWA modelling regions are highlighted in the map)

36 | AWRA‐R version 5.0 Technical Report
Figure 4.2. Map showing different modelling regions within the Murray-Darling Basin
4.2 Data collation
4.2.1 CATCHMENT BOUNDARIES AND NODE-LINK NETWORK
The locations of the streamflow gauges and the stream network were used to define the node‐link setup and
contributing local catchment areas. The locations of streamflow gauges and cross‐section data at gauging
nodes were obtained from HYDSTRA databases, and the location of storages from Geofabric databases. The
AWRA‐R v5.0 model in MDB included 171 headwater catchments, 275 non‐headwater (or, residual)
catchments and 33 large and medium size storages. The Australian Hydrological Geospatial Fabric (Geofabric)
version 2 (BoM, 2013), a specialised Geographic Information System, was used to define the catchment
boundaries for the selected gauges. In a number of areas with relatively flat terrain (particularly, in
floodplains), the catchment boundaries obtained from Geofabric were manually adjusted to align with the
stream network derived from Google Earth. The links (defining flow paths between nodes) were established
and their lengths were calculated using both Geofabric and Google Earth. Figure 4.3 shows the AWRA‐R v5.0
node‐link network for the MDB.

AWRA‐R version 5.0 Technical Report | 37
Figure 4.3. AWRA-R v5.0 node-link network for the Murray-Darling Basin
4.2.2 TEMPORAL DATA
The AWRA‐R v5.0 model in the MDB region included a total of 485 gauges and 33 large and medium size
storages. The characteristics of the modelled reaches within MDB are summarised in Appendix 1. The
streamflow gauges and storages were selected based on the data quality and duration of records available.
Daily time series of streamflow and water level data at the selected gauges and storage volume, area and
water level data at selected storages were provided by the Bureau of Meteorology. Gridded daily rainfall data
(at about 5 km spatial resolution) was obtained from the Bureau of Meteorology Australian Water Availability
Project (BAWAP) (Jones et al., 2009). Gridded daily time series of potential evaporation, ungauged runoff and
depth to groundwater (at about 5km spatial resolution) were calculated by AWRA‐L model (Viney et al., 2014)
and subsequently upscaled to catchment resolution by mapping cells to catchment polygons. Due to the
quality issue of the simulated depth to groundwater by AWRA‐L model, it was decided in consultation with
the BoM to use a fixed groundwater depth of 5m instead in AWRA‐R calibration. The irrigation diversion time
series were obtained from various responsible jurisdictional authorities such as NSW State Water
Corporation and Goulburn‐Murray Water. In many of the locations in NSW and Queensland, quality of

38 | AWRA‐R version 5.0 Technical Report
irrigation diversion data was very poor and duration of the data was very short. In those locations, the
simulated diversion by the jurisdictions’ calibrated river models (IQQM) were the only available data for the
model calibration. The details of the temporal data used in the irrigation model are presented in Hughes et
al. (2014).Urban diversion and water use for stock and domestic were not available. Similarly, there was no
data on urban diversion from reservoirs. Table 4.2summarises the sources of temporal data used in AWRA‐R
v5.0 modelling.
Table 4.2. Sources of Temporal data used in AWRA-R v5.0 modelling
Temporal data Data source for AWRA-R v5.0
Rainfall at river (Ps) BAWAP
Evaporation from river (Es) AWRA‐L
Rainfall at floodplain (Pfp) BAWAP
Evaporation from floodplain (Efp) AWRA‐L
Irrigation diversion (Qd) Jurisdiction authorities, IQQM
Urban diversion (Qu) Not available
AWRA-L runoff (Qr) AWRA‐L
Reservoir volume (S) BoM
Reservoir area (a) BoM
Depth to groundwater (dgw) Fixed at 5m
River water depth (hrivw) BoM
River water width (Xrivw) BoM
Reservoir net diversion (Qnet_transfer) Not available
Other river diversion Not available
Inflow at u/s node BoM
Rainfall at reservoir (Ps) BAWAP
Evaporation from reservoir (Es) BAWAP
Outflow at downstream nodes BoM
4.2.3 OTHER DATA
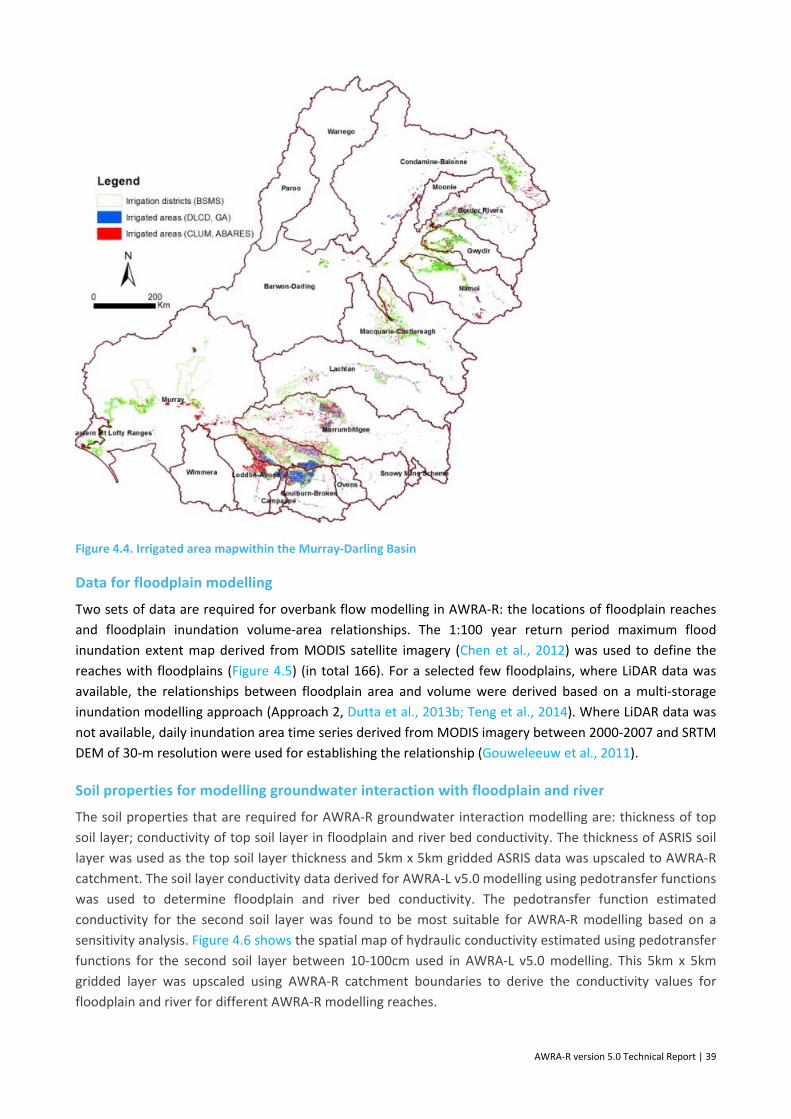
Data for irrigation modelling
The reaches with irrigation diversion (in total 58) were identified from the irrigated area maps derived from
the National Dynamic Land Cover Dataset of Australia (Lymburner et al., 2010), Catchment scale land use
data collected by the state partners of the Australian Collaborative Land Use and Management Program of
the Australian Bureau of Agricultural and Resource Economics and Sciences (ABARES, 2012) and the basin
irrigation and salinity mapping atlas produced by the Murray‐Darling Basin Commission (MDBC, 2002) (Figure
4.4). The crop types for different irrigated areas were obtained from the catchment scale land use data of
ABARES. The areas of on‐farm storages used for irrigation in different irrigation districts were derived from
the on‐farm storage area map obtained from satellite imagery (GA, 2007). Refer to Hughes et al. (2014) for
further details.
AWRA‐R version 5.0 Technical Report | 39
Figure 4.4. Irrigated area mapwithin the Murray-Darling Basin
Data for floodplain modelling
Two sets of data are required for overbank flow modelling in AWRA‐R: the locations of floodplain reaches
and floodplain inundation volume‐area relationships. The 1:100 year return period maximum flood
inundation extent map derived from MODIS satellite imagery (Chen et al., 2012) was used to define the
reaches with floodplains (Figure 4.5) (in total 166). For a selected few floodplains, where LiDAR data was
available, the relationships between floodplain area and volume were derived based on a multi‐storage
inundation modelling approach (Approach 2, Dutta et al., 2013b; Teng et al., 2014). Where LiDAR data was
not available, daily inundation area time series derived from MODIS imagery between 2000‐2007 and SRTM
DEM of 30‐m resolution were used for establishing the relationship (Gouweleeuw et al., 2011).
Soil properties for modelling groundwater interaction with floodplain and river
The soil properties that are required for AWRA‐R groundwater interaction modelling are: thickness of top
soil layer; conductivity of top soil layer in floodplain and river bed conductivity. The thickness of ASRIS soil
layer was used as the top soil layer thickness and 5km x 5km gridded ASRIS data was upscaled to AWRA‐R
catchment. The soil layer conductivity data derived for AWRA‐L v5.0 modelling using pedotransfer functions
was used to determine floodplain and river bed conductivity. The pedotransfer function estimated
conductivity for the second soil layer was found to be most suitable for AWRA‐R modelling based on a
sensitivity analysis. Figure 4.6 shows the spatial map of hydraulic conductivity estimated using pedotransfer
functions for the second soil layer between 10‐100cm used in AWRA‐L v5.0 modelling. This 5km x 5km
gridded layer was upscaled using AWRA‐R catchment boundaries to derive the conductivity values for
floodplain and river for different AWRA‐R modelling reaches.

40 | AWRA‐R version 5.0 Technical Report
Figure 4.5. 1:100 yr return period maximum inundation extent map for the Murray-Darling Basin
Figure 4.6. Saturated hydraulic conductivity of soil layer between 10-100 cm (from AWRA-L v5.0) (Unit of the values shown in the map: mm/day)

AWRA‐R version 5.0 Technical Report | 41
Aquifer properties for modelling groundwater interaction with floodplain and river
The aquifer properties that are required for surfacewater‐groundwater interaction modelling in AWRA‐R v5.0
are: aquifer conductivity, thickness and specific yield. These parameter values are derived from the aquifer
properties of AWRA‐L aquifer layer. The 5km x 5km gridded layers were upscaled using AWRA‐R catchment
boundaries to determine average values for AWRA‐R reach scale modelling.
River reach parameters
The parameters related to river reach are: river area alpha, river area beta, river length, river depth alpha
and river depth beta. River area alpha and beta are obtained by fitting a power law against the rating curve
at the streamflow gauges and uses cross‐section and river length data. Rating curve data for different
streamflow gauges were obtained from the BoM. In the case of having multiple gauges in a single catchment,
the median alpha and corresponding beta for all available gauging stations (u/s and d/s) is used for residual
reaches. However, for the headwater reaches alphas are scaled by 0.5 as there is only a d/s gauge and it is
assumed that headwater reaches narrows towards zero width at the start point of the river. River length was
derived from the spatial layer of the river network derived from Geofabric 2 and Google Earth. River depth
alpha and beta were derived from streamflow and water depth relationships.
Anabranch parameters
The parameters related to anabranch flow modelling are: the partition factor and exponent. These two
parameters are derived from the relationship derived from the gauged streamflow at the main stem and the
anabranch of an AWRA‐R catchment.
Table 4.3summarises the sources of different parameters used in AWRA‐R v5.0 modelling.
Table 4.3. Sources of parameter values used in AWRA-R v5.0 modelling
Parameter (symbol) Data Source
River area alpha (α) Derived from River cross section data from BoM
River area beta (β) Derived from River cross section data from BoM
Flood beta (Cfp) From MODIS flood map and SRTM DEM
Anabranch partition factor (Ca) Derived from streamflow data (BoM)
Anabranch exponent (Ba) Derived from streamflow data (BoM)
Total river length (L) GeoFabric 2.0 and Google Earth
River depth alpha Derived from Streamflow and water level data (BoM)
River depth beta Derived from Streamflow and water level data (BoM)
Floodplain surface layer conductivity (Kc) AWRA‐L
Aquifer specific yield (Sy) AWRA‐L
Aquifer hydraulic conductivity (Kaq) AWRA‐L
Aquifer thickness (daq) AWRA‐L
Surface layer thickness (dc) ASRIS
River bed conductivity (Krivc) AWRA‐L
Area of residual catchment GeoFabric 2.0 and Google Earth
Length of reach inflow stream GeoFabric 2.0 and Google Earth
Floodplain surface layer conductivity (Kc) AWRA‐L
Aquifer specific yield (Sy) AWRA‐L
Aquifer hydraulic conductivity (Kaq) AWRA‐L
Aquifer thickness (daq) AWRA‐L

42 | AWRA‐R version 5.0 Technical Report
Parameter (symbol) Data Source
Surface layerthickness (dc) ASRIS
River bed conductivity (Krivc) AWRA‐L

AWRA‐R version 5.0 Technical Report | 43
5 Model calibration, validation and benchmarking
Similar to previous versions (v3.5, v4.0 and v4.5), AWRA‐L v5.0 was first calibrated and then, AWRA‐Rv5.0
was calibrated using the simulated AWRA‐Lv5.0 outputs. The gridded input rainfall from AWRA‐L v5.0
(source: BAWAP) and simulated AWRA‐L v5.0 gridded runoff and PET daily timeseries were cookie‐cut to
produce AWRA‐R catchment average daily time series of runoff and PET as input data for AWRA‐R calibration
and validation. In addition, soil and aquifer property data were also obtained from AWRA‐L v5.0.
The AWRA‐R irrigation model was first calibrated independently using the available monthly diversion data
from multiple sources and then, the irrigation model inputs and parameters were used in AWRA‐R to
calibrate the parameters for the other components of the model using the observed daily stream flow data.
The calibration of the irrigation model is detailed in Hughes et al. (2014) and not repeated here. The
calibrated model outputs were benchmarked against data from both ground and satellite based observations
and the previous version (version 4.5) for evaluation of the model performance using the benchmarking
criteria set by the BoM as shown in Table 5.1.
Table 5.1. AWRA-R evaluation criteria
5.1 AWRA‐R v5.0 Calibration and validation
5.1.1 AWRA-R V5.0 REACH-BY-REACH CALIBRATION
The AWRA‐R v5.0 model was first calibrated using the reach‐by‐reach calibration approach and validated
against the observed streamflow data. Based on the lengths and quality of the streamflow data at the
selected gauges and climatic variability in the MDB region, the period of 1970‐1991, covering both wet and
dry climate, was selected for calibrating the AWRA‐R model. A more recent period of 1992‐2014 was selected
for validating the model. This period included the millennium drought in the MDB from 2000‐2009 (Kirby et
al., 2012), which was followed by an intense wet period (2010‐2013).In reach‐by‐reach calibration and
validation, the upstream inflows in a reach are gap‐filled with observed data where available.
Variable Assessed against Assessment
criteria
Comparison with
simulations from
alternative models
Performance threshold
Streamflow Gauged streamflow at ~430
sites (calibration
and validation)
Daily NSE Monthly NSE
Bias
IQQM (in
Murrumbidgee2)
Median Daily NSE > 0.5,
Median Monthly NSE > 0.7,
Median absolute bias < 20%
Irrigation
diversion
Observed diversion Monthly NSE
Bias Median monthly NSE > 0.45
Median absolute bias < 10%
Floodplain
inundation
extent
Satellite flooded extent
Inundation extent
correlation
Correlation > 0.6
ET from
irrigated area
Remotely sensed
ET
Long‐term
correlation
Similar to AWRA‐Rv4.0

44 | AWRA‐R version 5.0 Technical Report
The summary statistics (daily NSE and absolute bias in %) of the model performance during the calibration
and validation periods are presented in Figure 5.1 through to Figure 5.4. In the calibration, the model
performed reasonably well in all regions within the MDB with the median daily NSE of 0.60 as shown in Figure
5.2. The lowest median daily NSE was greater than 0.5. The model performance varied from region to region
with median daily NSE ranging between 0.54‐0.83. The model performed best in the Murray and worst in
Loddon Avoca, where quality of the observed streamflow data was poor with many missing data points. The
median values of annual bias during the calibration were very low (< 1%) for all modelled regions within the
MDB. The median bias was less than 5% for all sub‐regions except Barwon‐Darling as shown in Figure 5.3.
The calibrated model performed very well under the validation mode with the median daily NSE of 0.69 for
all modelled regions within the MDB. Between the regions, the daily median NSE varied between 0.39‐0.83
with the highest value in Murray and worst in Loddon Avoca as shown in Figure 5.2. This was consistent with
the results obtained under the calibration mode. In the validation, the median value of annual bias was 16%
for all modelled regions within the MDB (Figure 5.4), which was relatively higher than the calibration period.
Similar was the case for different regions within the MDB where the median values of annual bias varied
between 4‐30% except for four sub‐regions (Campaspe, EMLR, Lachlan and Wimmera) with bias of over 30%.
The highest value of bias was in Campaspe (38%) and lowest in Goulburn (4%).
Figure 5.1. Boxplots of daily NSE for different regions within MDB in calibration (period: 1970-1991) of AWRA-R v5.0
Figure 5.2. Boxplots of daily NSE for different regions within MDB in validation (period: 1992-2014) of AWRA-R v5.0
0
0.1
0.2
0.3
0.4
0.5
0.6
0.7
0.8
0.9
1
Daily NSE (calib
ration m
ode)
0
0.1
0.2
0.3
0.4
0.5
0.6
0.7
0.8
0.9
1
Daily NSE (valid
ation m
ode)

AWRA‐R version 5.0 Technical Report | 45
Figure 5.3. Boxplots of annual bias for different regions within MDB during the calibration (period: 1970-1991) of AWRA-R v5.0 model
Figure 5.4. Boxplots of annual bias for different regions within MDB during the validation (period: 1992-2014) of AWRA-R v5.0 model
Table 5.2 presents the long term mass balance error during the calibration and validation periods for different
sub‐regions within the MDB. The annual mass balance error for each modelled sub‐catchment was calculated
using Equation 1 and then, added to obtain the total annual average mass balance error for each sub‐region.
The annual average mass balance error was negligible for all sub‐regions (<1%) during the calibration period
and the error was similar for the validation period for most of the sub‐regions except for Campaspe and
Goulburn‐Broken regions. The mass balance errors in these two sub‐regions were also below 4%.
Table 5.2. Long term mass balance in different sub-regions within the MDB during the calibration and validation periods
Sub-region (within MDB)
Annual average mass balance error (%)
During calibration (1971-1991) During validation (1992-2014)
Barwon-Darling 0.00% 0.10%
Border Rivers 0.00% 0.80%
0%
10%
20%
30%
40%
50%
60%
70%
80%
90%Absolute bias NSE (calib
ration m
ode)
0%
10%
20%
30%
40%
50%
60%
70%
80%
90%
100%
Absolute bias (validation m
ode)

46 | AWRA‐R version 5.0 Technical Report
Sub-region (within MDB)
Annual average mass balance error (%)
During calibration (1971-1991) During validation (1992-2014)
Campaspe 0.60% 3.50%
Condamine-Balonne 0.00% 0.00%
Eastern Mount Lofty Range 0.00% 0.00%
Goulburn-Broken 0.30% 2.30%
Gwydir 0.10% 0.50%
Lachlan 0.60% 1.40%
Loddon-Avoca 0.20% 1.10%
Macquarie-Castlereagh 0.00% 1.50%
Moonie 0.00% 0.00%
Murray 0.10% 0.30%
Murrumbidgee 0.00% 0.50%
Namoi 0.30% 0.60%
Ovens 0.00% 0.00%
Paroo 0.00% 0.00%
Warrego 0.00% 0.00%
Wimmera 0.00% 0.00%
EMLR 0.00% 0.00%
5.1.2 AWRA-R V5.0 SYSTEM CALIBRATION
In the reach‐by‐reach calibration, the upstream inflows in a reach are gap‐filled with observed streamflow
data. The system calibration was first undertaken for all regions within the MDB with simulated inflows
without gap‐filling with available observed inflows. The system calibration was undertaken for each reach
from upstream to downstream with the transfer of simulated inflow from upstream boundaries for any
downstream region. Several large regions were sub‐divided into two or three sub‐regions to handle the
computational time. In the case of sub‐regions, the uppermost sub‐region was first calibrated and then, the
boundary condition was set for calibration of the lower sub‐region using the simulated flow from the upper
region. In a number of selected regions, system calibration was also undertaken with gap‐filled simulated
data (where simulated streamflow was replaced with observed available data).
Figure 5.5 presents the system calibration performance statistics for entire MDB together with a comparison
with reach‐by‐reach calibration statistics. For a fair comparison, reach‐by‐reach calibration was repeated
with simulated inflow without gap‐filling with observed data. The figure includes the performance statistics
of reach‐by‐reach calibration with and without gap‐filled (or patched) simulated data. Overall, the
performance of the system calibration is lower than reach‐by‐reach calibration with patched inflow as it is
obvious that better model performance has achieved with patched inflow in the MDB when high quality
observed streamflow data is available. However, the model with system calibration showed better
performance than reach‐by‐reach calibration without patched inflow data.
Figure 5.6 presents the statistics of model performance in the Campaspe region with both system calibration
and reach‐by‐reach calibration with and without patched inflow. Similar to the entire MDB results, the model
performed better with reach‐by‐reach calibration with patched inflow. The system calibration without
patched inflow performed better than the reach‐by‐reach calibration without patched inflow. The
performance of the system calibration with patched inflow was very close to the performance of reach‐by‐
reach with patched inflow.

AWRA‐R version 5.0 Technical Report | 47
Figure 5.5. Summary statistics for system calibration and comparison with that from reach-by-reach calibration for the MDB
Figure 5.6. Summary statistics for system calibration and comparison with that from reach-by-reach calibration for Campaspe

48 | AWRA‐R version 5.0 Technical Report
The computational time of system calibration is significantly higher than reach‐by‐reach calibration. It took
about 12 hours in a standard desktop computer to optimise model parameters by using reach‐by‐reach auto‐
calibration tool for the period of 1970‐2014. However, it took more than 3 days for parameter optimisation
using the system calibration tool in several sub‐regions within the MDB as shown in Table 5.3.
Table 5.3. Computational time for system calibration in different regions/sub-regions within the MDB
Region Run time (days)
Condamine-Balonne (upper) 0.3
Condamine-Balonne (lower) 1.5
Border 2.5
Gwydir 2.9
Lachlan (upper) 0.2
Lachlan (lower) 3.4
Murrumbidgee (upper) 0.5
Murrumbidgee (lower) 3.7
Goulburn-Broken 1.4
Loddon-Avoca 3.9
Murray (upper) 3.8
5.2 Benchmarking of AWRA‐R v5.0 model
Benchmarking is undertaken for AWRA‐R v5.0 against observed data from ground based and remotely sensed
observed data as well as against the results of the previous version of the model (AWRA‐R v4.5). AWRA‐R
v5.0 results with the calibrated parameters obtained from reach‐by‐reach calibration were used for
benchmarking. The model performance was evaluated based on the agreed performance threshold as shown
in Table 5.1 for simulated streamflow, irrigation diversion, crop water ET by AWRA‐R v5.0 and the simulated
floodplain inundation extent modelled by Approach 2 (Teng et al., 2014).
Streamflow
Figure 5.7 presents the performance statistics of AWRA‐R v5.0 for the MDB and compared that with
performance of AWRA‐Rv4.5. The results show that the performance of AWRA‐R v5.0 is slightly better than
AWRA‐Rv4.5 in terms of daily and monthly NSE. The annual bias is similar for the two versions. The median
values of daily NSE, monthly NSE and absolute bias of AWRA‐R v5.0 are well above the performance threshold
set by the BoM.
In addition, benchmarking report cards were prepared for each modelled reach and region using AWRA‐R
benchmarking scripts for overall model performance evaluation. A sample of a reach level benchmarking
report card is shown in Figure 5.8. Region level report cards for different regions of the MDB are included in
Appendix 2.
It was planned to also undertake benchmarking of AWRA‐R simulated streamflow against the results of other
similar river system models (such as IQQM model). However, there was a significant delay in getting any such
data by the BoM from the responsible organisations and hence, it was not possible to complete this task.

AWRA‐R version 5.0 Technical Report | 49
Figure 5.7. Comparison of AWRA-R v5.0 model performance against AWRA-R v4.5 for all model reaches in within MDB
Irrigation diversion
The benchmarking of the AWRA‐R irrigation model against diversion data is presented in Hughes et al. (2014)
and not repeated here. Figure 5.9 shows the overall performance of the model against available monthly
diversion data in 31 modelled reaches. The median monthly NSE and median annual bias of the model
performance are above the performance threshold set by BoM for the irrigation model.
Floodplain inundation extent (Approach 2)
The detailed benchmarking of Approach 2 floodplain inundation model results for Murrumbidgee and Murray
floodplain reaches are reported in Teng et al. (2014). Here, the results of those two regions and newly
modelled Macquarie, Barwon‐Darling and Gwydir and are summarised in Table 5.4. The cell‐to‐cell
correlation between simulated inundation maps and flood maps derived from Landsat imagery was above
the threshold value 0.6 in most of the modelled reaches.

50 | AWRA‐R version 5.0 Technical Report
Figure 5.8. An example of a reach-level AWRA-R v5.0 benchmarking report card

AWRA‐R version 5.0 Technical Report | 51
Figure 5.9. Summary of performance of the calibrated AWRA-R irrigation model in 31 irrigation reaches within MDB
Table 5.4. Performance of AWRA-R floodplain inundation model (approach 2) against Landsat flood maps
Reach Region Inundation volume-area
relationship R2 Cell-to-cell correlation with Landsat flood map
421090_421022 Macquarie y = 1.3372x 0.99 0.61
421147_421135 Macquarie y = 1.8687x 0.97 0.75
425039_425003 Barwon‐Darling y = 0.4408x 0.96 0.61
425003_425004 Barwon‐Darling y = 0.4039x 0.93 0.69
418004_418063 Gwydir y = 0.9507x 0.82 n/a
418063_418053 Gwydir y = 2.7301x 0.94 n/a
418053_418078 Gwydir y = 2.4555x 0.87 n/a
418076_418079 Gwydir y = 1.1715x 0.84 n/a
410002_410136 Murrumbidgee y = 0.4599x 0.99 0.95
410005_410078 Murrumbidgee y = 0.4623x 0.88 0.86
410023_410005 Murrumbidgee y = 0.361x 0.81 0.59
410040_410041 Murrumbidgee y = 1.0265x 0.98 0.49
410041_410130 Murrumbidgee y = 0.7766x 0.99 0.93
410078_410002 Murrumbidgee y = 0.4471x 0.98 0.99
410136_410040 Murrumbidgee y = 1.2695x 0.74 0.60
409026_409202 Murray y = 0.3673x 0.94 n/a

52 | AWRA‐R version 5.0 Technical Report
Reach Region Inundation volume-area
relationship R2 Cell-to-cell correlation with Landsat flood map
409202_409006 Murray y = 0.657x 0.86 n/a
409006_409215 Murray y = 0.9068x 0.89 n/a
409207_409005 Murray y = 0.6646x 0.85 n/a
409005_409204 Murray y = 0.6646x 0.85 n/a
409204_409235 Murray y = 0.2575x 0.70 0.60
409235_414200 Murray y = 0.4203x 0.99 0.51
414200_414201 Murray y = 0.3715x 0.90 0.85
414201_414203 Murray y = 0.4952x 0.92 0.62
414207_414204 Murray y = 0.477x 0.98 0.93
414204_414210 Murray y = 0.3292x 0.96 0.83
414210_425010 Murray y = 0.3893x 0.96 0.73
(n/a: the results of the floodplain model could not be compared with Landsat flood map due to non‐availability of high quality Landsat data for the area during large flood events.)
ET from Irrigated area
The CMRSET product, which provides estimates of actual evapotranspiration (ET) derived from MODIS
reflectance and short wave infra‐red data and grid (Guerschman et al., 2009), was also used to benchmark
the simulated ET from the AWRA‐R irrigation model. Gridded 8‐day composite ET from CMRSET was obtained
from the BoM (reference: http://dapds00.nci.org.au/thredds/catalog/u39/wirada/cmrset/catalog.html) for
the period of 2000‐2013. The 8‐day data were resampled to monthly resolution and then, spatially averaged
for different irrigated areas associated with AWRA‐R irrigation reaches for benchmarking. Figure 5.10
presents the summary of correlation between the simulated ET by AWRA‐R irrigation model and ET from
CMRSET for all modelled reaches within the MDB for the period of 2000‐2013. The median correlation
coefficient is reasonable (> 0.5) for the MDB including different irrigated areas in North and South. The spatial
variation in correlation in different irrigated areas within MDB is shown in Figure 5.11.
Figure 5.10. Comparison of AWRA-R simulated ET against monthly ET from CMRSET product for the period of 2000-2013.

AWRA‐R version 5.0 Technical Report | 53
Figure 5.11. Spatial variation in correlations between simulated ET by AWRA-R irrigation model and CMRSET at monthly scale (for the period of 2000-2013). The yellow circles represent the correlations with larger circle representing higher correlation and smaller circle representing lower correlations.
This is the first time ET from AWRA‐R irrigation model has been benchmarked against the ET derived from
remotely sensed CMRSET product.

54 | AWRA‐R version 5.0 Technical Report
6 Conclusions and Recommendations
6.1 Summary
The core objective of the AWRA‐R model is to produce various fluxes and stores associated with river systems
in regulated and unregulated systems to support the production of the national water accounts (NWA) by
the BoM. The research and development of AWRA‐R model started in FY2011‐12 (Lerat et al., 2012) as part
of WIRADA and since then four different versions of AWRA‐R [versions 3.0 (Lerat et al., 2013), 4.0, 4.5 and
5.0] have been developed, tested and implemented until end of this FY. The latest version (AWRA‐R v5.0) has
been operationalised at the BoM in March 2015. This report describes the technical details of AWRA‐R v5.0
model, its calibration and validation in the MDB and benchmarking of the model results from different
components against various available data.
The background and objectives of the AWRA‐R modelling are discussed in section 1. The technical details of
different components of AWRA‐R v5.0 and their governing equations are presented in section 2. The
improvements/changes in AWRA‐R over the period of the development since 2011 are also summarised in
this section. A large amount of spatial and temporal data are required for AWRA‐R modelling. The list of all
input temporal variables, spatial and other parameters are listed in section 3 with the reference to
appropriate governing equations presented in section 2. The model has eight calibration parameters, which
are listed in section 3. The two calibration approaches (reach‐by‐reach and system calibration) used for
model parameterisation are also described in this section. The system calibration approach has been newly
developed and implemented in AWRA‐R v5.0.
AWRA‐R v5.0 model has been calibrated and validated in the MDB using both the reach‐by‐reach and system
calibration approaches. Section 4 presents the collation of input data for the application of the model in the
MDB. The AWRA‐R v5.0 model in the MDB region included a total of 485 gauges and 33 large and medium
size storages. The characteristics of the modelled reaches within MDB are summarised in Appendix 1.
The results of the model calibration and validation against the observed daily streamflow data are presented
in section 5. A comprehensive benchmarking of AWRA‐R v5.0 results was undertaken using available data
from ground based and remotely sensed observed as well as the results of the earlier version of the model.
The results of benchmarking are also presented in this section. A set of benchmarking scripts have been
prepared to benchmarking AWRA‐R results in both reach and regional scales for comprehensive
understanding of the model performance and water balance. This is briefly discussed in this section and the
regional scale benchmarking plots are included in Appendix 2.
6.2 Conclusions
The results of the reach‐by‐reach calibration and validation of the model in the MDB show highly satisfactory
performance of the model with median daily NSE of 0.60 and median annual bias of less than 1% for the
period of calibration (1970‐1991) and median daily NSE of 0.69 and median annual bias of 16%for validation
period (1992‐2014) for the MDB. Within the MDB region, median daily NSE varied between 0.54‐0.83 in 18
different sub‐regions under the calibration mode and the variation of median daily NSE was between 0.39‐
0.83 in the same 18 sub‐regions under the validation mode. The model performed best in the Murray

AWRA‐R version 5.0 Technical Report | 55
catchment and worst in Loddon Avoca, where the quality of the observed stream data was poor with many
missing data points. The mass balance error of the AWRA‐R model was negligible.
Overall, the performance of the system calibration in the MDB is poorer than the reach‐by‐reach calibration
with patched inflow as it is obvious to have better model performance with patched inflow in the MDB with
high quality observed streamflow data. However, the model with the system calibration showed better
performance than the reach‐by‐reach calibration without patched inflow data. This shows that the system
calibration is better suited for any predictive analysis by AWRA‐R without observed data. The application of
the system calibration with patched inflow in Campaspe region shows that the model performance with the
system calibration is similar to that with the reach‐by‐reach calibration. It is important to note that the
computational time of the system calibration is quite large compared to the reach‐by‐reach calibration.
The benchmarking results show that the overall performance of AWRA‐Rv5.0 (with calibrated parameters
from reach‐by‐reach calibration) is slightly better than AWRA‐Rv4.5.The median monthly NSE of the AWRA‐
R irrigation model performance are reasonable and median annual bias was very low. The simulated ET by
AWRA‐R irrigation model shows good correlation (> 0.5) with the actual ET from CMRSET product at monthly
scale. The simulated inundation maps by Approach 2 inundation model show reasonably high cell‐to‐cell
correlation (>0.6) with the flood maps derived from Landsat imagery for most of the modelled reaches in
different floodplains across the MDB. Overall, the performance of different components of AWRA‐R v5.0
model satisfies the performance evaluation criteria set by BoM.
The AWRA‐R v5.0 model produces a large number of fluxes and stores for surface water accounts. This
quantitative information provides a detailed understanding of major components of water balances at a
reach level for water resources accounting, analyses and reporting purposes.
6.3 Recommendations
Based on the performance statistics of the AWRA‐R v5.0 model in the MDB with the reach‐by‐reach and
system calibration and computational efficiency, it is recommended that the reach‐by‐reach calibration with
the patched flow is the best suitable method for retrospective modelling with patched flow.
For a predictive modelling, where observed data are not available, the system calibration is the most suitable
approach for AWRA‐R model calibration.

56 | AWRA‐R version 5.0 Technical Report
Reference
ABARES (2012), Cropping calendars for natural resource management regions of Australia 2010 – August 2012– User Guide, Australian Bureau of Agricultural and Resource Economics and Sciences, Canberra. Available at: http://adl.brs.gov.au/landuse/docs/CropCalendars2010.zip. Last accessed 18 February 2014.
BoM (2012). The Water Act 2007 and Water Regulations 2008, InfoSheet 2, the Bureau of Meteorology, Australian Government, http://www.bom.gov.au/water/about/publications/document/InfoSheet_2.pdf
BoM (2013). Australian Hydrological Geospatial Fabric (Geofabric), The Bureau of Meteorology, Australian Government. http://www.bom.gov.au/water/geofabric/
BoM & CSIRO (2013). Water Information Research and Development Alliance ANNUAL REPORT 2012–13, the Bureau of Meteorology and CSIRO, 28p.
Chen Y, Cuddy SM, Merrin LE, Huang C, Pollock D, Sims N, Wang B, Bai Q (2012). Murray‐Darling Basin Floodplain Inundation Model Version 2.0 (MDB‐FIM2), Technical report. CSIRO Water for a Healthy Country Flagship, Australia.
Cohon JI (1978). Multiobjective Programming and Planning. Academic Press, New York, USA.
Coron L, Andréassian V, Perrin C, Lerat J, Vaze J, Bourqui M, Hendrickx F(2012). Crash testing hydrological models in contrasted climate conditions: An experiment on 216 Australian catchments, Water Resources Research 48, W05552, Doi:10.1029/2011WR011721.
CSIRO (2008). Water availability in the Murray‐Darling Basin. A report to the Australian Government from the CSIRO Murray‐Darling Basin Sustainable Yields Project. CSIRO, Australia.
Doble R, Crosbie R, Peeters L, Joehnk K, Ticehurst C (2014). Modelling overbank flood recharge at a continental scale, Hydrol. Earth Syst. Sci., 18:1273–1288.
Duan QD, Sorooshian S, Gupta VK (1992). Effective and efficient global optimisation for conceptual rainfall‐runoff models. Water Resources Research, 28 (4):1015‐1031.
Dutta D, Wilson K, Welsh W, Nicholls D, Kim S, Cetin L (2013a). A New Modelling System for River Operations with a Case Study from the Goulburn River, Australia, Journal of Environmental Management, 121:13‐28.
Dutta D, Teng J, Vaze J, Lerat J, Hughes J and Kim S (2013b). Development and implementation of AWRA‐R flood inundation module. CSIRO Water for a Healthy Country Flagship, Australia. 69 pages.
Dutta D, Kim S, Hughes J, Yang A, Vaze J (2015). AWRA‐R version 5.0 Calibration Tools, CSIRO Land and Water Flgaship, 40 pages, Australia (under review).
GA (2007). Man‐made hydrology GIS coverage, Geoscience Australia.
Gouweleeuw B, Ticehurst C, Thew P (2011). Surface water volume estimation in support of water accounting. CSIRO.
Guerschman JP, van Dijk AIJM, Mattersdorf G, Beringer J, Hutley LB, Leuning R, Pipunic RC, Sherman BS (2009), Scaling of potential evapotranspiration with MODIS data reproduces flux observations and catchment water balance observations across Australia. Journal of Hydrology, 369, 107‐119.
Hughes J, Dutta D, Yang A, Marvanek S, Vaze J, Mainuddin M (2014). Improvement of AWRA‐R Irrigation Model and its Applications in the Murray‐Darling Basin, CSIRO Water for a Healthy Country Flagship, Australia, 44 pages.

AWRA‐R version 5.0 Technical Report | 57
Jones D, Wang W, Fawcett R (2009). High‐quality spatial climate data‐sets for Australia. Australian Meteorology Magazine, 58, 233–248.
Kirby M, Connor J, Bark R, Qureshi E, Keyworth S (2012). The economic impact of water reductions during the Millennium Drought in the Murray‐Darling Basin, 56th AARES annual conference, Fremantle, Western Australia, February 7‐10, 2012.
Koussis AD (1980). Comparison of Muskingum method difference scheme. Journal of Hydraulic Division, ASCE 106 (5), 925‐929.
Lerat J, Paydar Z, Pena‐Arancibia J, Dawes W (2012). Development and evaluation of the AWRA‐R model, CSIRO: Water for a Healthy Country National Research Flagship, 114 pages.
Lerat J, Dutta D, Kim S, Hughes J, Vaze J and Dawes W (2013). Refinement and extension of the AWRA‐R model, CSIRO: Water for a Healthy Country National Research Flagship, 58 pages.
Lymburner L, Tan P, Mueller N, Thackway R, Lewis A, Thankappan M, Randall L, Islam A, Senarath U (2010). 250 metre Dynamic Land Cover Dataset of Australia (1st Edition), Geoscience Australia, Canberra.
MDBC (2002). Basin irrigation and salinity mapping atlas of data, Murray‐Darling Basin Commission (2002) (dataset is cited in http://www.mdba.gov.au/sites/default/files/archived/mdbc‐salinity‐reports/2066_BSMS%202003‐04.pdf)
Nelder JA and Mead R (1965). A simplex method for function minimization. Computer Journal 7, 308–313.
Teng J, Dutta D, Vaze J, Marvanek S, Ticehurst C (2014). Improvement of AWRA‐R Floodplain Inundation Model and its Applications in the Southern Murray‐Darling Basin, CSIRO Water for a Healthy Country Flagship, Australia, 47 pages.
Van Dijk AIJM, Crosbie R, Stenson M, Frost A, Renzullo JLL, Barratt D, Bacon D, Daamen C, Fitch P, Guerschman J‐P, Henderson B, Herron N, King E, McVicar T, Minty L, Paydar Z, Smith A and Viney N (2012). The Australian water resources assessment system. CSIRO: Water for a Healthy Country National Research Flagship.
Vaze J, N Viney, Stenson M, Renzullo L, Van Dijk A, Dutta D, Crosbie R, Lerat J, Penton D, Vleeshouwer J, Peeters L, Teng J, Kim S, Hughes J, Dawes W, Zhang Y, Leighton B, Frost A, Elmahdi A, Smith A, Daamen C, Argent R (2013). The Australian Water Resource Assessment System (AWRA), Proceedings of the 20th International Congress on Modelling and Simulation, Adelaide, Australia, 1–6 December 2013, 3015‐3021.
Viney N, Vaze J, Crosbie R, Wang B, Dawes W, Frost A (2014). AWRA‐L v4.5: Technical description of model algorithms and inputs. 76 pages, CSIRO, Australia.
Welsh WD, Vaze J, Dutta D, Rassam D, Rahman JM, Jolly ID, Wallbrink P, Podger GM, Bethune M, Hardy MJ, Teng J, Lerat J (2013). An integrated modelling framework for regulated river systems, Environmental Modelling & Software 39:81‐102.

58 | AWRA‐R version 5.0 Technical Report
Appendix 1: Summary of node-link network of AWRA-R v5.0 model built for the MDB
Reach ID Name of main outlet Region ID(s) of inflow
node(s)
ID(s) of outflow node(s)
Has Reservoir?
Has floodplain?
Has irrigation diversion?
Headwater catchment?
422001 Barwon@Dangar Br (Walgett) MDB‐BarwonDarling 422003‐419091‐
422018 422001 TRUE TRUE
422002 Barwon at Brewarrina MDB‐BarwonDarling 422027‐421107 422002‐422007 TRUE TRUE
422003 Barwon@Collarenebri MDB‐BarwonDarling 422004‐418055 422003‐422018 TRUE TRUE
422026 Barwon @ Boorooma MDB‐BarwonDarling 422001 422026 TRUE TRUE
422027 Barwon @ Geera MDB‐BarwonDarling 422026‐421011‐421012‐420020 422027 TRUE TRUE
422028 Barwon @ Beemery MDB‐BarwonDarling 422005‐422007‐
422002 422028 TRUE TRUE
425003 Darling@Bourke Town MDB‐BarwonDarling 425039‐421023‐
422022 425003 TRUE TRUE
425004 Darling@Louth MDB‐BarwonDarling 425003‐423001‐
423002 425004 TRUE TRUE
425002 Darling River @ Wilcannia Total
Flow MDB‐BarwonDarling 425008 425002
425008 Darling@Wilcannia Main Channel MDB‐BarwonDarling 425900 425008‐425018 TRUE
416050 Barwon U/S Presbury MDB‐BarwonDarling 416001 416050 TRUE
422004 Barwon at MogilMogil MDB‐BarwonDarling 416050‐416052‐417001‐416028 422004 TRUE
416052 Gil Gil @ Galloway MDB‐BarwonDarling 416027 416052 TRUE
422022 Tarrion @ Brewarrina MDB‐BarwonDarling 422022 TRUE TRUE
425039 Darling @ Warraweena MDB‐BarwonDarling 422028‐422006 425039 TRUE
425900 Darling @ Tilpa MDB‐BarwonDarling 425004 425900 TRUE
416001 Barwon@Mungindi MDB‐BorderRivers 416048‐416202 416001 TRUE TRUE
416043 Macintyre @ Boomi weir MDB‐BorderRivers 416203‐416047 416043‐416037 TRUE TRUE
416048 Macintrye@Kanowna MDB‐BorderRivers 416043 416048 TRUE TRUE
416201 Macintyre@Goondiwindi MDB‐BorderRivers 416002 416201 TRUE
416006 Severn@Ashford MDB‐BorderRivers 416019‐416021 416006
416007 Dumaresq@Bonshaw Weir MDB‐BorderRivers 416011‐416008 416007
416008 Beardy @ Haystack MDB‐BorderRivers 416008 TRUE
416011 Dumaresq@Roseneath MDB‐BorderRivers 416309‐416310‐
416032 416011
416018 Macintyre @ Dam site MDB‐BorderRivers 416006‐416010 416018
416020 Ottleys @ Coolatai MDB‐BorderRivers 416020 TRUE
416021 Frasers Ck @ Westholme MDB‐BorderRivers 416021 TRUE
416032 Mole @ Donaldson MDB‐BorderRivers 416032 TRUE
416036 Campbells Creek @ Near Beebo MDB‐BorderRivers 416036 TRUE
416040 Dumaresq @ Glenarbon MDB‐BorderRivers 416049‐416305 416040
416049 Dumaresq @ Bonshaw MDB‐BorderRivers 416007‐416312 416049
416305 Brush Creek @ Beebo MDB‐BorderRivers 416305 TRUE
416310 Dumaresq@Farnbro MDB‐BorderRivers 416310 TRUE
416312 Oaky Creek @ Texas MDB‐BorderRivers 416312 TRUE
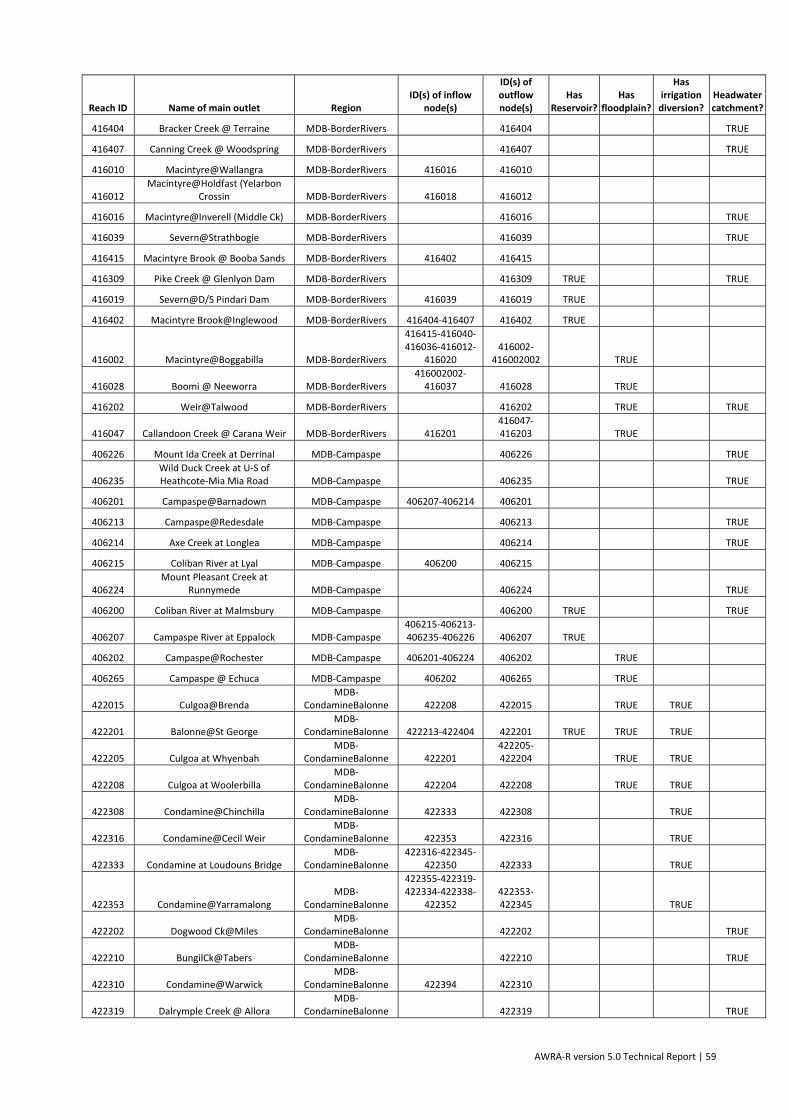
AWRA‐R version 5.0 Technical Report | 59
Reach ID Name of main outlet Region ID(s) of inflow
node(s)
ID(s) of outflow node(s)
Has Reservoir?
Has floodplain?
Has irrigation diversion?
Headwater catchment?
416404 Bracker Creek @ Terraine MDB‐BorderRivers 416404 TRUE
416407 Canning Creek @ Woodspring MDB‐BorderRivers 416407 TRUE
416010 Macintyre@Wallangra MDB‐BorderRivers 416016 416010
416012 Macintyre@Holdfast (Yelarbon
Crossin MDB‐BorderRivers 416018 416012
416016 Macintyre@Inverell (Middle Ck) MDB‐BorderRivers 416016 TRUE
416039 Severn@Strathbogie MDB‐BorderRivers 416039 TRUE
416415 Macintyre Brook @ Booba Sands MDB‐BorderRivers 416402 416415
416309 Pike Creek @ Glenlyon Dam MDB‐BorderRivers 416309 TRUE TRUE
416019 Severn@D/S Pindari Dam MDB‐BorderRivers 416039 416019 TRUE
416402 Macintyre Brook@Inglewood MDB‐BorderRivers 416404‐416407 416402 TRUE
416002 Macintyre@Boggabilla MDB‐BorderRivers
416415‐416040‐416036‐416012‐
416020 416002‐
416002002 TRUE
416028 Boomi @ Neeworra MDB‐BorderRivers 416002002‐416037 416028 TRUE
416202 Weir@Talwood MDB‐BorderRivers 416202 TRUE TRUE
416047 Callandoon Creek @ Carana Weir MDB‐BorderRivers 416201 416047‐416203 TRUE
406226 Mount Ida Creek at Derrinal MDB‐Campaspe 406226 TRUE
406235 Wild Duck Creek at U‐S of Heathcote‐Mia Mia Road MDB‐Campaspe 406235 TRUE
406201 Campaspe@Barnadown MDB‐Campaspe 406207‐406214 406201
406213 Campaspe@Redesdale MDB‐Campaspe 406213 TRUE
406214 Axe Creek at Longlea MDB‐Campaspe 406214 TRUE
406215 Coliban River at Lyal MDB‐Campaspe 406200 406215
406224 Mount Pleasant Creek at
Runnymede MDB‐Campaspe 406224 TRUE
406200 Coliban River at Malmsbury MDB‐Campaspe 406200 TRUE TRUE
406207 Campaspe River at Eppalock MDB‐Campaspe 406215‐406213‐406235‐406226 406207 TRUE
406202 Campaspe@Rochester MDB‐Campaspe 406201‐406224 406202 TRUE
406265 Campaspe @ Echuca MDB‐Campaspe 406202 406265 TRUE
422015 Culgoa@Brenda MDB‐
CondamineBalonne 422208 422015 TRUE TRUE
422201 Balonne@St George MDB‐
CondamineBalonne 422213‐422404 422201 TRUE TRUE TRUE
422205 Culgoa at Whyenbah MDB‐
CondamineBalonne 422201 422205‐422204 TRUE TRUE
422208 Culgoa at Woolerbilla MDB‐
CondamineBalonne 422204 422208 TRUE TRUE
422308 Condamine@Chinchilla MDB‐
CondamineBalonne 422333 422308 TRUE
422316 Condamine@Cecil Weir MDB‐
CondamineBalonne 422353 422316 TRUE
422333 Condamine at Loudouns Bridge MDB‐
CondamineBalonne 422316‐422345‐
422350 422333 TRUE
422353 Condamine@Yarramalong MDB‐
CondamineBalonne
422355‐422319‐422334‐422338‐
422352 422353‐422345 TRUE
422202 Dogwood Ck@Miles MDB‐
CondamineBalonne 422202 TRUE
422210 BungilCk@Tabers MDB‐
CondamineBalonne 422210 TRUE
422310 Condamine@Warwick MDB‐
CondamineBalonne 422394 422310
422319 Dalrymple Creek @ Allora MDB‐
CondamineBalonne 422319 TRUE

60 | AWRA‐R version 5.0 Technical Report
Reach ID Name of main outlet Region ID(s) of inflow
node(s)
ID(s) of outflow node(s)
Has Reservoir?
Has floodplain?
Has irrigation diversion?
Headwater catchment?
422334 Kings Creek@Aides MDB‐
CondamineBalonne 422334 TRUE
422337 Bringalock MDB‐
CondamineBalonne 422337 TRUE
422338 Canal ck at Leyburn MDB‐
CondamineBalonne 422338 TRUE
422350 Oakey Ck@Fairview MDB‐
CondamineBalonne 422350 TRUE
422352 Hogson Creek @ Balgownie MDB‐
CondamineBalonne 422352 TRUE
422394 Condamine@Elbow Valley MDB‐
CondamineBalonne 422394 TRUE
422213 Balonne@Weribone MDB‐
CondamineBalonne 422325‐422210‐
422202 422213
422325 Condamine@Cotswold MDB‐
CondamineBalonne 422308‐422337 422325
422401 Maranoa@Mitchell MDB‐
CondamineBalonne 422407 422401
422407 Maranoa River At Forestvale MDB‐
CondamineBalonne 422407 TRUE
422355 Condamine@TalgaiTailwater MDB‐
CondamineBalonne 422310 422355 TRUE
422011 Culgoa@U/S Collerina (Mundiwa) MDB‐
CondamineBalonne 422017 422011 TRUE
422005 Bokhara at Goodwin MDB‐
CondamineBalonne 422014 422005 TRUE
422006 Bokhara@Bokhara (Goodwins) MDB‐
CondamineBalonne 422011‐422010 422006 TRUE
422010 Birrie River @ Talawanta MDB‐
CondamineBalonne 422013 422010 TRUE
422206 Birrie River @ Goodooga MDB‐
CondamineBalonne 422205
422206‐422013‐422014 TRUE
422016 Narran at Wilby Wilby MDB‐
CondamineBalonne 422206 422016 TRUE
422017 Culgoa@Weilmoringle MDB‐
CondamineBalonne 422015 422017 TRUE
422029 Narran at Narran park MDB‐
CondamineBalonne 422016 422029 TRUE
422404 Maranoa@Cashmere MDB‐
CondamineBalonne 422401 422404 TRUE
405200 Goulburn@Murchison MDB‐GoulburnBroken 405202‐405228 405200 TRUE TRUE TRUE
404224 Broken R at Gowangardie MDB‐GoulburnBroken 4.04E+08 404224
404204 BOOSEY CREEK @ TUNGAMAH MDB‐GoulburnBroken 404204 TRUE
404208 MOONEE CREEK @ LIMA MDB‐GoulburnBroken 404208 TRUE
404234 WHISKEY CREEK US MCCALLSAY
RESERVOIR MDB‐GoulburnBroken 404234 TRUE
404235 RYANS CREEK US MCCALLSAY
RESERVOIR MDB‐GoulburnBroken 404235 TRUE
405205 MURRINDINDI RIVER at
MURRINDINDI ABOVE COLWELLS MDB‐GoulburnBroken 405205 TRUE
405228 HUGHES CREEK at TARCOMBE
ROAD MDB‐GoulburnBroken 405228 TRUE
405231 KING PARROT CREEK at
FLOWERDALE MDB‐GoulburnBroken 405231 TRUE
405241 RUBICON RIVER at RUBICON MDB‐GoulburnBroken 405241 TRUE
405261 SPRING CREEK (COLONIAL CREEK) at
FAWCETT MDB‐GoulburnBroken 405261 TRUE
405274 HOME CREEK at YARCK MDB‐GoulburnBroken 405274 TRUE
405720 RODNEY MAIN DRAIN @ WELLS
CREEK MDB‐GoulburnBroken 405720 TRUE
404203 Broken@Benalla MDB‐GoulburnBroken404206‐404208‐
404207 404203
404206 Broken@Moorngag MDB‐GoulburnBroken 404206 TRUE
404207 HOLLAND CREEK at KELFEERA MDB‐GoulburnBroken 404234‐404235 404207

AWRA‐R version 5.0 Technical Report | 61
Reach ID Name of main outlet Region ID(s) of inflow
node(s)
ID(s) of outflow node(s)
Has Reservoir?
Has floodplain?
Has irrigation diversion?
Headwater catchment?
405202 Goulburn@Seymour MDB‐GoulburnBroken 405201 405202
405209 ACHERON RIVER at TAGGERTY MDB‐GoulburnBroken 405209 TRUE
405217 YEA RIVER at DEVLINS BRIDGE MDB‐GoulburnBroken 405217 TRUE
405246 CASTLE CREEK at ARCADIA MDB‐GoulburnBroken 405246 TRUE
405257 SNOBS CREEK at SNOBS CREEK
HATCHERY MDB‐GoulburnBroken 405257 TRUE
404214 Broken Ck@Katamatite MDB‐GoulburnBroken 404217 404214 TRUE
405232 Goulburn@McCoy Br MDB‐GoulburnBroken 405276‐405720 405232 TRUE
404210 Broken Creek at Rices Weir (Affra
Unit) MDB‐GoulburnBroken 404214‐404204 404210 TRUE
404216 Broken@Goorambat (Casey Weir H.
G MDB‐GoulburnBroken 404203 404216 TRUE
404217 BROKEN CREEK (CHANNEL) @
CASEY WEIR (NEAR GOORAMBAT) MDB‐GoulburnBroken 404216 404217‐
404224002 TRUE
405201 Goulburn@Trawool MDB‐GoulburnBroken
405203‐405257‐405241‐405209‐405261‐405274‐405205‐405217‐
405231 405201 TRUE
405204 Goulburn@Shepparton MDB‐GoulburnBroken404224‐405270‐
405269 405204 TRUE
405226 PRANJIP CREEK at MOORILIM MDB‐GoulburnBroken 405226 TRUE TRUE
405269 Sevens Creek at KIALLA WEST MDB‐GoulburnBroken 405269 TRUE TRUE
405270 GOULBURN RIVER at KIALLA WEST MDB‐GoulburnBroken405200‐405226‐
405246 405270 TRUE
405276 GOULBURN RIVER @ LOCH GARRY MDB‐GoulburnBroken 405204 405276 TRUE
405203 Goulburn@Eildon MDB‐GoulburnBroken 405203 TRUE TRUE TRUE
416027 Gil GilCk@Weemelah MDB‐Gwydir 418052‐416054 416027 TRUE TRUE
418004 Carole Creek at d/s Regulator(Bells
Crossing) MDB‐Gwydir 418042 418004‐418011 TRUE
418052 Carole Creek at Near Garah MDB‐Gwydir 418011 418052 TRUE
418053 Gwydir@Brageen Crossing MDB‐Gwydir 418063 418053 TRUE
418055 Mehi@near Collarenebri MDB‐Gwydir 418002‐418032 418055 TRUE TRUE
418066 Gwydir@Millewa MDB‐Gwydir 418078 418066 TRUE
418012 Gwydir@Pinegrove MDB‐Gwydir 418026 418012
418013 Gwydir@Gravesend Rd Br MDB‐Gwydir
418012‐418025‐418017‐418015‐
418016 418013
418015 Horton @ Rider MDB‐Gwydir 418015 TRUE
418016 Warialda Warialda 3 MDB‐Gwydir 418016 TRUE
418017 Myall Creek at Molroy MDB‐Gwydir 418017 TRUE
418025 Halls Creek @ Bingara MDB‐Gwydir 418025 TRUE
418032 Tycannah Creek at Horseshoe
Lagoon MDB‐Gwydir 418032 TRUE
418033 Bakers Creek @ Bundarra MDB‐Gwydir 418033 TRUE
418063 GWYDIR RIVER (SOUTH ARM) AT D/S TYREEL OFFTAKE REGULATO MDB‐Gwydir 418004
418063‐418063002
418078 GWYDIR RIVER AT ALLAMBIE
BRIDGE MDB‐Gwydir 418053 418078
418001 Gwydir@Pallamallawa MDB‐Gwydir 418013 418001
418008 Gwydir@Bundarra MDB‐Gwydir 418014 418008
418014 Gwydir@Yarrowyck MDB‐Gwydir 418014 TRUE
418042 Gwydir River at d/s Tareelaroi Weir MDB‐Gwydir 418001 418042‐418002
418026 Gwydir@D/S Copeton Dam MDB‐Gwydir 418008‐418033 418026 TRUE

62 | AWRA‐R version 5.0 Technical Report
Reach ID Name of main outlet Region ID(s) of inflow
node(s)
ID(s) of outflow node(s)
Has Reservoir?
Has floodplain?
Has irrigation diversion?
Headwater catchment?
418076 Gingham Channel at Tillaloo Bridge MDB‐Gwydir 4.18E+08 418076 TRUE
416054 Gil Gil @ Boolataroo MDB‐Gwydir 416054 TRUE TRUE
418079 Gingham Channel at Gingham
Bridge MDB‐Gwydir 418076 418079 TRUE
412038 Lachlan at Willandra weir MDB‐Lachlan 412011 412038‐412012 TRUE TRUE TRUE
412039 Lachlan at Hillston Weir MDB‐Lachlan 412038 412039‐
412039002 TRUE TRUE
412057 Lachlan@Nanami MDB‐Lachlan 412002‐412169‐412165‐412073 412057 TRUE
412058 Lachlan at Island Ck Offtake MDB‐Lachlan 412004 412058 TRUE TRUE
412002 Lachlan@Cowra MDB‐Lachlan 412067‐412029‐
412091 412002
412016 Offtake Island Ck MDB‐Lachlan 412023‐
412006002 412016
412029 Prossers Crossing MDB‐Lachlan 412029 TRUE
412030 Mandagery Ck. at Eugowra MDB‐Lachlan 412030 TRUE
412056 Belubula@Needles MDB‐Lachlan
412077‐412085‐412092‐412080‐
412070 412056
412068 GoonigalCk at Gooloogong MDB‐Lachlan 412068 TRUE
412070 Cadiangullong Ck. at Panuara MDB‐Lachlan 412070 TRUE
412071 Canodomine Ck. at Canodomine MDB‐Lachlan 412071 TRUE
412072 Back Ck at Koorawatha MDB‐Lachlan 412072 TRUE
412073 Nyrang Ck. at Nyrang MDB‐Lachlan 412073 TRUE
412080 Flyers Ck. at Beneree MDB‐Lachlan 412080 TRUE
412085 Ooma Ck. at Henry Lawson Way MDB‐Lachlan 412085 TRUE
412091 WaugoolaCk U‐S Cowra MDB‐Lachlan 412091 TRUE
412092 Coombing Ck. nr. Neville MDB‐Lachlan 412092 TRUE
412165 Belubula @ Bells MDB‐Lachlan 412056‐412071 412165
412169 Back Ck at Cowra MDB‐Lachlan 412072 412169
412004 Lachlan Forbes MDB‐Lachlan 412057‐412068‐
412030 412004
412006 Lachlan at Condobolin Br MDB‐Lachlan 412014‐
412006003 412006
412024 Dummy node ‐ GoobangCk at
Condobolin MDB‐Lachlan 412017 412024‐
412014002
412023 Island ck at Fairholme MDB‐Lachlan 412058 412023‐412017
412065 Lachlan@Narrawa MDB‐Lachlan 412065 TRUE
412067 Lachlan@Wyangala MDB‐Lachlan 412065 412067 TRUE
412077 Belubula@Carcoar MDB‐Lachlan 412077 TRUE TRUE
4.12E+08 Dummy node ‐ Lachlan at
Condobolin Br MDB‐Lachlan 412024 412006002‐412006003 TRUE
412129 Dummy node ‐ Lachlan at Hillston
Weir MDB‐Lachlan 4.12E+08 412129 TRUE
412005 Lachlan at Boologal MDB‐Lachlan 412078 412005 TRUE
412078 Lachlan at Whealbah MDB‐Lachlan 412039 412078 TRUE
412011 Lachlan at Lake Cargellico Weir MDB‐Lachlan 412021 412011 TRUE
412014 GoobangCk at Condobolin MDB‐Lachlan 412014002‐412043 412014 TRUE
412021 Booberoi Ck. Offtake MDB‐Lachlan 412006‐412016‐
412099 412021‐412022 TRUE
412026 Lachlan at Oxley MDB‐Lachlan 412045 412026 TRUE
412042 Willandra Ck. at Willandra
Homestead MDB‐Lachlan 412012 412042 TRUE

AWRA‐R version 5.0 Technical Report | 63
Reach ID Name of main outlet Region ID(s) of inflow
node(s)
ID(s) of outflow node(s)
Has Reservoir?
Has floodplain?
Has irrigation diversion?
Headwater catchment?
412043 GoobangCk Darby's Dam MDB‐Lachlan 412043 TRUE TRUE
412045 Lachlan at Corrong MDB‐Lachlan 412005 412045 TRUE
412099 Bland Ck. Lake Cowa MDB‐Lachlan 412099 TRUE TRUE
407289 Nine Mile Ck at Serpentine Ck
Offtake MDB‐LoddonAvoca 407232 407289
408202 Avoca at Amphitheatre MDB‐LoddonAvoca 408202 TRUE
407211 Bet BetCk at Bet Bet MDB‐LoddonAvoca 407288 407211
407213 McCallumsCk Carisbrook MDB‐LoddonAvoca 407213 TRUE
407221 JIM CROW CREEK @ YANDOIT MDB‐LoddonAvoca 407221 TRUE
407246 BULLOCK CREEK @ MARONG MDB‐LoddonAvoca 407246 TRUE
407288 BET BET CREEK @ LILLICUR MDB‐LoddonAvoca 407288 TRUE
407214 CRESWICK CREEK @ CLUNES MDB‐LoddonAvoca 407214 TRUE
407215 Loddon@Newstead MDB‐LoddonAvoca 407300‐407217‐
407221 407215
407217 LODDON RIVER @ VAUGHAN @
D/S FRYERS CREEK MDB‐LoddonAvoca 407217 TRUE
407222 TULLAROOP CREEK @ CLUNES MDB‐LoddonAvoca 407227‐407214 407222
407227 BIRCH CREEK @ SMEATON MDB‐LoddonAvoca 407227 TRUE
407230 Joyces Creek at Strathlea MDB‐LoddonAvoca 407230 TRUE
407239 Middle Creek at Rodborough MDB‐LoddonAvoca 407239 TRUE
407253 PICCANINNY CREEK @ MINTO MDB‐LoddonAvoca 407255 407253
407254 BENDIGO CREEK @ BENDIGO MDB‐LoddonAvoca 407254 TRUE
407255 BENDIGO CREEK @ HUNTLY MDB‐LoddonAvoca 407254 407255
407258 MYERS CREEK @ MYERS FLAT MDB‐LoddonAvoca 407258 TRUE
407285 NINE MILE CREEK @ COADS ROAD MDB‐LoddonAvoca 407289 407285
407287 BULLOCK CREEK @ U/S BOX CREEK MDB‐LoddonAvoca 407290 407287
407290 BULLOCK CREEK AT EAST LODDON MDB‐LoddonAvoca 407246 407290
407300 MUCKLEFORD CREEK @ MUCKLEFORD NORTH MDB‐LoddonAvoca 407300 TRUE
407248 Tullaroop Creek at Tullarrop Res.
(Olet Meas. Weir) MDB‐LoddonAvoca 407222 407248 TRUE
407210 Loddon R D‐S Cairn Curran MDB‐LoddonAvoca 407215‐407230‐
407239 407210 TRUE
408206 Avoca at Archdale Junction MDB‐LoddonAvoca 408202 408206 TRUE
408200 Avoca at Coonooer MDB‐LoddonAvoca 408206 408200 TRUE
408203 Avoca at Quambatook MDB‐LoddonAvoca 408200 408203 TRUE
407205 Loddon@Appin South MDB‐LoddonAvoca 407224 407205 TRUE
407224 Loddon River at Loddon Weir MDB‐LoddonAvoca 407229 407224 TRUE
407202 Loddon@Kerang MDB‐LoddonAvoca 407287‐407285‐407205‐407236 407202 TRUE
407229 Loddon River at Serpentine Weir MDB‐LoddonAvoca 407203 407229‐407232 TRUE
407236 MOUNT HOPE CREEK @ MITIAMO MDB‐LoddonAvoca 407253‐407258 407236 TRUE
407203 Loddon R D‐S Laanecoorie MDB‐LoddonAvoca 407210‐407248‐407213‐407211 407203 TRUE TRUE
421004 Macquarie Warren Weir MDB‐
MacquarieCastlereagh 421031 421004‐421005 TRUE
421019 Cudgegong@Yamble Br MDB‐
MacquarieCastlereagh 421079 421019 TRUE
421022 Macquarie at Oxley stn MDB‐
MacquarieCastlereagh 421090
421022‐421146‐421145 TRUE TRUE
421031 Macquarie at Gin Gin MDB‐
MacquarieCastlereagh 421006 421031 TRUE

64 | AWRA‐R version 5.0 Technical Report
Reach ID Name of main outlet Region ID(s) of inflow
node(s)
ID(s) of outflow node(s)
Has Reservoir?
Has floodplain?
Has irrigation diversion?
Headwater catchment?
421090 Marebone Break at Marebone
regulator MDB‐
MacquarieCastlereagh 421004‐421063
421090‐421088‐421097 TRUE TRUE
421127 Macquarie at Baroona MDB‐
MacquarieCastlereagh421163‐421001‐
421055 421127 TRUE
420004 Castlereagh@Mendooran MDB‐
MacquarieCastlereagh 420004 TRUE
420010 WallumburrawangCk @ Bearbung MDB‐
MacquarieCastlereagh 420010 TRUE
420014 MagometonCk (Site 3) near
Coonamble MDB‐
MacquarieCastlereagh 420014 TRUE
420015 WarrenaCk @ Warrana MDB‐
MacquarieCastlereagh 420015 TRUE
421003 Macquarie at Wellington MDB‐
MacquarieCastlereagh 421040 421003
421018 Bell@Newrea MDB‐
MacquarieCastlereagh 421018 TRUE
421026 Turon River @ Sofala MDB‐
MacquarieCastlereagh 421026 TRUE
421048 Little at Obley 2 MDB‐
MacquarieCastlereagh 421048 TRUE
421059 BuckinbahCk at Yeoval MDB‐
MacquarieCastlereagh 421059 TRUE
421066 Green Valley Ck Hill end MDB‐
MacquarieCastlereagh 421066 TRUE
421072 Winburndale Rivulet Howards Br MDB‐
MacquarieCastlereagh 421072 TRUE
421076 Bogan@Peak Hill No.2 MDB‐
MacquarieCastlereagh 421076 TRUE
421100 PyramulCk U/S Hill end Rd MDB‐
MacquarieCastlereagh 421100 TRUE
421101 Campbells River at U/S Ben Chifley
dam MDB‐
MacquarieCastlereagh 421101 TRUE
421132 Monkeygarck D‐S Gibson way MDB‐
MacquarieCastlereagh 421169 421132
421163 Talbragar at Emanon MDB‐
MacquarieCastlereagh 421042 421163
421165 Beni BillaCk D‐S Canonba Rd MDB‐
MacquarieCastlereagh 421165 TRUE
420005 Castlereagh@Coonamble MDB‐
MacquarieCastlereagh 420004‐420010 420005
421006 Macquarie at Narromine MDB‐
MacquarieCastlereagh 421127 421006
421017 GunningbarCk Weir MDB‐
MacquarieCastlereagh 421005 421017‐421020
421025 Macquarie@Bruinbun MDB‐
MacquarieCastlereagh 421072‐421101 421025
421042 Talbragar@ElongElong MDB‐
MacquarieCastlereagh 421042 TRUE
421055 Coolbaggie at Rawsonvil MDB‐
MacquarieCastlereagh 421055 TRUE
421063 Ewenmarck at Warren MDB‐
MacquarieCastlereagh 421063 TRUE
421129 Monkeygarck u‐s western Arm
Monkey cr MDB‐
MacquarieCastlereagh 421022 421129
421138 Bogan@Nyngan MDB‐
MacquarieCastlereagh 421039 421138
421164 Duck Ck at Napali MDB‐
MacquarieCastlereagh 421164 TRUE
421166 Gunningbar at Fview MDB‐
MacquarieCastlereagh 421017 421166
421001 Macquarie@Dubbo MDB‐
MacquarieCastlereagh421003‐421018‐421048‐421059 421001
421069 Bogan at Broomfield MDB‐
MacquarieCastlereagh 421138‐421166 421069
421169 Breakaway offtake MDB‐
MacquarieCastlereagh 421129 421169
421079 Cudgegong@D/S Windamere Dam MDB‐
MacquarieCastlereagh 421079 TRUE TRUE

AWRA‐R version 5.0 Technical Report | 65
Reach ID Name of main outlet Region ID(s) of inflow
node(s)
ID(s) of outflow node(s)
Has Reservoir?
Has floodplain?
Has irrigation diversion?
Headwater catchment?
420020 Castlereagh@Gungalmn MDB‐
MacquarieCastlereagh420005‐420015‐
420014 420020 TRUE
421011 Marthaguyck at Carinda MDB‐
MacquarieCastlereagh 421153 421011 TRUE
421012 Macquarie@Carinda (Bells Br) MDB‐
MacquarieCastlereagh 421135 421012 TRUE
421023 Bogan@Gongolgon MDB‐
MacquarieCastlereagh 421158 421023 TRUE
421039 Bogan@Neurie Plains MDB‐
MacquarieCastlereagh 421076 421039 TRUE
421135 Macquarie@Miltara MDB‐
MacquarieCastlereagh 421147 421135‐421108 TRUE
421107 MarraCk@Billybingbone MDB‐
MacquarieCastlereagh 421097 421107 TRUE
421147 Macquarie Pillicawarrina MDB‐
MacquarieCastlereagh 421118‐421132 421147 TRUE
421152 Gum Cowal at Oxley MDB‐
MacquarieCastlereagh 421146 421152 TRUE
421153 Terrigal ck u‐s Marthaguyck MDB‐
MacquarieCastlereagh 421152 421153 TRUE
421158 Bogan at Monkey Br MDB‐
MacquarieCastlereagh421069‐421164‐
421165 421158 TRUE
421118 Bulgeragack Gibson way MDB‐
MacquarieCastlereagh 421145 421118 TRUE
421040 Macquarie@D/S Burrendong Dam MDB‐
MacquarieCastlereagh
421019‐421066‐421100‐421025‐
421026 421040 TRUE TRUE
417204 Moonie@Fenton MDB‐Moonie 417201 417204 TRUE
417001 Moonie@Gundablouie MDB‐Moonie 417204 417001 TRUE
417201 Moonie@Nindigully MDB‐Moonie 417201 TRUE TRUE
A4261014 North Rhyne near Kappalunta MDB‐Mountlofty A4261014 TRUE
A4261030 Marne @1KM D/S Jutland Rd Cross MDB‐Mountlofty A4261030 TRUE
A4260605 Marne River at Marne Gorge MDB‐Mountlofty A4261014‐A4261030 A4260605
A4260679 Mount Barker Creek upstream
Bremer River Confluence MDB‐Mountlofty A4260679 TRUE
A4260533 Bremer River near Hartley MDB‐Mountlofty A4260679 A4260533
A4261070 Bremer River at Bletchley Road MDB‐Mountlofty A4260533 A4261070
A4261072 Bremer River at Ballandown Road MDB‐Mountlofty A4261070 A4261072
A4260503 Angas River at Angas Weir MDB‐Mountlofty A4260503 TRUE
A4261074 Angas River at Cheriton Road MDB‐Mountlofty A4260503 A4261074
A4260504 Finniss River 4km East of Yundi MDB‐Mountlofty A4260504
A4261075 Finniss River at Ford Road MDB‐Mountlofty A4260504 A4261075
A4260530 Currency Creek near Higgins MDB‐Mountlofty A4260530 TRUE
A4261099 Currency Creek near Cemetery MDB‐Mountlofty A4260530 A4261099
409023 Edward D‐S Stevens Weir MDB‐Murray 409003
409023‐409020‐409019 TRUE
409202 Murray@Tocumwal MDB‐Murray 409002‐403241‐
403247 409202 TRUE TRUE TRUE
409207 Murray@Torrumbarry MDB‐Murray
405297‐406263‐406265‐409215‐
405232 409207 TRUE TRUE
409075 BullataleCk U/S Edward MDB‐Murray 409075 TRUE
401013 Jingellic at Jingellc MDB‐Murray 401013 TRUE
401210 Snowy Ck at Granite Flat MDB‐Murray 401210 TRUE
401218 Tallangatta Creek at Bullioh MDB‐Murray 401218 TRUE
402204 Yackandandah Ck at Osbornes Flat MDB‐Murray 402204 TRUE

66 | AWRA‐R version 5.0 Technical Report
Reach ID Name of main outlet Region ID(s) of inflow
node(s)
ID(s) of outflow node(s)
Has Reservoir?
Has floodplain?
Has irrigation diversion?
Headwater catchment?
401012 Murray@Biggara MDB‐Murray 401012 TRUE
401014 Tooma at Pinegrove MDB‐Murray 401014 TRUE
401015 Bowna at Yambla MDB‐Murray 401015
401202 Mitta Mitta River at Mitta Mitta MDB‐Murray 401211 401202
401203 Mitta Mitta@Hinnomunjie MDB‐Murray 401203 TRUE
401230 Corryong Ck at Towong MDB‐Murray 401230 TRUE
402203 Kiewa@Mongans Br MDB‐Murray 402203 TRUE
402205 Kiewa@Bandiana MDB‐Murray 402222‐402220‐
402204 402205
403247 Black Dog Ck Ups@ MDB‐Murray 403247 TRUE
403248 Indigo ck at Creamery brdg MDB‐Murray 403248 TRUE
405297 Warrigal Creek at Stewarts Bridge MDB‐Murray 405297 TRUE
406263 Mullers Creek at Murray Valley
Highway MDB‐Murray 406263 TRUE
407252 Barr Creek at Capels Flume MDB‐Murray 407299 407252
409013 Wakool @ Stoney Crossing MDB‐Murray 409061‐409036 409013
409015 Gulpa at Mathoura MDB‐Murray 409030 409015
409017 Murray@Doctors Point MDB‐Murray 409016‐402205 409017
425007 Darling@Burtundy MDB‐Murray 425006 425007
425012 Darling@Menindee Weir 32 MDB‐Murray 425001‐425044 425012
409036 MerranCk U/S Wakool Junction MDB‐Murray 409036 TRUE TRUE
425005 Darling at Pooncarie MDB‐Murray 425012‐425018 425005‐
425019002 TRUE
409008 Murray @ Gulpa MDB‐Murray 409202
409008‐409030‐409006 TRUE
409005 Murray @ Barham MDB‐Murray 409207 409005‐407299 TRUE
409014 Edward@Moulamein MDB‐Murray 410053‐
409014002 409014 TRUE
414201 Murray@Boundary Bend MDB‐Murray 414200‐410130 414201 TRUE
A4260507 Lindsay River at U‐S of Lake Walla
Walla MDB‐Murray A4260505 A4260507 TRUE
425013 Great Darling Anabranch@Wycot MDB‐Murray 425019 425013 TRUE
A4260505 Murray at Lock 9 MDB‐Murray 425011‐425010 A4260505‐426502 TRUE
414218 Murray at Lock 7 MDB‐Murray A4260507 414218‐A4260508 TRUE
A4260511 Murray at Lock 6 MDB‐Murray A4260508‐
426502‐414218 A4260511 TRUE
A4260515 Murray at Lock 4 MDB‐Murray A4260511 A4260515 TRUE
A4260516 Murray at Lock 3 MDB‐Murray A4260515 A4260516 TRUE
A4260518 Murray at Lock 2 MDB‐Murray A4260516 A4260518 TRUE
A4260902 Murray at Lock 1 MDB‐Murray A4260518 A4260902 TRUE
A4261162 Murray at Murray bridge MDB‐Murray A4260902‐A4260605 A4261162 TRUE
401201 Murray@Jingellic MDB‐Murray 401012‐401230‐
401014 401201 TRUE
401204 Mitta Mitta@Tallandoon MDB‐Murray 401202‐401210 401204 TRUE
402222 Kiewa@Kiewa (Main Stream) MDB‐Murray 402203 402222‐402220 TRUE
409002 Murray@Corowa MDB‐Murray 409017‐403248 409002 TRUE
409003 Edward at Deniliquin MDB‐Murray 409056‐409047‐
409075 409003 TRUE
409048 Dummy node ‐
Edward@Moulamein MDB‐Murray 409023 409048‐
409014002 TRUE

AWRA‐R version 5.0 Technical Report | 67
Reach ID Name of main outlet Region ID(s) of inflow
node(s)
ID(s) of outflow node(s)
Has Reservoir?
Has floodplain?
Has irrigation diversion?
Headwater catchment?
409034 Wakool at Kyalie MDB‐Murray 409035‐409013 409034 TRUE
409035 Edward @ liewah MDB‐Murray 409014 409035 TRUE
409047 Edward@Toonalook MDB‐Murray 409015‐409008 409047 TRUE
409056 TuppalCk@Aratula Rd MDB‐Murray 409056 TRUE TRUE
409061 Wakool @ Coonamit Br. MDB‐Murray 409019‐409020‐
409048 409061 TRUE
409204 Murray@Swan Hill MDB‐Murray 407252‐407202‐
409005 409204 TRUE
409215 Murray@Barmah MDB‐Murray 409006‐404210 409215 TRUE
409235 Murray at Piambie Pumps MDB‐Murray 409204 409235 TRUE
414200 Murray@below Wakool Junction MDB‐Murray 409034‐409235 414200 TRUE
414203 Murray@Euston MDB‐Murray 414201 414203 TRUE
414204 MURRAY RIVER @ RED CLIFFS MDB‐Murray 414207 414204 TRUE
414207 Murray@Colignan MDB‐Murray 414203 414207 TRUE
414210 MURRAY RIVER @ LOCK 11 MILDURA (HEAD GAUGE) MDB‐Murray 414204 414210 TRUE
425006 Darling at Studley MDB‐Murray 425005 425006 TRUE
425010 Murray@Lock No. 10 (Wentworth) MDB‐Murray 414210‐425007 425010 TRUE
425011 Great Darling
Anabranch@Bulpunga MDB‐Murray 425013 425011 TRUE
425019 Redbank Ck at D‐S Packers Crossing MDB‐Murray 425014‐
425019002 425019 TRUE
425014 Darling at Menindee Town MDB‐Murray 425002
425014‐425001‐425044 TRUE TRUE
401211 Mitta Mitta@Colemans MDB‐Murray 401203 401211 TRUE TRUE
409016 Murray@D/S Hume Weir
(Heywoods) MDB‐Murray
401013‐401204‐401015‐401218‐
401201 409016 TRUE TRUE
410001 Murrumbidgee@Wagga Wagga MDB‐Murrumbidgee
410004‐410061‐410043‐410045‐410047‐410048 410001 TRUE TRUE
410002 Murrumbidgee at Hay MDB‐Murrumbidgee 410078 410002 TRUE TRUE
410003 Murrumbidgee at Balranald MDB‐Murrumbidgee 410041 410003 TRUE TRUE
410004 Murrumbidgee@Gundagai MDB‐Murrumbidgee
410038‐410039‐410044‐410068‐
410025 410004 TRUE
410017 Billabong Ck at Conargo MDB‐Murrumbidgee 410169‐410168 410017 TRUE TRUE
410021 Murrumbidgee@Darlington Point MDB‐Murrumbidgee 410082 410021 TRUE TRUE
410023 Murrumbidgee at Berembed Weir MDB‐Murrumbidgee 410001‐410103 410023 TRUE TRUE
410036 Murrumbidgee Yanco Weir MDB‐Murrumbidgee 410005 410036‐410007 TRUE
410040 Murrumbidgee @ Maude Weir MDB‐Murrumbidgee 410136 410040 TRUE TRUE
410041 Murrumbidgee D‐S Redbank Weir MDB‐Murrumbidgee 410040 410041 TRUE TRUE
410078 Murrumbidgee at Carrathool MDB‐Murrumbidgee 410021 410078 TRUE TRUE
410082 Murrumbidgee D‐S Gogelderie Weir MDB‐Murrumbidgee 410036 410082 TRUE
410169 Yanco Ck at Yanco Br MDB‐Murrumbidgee 410015 410169 TRUE TRUE
410006 Tumut@Tumut MDB‐Murrumbidgee 410073‐410057 410006
410025 Jugiong Ck at Jugiong MDB‐Murrumbidgee 410025 TRUE
410038 Adjungbilly Dbalara MDB‐Murrumbidgee 410038 TRUE
410039 Tumut@Brungle Br MDB‐Murrumbidgee 410006‐410059‐410070‐410071 410039
410043 HillisCk Mount Adrah MDB‐Murrumbidgee 410043 TRUE
410045 BillabungCk at Sunnyside MDB‐Murrumbidgee 410045 TRUE

68 | AWRA‐R version 5.0 Technical Report
Reach ID Name of main outlet Region ID(s) of inflow
node(s)
ID(s) of outflow node(s)
Has Reservoir?
Has floodplain?
Has irrigation diversion?
Headwater catchment?
410047 Tarcutta @ Borambola MDB‐Murrumbidgee 410047 TRUE
410048 KyeambaCk at Ladysmith MDB‐Murrumbidgee 410048 TRUE
410059 Gilmore Ck at Gilmore MDB‐Murrumbidgee 410059 TRUE
410061 Adelong Ck Batlow Rd MDB‐Murrumbidgee 410061 TRUE
410062 Numeralla MDB‐Murrumbidgee 410062 TRUE
410067 Big Badja at Numeralla MDB‐Murrumbidgee 410067 TRUE
410068 Murrumbidgee at Glendale MDB‐Murrumbidgee 410008 410068
410070 BombowleeCk at Bombowlee MDB‐Murrumbidgee 410070 TRUE
410071 Brungle Ck at Red Hill MDB‐Murrumbidgee 410071 TRUE
410076 Jerangle Road MDB‐Murrumbidgee 410076 TRUE
410077 Bredbo MDB‐Murrumbidgee 410077 TRUE
410101 Murrumbidgee at Pine Island MDB‐Murrumbidgee 410050‐410077‐410076‐410141 410101
410107 Mountain Ck at Mountain Ck MDB‐Murrumbidgee 410107 TRUE
410133 Coleambally Outfall Drain near
Bundy MDB‐Murrumbidgee 410157 410133
410141 Michelago MDB‐Murrumbidgee 410141 TRUE
410176 Yass @ U/S B/Juck MDB‐Murrumbidgee 410026 410176
410014 Colombo creek @ Morunda MDB‐Murrumbidgee 410007 410014‐410015
410024 Goodradigbee@Wee Jasper
(Kashmir) MDB‐Murrumbidgee 410024 TRUE
410026 Yass_(Yass_River) MDB‐Murrumbidgee 410026 TRUE
410033 Murrumbidgee@Mittagang
Crossing MDB‐Murrumbidgee 410033 TRUE
410044 Muttama Ck @ Coolac MDB‐Murrumbidgee 410044 TRUE
410050 Murrumbidgee@Billilingra MDB‐Murrumbidgee 410033‐410062‐
410067 410050
410057 Gooba/GndraLacmalac MDB‐Murrumbidgee 410057 TRUE
410103 HoulaghansCk at Downside MDB‐Murrumbidgee 410103 TRUE
410130 Murrumbidgee@D/S Balranald
Weir MDB‐Murrumbidgee 410003 410130
410136 Murrumbidgee@D/S Hay Weir MDB‐Murrumbidgee 410002 410136
410073 Tumut@Oddys Br MDB‐Murrumbidgee 410073 TRUE TRUE
410093 Old Man Ck at Kywong MDB‐Murrumbidgee 410093 TRUE TRUE
410157 Coleambally Outfall Drain at
Booroorban MDB‐Murrumbidgee 410157 TRUE TRUE
410012 Billabong CkCocketgedong MDB‐Murrumbidgee 410012 TRUE TRUE
410016 Billabong Ck@Jerilderie MDB‐Murrumbidgee 410170 410016 TRUE
410053 Billabong Ck at Bundy MDB‐Murrumbidgee 410017‐410133‐
410148 410053 TRUE
410005 Murrumbidgee at Narrendera MDB‐Murrumbidgee 410023‐410093 410005 TRUE
410168 Billabong Ck D‐S Hartwood Weir MDB‐Murrumbidgee 410016 410168‐410148 TRUE
410170 BillabobgCk U‐S Innes Br MDB‐Murrumbidgee 410014‐410012 410170 TRUE
410008 Murrumbidgee@Burrinjuck Dam MDB‐Murrumbidgee 410024‐410176‐410107‐410101 410008 TRUE TRUE
419021 Namoi@Bugilbone (Riverview) MDB‐Namoi 419061‐419068 419021 TRUE TRUE
419026 Namoi@Goangra MDB‐Namoi 419021‐419072 419026 TRUE TRUE
419059 GunidgeraCk at D‐S Reg MDB‐Namoi 419039
419059‐419061‐
419061002 TRUE
419068 Namoi@D/S Weeta Weir MDB‐Namoi 419059 419068 TRUE

AWRA‐R version 5.0 Technical Report | 69
Reach ID Name of main outlet Region ID(s) of inflow
node(s)
ID(s) of outflow node(s)
Has Reservoir?
Has floodplain?
Has irrigation diversion?
Headwater catchment?
419089 Pian at DempseysBrdg MDB‐Namoi 419088 419089 TRUE
419016 Cockburn_R_@Mulla_Crossing MDB‐Namoi 419016 TRUE
419088 PianCk @ Cubbaroo MDB‐Namoi 4.19E+08 419088
419029 Ukolan MDB‐Namoi 419029 TRUE
419032 Coxs_Ck_@Boggabri MDB‐Namoi 419032 TRUE
419035 Timbumburi MDB‐Namoi 419035 TRUE
419051 Avoca_East MDB‐Namoi 419051 TRUE
419072 Kienbri_No.2 MDB‐Namoi 419072 TRUE
419005 Namoi@NorthCuerindi MDB‐Namoi 419005 TRUE
419015 Peel@Piallamore MDB‐Namoi 419045 419015
419020 Manilla@Brabri (Merriwee) MDB‐Namoi 419043 419020
419022 Namoi@Manilla Railway Br MDB‐Namoi 419020‐419005‐
419029 419022
419024 Peel@Paradise Weir MDB‐Namoi 419015‐419016 419024
419049 Pian @ Waminda MDB‐Namoi 419089 419049
419043 Manilla@D/S Split Rock Dam MDB‐Namoi 419043 TRUE TRUE
419045 Peel@D/S Chaffey Dam MDB‐Namoi 419045 TRUE TRUE
419001 Namoi@Gunnedah MDB‐Namoi 419007‐419006‐
419027 419001 TRUE
419003 Narrabri Ck@Narrabri MDB‐Namoi 419012‐419051 419003 TRUE
419006 Peel@Carrol Gap MDB‐Namoi 419024‐419035 419006 TRUE
419012 Namoi@Boggabri MDB‐Namoi 419001‐419032 419012 TRUE
419027 Mooki@Breeza MDB‐Namoi 419027 TRUE
419039 Namoi @ Mollee MDB‐Namoi 419003 419039 TRUE
419091 Namoi@Walgett MDB‐Namoi 419026‐419049 419091 TRUE
419007 Namoi@D/S Keepit Dam MDB‐Namoi 419022 419007 TRUE TRUE
403236 Barwidgeeck at Myrtleford MDB‐Ovens 403236 TRUE
403205 Ovens Rivers@Bright MDB‐Ovens 403205 TRUE
403209 Reedy ck at Wangaratta North MDB‐Ovens 403209 TRUE
403210 Ovens@Myrtleford MDB‐Ovens 403205‐403233 403210
403214 Happy Valley Ck at Rosewhite MDB‐Ovens 403214 TRUE
403220 Buffalo at Lake Buffalo MDB‐Ovens 403220 TRUE
403223 King at Docker Rd Br MDB‐Ovens 403240‐403226 403223
403224 Hurdle Ck at Bobinawarrah MDB‐Ovens 403224 TRUE
403226 Boggy Ck at Angleside MDB‐Ovens 403226 TRUE
403227 King at Cheshunt MDB‐Ovens 403228 403227
403230 Ovens at Rocky Point MDB‐Ovens 403214‐403236‐403210‐403220 403230
403233 Buckland R at Harris Lane MDB‐Ovens 403233 TRUE
403240 King at Edi MDB‐Ovens 403227 403240
403249
THREE MILE CREEK D‐S YARRAWONGA RD at
WANGARATTA MDB‐Ovens 403249 TRUE
403228 King at Lake William Hovell MDB‐Ovens 403228 TRUE TRUE
403200 Ovens@Wangaratta (Combined
Flow) MDB‐Ovens 403230‐403223‐
403224 403200 TRUE
403241 Ovens@Peechelba MDB‐Ovens 403200‐403249‐
403209 403241 TRUE
424202 Paroo River @ Yarronvale MDB‐Paroo 424202 TRUE

70 | AWRA‐R version 5.0 Technical Report
Reach ID Name of main outlet Region ID(s) of inflow
node(s)
ID(s) of outflow node(s)
Has Reservoir?
Has floodplain?
Has irrigation diversion?
Headwater catchment?
424002 Paroo@Willara Crossing MDB‐Paroo 424201 424002 TRUE
424001 Paroo@Wanaaring MDB‐Paroo 424002 424001 TRUE
424201 Paroo@Caiwarro MDB‐Paroo 424202 424201 TRUE
423002 Warrego@Fords Br (Main Channel MDB‐Warrego 423004 423002‐423001 TRUE
423201 Warrego R @ Charleville MDB‐Warrego 423204 423201 TRUE
423203 Warrego@Wyandra MDB‐Warrego 423201‐423205 423203 TRUE
423204 Warrego@Augathella MDB‐Warrego 423204 TRUE
423205 Binnowee_TM MDB‐Warrego 423205 TRUE
423206 Warrego@Wallen MDB‐Warrego 423203 423206 TRUE
423005 Warrego@Barringun MDB‐Warrego 423202 423005‐423004 TRUE
423202 Warrego@Cunnamulla MDB‐Warrego 423206 423202 TRUE
415200 Wimmera@Horsham MDB‐Wimmera 415201‐415223‐
415203 415200
415201 Wimmera@Glenorchy Weir Tail
Gauge MDB‐Wimmera 415206‐415237 415201
415202 Mackenzie at Wartook Reservoir MDB‐Wimmera 415202 TRUE
415203 Mt William Creek at Lake Lonsdale
(Tail Gauge) MDB‐Wimmera 415214‐415252 415203
415206 Wimmera@Glynwylln MDB‐Wimmera 415238‐415245‐
415207 415206
415207 Wimmera at Eversley MDB‐Wimmera 415207 TRUE
415214 FyansCk at Lake Bellfield MDB‐Wimmera 415214 TRUE
415220 Avon River at Wimmera Highway MDB‐Wimmera 415220 TRUE
415226 Richardson River at Carrs Plains MDB‐Wimmera 415226 TRUE
415237 ConcongellaCk at Stawell MDB‐Wimmera 415237 TRUE
415238 Wattle Ck at Navarre MDB‐Wimmera 415238 TRUE
415245 Mount Cole Ck at Crowlands MDB‐Wimmera 415245 TRUE
415246 Wimmera@Lochiel Railway Br MDB‐Wimmera 415256 415246
415247 Wimmera at Tarrenyurk MDB‐Wimmera 415246 415247
415223 Mackenzie at Mckenzie Creek MDB‐Wimmera 415202 415223‐415251
415252 Mt William Ck at Mokepilly MDB‐Wimmera 415252
415256 Wimmera at U‐S of Dimboola MDB‐Wimmera 415251‐415200 415256
415257 Richardson River at Donald MDB‐Wimmera 415226‐415220 415257

AWRA‐R version 5.0 Technical Report | 71
Appendix 2: Benchmarking Report on AWRA-R v5.0 performance for different regions of MDB

72 | AWRA‐R version 5.0 Technical Report

AWRA‐R version 5.0 Technical Report | 73

74 | AWRA‐R version 5.0 Technical Report

AWRA‐R version 5.0 Technical Report | 75

76 | AWRA‐R version 5.0 Technical Report

AWRA‐R version 5.0 Technical Report | 77

78 | AWRA‐R version 5.0 Technical Report

AWRA‐R version 5.0 Technical Report | 79

80 | AWRA‐R version 5.0 Technical Report

AWRA‐R version 5.0 Technical Report | 81

82 | AWRA‐R version 5.0 Technical Report

AWRA‐R version 5.0 Technical Report | 83

84 | AWRA‐R version 5.0 Technical Report

AWRA‐R version 5.0 Technical Report | 85

86 | AWRA‐R version 5.0 Technical Report

AWRA‐R version 5.0 Technical Report | 87

88 | AWRA‐R version 5.0 Technical Report

AWRA‐R version 5.0 Technical Report | 89
Appendix 3: List of inputs and outputs with the variable names used in the model
Time series variables of AWRA-R v5.0
Temporal variable (symbol) Symbol used in combined file
Unit of input data
Reference equation
Rainfall at river (P) rainfall.river mm/day Equation 32
Evaporation from river (E) evap.river mm/day Equation 32
Rainfall at floodplain (Pfp) rainfall.floodplain mm/day Equation 36
Evaporation from floodplain (Efp) evap.floodplain mm/day Equation 36
Irrigation diversion (Qd) irrigation.diversion m3/s Equations 1, 30
Irrigation return flow (Qirr) irrigation.returnflow m3/s Equations 1, 31
Urban diversion (Qu) urban.diversion m3/s Equation 1
AWRA-L runoff (Qr) awral.inflow m3/s Equations 1, 4
Reservoir volume (S) reservoir.volume m3 Equation 6
Reservoir area (a) reservoir.area m2 Equation 6
Depth to groundwater (dgw) depth.to.groundwater m Equations 22, 45, 50
River water depth(hrivw) river.depth m Equations49, 51
River water width (Xrivw) river.width m Equation 49, 50, 51
Reservoir net diversion (Qnet_transfer) reservoir.net.diversion m3/s Equation 5
Other river diversion(Qsd) other.river.diversion m3/s Equation 1
Inflow from each of the upstream nodes (Qu/s) inflow m3/s Equations 1 & 2
Rainfall at reservoir (Ps) rainfall.top mm/day Equation 6
Evaporation from reservoir (Es) evap.top mm/day Equation 6
Outflow at downstream nodes outflow m3/s For calibration
Parameters of AWRA-R v5.0 included the calibrated parameters
Parameter (symbol) Symbols used in config file
Unit Reference equation
River area alpha (α) river.area.alpha ‐ Equation 34
River area beta (β) river.area.beta ‐ Equation 34
Flood beta (Cfp) flood.beta m‐1 Equation 39
Anabranch partition factor (Ca) anabranch.top.a, anabranch.bottom.a
‐ Equation 35
Anabranch exponent(Ba) anabranch.top.b, anabranch.bottom.b
‐ Equation 35
Total river length (L) total.river.length m Equations 34, 43
River depth alpha (αd) river.depth.alpha
‐ Equation 49 (to determine hrivw)
River depth beta (βd) river.depth.beta
‐ Equation 49 (to determine hrivw)
Overbank flow threshold (OT) [calibrated]
overbankflow.threshold m3/sec Equation 37

90 | AWRA‐R version 5.0 Technical Report
Parameter (symbol) Symbols used in config file
Unit Reference equation
Floodplain surface layer conductivity (Kc)
flood.ksat m/sec Equation 44
Aquifer specific yield (Sy) aquifer.specific.yield ‐ Equation 45
Aquifer hydraulic conductivity (Kaq) aquifer.ksat m/sec Equations 46, 51
Aquifer thickness (daq) aquifer.thickness m Equations 46, 51
Surface layer thickness (dc) surface.layer.thickness m Equations 44, 49
Riverbed conductivity (Krivc) river.conductivity m/sec Equation 49
Area of residual catchment (A) area.subcatchments m2 Equation 4
Length of reach inflow stream Link.length m Equation 34
Flood return flow coefficient (FR) [calibrated]
‐ Equation 41
Monod parameter (M1) [calibrated] m3/sec Equation 48
Monod parameter (M2) [calibrated] m3/sec Equation 48
Runoff correction factor (SF) [calibrated]
‐ Equation 4
Lag [calibrated] sec Equation 3
K [calibrated] sec Equation 3
X [calibrated] ‐ Equation 3
AWRA-R v5.0 outputs
Variables (symbol) Symbols used in non-routing states file Unit Reference equation
Outflow ( / ) outflow m3/sec Equation 1
Overbank flow (Qfp) overbank.flow m3/sec Equations 1, 37
Floodplain volume (Vfp) floodplain.volume m3 Equation 42
Flood plain area (Afp) floodplain.area m2 Equations 39, 40
Flood plain return flow (Qfpr) floodplain.returnflow m3/sec Equations 1, 41
River rainfall flux (Qp) river.rainfall.flux m3/sec Equations 1, 32
River evaporation flux (Qe) river.evap.flux m3/sec Equations 1, 33
Floodplain rainfall flux floodplain.rainfall.flux m3/sec Equation 36
Floodplain evaporation flux floodplain.evap.flux m3/sec Equation 36
Floodplain groundwater loss (GWRfp)
floodplain.groundwater.loss m3/sec Equations 36, 43
River groundwater loss (Qgw) river.groundwater.loss m3/sec Equations 1,
Anabranch loss (Qa) top.anabranch.loss, bottom.anabranch.loss m3/sec Equations 1, 35
Reservoir rainfall flux reservoir.rainfall.flux m3/sec Equation 6
Reservoir evaporation flux reservoir.evap.flux m3/sec Equation 6
Reservoir contribution (Qs) reservoir.contribution m3/sec Equations 1, 5
River water volume river.volume m3
Floodplain groundwater max
change storage (S) floodplain.groundwater.max.change.storage m2/sec Equation 43
Floodplain groundwater outflow (Q)
floodplain.groundwater.outflow m3/sec Equation 43
Floodplain groundwater max potential infiltration (I)
floodplain.groundwater.max.infiltration m2/sec Equation 44

AWRA‐R version 5.0 Technical Report | 91
Variables (symbol) Symbols used in non-routing states file Unit Reference equation
River groundwater max change
storage (Sriv) river.groundwater.max.change.storage m2/sec Equation 47, 50
River groundwater outflow (Qriv) river.groundwater.outflow m3/sec Equation 47, 51
river.groundwater.max.infiltration (Iriv)
river.groundwater.max.infiltration m2/sec Equation 49
River groundwater max monod loss (Qgwmond)
river.groundwater.max.monod.loss m3/sec Equation 48

92 | AWRA‐R version 5.0 Technical Report
CONTACT US
t 1300 363 400 +61 3 9545 2176 e [email protected] w www.csiro.au
YOUR CSIRO
Australia is founding its future on science and innovation. Its national science agency, CSIRO, is a powerhouse of ideas, technologies and skills for building prosperity, growth, health and sustainability. It serves governments, industries, business and communities across the nation.
FOR FURTHER INFORMATION
CSIRO Land and Water Dushmanta Dutta t +61 2 6246 5859 e [email protected] w www.csiro.au/clw


![Welcome [unisonfgpartners.com.au]unisonfgpartners.com.au/pdf/FINDEX-FMGMT.pdf4.0 1.0 1.0 1.0 1.0 1.0 1.0 50.0 43.5 34.5 25.5 12.5 5.5 9.0 9.0 8.0 7.0 5.0 2.0 5.0 5.0 5.0 5.0 5.0 14.0](https://static.fdocuments.net/doc/165x107/5f9881d4934d305cce543099/welcome-40-10-10-10-10-10-10-500-435-345-255-125-55-90-90-80.jpg)


![AWRA-L v5.0: Technical description of model algorithms and ... · CSIRO LAND AND WATER AWRA-L v5.0: Technical description of model algorithms and inputs [AWRA-L v5.0 technical report]](https://static.fdocuments.net/doc/165x107/5b60e9a57f8b9a4a488bd18c/awra-l-v50-technical-description-of-model-algorithms-and-csiro-land-and.jpg)


