Awr1page - Sanity checking time instrumentation in AWR reports
25
AWR1page Sanity checking time instrumentation in AWR Reports By: JB (part 1)
-
Upload
john-beresniewicz -
Category
Data & Analytics
-
view
676 -
download
0
Transcript of Awr1page - Sanity checking time instrumentation in AWR reports
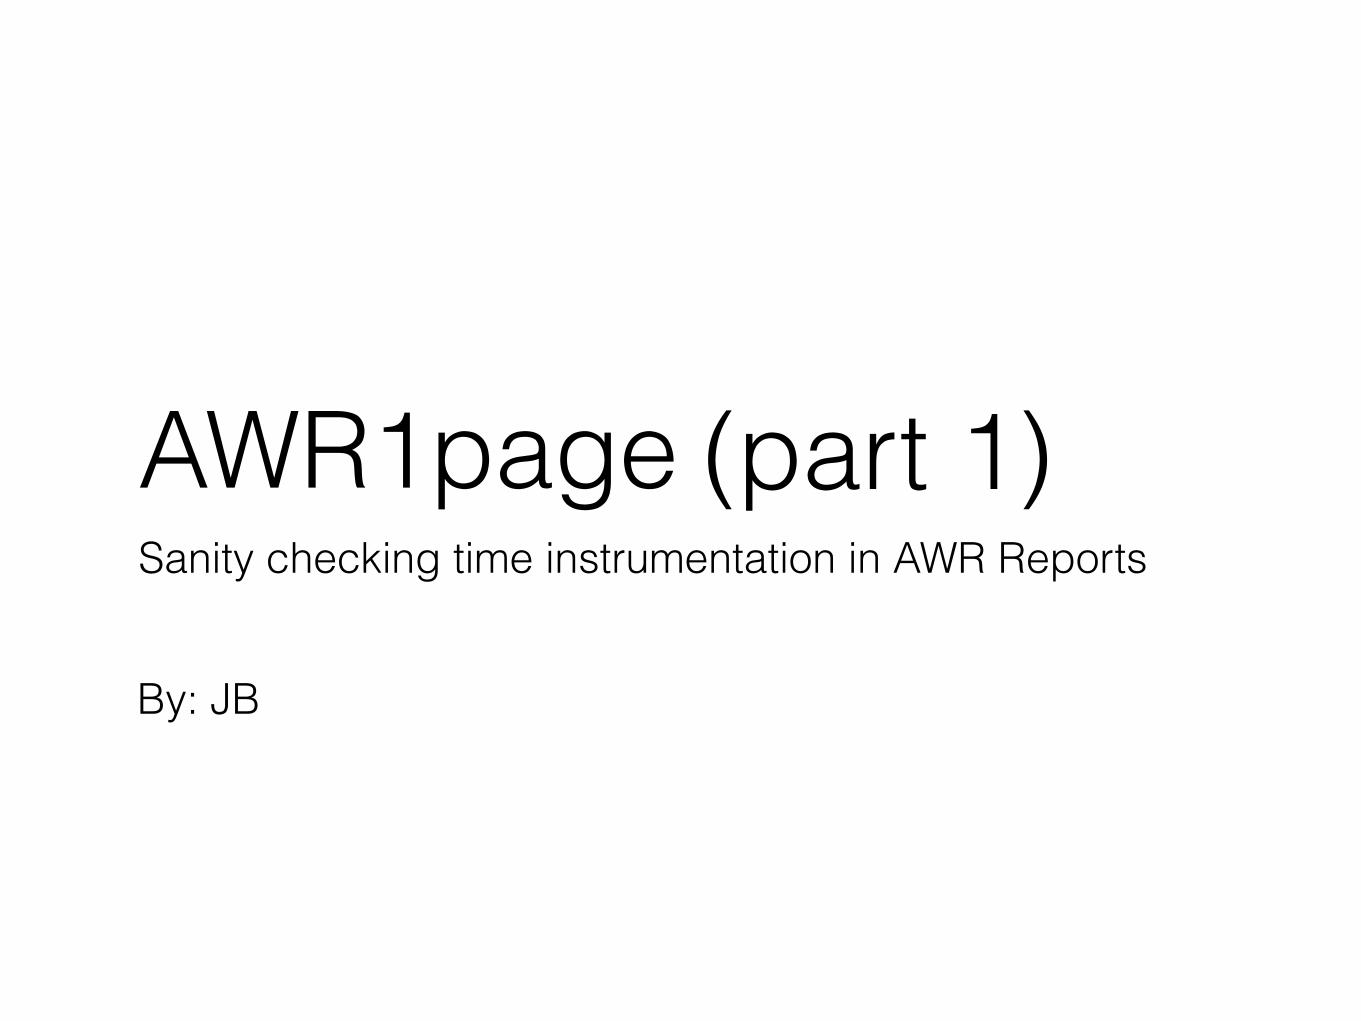
AWR1pageSanity checking time instrumentation in AWR Reports
By: JB
(part 1)

Acknowledgements
• Kevin Closson / Connor McDonald
• Graham Wood
• Lothar Flatz / Wolfgang Breitling / Alberto Dell’Era
• Toon Koppelaars
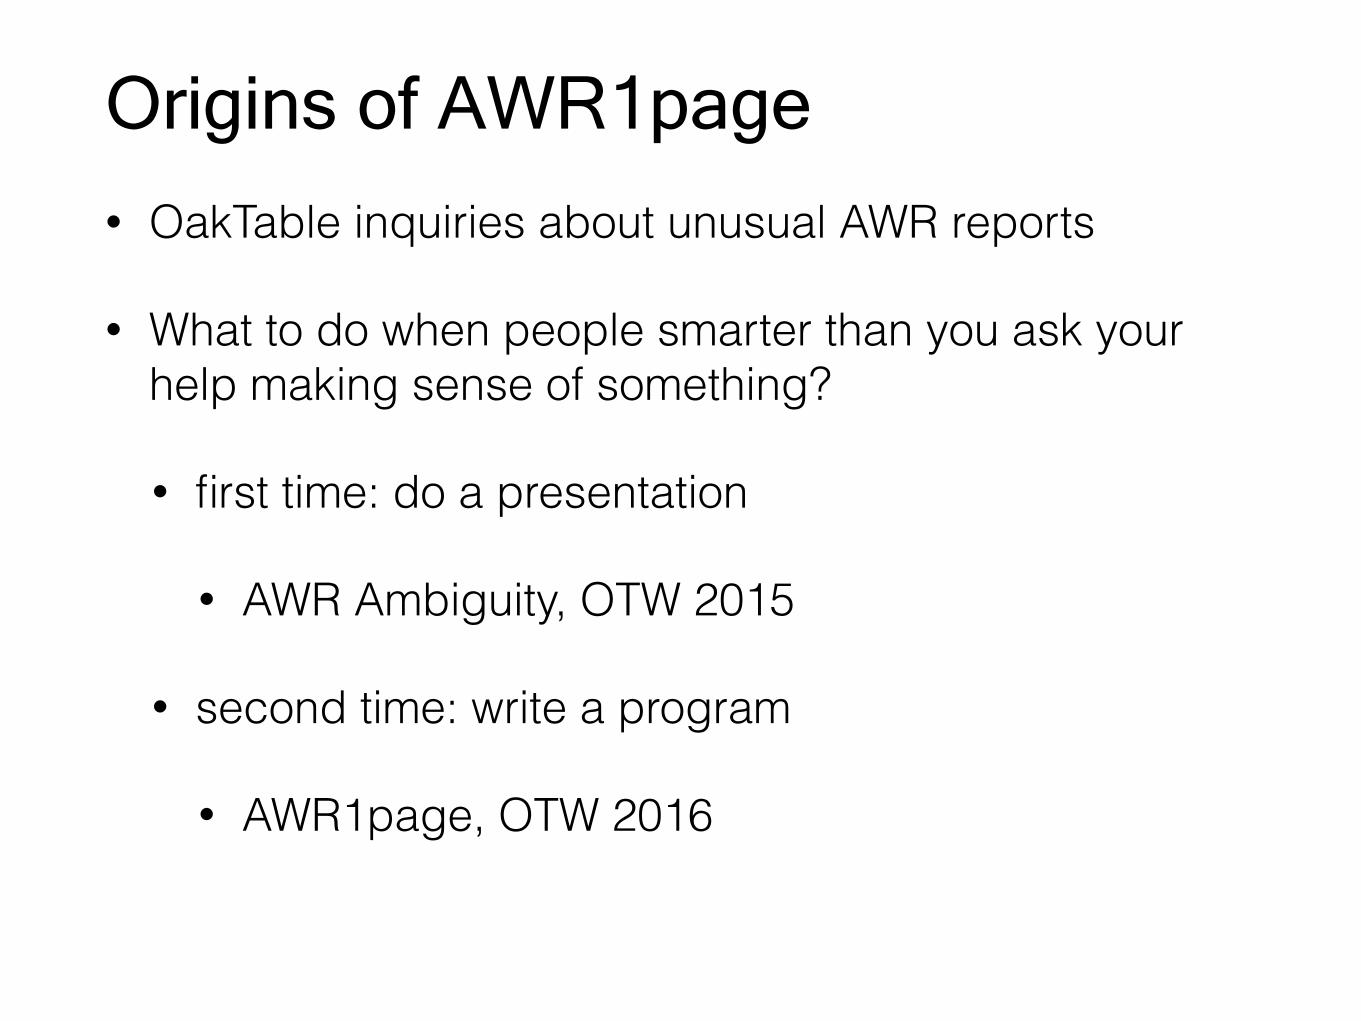
Origins of AWR1page
• OakTable inquiries about unusual AWR reports
• What to do when people smarter than you ask your help making sense of something?
• first time: do a presentation
• AWR Ambiguity, OTW 2015
• second time: write a program
• AWR1page, OTW 2016

OTW 2015: AWR Ambiguity Instrumentation issues and symptoms
Symptom Possible issue
DB CPU >> ASH CPU (and significant wait time)
CPU used within wait (this was the issue here)
ASH CPU >> DB CPU System CPU-bound (ASH includes run-queue)
DB Time >> DB CPU + Wait (and not CPU-bound)
Un-instrumented wait (in call, not in wait, not on CPU)
DB Time >> ASH DB Time 1. Double-counted DB Time 2. ASH dropped samples

Model: Oracle Time = CPU + Wait
• Account for time spent executing Oracle code by either background or foreground processes
• Oracle processes are either ON CPU or Actively Waiting
• Assuming DB Time is correct, two possible issues:
• DB Time < CPU + Wait
• DB Time > CPU + Wait
Oracle Time
CPU Time Wait Time
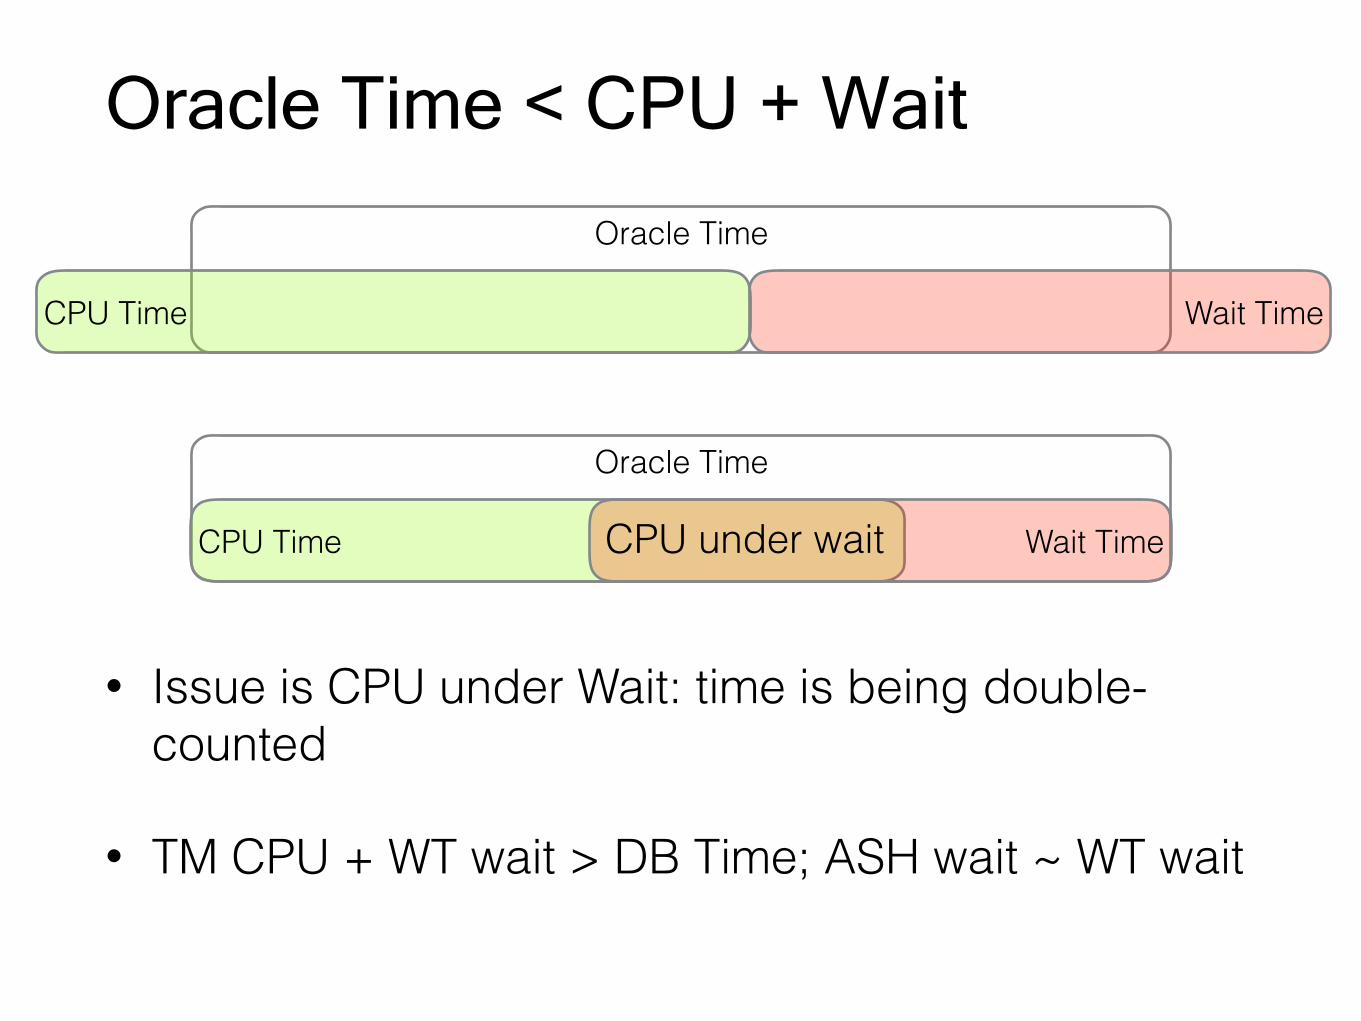
Oracle Time < CPU + Wait
• Issue is CPU under Wait: time is being double-counted
• TM CPU + WT wait > DB Time; ASH wait ~ WT wait
Oracle Time
CPU Time Wait Time
Oracle Time
CPU Time Wait TimeCPU under wait
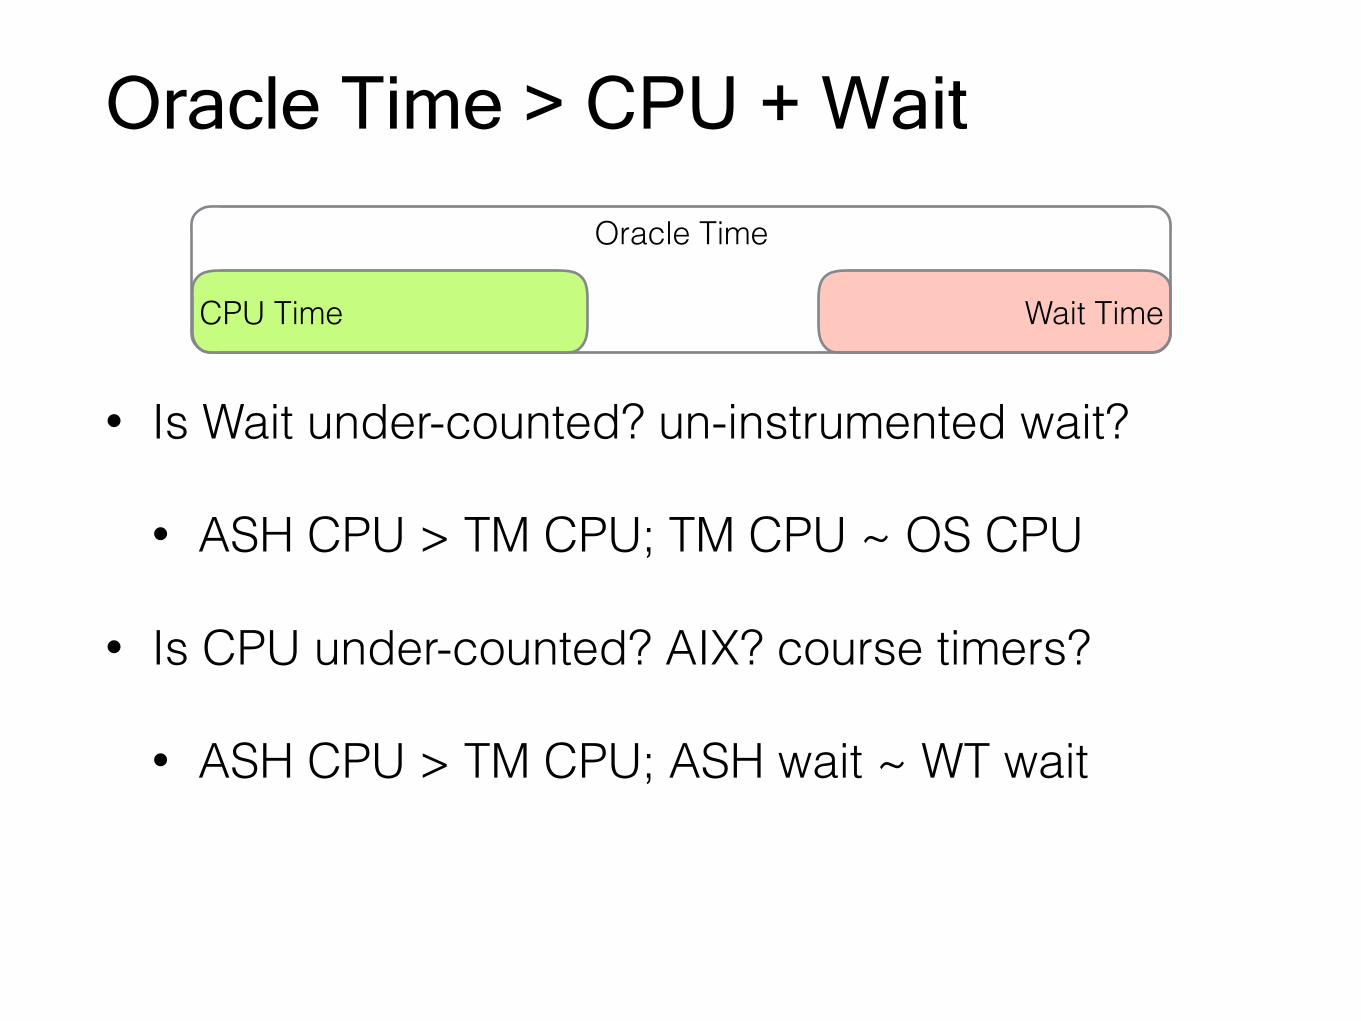
Oracle Time > CPU + Wait
• Is Wait under-counted? un-instrumented wait?
• ASH CPU > TM CPU; TM CPU ~ OS CPU
• Is CPU under-counted? AIX? course timers?
• ASH CPU > TM CPU; ASH wait ~ WT wait
Oracle Time
CPU Time Wait Time
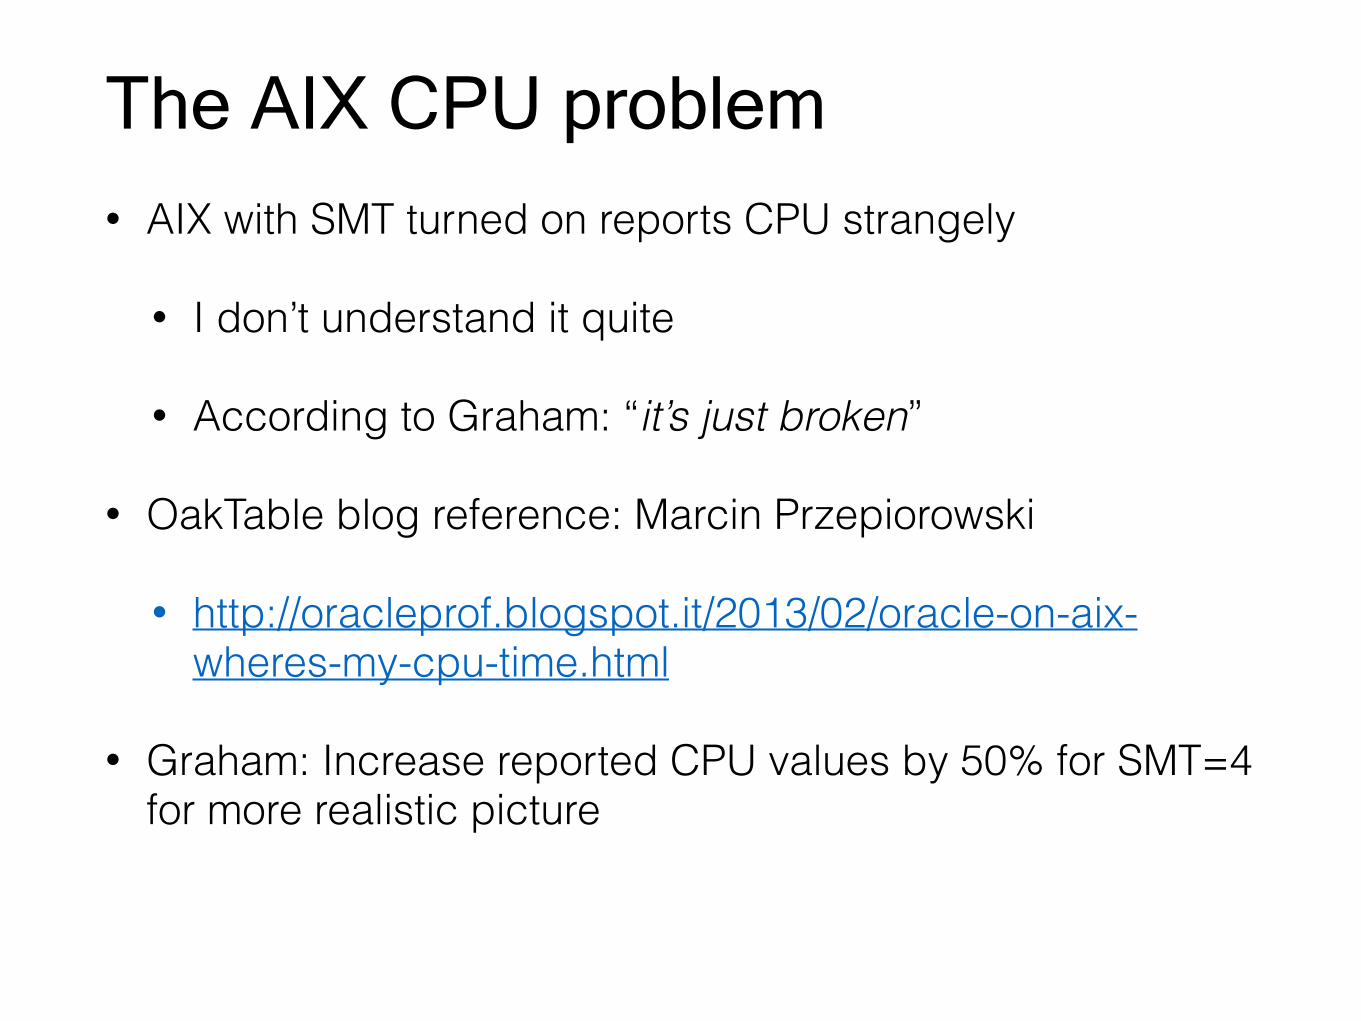
The AIX CPU problem• AIX with SMT turned on reports CPU strangely
• I don’t understand it quite
• According to Graham: “it’s just broken”
• OakTable blog reference: Marcin Przepiorowski
• http://oracleprof.blogspot.it/2013/02/oracle-on-aix-wheres-my-cpu-time.html
• Graham: Increase reported CPU values by 50% for SMT=4 for more realistic picture

Checking Model Consistency
• Consistency checking is very difficult
• AWR reports are massive(most of it irrelevant for any specific situation)
• Data scattered about in report
• Timing info is difficult to compare
• Units vary, breakdowns inconsistent
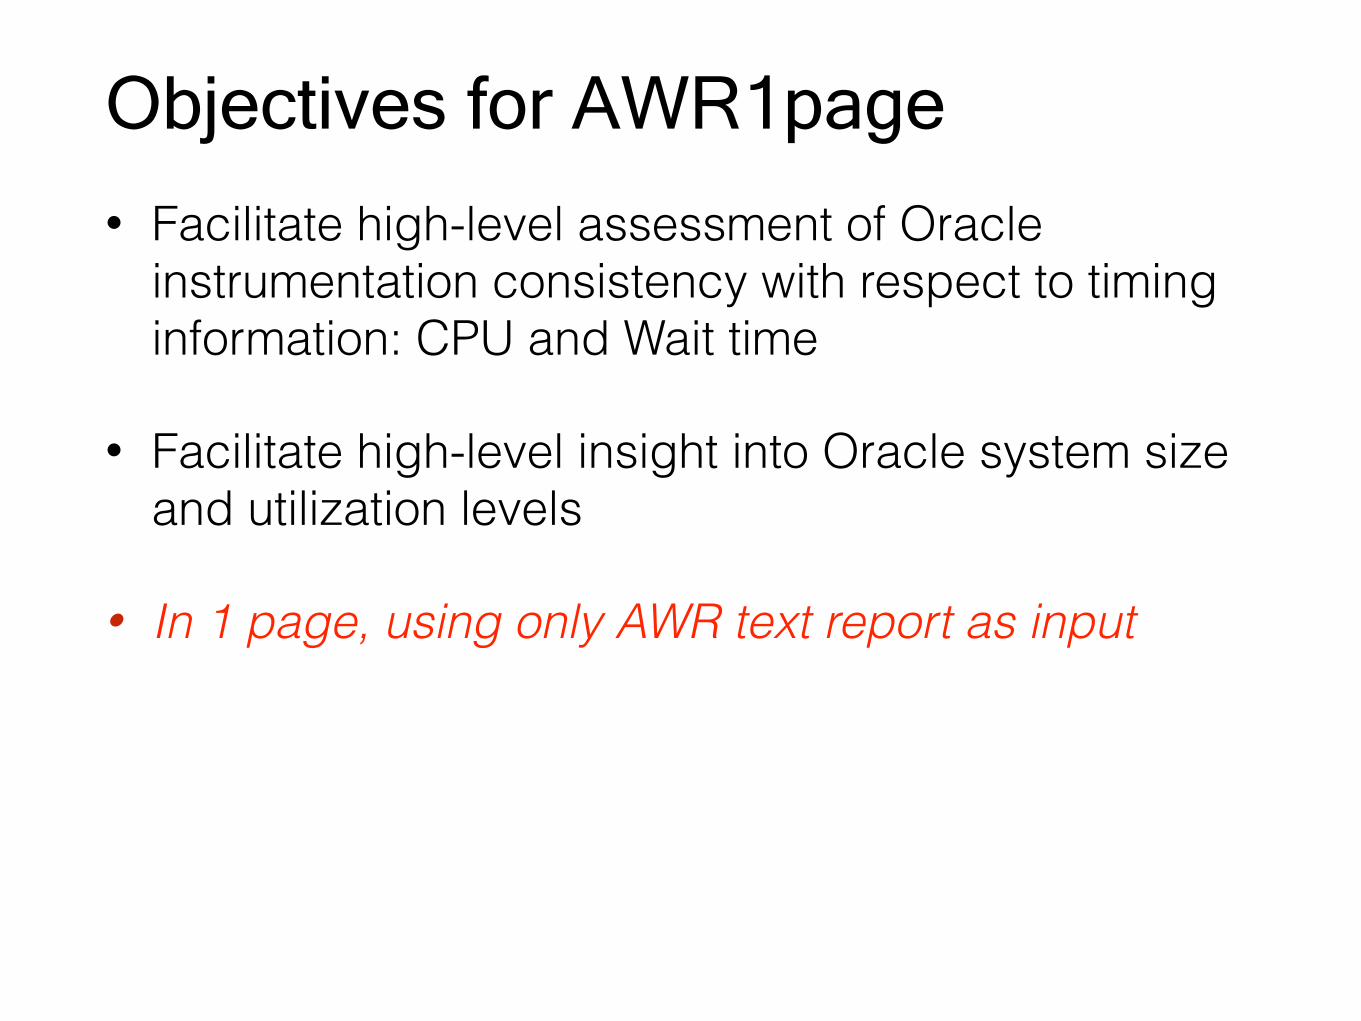
Objectives for AWR1page
• Facilitate high-level assessment of Oracle instrumentation consistency with respect to timing information: CPU and Wait time
• Facilitate high-level insight into Oracle system size and utilization levels
• In 1 page, using only AWR text report as input

Idea: Measure x Source Matrix
INFO OSSTAT TIME MODEL ASH
HOST CPU
ORCL CPU
WAIT
MISC
Compare rows for equality
Columns should add upward
mea
sure
s
data sources

Values from AWR report
INFO * cores cpus
threads/core memory
OSSTATXX
X*X
TIME MODEL ASH
ORCL . total .
FG BG
.
.
.
.X
X X
.X
X X*
CPU load . . busy
i/o wait scheduler ORCL .
FG BG
XX
XX...
.
.
.
.X
X X
.
.
.
.X
X X*
WAITMISC
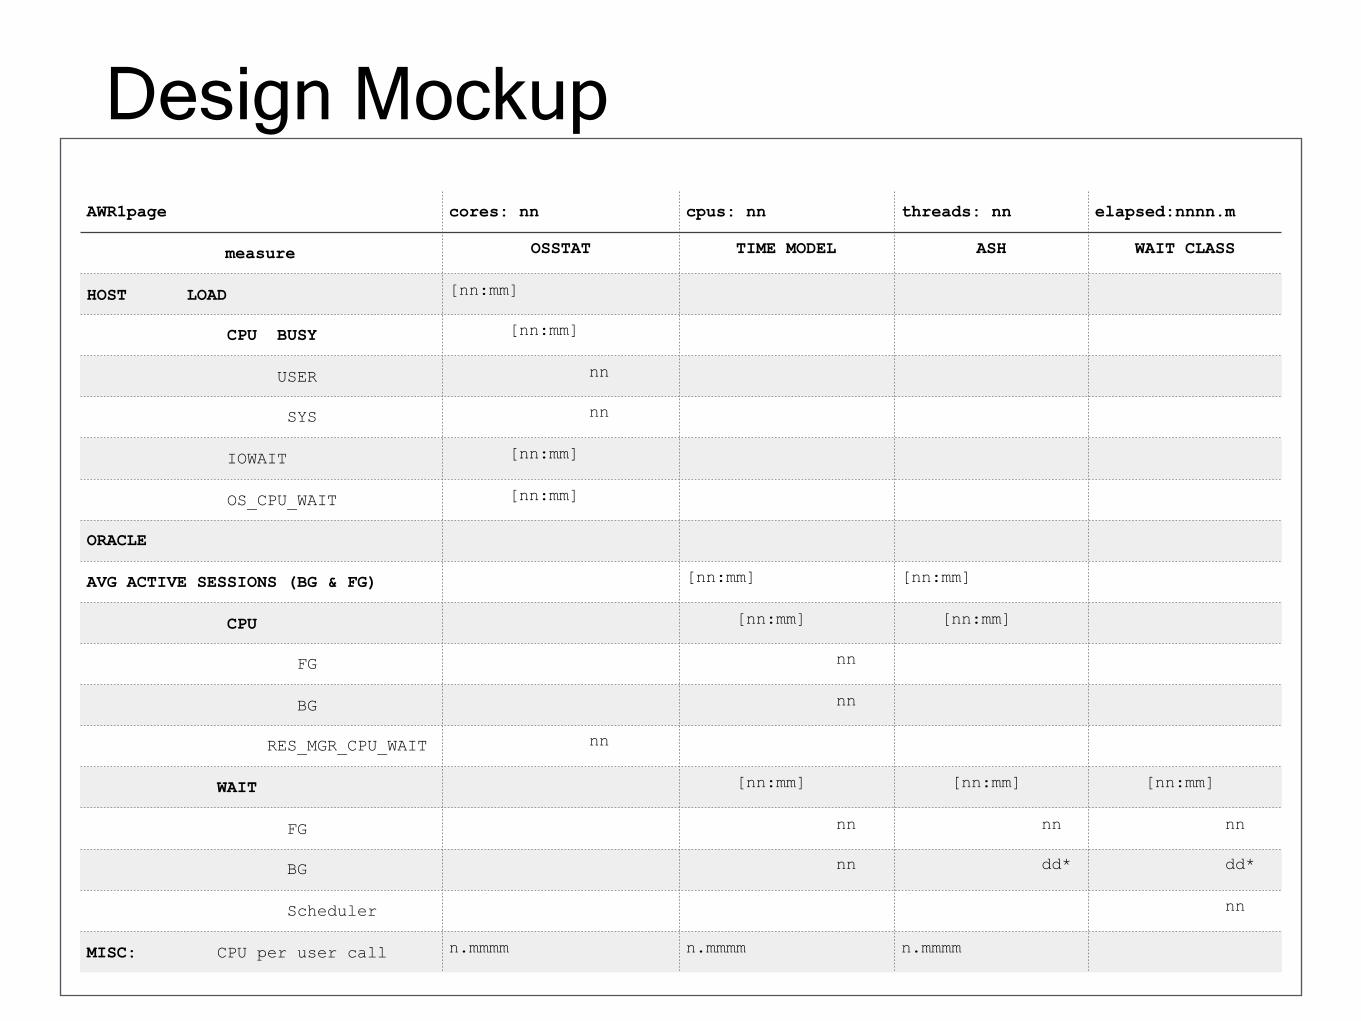
Design MockupAWR1page cores: nn cpus: nn threads: nn elapsed:nnnn.m
measure OSSTAT TIME MODEL ASH WAIT CLASS
HOST LOAD [nn:mm]
CPU BUSY [nn:mm]
USER nn
SYS nn
IOWAIT [nn:mm]
OS_CPU_WAIT [nn:mm]
ORACLE
AVG ACTIVE SESSIONS (BG & FG) [nn:mm] [nn:mm]
CPU [nn:mm] [nn:mm]
FG nn
BG nn
RES_MGR_CPU_WAIT nn
WAIT [nn:mm] [nn:mm] [nn:mm]
FG nn nn nn
BG nn dd* dd*
Scheduler nn
MISC: CPU per user call n.mmmm n.mmmm n.mmmm

Design notes• AAS = Average Active [ Sessions | Processes | Threads| Cores ]
• instrumentation time / elapsed time
• All numbers on the sparse matrix are in AAS
• Comparable measures from different sources on same line
• Indentation and vertical position represent decomposition
• Some cells show core-normalized AAS
• [nn:mm] where nn=AAS, mm=AAS/cores

version 2c: 634 lines of awk
AWR1page
file: awrKC.txt platform: Linux x86 64-bit cores: 36 RAC: NO cpus: 72 release: 12.1.0.2.0 threads/core: 2 elapsed: 2.02 (min) sessions(end): 56 snaps: 1
======================================================================================================================== measure | OSSSTAT | TIME MODEL | ASH | WAIT CLASS ======================================================================================================================== HOST LOAD [7.80:0.22]
CPU BUSY [5.99:0.17] USER 2.27 SYS 3.72
IOWAIT [3.00:0.08] OS_CPU_WAIT N/A ........................................................................................................................ ORACLE AVERAGE ACTIVE SESSIONS (BG+FG) [4.98:0.14] [4.58:0.13]
CPU [2.02:0.06] [0.50:0.01] FG 2.00 BG 0.01 RSRC_MGR_CPU_WAIT N/A
WAIT [2.96:0.08] [4.08:0.11] [4.32:0.12] FG 2.96 4.32 BG 0.00 *0.00 IOWAIT 4.32 FG 4.32 Scheduler 0.00 ........................................................................................................................ MISC CPU per call (ms) 3781.98 10.50 312.50 user calls/sec 1.58
CPU bound?

end of part 1

AWR1page (part 2)Sanity checking time instrumentation in AWR Reports
By: JB
Two originating case studies
• 1 : Benchmarking I/O subsystems with Oracle (aka “being a SLOB”)
• 2 : Random question on AskTom about strange numbers in AWR

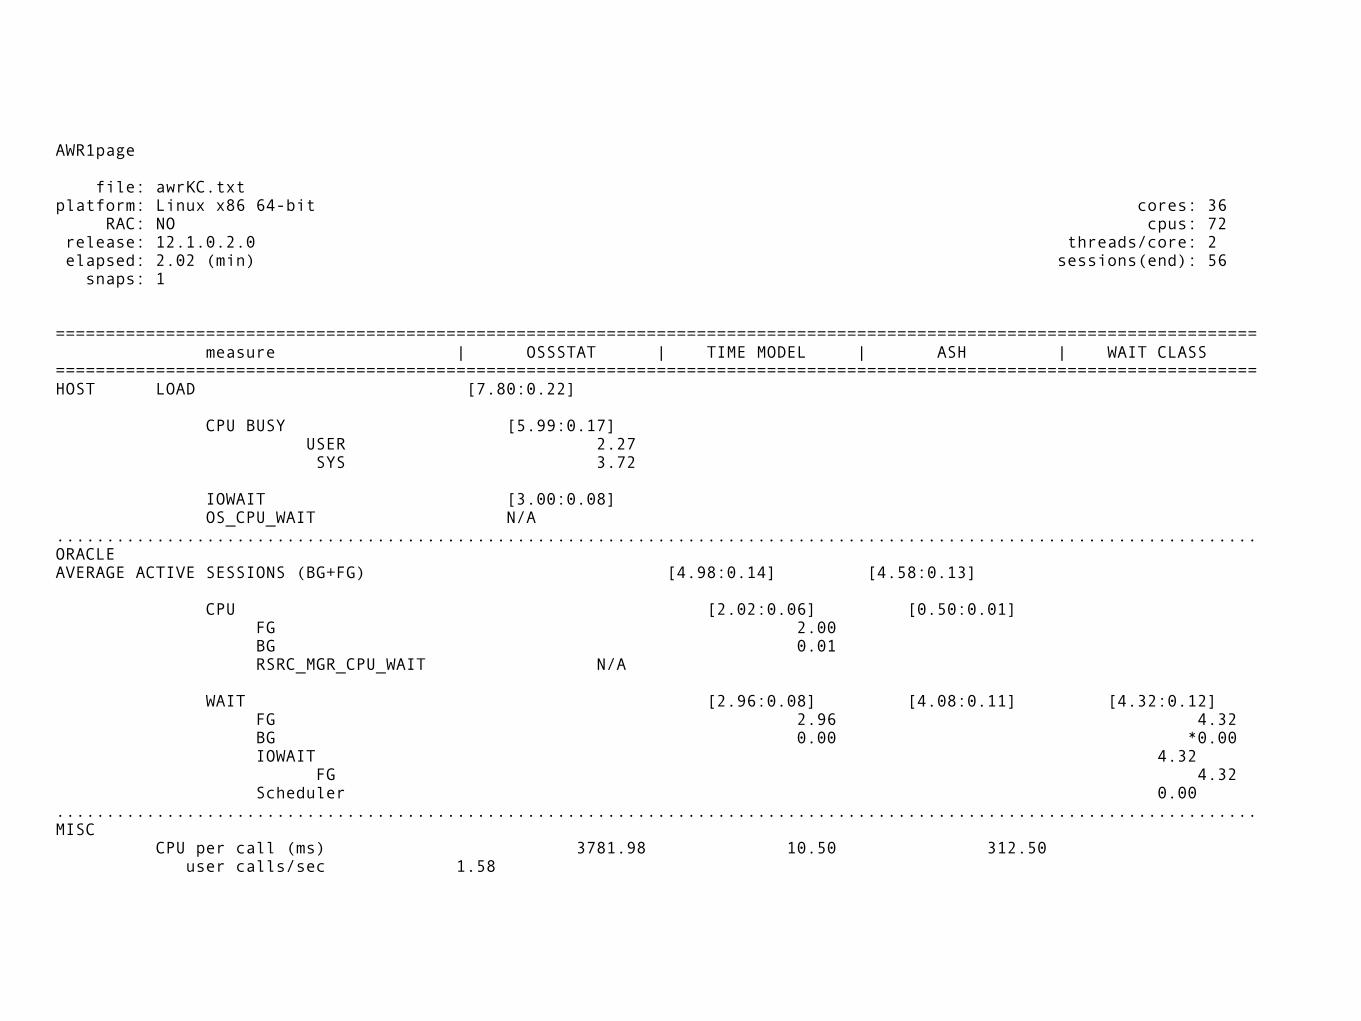
Case #1
AWR1page
file: awrKC.txt platform: Linux x86 64-bit cores: 36 RAC: NO cpus: 72 release: 12.1.0.2.0 threads/core: 2 elapsed: 2.02 (min) sessions(end): 56 snaps: 1
======================================================================================================================== measure | OSSSTAT | TIME MODEL | ASH | WAIT CLASS ======================================================================================================================== HOST LOAD [7.80:0.22]
CPU BUSY [5.99:0.17] USER 2.27 SYS 3.72
IOWAIT [3.00:0.08] OS_CPU_WAIT N/A ........................................................................................................................ ORACLE AVERAGE ACTIVE SESSIONS (BG+FG) [4.98:0.14] [4.58:0.13]
CPU [2.02:0.06] [0.50:0.01] FG 2.00 BG 0.01 RSRC_MGR_CPU_WAIT N/A
WAIT [2.96:0.08] [4.08:0.11] [4.32:0.12] FG 2.96 4.32 BG 0.00 *0.00 IOWAIT 4.32 FG 4.32 Scheduler 0.00 ........................................................................................................................ MISC CPU per call (ms) 3781.98 10.50 312.50 user calls/sec 1.58
Decent-sized Linux system running Oracle 12
DB Time < DB CPU + Wait => CPU under (IO) wait
nontrivial IO wait
CPU ok
bedrock
IO wait = 1 aas CPU + 3 aas wait

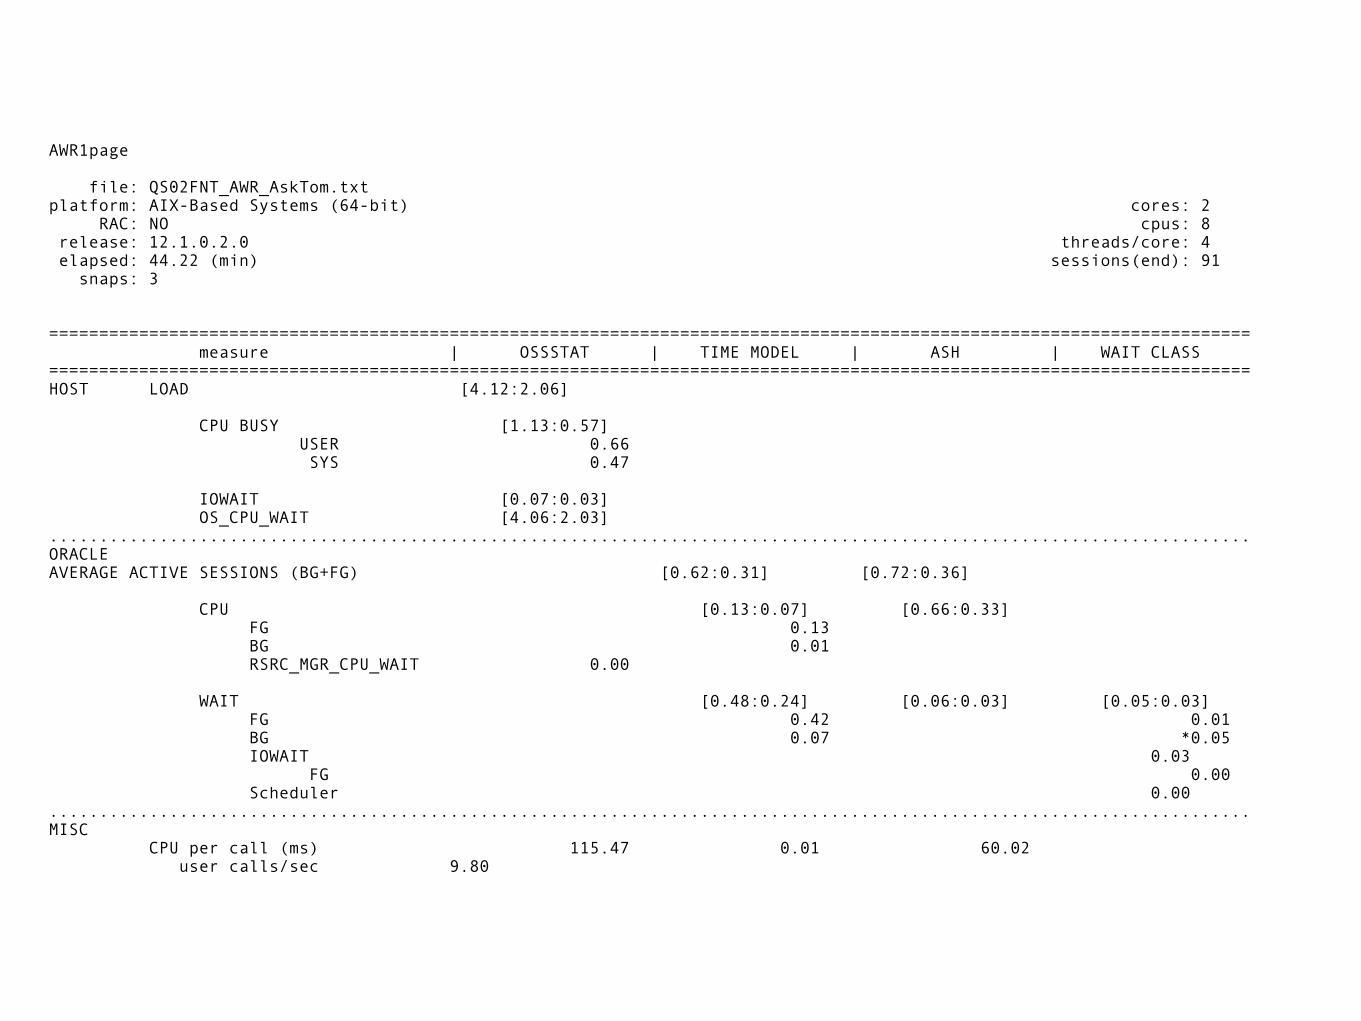
Case #2
AWR1page
file: QS02FNT_AWR_AskTom.txt platform: AIX-Based Systems (64-bit) cores: 2 RAC: NO cpus: 8 release: 12.1.0.2.0 threads/core: 4 elapsed: 44.22 (min) sessions(end): 91 snaps: 3
======================================================================================================================== measure | OSSSTAT | TIME MODEL | ASH | WAIT CLASS ======================================================================================================================== HOST LOAD [4.12:2.06]
CPU BUSY [1.13:0.57] USER 0.66 SYS 0.47
IOWAIT [0.07:0.03] OS_CPU_WAIT [4.06:2.03] ........................................................................................................................ ORACLE AVERAGE ACTIVE SESSIONS (BG+FG) [0.62:0.31] [0.72:0.36]
CPU [0.13:0.07] [0.66:0.33] FG 0.13 BG 0.01 RSRC_MGR_CPU_WAIT 0.00
WAIT [0.48:0.24] [0.06:0.03] [0.05:0.03] FG 0.42 0.01 BG 0.07 *0.05 IOWAIT 0.03 FG 0.00 Scheduler 0.00 ........................................................................................................................ MISC CPU per call (ms) 115.47 0.01 60.02 user calls/sec 9.80
AIX = CPU red fag
CPU bound? maybe
small systemSMT = 4
TM ~ ASH ASH ~ Wait
DB Time > DB CPU + Wait => CPU under-report or run-queue
0.56
0.06
??

end of part 2