AWearableMulti-SensorSystem ...
155
Vital EKG A Wearable Multi-Sensor System for Medical Diagnostics and Patient Monitoring Giacomo Zanichelli A Master’s esis submitted to the Department of Electronics and Telecommunications in partial fulfillment of the requirements for Master Degree in Electronic Engineering of Politecnico di Torino. Torino Friday 14 th December, 2018 Advisor: Prof. Eros Pasero Co-Advisor: Vincenzo Randazzo Committee President: Prof. Carlo Ricciardi esis Committee: Prof. Eugenio Brusa Prof. Matteo Cocuzza Prof. Roberto Garello Prof. Fabrizio Giorgis Prof. Andrea Lamberti Prof. Eros Pasero Prof. Paolo Prinetto Prof. Carlo Ricciardi
Transcript of AWearableMulti-SensorSystem ...

Vital EKGAWearable Multi-Sensor System
for Medical Diagnostics and Patient Monitoring
Giacomo Zanichelli
A Master’s Thesis submitted to theDepartment of Electronics and Telecommunications
in partial fulfillment of the requirements for Master Degree inElectronic Engineering of Politecnico di Torino.
Torino
Friday 14th December, 2018
Advisor:Prof. Eros Pasero
Co-Advisor:Vincenzo Randazzo
Committee President:Prof. Carlo Ricciardi
Thesis Committee:Prof. Eugenio BrusaProf. Matteo CocuzzaProf. Roberto GarelloProf. Fabrizio GiorgisProf. Andrea LambertiProf. Eros PaseroProf. Paolo PrinettoProf. Carlo Ricciardi

ii
Colophon
Typeset in X ETEXand the memoir class
created by Peter Wilson.
The body text is set 12ptwith Minion Pro.
Other fonts includeMonaco and Myriad Pro.
Drawings typeset inTikZ/PGF packages.
Credits
Vincenzo Randazzofor the Android™app.
Elisa Valli and Alessia Maurofor the case design.
Licenced under the CreativeCommons Attribution 4.0
International Licence.
To view a copy of this licence,visit creativecommons.org/
licenses/by/4.0/.
Research Places
NEURONICA LABS
Android is a trademark ofGoogle LLC.
Proudly Written by
Giacomo Zanichelli

iii
Executive Summary
Continuous vital signs monitoring is of utmost importance for many people.Consequently, devices able to perform suchmonitoring, also called PersonalHealthSystem (PHS), have been gaining a lot of research andmarket interest in the last fewyears.
This thesis work deals with the design of a multi-sensor PHS able to performI-Lead EKG,measure heart rate and Peripheral CapillaryOxygen Saturation (SpO2)as well as monitoring skin temperature and humidity and tracking activity.
VitalEKGhas awrist band form factor. This choice simplifies themanagementof the device with respect to chest straps; EKG trace and SpO2 and heart ratereadings are offered on demand and require the user to place two fingers on thedevice.
Vital EKG has been designed using off the shelf, modern surface mountcomponents. The layout of a Semi-Flex printed circuit board is also considered toaccount for assembly in the 3D printed case.
Heart rate and SpO2 measurements accuracy have been checked against aprofessional Vital Sign Simulator; furthermore, real-life tests have been performedand results have been confronted with a professional Fingertip Pulse Oximeter.
EKG traces provided byVitalEKGhave been tested aswell against professionalmedical equipment.
To sum up, further studies could use hardware and firmware developed in thiswork to provide detailed informations about anomalies of the heart, such as atrialfibrillation.


To the memory of my grandfather Giuliano.


Acknowledgments
I would like to express my gratitude to Prof. Eros Pasero, Vincenzo and Jacopo, whoguided me throughout the development of this work.
This thesis would not have been possible without the precious support of my momAlessandra, my dad Massimo, my brother Daniele and my grandmother Teresa, whoencouraged me everyday.
My friends Luca, Elvio, Marcello, Alessandra and Leonardo, Elisa and Antonio,Kristjane and Marco and my colleagues Corrado, Christian and Giuseppe also deserve aspecial mention because I would not be what I am without them.
Finally, I would like to thank my girlfriend Sonia, who demonstrated incrediblestrength and patience during these last few months of interminable work at the lab.Anyone would have given up in front of my stubborness and irreparable temper.
vii


ix
Extended Summary
In the last few years, many studies have shown the possibility of developingcompact electronic devices able to monitor continuously most of vital signs. Thesedevices are often called Personal Health Systems (PHS), because are intended toaccompany the user during most, if not all, the daily activities.
Heart rate and activity are routinely and reliably tracked using single LEDPhotoplethysmography (PPG) and compact MEMS motion units, respectively.Other parameters, like SpO2 and blood pressure, are already measured easily usingnon-invasive techniques, which however require the user to physically perform anaction and use a dedicated tool (e.g. cuff-based blood pressure measurement).
This thesis work focuses on the design and production of a new generation ofmulti-sensor, compact electronic devices potentially able tomeasure a large numberof parameters. Vital EKG is available in a wrist-band, watch-like form factor.
The electronic circuitry is based on low-cost off-the-shelf components. Heartrate and SpO2 measurements are performed exploiting PPG technique; the sensorof choice is Maxim Integrated MAX30102, which includes both red and infraredLEDs and photodetector in a small Organic Land Grid Array (OLGA) package.Skin temperature and humidity, as well as tracking of activity, have been consideredwhile compiling the specifications for Vital EKG to make it a complete PHS ableto give a fast response about the general health status of the user.
A single lead Electrocardiogram (EKG) analog front-end completesVitalEKG.The metal electrodes are placed on the case. The first is in contact with the skin ofthe wrist; the second, located in the top part of the case, is placed beside the PPGsensor. This positioning allows the user to perform concurrent acquisitions of 10 s,thus minimizing the required time, the number of actions required by the user andenabling the correlation of the signals to gain more informations about the healthstatus (promising studies show the possibility of computing the blood pressure inthis way).
The design of the Vital EKG has been based on the older ECG Watch byNeuronica Labs, Politecnico di Torino. The analog front-end has been completelyredesigned with modern, ultra low-power components. Moreover, it has beensimplified greatly by replacing most of the analog filters with digital filters.
Most of the digital processing is performed onboard. A novel PPG algorithmhas been designed, implemented and tested to produce reliable heart rate andSpO2 values. A more standard autocorrelation-based routine is used to confirmthe results of the processing, thus allowing to establish a confidence level for themeasurement. The processing is performed in batch; however, most of the routinesare designed to be easily customizable and extendable to fully-online use cases.
EKG processing has been kept simple and included only to demonstrate thecapabilities of the analog front-end. Currently, heavy distortions are present as aconsequence of a steep High-Pass filter. A follow-up work is already in progress toimprove Vital EKG from this point of view.

x
The absence of a screen does not incur in more difficult interaction withthe user and ensures a significant saving on battery power. Bluetooth 4.2 is thecommunication protocol of choice, due to its ubiquitous presence on smart devices.An application (currently only for Android devices) is in development at NeuronicaLabs. The user interface has been designed to be extremely easy to use. Vital EKGuser base is believed to be the elderly, with particular focus on people affectedby heart issues which would benefit from continuous monitoring. A state basedfirmware allows the device to be responsive in all situations, minimizing deadlockconditions. To further enhance the user experience, three LEDs have been includedin the design to inform when the device is on and the battery is in recharge andfully charged. In this preliminary prototype, LEDs color are not compliant with CEregulations.
Vital EKG is powered by a small rechargable battery with a capacity of300mAh. Fuel gauge dedicated circuitry allows the user to always have up todate information about the state of charge of the device. Low power design allowsto perform an estimated number of acquisitions greater than 3000 with a singlecharge.
A few hardware problems have been detailed in this document. This firstprototype of Vital EKG has always been intended as a proof of concept, to becompleted and extended in future works. A Semi-Flex Printed Circuit Board(PCB) has been planned for the next hardware revision, to minimize the numberof connectors on the board, improve the quality of the signals and further reducethe assembly costs.
This document is organized as follows. The first Chapter introduces the topicwith a general description of typical features of a PHS.
Chapter 2 focuses on the analysis of vital signs of interest for this work. Adescription of the human heart is also given, since this provides the basis for bothEKG and PPG techniques.
Chapter 3 introduces a few devices which are already on themarket, describingtheir positive and negative aspects.
Chapter 4 and 5 are the core of the work. The former deals with the design ofVital EKG from a hardware point of view; the latter is about firmware and includesa detailed description of the algorithms used for signal processing.
Chapter 6 presents the verification of Vital EKGand highlights a few problemsencountered during the tests.
Finally, Chapter 7 closes the document by underlining design faults andsuggesting a direction for future development of Vital EKG.

Contents
Contents xi
List of Figures xiv
List of Tables xvi
List of Listings xvii
Acronyms xix
1 Introduction 11.1 Requirements . . . . . . . . . . . . . . . . . . . . . . . . . . . . . . . . 3
2 Vital Signs 52.1 The Human Heart . . . . . . . . . . . . . . . . . . . . . . . . . . . . . 5
2.1.1 Anatomy . . . . . . . . . . . . . . . . . . . . . . . . . . . . . . 52.1.2 The Cardiac Cycle . . . . . . . . . . . . . . . . . . . . . . . . . 72.1.3 The Cardiac Conduction System . . . . . . . . . . . . . . . . . 8
2.2 Electrocardiogram . . . . . . . . . . . . . . . . . . . . . . . . . . . . . 102.2.1 Standard 12-lead EKG . . . . . . . . . . . . . . . . . . . . . . . 102.2.2 I-Lead EKG . . . . . . . . . . . . . . . . . . . . . . . . . . . . 17
2.3 Heart Rate and Blood Oxygen Level . . . . . . . . . . . . . . . . . . . . 172.3.1 Theory of Photoplethysmography . . . . . . . . . . . . . . . . 17
3 State of the Art 213.1 Chest Straps . . . . . . . . . . . . . . . . . . . . . . . . . . . . . . . . 21
3.1.1 QARDIOCORE . . . . . . . . . . . . . . . . . . . . . . . . . . 213.1.2 CALM. . . . . . . . . . . . . . . . . . . . . . . . . . . . . . . . 233.1.3 Discussion . . . . . . . . . . . . . . . . . . . . . . . . . . . . . 24
3.2 Wrist Trackers . . . . . . . . . . . . . . . . . . . . . . . . . . . . . . . 243.2.1 FITBIT . . . . . . . . . . . . . . . . . . . . . . . . . . . . . . . 24
3.3 Finger Clips . . . . . . . . . . . . . . . . . . . . . . . . . . . . . . . . . 24
xi
xii Contents
3.4 ECG Sensor . . . . . . . . . . . . . . . . . . . . . . . . . . . . . . . . . 25
4 Vital EKG 274.1 Requirements . . . . . . . . . . . . . . . . . . . . . . . . . . . . . . . . 274.2 Specifications . . . . . . . . . . . . . . . . . . . . . . . . . . . . . . . . 294.3 Hardware . . . . . . . . . . . . . . . . . . . . . . . . . . . . . . . . . . 30
4.3.1 Circuit Design . . . . . . . . . . . . . . . . . . . . . . . . . . . 304.3.2 PCB Layout . . . . . . . . . . . . . . . . . . . . . . . . . . . . 44
4.4 Case Design and Fabrication . . . . . . . . . . . . . . . . . . . . . . . . 46
5 Firmware 495.1 BLE 4.2 . . . . . . . . . . . . . . . . . . . . . . . . . . . . . . . . . . . 49
5.1.1 Physical Layer . . . . . . . . . . . . . . . . . . . . . . . . . . . 495.1.2 Host and Controller . . . . . . . . . . . . . . . . . . . . . . . . 505.1.3 GATT Layer . . . . . . . . . . . . . . . . . . . . . . . . . . . . 505.1.4 GAP Layer . . . . . . . . . . . . . . . . . . . . . . . . . . . . . 525.1.5 LE Data Length Extension . . . . . . . . . . . . . . . . . . . . 535.1.6 Security . . . . . . . . . . . . . . . . . . . . . . . . . . . . . . 535.1.7 Throughput . . . . . . . . . . . . . . . . . . . . . . . . . . . . 54
5.2 General Architecture . . . . . . . . . . . . . . . . . . . . . . . . . . . . 545.2.1 BLE Dispatcher . . . . . . . . . . . . . . . . . . . . . . . . . . 555.2.2 MAX30102 Manager . . . . . . . . . . . . . . . . . . . . . . . 575.2.3 EKG Manager . . . . . . . . . . . . . . . . . . . . . . . . . . . 585.2.4 Monitoring Task . . . . . . . . . . . . . . . . . . . . . . . . . . 605.2.5 Flash Memory Manager . . . . . . . . . . . . . . . . . . . . . . 615.2.6 Memory Configuration . . . . . . . . . . . . . . . . . . . . . . 61
5.3 Digital Signal Processing . . . . . . . . . . . . . . . . . . . . . . . . . . 615.3.1 PPG . . . . . . . . . . . . . . . . . . . . . . . . . . . . . . . . 615.3.2 EKG . . . . . . . . . . . . . . . . . . . . . . . . . . . . . . . . 705.3.3 QRS complexes identification . . . . . . . . . . . . . . . . . . . 76
5.4 Android Application . . . . . . . . . . . . . . . . . . . . . . . . . . . . 76
6 Testing and Discussion 796.1 Patient Simulator . . . . . . . . . . . . . . . . . . . . . . . . . . . . . . 79
6.1.1 EKG . . . . . . . . . . . . . . . . . . . . . . . . . . . . . . . . 796.2 Testing on Patients . . . . . . . . . . . . . . . . . . . . . . . . . . . . . 82
6.2.1 EKG . . . . . . . . . . . . . . . . . . . . . . . . . . . . . . . . 836.2.2 MAX30102 . . . . . . . . . . . . . . . . . . . . . . . . . . . . . 83
7 Conclusions 877.1 Limitations and Future Work . . . . . . . . . . . . . . . . . . . . . . . 87

Contents xiii
7.1.1 Pull-up Resistors . . . . . . . . . . . . . . . . . . . . . . . . . . 877.1.2 Micro SD card Support . . . . . . . . . . . . . . . . . . . . . . 877.1.3 TI REF2033 Symbol Error . . . . . . . . . . . . . . . . . . . . . 887.1.4 TDK Invensense MPU-9250 Connection Error . . . . . . . . . 897.1.5 MAX30102 Errors . . . . . . . . . . . . . . . . . . . . . . . . . 897.1.6 Acquisition and Processing Global Buffer . . . . . . . . . . . . 907.1.7 EKG Processing . . . . . . . . . . . . . . . . . . . . . . . . . . 907.1.8 Calibration of TI HDC2010 . . . . . . . . . . . . . . . . . . . . 907.1.9 TDK Invensense MPU-9250 Motion Tracking Algorithm . . . . 917.1.10 Blood Pressure Estimation . . . . . . . . . . . . . . . . . . . . 91
7.2 Concluding Remarks . . . . . . . . . . . . . . . . . . . . . . . . . . . . 91
A PCB Design Material 93A.1 Gerber Files . . . . . . . . . . . . . . . . . . . . . . . . . . . . . . . . . 93
B Reference 97B.1 BLE Dispatcher Commands . . . . . . . . . . . . . . . . . . . . . . . . 97B.2 BLE Dispatcher Status Codes . . . . . . . . . . . . . . . . . . . . . . . 97B.3 I2C Events . . . . . . . . . . . . . . . . . . . . . . . . . . . . . . . . . 100B.4 NV Events . . . . . . . . . . . . . . . . . . . . . . . . . . . . . . . . . 100B.5 BLE Dispatcher Response Messages . . . . . . . . . . . . . . . . . . . . 101
B.5.1 Profile Messages . . . . . . . . . . . . . . . . . . . . . . . . . . 101B.5.2 EKG Messages . . . . . . . . . . . . . . . . . . . . . . . . . . . 102B.5.3 MAX30102 Messages . . . . . . . . . . . . . . . . . . . . . . . 103B.5.4 Other Messages . . . . . . . . . . . . . . . . . . . . . . . . . . 105
B.6 MAX30102 Events . . . . . . . . . . . . . . . . . . . . . . . . . . . . . 106B.7 EKG Events . . . . . . . . . . . . . . . . . . . . . . . . . . . . . . . . . 108B.8 Monitoring Task Events . . . . . . . . . . . . . . . . . . . . . . . . . . 109
C MAX30102 Manager 111
D EKGManager 121
Bibliography 129

List of Figures
21 Anatomy of the heart . . . . . . . . . . . . . . . . . . . . . . . . . . . . . . 622 Cardiac Cycle . . . . . . . . . . . . . . . . . . . . . . . . . . . . . . . . . . 823 Cardiac Conduction System . . . . . . . . . . . . . . . . . . . . . . . . . . 924 The Einthoven’s Triangle. . . . . . . . . . . . . . . . . . . . . . . . . . . . . 1225 EKG Waves . . . . . . . . . . . . . . . . . . . . . . . . . . . . . . . . . . . 1426 Standard 12-lead EKG . . . . . . . . . . . . . . . . . . . . . . . . . . . . . 1527 The hexaxial reference system. . . . . . . . . . . . . . . . . . . . . . . . . . 1628 Arteries expansion . . . . . . . . . . . . . . . . . . . . . . . . . . . . . . . 19
31 QARDIO QARDIOCORE . . . . . . . . . . . . . . . . . . . . . . . . . . . 2232 CALM. . . . . . . . . . . . . . . . . . . . . . . . . . . . . . . . . . . . . . 2333 FITBIT Charge 3. . . . . . . . . . . . . . . . . . . . . . . . . . . . . . . . . 25
41 Texas Instruments (TI) CC2640R2FRGZ . . . . . . . . . . . . . . . . . . 3142 MCU section . . . . . . . . . . . . . . . . . . . . . . . . . . . . . . . . . . 3343 GPIO section . . . . . . . . . . . . . . . . . . . . . . . . . . . . . . . . . . 3444 Power section . . . . . . . . . . . . . . . . . . . . . . . . . . . . . . . . . . 3645 RF analog front end options. . . . . . . . . . . . . . . . . . . . . . . . . . . 3746 Analog front-end schematic. . . . . . . . . . . . . . . . . . . . . . . . . . . 3847 Simulation of differential section. . . . . . . . . . . . . . . . . . . . . . . . 4048 Simulation of filter section. . . . . . . . . . . . . . . . . . . . . . . . . . . 4249 Digital peripheral schematic. . . . . . . . . . . . . . . . . . . . . . . . . . 43410 Summary of case design. . . . . . . . . . . . . . . . . . . . . . . . . . . . . 47
51 Communication diagram . . . . . . . . . . . . . . . . . . . . . . . . . . . 5652 MAX30102 output . . . . . . . . . . . . . . . . . . . . . . . . . . . . . . . 6253 IR Butterworth Low Pass Filter (LPF) . . . . . . . . . . . . . . . . . . . . . 6454 IR Butterworth LPF . . . . . . . . . . . . . . . . . . . . . . . . . . . . . . 6555 Threshold locations . . . . . . . . . . . . . . . . . . . . . . . . . . . . . . . 6756 Frequency Domain (FD) Digital Signal Processing (DSP) . . . . . . . . . . 6957 Autocorrelation Function (ACF) of Infrared (IR) channel . . . . . . . . . . 71
xiv

List of Figures xv
58 Raw EKG . . . . . . . . . . . . . . . . . . . . . . . . . . . . . . . . . . . . 7259 Spectrum of raw EKG . . . . . . . . . . . . . . . . . . . . . . . . . . . . . 73510 Comb Notch Filter . . . . . . . . . . . . . . . . . . . . . . . . . . . . . . . 74511 Comb filtered EKG . . . . . . . . . . . . . . . . . . . . . . . . . . . . . . . 75512 Final EKG . . . . . . . . . . . . . . . . . . . . . . . . . . . . . . . . . . . . 77513 Android app rendering. Results window. . . . . . . . . . . . . . . . . . . . 78
61 ProSim 3 waveform 1 . . . . . . . . . . . . . . . . . . . . . . . . . . . . . . 8062 ProSim 3 waveform 2 . . . . . . . . . . . . . . . . . . . . . . . . . . . . . . 8063 ProSim 3 waveform 3 . . . . . . . . . . . . . . . . . . . . . . . . . . . . . . 8164 ProSim 3 waveform 4 . . . . . . . . . . . . . . . . . . . . . . . . . . . . . . 8165 ProSim 3 waveform 5 . . . . . . . . . . . . . . . . . . . . . . . . . . . . . . 8266 ProSim 3 waveform 6 . . . . . . . . . . . . . . . . . . . . . . . . . . . . . . 8367 Faulty FIFO acquisition . . . . . . . . . . . . . . . . . . . . . . . . . . . . 84
71 REF2033 Symbol Error . . . . . . . . . . . . . . . . . . . . . . . . . . . . . 8872 MPU-9250 Connection Error . . . . . . . . . . . . . . . . . . . . . . . . . 89
A1 Top Layer . . . . . . . . . . . . . . . . . . . . . . . . . . . . . . . . . . . . 93A2 Bottom Layer . . . . . . . . . . . . . . . . . . . . . . . . . . . . . . . . . . 94A3 Assembly Top Layer . . . . . . . . . . . . . . . . . . . . . . . . . . . . . . 94A4 Assembly Bottom Layer . . . . . . . . . . . . . . . . . . . . . . . . . . . . 95
List of Tables
41 Vital EKG Specifications . . . . . . . . . . . . . . . . . . . . . . . . . . . . 2942 Bessel LPF specification . . . . . . . . . . . . . . . . . . . . . . . . . . . . 4143 MAX30102 LEDs specifications . . . . . . . . . . . . . . . . . . . . . . . . 44
61 PPG Results . . . . . . . . . . . . . . . . . . . . . . . . . . . . . . . . . . . 85
xvi

List of Listings
C.0.1 MAX30102 Manager finite state machine. . . . . . . . . . . . . . . . . 111D.0.1 EKG Manager finite state machine. . . . . . . . . . . . . . . . . . . . . 121
xvii


Acronyms
ACF Autocorrelation Function. xiv, 69–71
ADC Analog-to-Digital Converter. 23, 25, 29, 32, 41, 44, 55, 58, 59, 70, 72, 79, 89
API Application Public Interface. 55
ATT Attribute Profile. 50
AV Node atrioventricular node. 10, 14, 15
BLE Bluetooth Low Energy. 22–24, 26, 28, 29, 32, 37, 49–57, 59, 61, 76, 97, 100–106,109
Bluetooth SIG Bluetooth Special Interest Group. 51
BPF Band Pass Filter. 68
BPM Beats per Minute. 66, 70
CCS Code Composer Studio. 55
CO2 Carbon Dioxide. 18
DCT Discrete Cosine Transform. 70
DFT Discrete Fourier Transform. 68, 69
DSP Digital Signal Processing. xiv, 30, 57, 61, 62, 64, 70, 83, 87, 90
EKG Electrocardiogram. ix, x, xiv, xvii, 2, 7, 10, 11, 13–17, 21–30, 35, 39, 41, 44, 45,50, 54, 56–60, 70, 72–77, 79–83, 90, 91, 97–99, 101–103, 106–109, 121
FD Frequency Domain. xiv, 62, 68, 69, 84
FFT Fast Fourier Transform. 69, 70, 73, 79
xix

xx Acronyms
FIFO First-In, First-Out. 42, 44, 57, 58, 83, 84, 89, 90, 98, 106
FSK Frequency-Shift Keying. 49
FSM Finite State Machine. 57–60, 107, 109
GAP Generic Access Profile. 51, 52, 55, 56
GATT Generic Attribute Profile. 50–52
GPIO General Purpose Input Output. 32, 34, 35
Hb Hemoglobin. 17, 18
HCI Host Controller Interface. 50, 53
HHb Deoxyhemoglobin. 18, 19
HR Heart Rate. 2, 20, 24, 28, 29, 44, 61, 62, 64, 66, 68–71, 84, 85, 91, 105
I2C Inter Integrated Circuit. 32, 35, 42, 44, 45, 55, 100
IDE Integrated Development Environment. 55
IIR Infinite Impulse Response. 63, 66, 68, 69, 72
IR Infrared. xiv, 18, 19, 24, 57, 62, 66, 68, 70, 83
L2CAP Logical Link Control and Adaptation Layer Protocol. 50, 54
LA Left Arm Electrode. 10, 11, 13, 29, 79
LE Low Energy. 50, 53
LiPo Lithium-Ion Polymer. 22, 23, 30, 35
LL Left Leg Electrode. 10, 11, 13
LPF Low Pass Filter. xiv, 41, 42, 63, 64, 68, 76
MCU Microcontroller. 30, 32
MUX Multiplexer. 32
O2 Oxygen Molecules. 17, 18
O2Hb Oxyhemoglobin. 18–20

Acronyms xxi
OLGA Organic Land Grid Array. ix, 44
OpAmp Operational Amplifier. 39–41
PCB Printed Circuit Board. x, 30, 37, 44–46, 87–89, 93
PDU Protocol Data Unit. 50, 53, 54, 59
PHS Personal Health System. iii, ix, x, 1–3, 24, 27, 91
PHY Physical Layer. 49, 50, 52–54
PPG Photoplethysmography. ix, x, 17, 20, 24–26, 29, 57, 59, 61, 71, 75, 79, 83, 84,91, 97
RA Right Arm Electrode. 10, 11, 13, 29, 79
RL Right Leg Electrode. 10
RTOS Real-Time Operating System. 54, 55, 60, 61
SA Node sinoatrial node. 8, 10, 14, 16
SCE Sensor Controller Engine. 30, 32, 61
SDK Software Development Kit. 55
SDU Service Data Unit. 50
SMT Surface Mount Technology. 46
SNR Signal-To-Noise Ratio. 20, 25, 85
SPI Serial Peripheral Interface. 32, 42, 45, 55
SpO2 Peripheral Capillary Oxygen Saturation. iii, ix, 2, 17, 20, 24, 28, 29, 44, 61–63,66–68, 83–85, 91
TD Time Domain. 62–64, 68, 79, 84
TI Texas Instruments. xiv, 29–32, 35, 37, 39, 41, 42, 44–46, 49, 50, 53–55, 57, 58,60–62, 72, 87, 88, 90
UART Universal Asynchronous Receiver-Transmitter. 45, 46
UUID Universal Unique Identifier. 51, 52
WLCSP Wafer Level Chip Scale Package. 42


CHAPTER 1Introduction
Wearable Health Devices have been gaining a lot of attention in thelast few years. Two main concepts which are critical to understand thereasons are Personal Health System (PHS) and patient empowerment.A PHS, in its generic definition, is a device which is able to monitor the
health status of an individual. Besides physical devices, it can also include smartphoneapplication or a combination of both. The purpose of these devices are summarizedbelow:
• enable continuous health monitoring over extended periods of time (days/weeks);
• favour domestic monitoring of vital parameters and decrease saturation of familymedical practitioners and hospitals in developed countries;
• increase diffusion of vital signs tests in less developed countries by drasticallyreducing costs;
• help the recovery from a medical intervention or body injury;
• evaluate general health status ofworkers in hazardous situations and environments,such as firefighters, powerline technicians and military personnel.
The technology related to themonitoring ofmany vital signs has developed quickly inthe last few years. Traditional testing methodologies require people to physically moveto an hospital or laboratory to perform a test. This requires a considerable amount oftime, which can be broadly split into the following categories:
• waiting lists - often waiting lists to perform routine tests which are included inthe national healthcare are several months long due to hospitals and laboratoriessaturation [1];
1

2 Introduction
• commuting time - large cities and rural areas inhabitants may experience longcommutes to reach hospitals or laboratories;
• processing time - analyses require the intervention of specialized technicianswhich process the samples manually. As a consequence, results are available witha delay of several days.
Furthermore, many vital signs, such Heart Rate (HR), Peripheral Capillary OxygenSaturation (SpO2), blood pressure and Electrocardiogram (EKG) (strictly speakingEKG is not a vital sign but can be seen as an augmentation of the HR), benefit from acontinuous monitoring over long periods of time. This is clearly very difficult to achieveusing traditional test methodologies, despite a dynamic EKG technique, first introducedin 1961 by Norman J. Holter, is routinely used to partially overcome this problem [2].Despite its domestic use, it remains a not ideal solution because the test is limited to 24 hand requires the positioning of a full set of electrodes and wires, which affects the dailyroutine.
The responsabilization of patient, or “patient empowerment” as it is often called, is aconcept which has an impact on both developed and less developed countries.
In the first case, overcrowding of medical facilities is an actual problem which stemsfrom thewidespread availability of vital signs tests and their relativemoderate costs, oftencoupled with accomodating medical practitioners. The delocalization of a few simplertests would help to simplify the identification of more serious health problems early: thereduction of the amount of samples specialized technicians need to process would allowa faster publishing of results. Less developed countries face an opposite problem: the lackof structures where health tests can be performed and the relative prohibitely high costsof those make routine check ups not accessible to the vast majority of the population.Also in these cases, a mass produced consumer device would help to monitor generalhealth status and take action when necessary.
The availability of reliable PHS considerably reduces prolonged hospitalization aftertreatment of body injuries and surgeries. In these cases, especiallywhen the interventionsare planned in advance, hospitalization has the only aim to monitor vital signs for anextended period of time to reduce as much as possible the onset of complications [3].
A further use case of wearables is the monitoring of laborers in hazardous fields,such as military personnel, powerline technicians and firefighters. In these cases, theavailability of a PHS would help to reduce the redundancy of individuals performing thesame task for security reasons and discover critical conditions before they can actuallymanifest in dangerous environments.

1.1. Requirements 3
1.1 Requirements
Any wearable device should comply with a few common requirements in order toenter the market successfully. Among others:
• due to their inherent portable nature, wearables should be zero-power or low-powerdevices with a battery life as long as possible;
• wearables should be reliable enough to be used as a solid base for further medicaltests; both false positives and non detected conditions should be minimized;
• continous operation should be ensured; the idea of a PHS intrinsically requirescontinuous health monitoring;
• seamless integration with the daily routine of the user/patient is of foremostimportance; a wearable health device should be worn as often as possible to enablethe discovery of critical conditions and this is possible only if the device features anunobtrusive design, is comfortable and does not block natural body movements;
• data collection and consulting should be user friendly and not time and energyconsuming; today’s widespread diffusion of smart devices and fast and reliablewireless communication technologies pair nicely with this requirement and enablea zero-effort flow of information from the patient to medical staff;
• aesthetic, despite often regarded as a second level requirement by electronicdesigners and not stricly required to enable most of the benefits of wearable healthdevices, is important because it directly affects the willingness of the patient towear the device throughout the day in public;
• the results of themonitoring should be available in real-time to minimize the delayof the treatment;
• cost is an important factor to consider, especially if the device is targeted to lessdeveloped countries.
An in-depth analysis of these requirements and others is carried out in [4].


CHAPTER 2Vital Signs
This chapter intends to give a brief introduction about the principles behindnon invasive automatic vital signs monitoring by exploring anatomy andphysiology of the organs involved, along with benefits and limitations of thetechniques currently in use.
2.1 The Human Heart
Heart related diseases account for a large percentage of the total deaths worldwide,according to the World Health Organization. Ischaemic heart disease and stroke
have been the two biggest killers from 2000 to 2016, reaching almost 27% of the totaldeaths. For this reason, monitoring continuously the health of the heart is consideredparticularly important.
2.1.1 AnatomyFrom a structural point of view, the heart can be described as a couple of muscularpumps with valves. Even though the two pumps share a few common structures, theyare physiologically independent. Thus, it makes sense to talk about right and left heart.
Each half is composed by an atrium and a ventricle. The fundamental structure ofthe atria is alike, even though left and right cavities present substantial differences whichare related to their role. The same holds for ventricles.
Right Atrium
Theright atrium is one of the upper chambers of the heart and is positioned slightly belowits left counterpart. It receives deoxygenated blood which returns from the systemic
5

6 Vital Signs
Figure 21: Anatomy of the heart.
circulation through the superior and inferior vena cava and the coronary sinus. Theatria do not have valves at their inlets to favour the accumulation of blood in the cavities.The superior vena cava is located in the upper and posterior part of the right atrium; itreceives venous return from the upper part of the body. The inferior vena cava receivesinstead venous blood from the inferior part of the body. Since it enters the right atriumat the lower right, back side of the heart, it has valves to prevent blood to flow down viagravity.

2.1. The Human Heart 7
Right Ventricle
The right ventricle is one of the two large chambers of the heart positioned in the lowerpart. It receives deoxygenated blood from the right atrium through the tricuspid valve;the blood is pumped in the pulmonary artery via the pulmonary valve.
Left Atrium
The left atrium is located on the right posterior side of the heart and is separated from theright atriumby the atrial septum. Theblood enters the left atrium through the pulmonaryvein and is pumped into the left ventricle through the mitral valve.
Left Ventricle
The left ventricle is the fourth and last cavity of the heart. It is located in the bottom leftportion of the heart and is separated from the right ventricle by the ventricular septum.It receive blood from the left atrium and pumps it in the aorta artery.
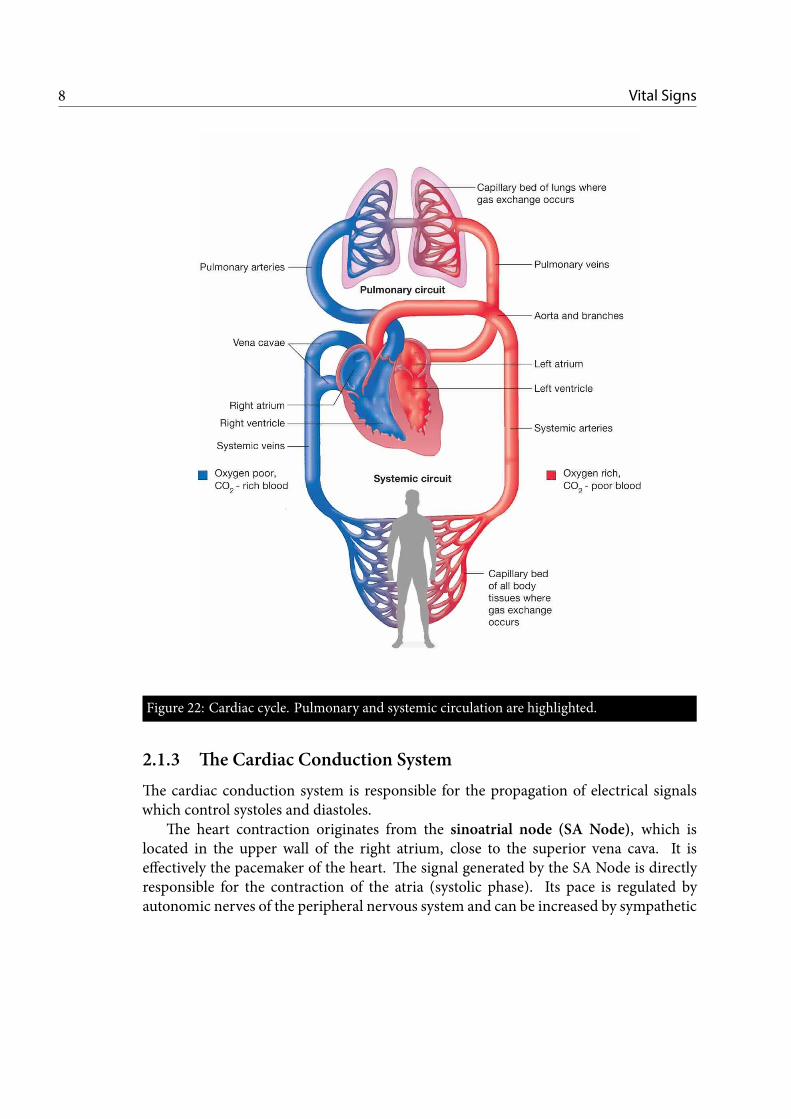
2.1.2 The Cardiac CycleThe human blood circulation system can be divided into pulmonary circulation andsystemic circulation. It is convenient to describe the cardiac cycle starting from thesecond phase of the systemic circulation. Deoxygenated blood returns from the bodyto the right heart and is accumulated in the right atrium. The right atrium pumpsit in the right ventricle through the tricuspid valve. Then, the blood is pumped tothe lungs through the pulmonary artery and at this point the pulmonary circulationstarts. Functionally speaking, the sole presence of the ventricles would still ensure theseparation of oxygenated and deoxygenated blood. The presence of the atria, though,increases the cardiac output of more than 75% by ensuring an uninterrupted venousflow to the heart and preventing circulatory inertia [5]. In the pulmonary circulation,deoxygenated blood flowing from the heart reaches the lungs where it is oxygenated.In the second phase, the blood returns to the heart flowing in the pulmonary vein. Inthe left part of the heart, the oxygenated blood is accumulated in the left atrium andpumped out in the aorta artery. The cardiac cycle concludes with the first phase of thesystemic circulation: blood reaches the cells where the oxygen it carries is used. Despitehaving the same volume, the efficiency of the ventricles is different. The left ventricleis considerably thicker than the right one because it has to provide blood to the entirebody whereas blood which is pumped by the right ventricle only reaches the lungs.
From the description of the cardiac cycle, four periodic contraction and relaxationphases can be indentified. A cardiac contraction is called a systole; a cardiac relaxationphase is called a diastole. Systoles and diastoles, along with all the phases of the cardiaccycle, can be clearly identified in a EKG.
8 Vital Signs
Figure 22: Cardiac cycle. Pulmonary and systemic circulation are highlighted.
2.1.3 The Cardiac Conduction SystemThe cardiac conduction system is responsible for the propagation of electrical signalswhich control systoles and diastoles.
The heart contraction originates from the sinoatrial node (SA Node), which islocated in the upper wall of the right atrium, close to the superior vena cava. It iseffectively the pacemaker of the heart. The signal generated by the SA Node is directlyresponsible for the contraction of the atria (systolic phase). Its pace is regulated byautonomic nerves of the peripheral nervous system and can be increased by sympathetic

2.1. The Human Heart 9
Anterior
Internodal
Tract
Bachmann’s Bundle
Left Bundle Branch
Conduction
Pathways
Right Bundle Branch
Atrioventricular (AV) Node
Posterior
Internodal
Tract
Middle
Internodal
Tract
Sinoatrial (SA)
Node
Electrical System of the Heart
Figure 23: Cardiac Conduction System.
nerves or slowed down by parasympathetic ones.The conduction of the electric impulse happens exploiting cell depolarization: the
normally negative internal potential of cells of the heart walls, measured with respect tothe exterior, undergoes depolarization when it becomes temporarily positive. A secondphase, called repolarization follows and brings the internal potential back to its negativevalue [6].
The efficiency of a four chambers heart structure is mainly due to the delay betweenthe atrial and ventricular systoles. Thedelay between the two contractions greatly reducesthe inertia of the venous blood [5]. Since contractions and relaxations of the heart areelectrically controlled, the signal which causes depolarization of the ventricles must bedelayed with respect to the one responsible for depolarization of atria. The electrical

10 Vital Signs
signal originated from the SA Node propagates to the atrioventricular node (AVNode),which is located on the right bottom side of the interatrial septum and is responsible forthe required delay. The AV Node acts as a relay, introducing delay which lies between120ms and 200ms for healthy hearts[7].
The AV Node also acts as a backup pacemaker in case of failure of the SA Node,in particular preventing arrhythmias, such as atrial fibrillation, from spreading to theventricles at dangerous rates.
From the AV Node, the electrical signal spreads to the ventricular walls. The Bundleof His, composed by two bundle branches, is responsible for propagating the electricalsignal through the interventricular septum. Each branch serves a ventricle by feedingthe signal to the Purkinje fibers.
To conclude this section and better understand the basics of EKG, it is important toremark that cardiac conduction is clearly split into two phases to delay the ventricularcontraction with respect to atrial contraction; furthermore, during depolarization theelectric potential increases while repolarization causes a decrease of the same quantity.
2.2 Electrocardiogram
The EKG is a graphwhich shows the electrical activity of the heart. The cardiacmusclecells behave like an electric dipole. As a consequence, given two points carefully
chosen on the skin, it is possible tomeasure a potential difference which varies accordingto the activity of the heart. The modern EKG was developed by Willem Einthoven andÉtienne-Jules Marey at the beginning of 20th century [8].
Before delving in the description of acquisition and processing of EKG signals, it isnecessary to describe a standard EKG to understand what to expect and how to interpretthe data.
2.2.1 Standard 12-lead EKGWhen dealing with professional electrocardiographs, such as the ones listed in [9], it isnecessary to understand the concepts of electrode and lead, as well as the importancethe correct placement of the electrode to obtain a reliable EKG.
A 12-lead EKG requires 10 electrodes, positioned as detailed below [10]:
• Right Arm Electrode (RA) : anywhere between the right shoulder and the wrist;
• Left Arm Electrode (LA) : anywhere between the left shoulder and the wrist;
• Right Leg Electrode (RL) : anywhere above the right ankle and below the torso;
• Left Leg Electrode (LL) : anywhere above the left ankle and below the torso;

2.2. Electrocardiogram 11
• V1 : 4th intercostal space to the right of the sternum;
• V2 : 4th intercostal space to the left of the sternum;
• V3: midway between V2 and V4;
• V4 : 5th intercostal space at the midclavicular line;
• V5 : anterior axillary line at the same level as V4;
• V6 : midaxillary line at the same level as V4 and V5.
A lead is defined as an electric potential difference obtained by a suitable linearcombination of electrodes. As already mentioned, a standard EKG is composed by 12leads, or 12 different voltage signals. Leads are grouped in 3 categories: limb leads(unipolar limb leads), augmented limb leads (or bipolar limb leads) and precordial leads(also called unipolar chest leads).
Leads are obtained as follows.
Limb Leads
I = LA−RA,II = LL−RA,
III = LL− LA.(2.1)
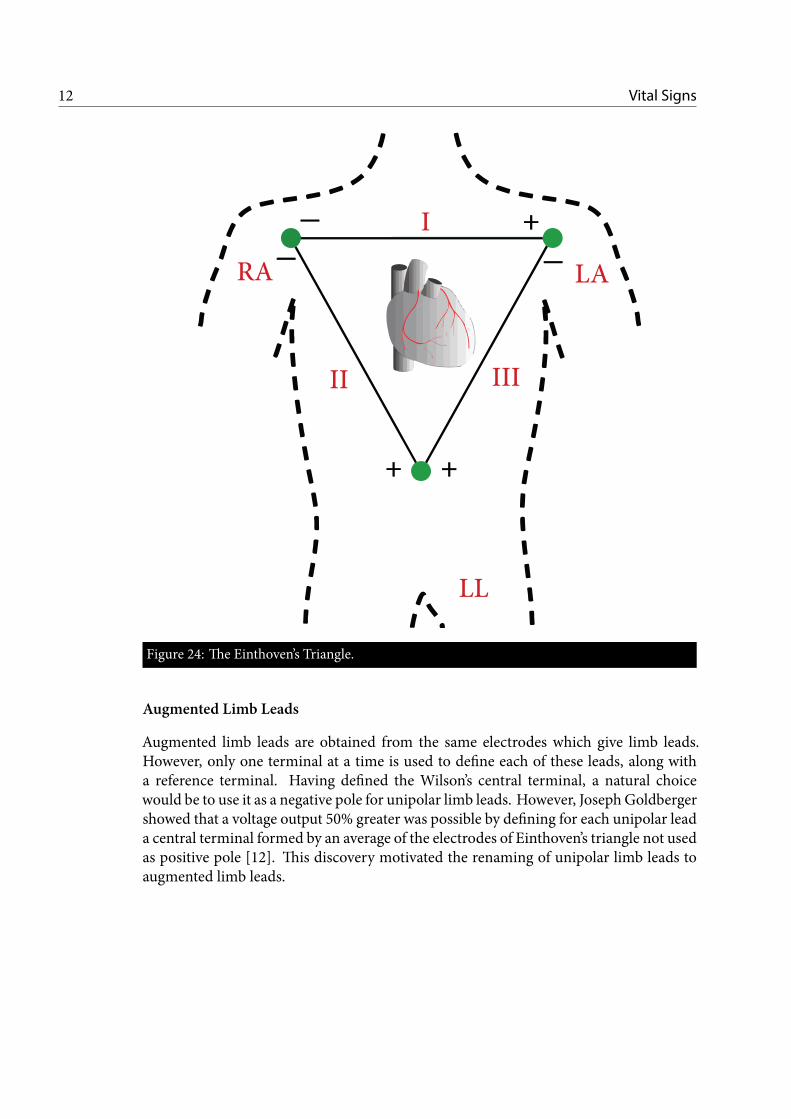
Limb leads are bipolar leads because they are expressed as potential differencesbetween two electrodes. Limb leads are the vertices of the Einthoven’s triangle, shownin Fig. 24, which was invented and used by W. Einthoven.
The Einthoven’s triangle has an important property: the sum of the voltages aroundany closed path around it equals zero. As a consequence, a virtual ground point canbe derived from limb leads. A convenient choice leads to the definition of the Wilson’scentral terminal V w as the average of the vertices of the triangle [11].
Vw =1
3(RA+ LA+ LL). (2.2)
The Wilson’s central terminal is a measure of the average potential of the body andcan be taken as a reference for the unipolar leads.
12 Vital Signs
RA LA
LL
II III
I +
+ +
Figure 24: The Einthoven’s Triangle.
Augmented Limb Leads
Augmented limb leads are obtained from the same electrodes which give limb leads.However, only one terminal at a time is used to define each of these leads, along witha reference terminal. Having defined the Wilson’s central terminal, a natural choicewould be to use it as a negative pole for unipolar limb leads. However, JosephGoldbergershowed that a voltage output 50% greater was possible by defining for each unipolar leada central terminal formed by an average of the electrodes of Einthoven’s triangle not usedas positive pole [12]. This discovery motivated the renaming of unipolar limb leads toaugmented limb leads.

2.2. Electrocardiogram 13
Goldberger’s central terminals are defined as follows:
V RG =
1
2(LA+ LL),
V LG =
1
2(RA+ LL),
V FG =
1
2(RA+ LA),
(2.3)
where R stands for right arm, L for left arm and F for left foot. The augmented limbleads are then given by 2.4.
aV R = RA− V RG ,
aV L = LA− V LG ,
aV F = LL− V FG .
(2.4)
Limb leads and augmented limb leads give informations about the electrical activityof the heart in the frontal (vertical) plane.
Precordial Leads
Precordial leads, also called unipolar chest leads, are given by the potential differencebetween the elctrodes Vi and Vw. They provide insight on the activity of the heart in thetransverse (horizontal) plane.
Lead Polarity
The electric potential of each lead can be associated with an axis whose direction andpolarity depend on the position of the poles of the lead (unipolar and bipolar leads areconsidered composed by two poles in the following, one of which can be a referenceterminal). By considering the direction of the lead axis and the activity of the heart, it ispossible to predict the polarity of the EKG trace associated to each lead. Indeed [13]:
• a depolarization (repolarization) whose direction is aligned to lead axis producesa positive (negative) deflection;
• a depolarizazion (repolarization) whose direction is opposite to the lead axisproduces a negative (positive) deflection;
• a depolarization or repolarization whose direction is orthogonal to the lead axisproduces a isoelectric trace.

14 Vital Signs
P
Q
R
S
T
QRS Complex
PRSegment
STSegment
PR Interval
QT interval
Figure 25: Waves of an EKG trace.
EKGWaves
A typical EKG trace is composed by periodic traces in which peaks and valleys can beidentified (Fig. 25).
In order to better understand the meaning of each wave, the polarity should beignored. Indeed, the polarity of each peak depends on the lead axis but the presenceof a deflection and the time interval among deflections are the important points to beremembered to identify a cardiac condition.
A typical cardiac cycle begins with the generation of an electrical impulse in thr SANode. The signal flows at the same time to the AV Node and to the muscle cells in theatria. The P wave represents atrial depolarization which causes atrial systole.
The atrial contraction preceeds the ventricular contraction as a consequence of thepresence of the AV Node. When the electrical signal reaches the ventricles, it causestheir depolarization. This phenomenon is typically the most visible and distinctive partof an EKG and is called QRS complex. It is formally composed by 3 close waves: a

2.2. Electrocardiogram 15
Figure 26: A standard 12-lead EKG. The polarity of the waves depend on the lead.
negative deflection (Qwave) which represents the depolarization of the interventricularseptum, a positive peak (R wave) immediately followed by a new negative deflection (Swave). The amplitude of the R wave is typically much larger than the P wave becauseventricular systole involves a much larger number of muscle cells than atrial systole. TheQRS complex has a typical length which spans from 60ms to 100ms. During ventriculardepolarization, atria repolarize. A deflection opposite to the P wave is superimposed tothe QRS complex but cannot be appreciated due to the larger magnitude of the QRScomplex.
The role of theAVNode is highlighted by thePR interval, which usually lasts between120ms and 200ms.
The ST segment and T wave are usually analyzed together to gain insights aboutthe repolarization of the ventricles. The ST segment is usually isoelectric because itrepresents the time delay between ventricle depolarization and repolarization in whichno electrical signal propagates. The T wave should be asymmetric, with the first portionlonger and less steep than the second portion.
Finally, the QT interval shows the activity of the ventricles in a full cardiac cycle.A standard 12-Lead EKG is shown in Fig. 26. The QRS complex is positive in all the
leads which have the positive pole in the left part of the body (left arm and left leg).
The Cardiac Axis
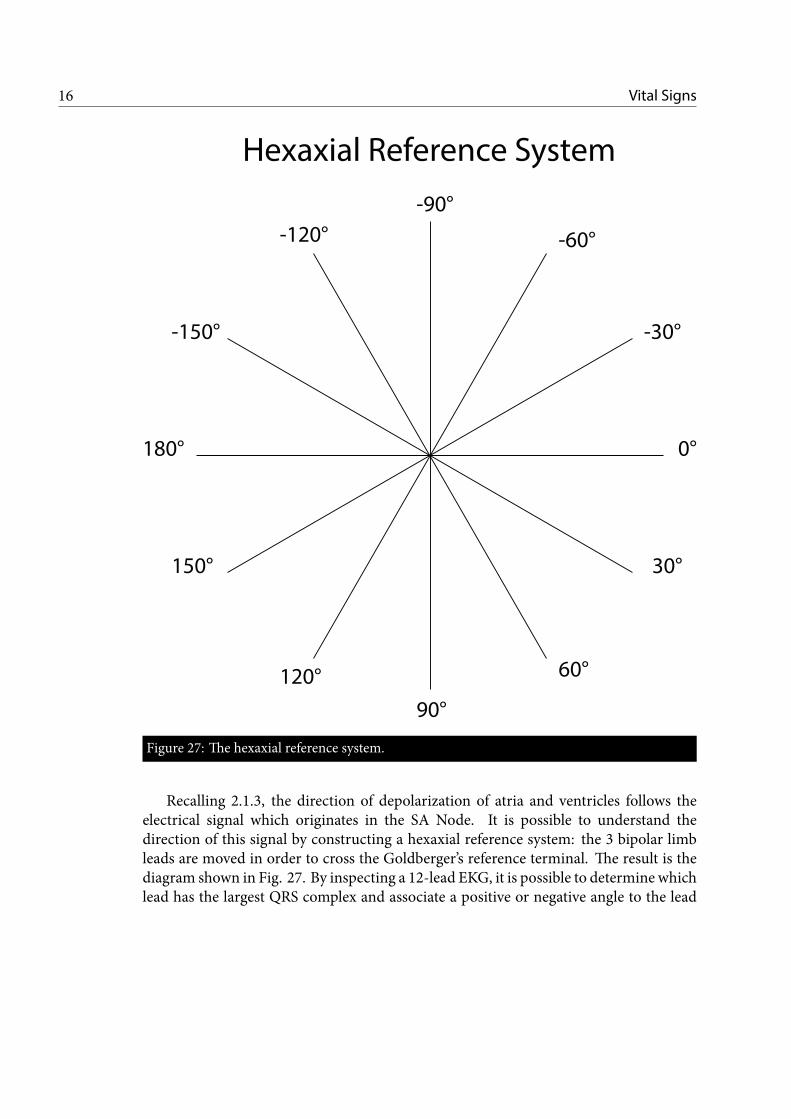
As a conclusion, the concept of cardiac axis and hexaxial reference system is presentedwith reference to Fig. 27.
16 Vital Signs
0°
30°
-30°
60°
90°
120°
150°
180°
-60°
-90°
-120°
-150°
Hexaxial Reference System
Figure 27: The hexaxial reference system.
Recalling 2.1.3, the direction of depolarization of atria and ventricles follows theelectrical signal which originates in the SA Node. It is possible to understand thedirection of this signal by constructing a hexaxial reference system: the 3 bipolar limbleads are moved in order to cross the Goldberger’s reference terminal. The result is thediagram shown in Fig. 27. By inspecting a 12-lead EKG, it is possible to determine whichlead has the largest QRS complex and associate a positive or negative angle to the lead

2.3. Heart Rate and Blood Oxygen Level 17
axis, according to Fig. 27. The cardiac axis normally lies between −30° and 90°. Whenthe cardiac axis is lower than −30° we refer to left cardiac deviation; conversely, whenthe cardiac axis is greater than 90° we refer to right cardiac deviation.
2.2.2 I-lead EKGThe heart is a complex structure with many paths for electrical signals. A 12-lead EKGis required to get thorough insights about its health because each lead is able to showparticular anomalies associated to signals which propagate in a direction orthogonal tothe lead axis. Limiting the number of EKG leads clearly limits the amount of informationwhich is possible to extract.
The reduction of the number of electrodes is required to make the EKG portable andwearable-friendly. The minimum number of electrodes clearly cannot be lower than two,since a lead is a differential signal. Theminimization of electrodes automatically excludesaugmented limb leads because at least two poles are required for the defintion of a centralreference terminal, beside the positive pole used for the specific lead. Chest leads V1 andV2 are a possible choice for a single lead EKG and are usually exploited by chest strapsdevices; an alternative choice is any of the bipolar leads, keeping inmind that positioninga leg electrode is surely less convenient for the user than using electrodes positioned onthe arms. At this point, the most obvious choice is Lead-I, with electrodes positioned onthe left and right arms.
2.3 Heart Rate and Blood Oxygen Level
Estimation of SpO2 is of utmost importance to evaluate general health status. Indeed,it has been regarded as a 5th vital sign by many authors [14].
The technique routinely used for its estimation, which dates back to 1972, wasinvented by Takuo Aoyagi, a Japanese bioengineer [15]. Its importance lies in its noninvasive nature, real time availability of results and possibility to test many patientsquickly without replacing consumables.
2.3.1 Theory of PhotoplethysmographyPlethysmography is a generic term which refers to a techinque to measure changes involume of organs or whole body. It is commonly used to estimate pulmonary capacityexploiting Boyle’s Law [16].
Photoplethysmography (PPG) is derived from classic Plethysmography but relies onthe detection of changes in light absorbances to estimate changes in volume.
During systemic circulation, oxygenated blood is pumped from the heart to the bodyperiphery through the arteries (2.1.2). Oxygen Molecules (O2) carried by Hemoglobin

18 Vital Signs
(Hb) are provided to all body cells and Carbon Dioxide (CO2) is picked up in return.Oxygenated Hb is commonly referred as Oxyhemoglobin (O2Hb) while O2-free Hb iscalled Deoxyhemoglobin (HHb).
O2Hb has the property of absorbing more Infrared (IR) light (850 nm to 940 nm)than RED light (635 nm to 700 nm). Remarkably, HHb features the opposite property,absorbing more RED light than IR light.
Classic Lambert-Beer Law relates the absorption of light in a solution to the physicalproperties of the solution:
A = − ln(IoutIin
)= ℓ
N∑i=1
εici. (2.5)
In practice, forN attenuating species in case of uniform attenuation, the absorbanceA depends on the arterial length of light through the sample ℓ, the concentration c andthe molar attenuation coefficient ε. The absorption clearly depends on the amount oflight provided to the solution (Iin) and the amount of light which is transmitted throughthe solution (Iout, which refers to both reflected and transmitted light).
Since O2 is transported by O2Hb in arterial blood, its detection is related to thedetection of O2Hb. Given the different light absorption properties of O2Hb and HHb, aconvenient quantity to define is the RED:IR modulation ratio R:
R =ARED
AIR
(2.6)
where ARED is the absorption of RED light and AIR the absorption of IR light.When a systemic circulation cycle starts with the contraction of the left ventricle,
the blood pressure has a sudden increase (systolic blood pressure). As a consequence,the arteries undergo a cyclic expansion and contraction which follow the cardiac cycle.Conversely, veins are much stiffer and their diameter stays fairly constant. The conceptis illustrated in Fig. 28.
This fact can be exploited to ease the computation of R. Indeed, a tissue bed can beconsidered composed of a pulsatile part, that is essentially composed by arterial bloodwhich changes periodically with cardiac cycle, and a constant non-pulsatile part (venousblood, fat, skin, bones) [17]. By modifying Eq. 2.6 with time derivatives of absorption,the effect of non-pulsatile tissue components can be excluded obtaining
R =∂ARED
∂t∂AIR
∂t
(2.7)

2.3. Heart Rate and Blood Oxygen Level 19
Time
Lig
ht
Inte
nsi
ty
Venous blood
Non-pulsatile
arterial blood
Pulsatile
arterial blood
Sorrounding
tissue
(background)
PPG Signal Components
Figure 28: Arteries and veins behaviour during a cardiac cycle.
and, by using the first equality of Eq. 2.5,
R =
∂∂t
[− ln
(Iout(t)Iin
)]RED
∂∂t
[− ln
(Iout(t)Iin
)]IR
. (2.8)
By considering that Iout(t) is time dependent (because of the presence of the pulsatilecomponent) and Iin is not, we can finally obtain:
R =
[IacoutIdcout
]RED
·[IacoutIdcout
]−1
IR
, (2.9)
where ac and dc refer to pulsatile and non-pulsatile components, respectively. Bothchannels are expected to present a behaviour in time similar to the envelope of Fig. 28.
TheRED:IRmodulation ratio is expected to increase for low blood oxygen saturation.Indeed, in this condition the amount of O2Hb is low with respect to HHb; since O2Hbabsorbs more IR and less RED light, the fraction in 2.9 increases.

20 Vital Signs
At this point, it should be noted that the choice of the body location for a PPGmeasurement is extremely important to obtain a reliable result. Indeed, ear lobes andfingertips are normally considered ideal spots because they are well blood-perfusedtissues. Recently, the forehead has been indicated as a potential third body location forPPG measurements [18].
A further important point to be discussed is the choice between transmittance andreflectance PPG techniques. From the photo-detector point of view, as a matter of factit is not particularly important if the device has light source and photo-detector onthe same side (surface device) or on opposite sides of a tissue bed if their distance issufficiently large. In case of transmittance based devices, the separation is guaranteed bythe thickness of the finger or ear lobe; in case of reflectance based devices, the requiredseparation is ensured by considering that the mean-free-path of photons in a tissue bedis approximately 1mm and this is sufficient for photons to lose the history of their past[18].
Once that R has been computed according to Eq. 2.9, it is necessary to make onefinal step to obtain a SpO2 value.
If the second equality of Eq. 2.5 is used in Eq. 2.7, the following expression can bederived:
R =
[(Sεa + (1− S)εv) ·
∂(caℓa)
∂t
]RED
·[(Sεa + (1− S)εv) ·
∂(caℓa)
∂t
]−1
IR
(2.10)
where S is the true SpO2 value (the unknown, ranging from 0 to 1) and the only timedependent variable are the concentration ca of O2Hb and la. The product cvℓv ≃ 0 as aconsequence of the greater stiffness of the veins.
By coupling Eq 2.9 with 2.10 and solving for S, the SpO2 value can be estimated [18].Practically, ca and la are hard to estimate. As such, off-the-shelf devices, which integrateboth light sources and the photodetector, are often already characterized exploiting arelation such as Eq. 2.11:
S =k1 + k2R
k3 + k4R, (2.11)
where eventually one or more constants ki can be zero.Finally, the HR comes for free from SpO2 estimation. Indeed, a clean heart rate is
required to evaluate R and HR estimation is simply a matter of calculating the mainfrequency component of a PPG channel. The choice of the wavelength at which thiscomputation is performed depends on the Signal-To-Noise Ratio (SNR) of the channelswhich, ultimately, links to the quality of the light source and photo-detector.

CHAPTER 3State of the Art
There are many systems already on the market which promise to performmonitoring of vital signs. This chapter presents a review of a few examples,alongwith positive and negative sides of each device. As evident fromChapter2, the location of the device on the body is a core decision to be made during
the very first stages of development of a vital signsmonitoring device. Currently availablesystems can be roughly divided in three categories:
• chest straps;
• wrist trackers;
• finger clips.
3.1 Chest Straps
Chest straps are devices which normally focus on acquiring a single lead EKG signalclose to the heart. The device is placed on the chest and the two electrodes are
located on opposite sides of the heart. The lead is also non standard, because V1 and V2are used together to obtain a bipolar lead instead of being referred to a central referenceterminal.
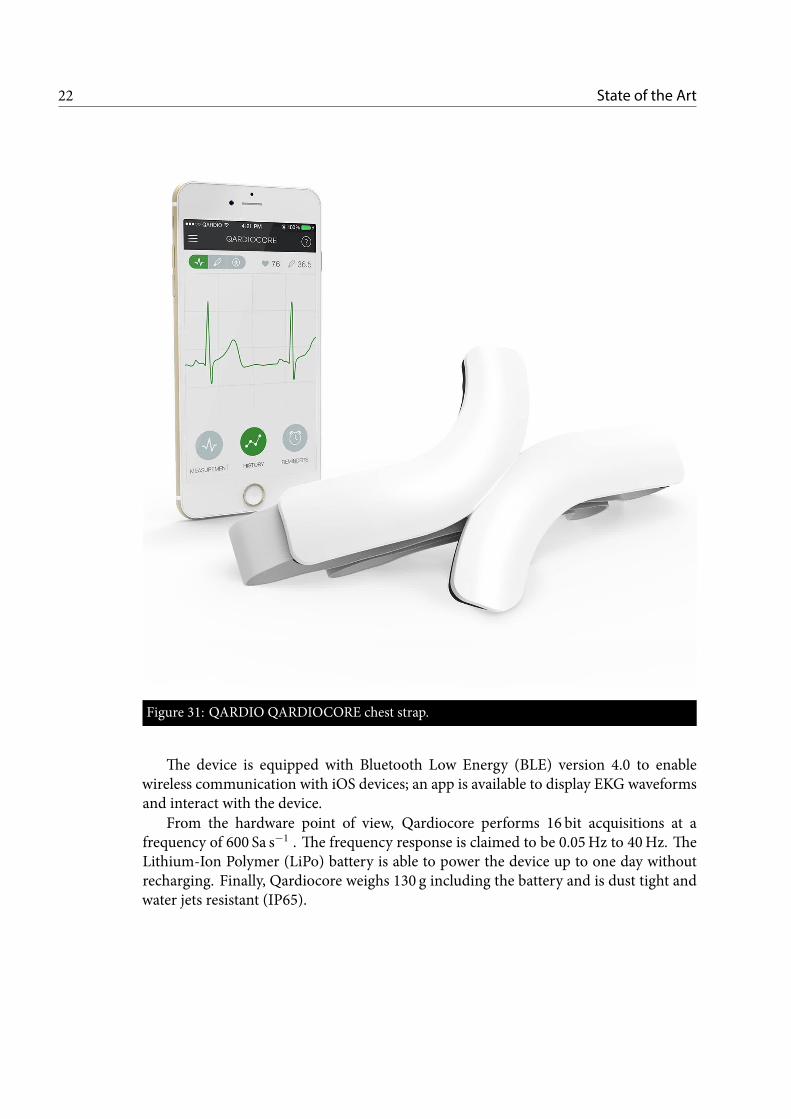
3.1.1 QARDIOCOREA first example of chest straps comes from QARDIO [19] QARDIOCORE (Fig. 31).
Qardiocore is able to perform continuous single lead EKG signal measurements andmonitor heart rate, respiratory rate, skin temperature and activity. Furthermore, anindication of the heart rate variability is also provided.
21
22 State of the Art
Figure 31: QARDIO QARDIOCORE chest strap.
The device is equipped with Bluetooth Low Energy (BLE) version 4.0 to enablewireless communication with iOS devices; an app is available to display EKG waveformsand interact with the device.
From the hardware point of view, Qardiocore performs 16 bit acquisitions at afrequency of 600 Sa s−1 . The frequency response is claimed to be 0.05Hz to 40Hz. TheLithium-Ion Polymer (LiPo) battery is able to power the device up to one day withoutrecharging. Finally, Qardiocore weighs 130 g including the battery and is dust tight andwater jets resistant (IP65).

3.1. Chest Straps 23
Figure 32: CALM chest strap.
Due to its positioning on the body Qardiocore lacks the ability to monitor artherialblood oxygen level. Furthermore, its current price is e499 which is quite above theaverage for similar devices. Finally, it lacks compatibility with Android smartphones.
3.1.2 CALM.CALM. [20] is another example of chest straps (Fig. 32). CALM. is a simpler devicewhich only performs single lead EKG continuous monitoring. Also this device uses V1and V2 electrodes together to obtain a non-standard lead. The electrodes are disposablegel pads which must be purchased separately (first set included).
It features a 12 bit, 250 Sa s−1 Analog-to-Digital Converter (ADC), BLE version4.0 connectivity and smartphone apps are available for both Android and iOS devices.It is equipped with a 200mAh LiPo battery which ensures up to 72 h of battery life.Furthermore, it has a 3-axis accelerometer and the sensor device weighs only 14 g.

24 State of the Art
Finally it is splash resistant and the retail price is set to $120.
3.1.3 DiscussionChest straps devices have the advantage of not requiring user interaction to performmeasurements. However, the presence of the chest belt is probably not enough to ensurethe stability of the device, which is extremely important to get reliable EKG acquisitions.A futher downside of chest straps devices is the inability to provide informations aboutSpO2; besides being an important indicator by itself, it is also a requirement to performcuff-free blood pressure checks.
3.2 Wrist Trackers
Activity trackers are devices whose core functionality is to analyze motion dataand recognize common daily activities, such as walking and running and provide
indications about performances, such as number of steps, pace and excessive sedentarylifestyle. A few trackers feature also HR monitoring.
3.2.1 FITBITFITBIT [21] is aUSbased companywhich sells awide range of smartwatches and trackers.These devices should not be confused with a PHS. Indeed they are not able to provideEKG and SpO2 measurements and are only intended to monitor the lifestyle. The latestFITBIT activity tracker, featuring HR monitoring, is shown in Fig. 33.
They are typically well connected, feature BLE and well designed smartphone apps torecord data. As they are intended to be always worn, they are waterproof and are idealto provide statistics about daily workouts. These devices feature a battery life which canlast up to one week, due to their simpler low power design.
HR ismeasured usingGREEN leds to detect peak blood pressure. Studies have shownthe superiority of green light (530 nm) for measurements on the wrist, where RED andIR leds exhibit poor performances [22]. Clearly, a single ledmeasurement does not allowto compute the RED:IR modulation ratio from which SpO2 can be derived.
3.3 Finger Clips
Finger clips deserve a mention in this chapter because they are an example of thewidespread use of PPG to measure HR and SpO2. Clearly, they are not wearable
devices and their use is limited to hospitals and clinics. The challenge which all otherdevices presented in this chapter face is to keep up with the accuracy of finger clips.

3.4. ECG Sensor 25
Figure 33: FITBIT Charge 3.
Indeed, their design minimize the amount of external light which hits the photodetector,greatly increasing the SNR. Typical designs exhibit leds on one side and photodetectoron the other side. As such, they perform transmittance based PPG measurements. Oneof this devices has been used for the validation of Vital EKG. More information areincluded in Chapter 6.
3.4 ECG Sensor
The last part of this chapter is devoted to the description of ECG Sensor, a devicedeveloped at Neuronica Lab, Politecnico di Torino. Vital EKG can be considered
a spin-off evolution of ECG Sensor.ECG Sensor is a bracelet device which can performEKGbipolar leadsmeasures. One
electrode is positioned on the bottom side and the other on the top side. The analogdifferential signal is processed to remove noise from the grid and muscular noise. Theanalog to digital conversion is performed at 10 bit with a rate of 1 kSa s−1, using the ADCintegrated in the MSP430 microcontroller. Data are sent to a smartphone device usingBluetooth technology. This device features a few problems which led to the developmentof Vital EKG.
• Analog filtering is too aggressive, causing a non isoelectric ST segment.

26 State of the Art
• The Bluetooth module is external and data are sent to it using UART protocol. Afew recently developed microcontrollers integrate BLE onboard, enabling greaterpower savings.
• The digital processing is not performed on board but after transmission to thesmartphone. This leads to Bluetooth communication even though no critical heartconditions are detected. Since the RF section is the single most power hungrypart of the board, implementing on board processing could strongly influence thebattery life.
• EKG is not enough to gain sufficient insight on vital signs. Other biometricssignals, such as PPG, skin temperature and humidity and activity, could enablemore advanced techniques to estimate general health conditions of the user.
Detailed informations about ECG Sensor can be found in [23]. A feasibility study onVital EKG, based on the ECG Sensor, is detailed in [24].

CHAPTER 4Vital EKG
After a brief review of the state of the art, including commercial devices,crowdfunded projects and literature in Chapter 3, a device which can beconsidered a complete PHS has not been found. This chapter providesdetailed information about the design of such a system, both from hardware
and firmware points of view.Requirements and specifications of the Vital EKG are highlighted first; then, the
several stages of development of the product are described.
4.1 Requirements
Being a wearable device, Vital EKG must at least be compliant with the requirementsof this class of devices. The general requirements of a PHS, as described in detail in
Chapter 1, are reported here for convenicence.
1. Zero-power or low-power;
2. Reliability;
3. Continuous operation;
4. Real-time processing;
5. Seamless integration with the daily routine of the user;
6. Zero-effort flow of information from the patient to medical staff;
7. Aesthetically pleasant;
27

28 Vital EKG
8. Cost-effective.
To these general requirements, the following Vital EKG specific design goals havebeen added and considered to guide the development of the product.
i. LEAD I EKG acquisition;
ii. SpO2 meter;
iii. HR meter;
iv. Activity tracking;
v. Skin temperature and humidity indications;
vi. Systolic blood pressure indication;
vii. On-board data storage;
viii. BLE connectivity;
ix. Wrist-band/watch form factor;
x. Rechargeable battery.
At this point, an important remark is necessary. Requirements 3, i, ii, ix areimpossible to be satisfied at the same time with current technology.
Requirement i dictates a design able to perform a differential measurement and, thus,the presence of 2 electrodes positioned on opposite sides of the heart. Even though oneof the augmented limb leads were chosen for the the measurement (also misleadinglycalled single ended leads), the reader should note that more than one electrode wouldstill be required to define Golberger’s central terminals or Wilson’s central terminal (2.3and 2.4).
Moreover, requirement ii (and 2) suggests that only finger tips or ear lobes should beused for SpO2 measurement. The incompatibility with requirement ix is thus evident.
The solution commonly adopted is to neglect requirements ii and ix and design achest strap device, such as the ones already described in 3.1.1 and 3.1.2.
The solution proposed here takes a different direction: requirement 3 is partlyneglected and replaced with the following:
I. LEAD I EKG acquisition on request;
II. SpO2 meter on request;
III. HR meter on request;

4.2. Specifications 29
Table 41: Technical specification summary of Vital EKG.
Item Value
Case Size 50mm x 30mm x 20mmBLE v4.2Working Voltage 3.3VBattery Voltage Range 3.4V to 4.0VBattery Capacity 300mAhRecharge Method Micro-USB cableAcquisitions with a single charge min 3000Acquisition Time 11 sADC Sampling Frequency 500 Sa s−1
Effective Sample Size 14 bitMAX30102 Effective SamplingFrequency
50 Sa s−1
MAX30102 Sample Size 18 bit, 2 channels
IV. Continuous activity tracking;
V. Continuous skin temperature and humidity indications.
Vital EKG is designed to be a wrist-band product which performs LEAD I EKG,SpO2 and HR measurements upon request. The user interacts with Vital EKG using itssmartphone (or BLE enabled device) to initiate themeasurement; two fingers of the righthand (left hand) must be placed on the device while it is worn on left wrist (right wrist).One finger is used to perform PPG while the other serves as RA (LA) electrode.
4.2 Specifications
After compiling the general requirements, detailed technical specifications of VitalEKGhave been clearly stated and are summarized inTable 41. This section provides
a general summary of hardware and firmware capabilities of the device; for a morethorough discussion the reader is invited to proceed to 4.3 and 5, respectively.
The power consumption of Vital EKG has been measured in worst case conditions,that is while performing concurrent PPG and EKG acquisitions, sustaining a Bluetoothconnection andwith continuousmonitoring enabled. The analog front-endwas poweredon, as well as Texas Instruments (TI)HDC2010, TDK InvensenseMPU-9250 andMaximIntegrated MAX30102. The current draw was 10mA with a power supply voltage formost components of 3.3 V; the voltage regulator MAX1759, the reference REF2033 and

30 Vital EKG
the fuel gaugeMAX17048 are powered from the battery instead but all these componentsfeature quiescent currents lower than 50mA.
A LiPo battery with nominal voltage of 3.7 V and 300mAh capacity allows toperform an ideal maximum of 6000 acquisitions, according to Eq. 4.1.
N =3.7V · 300mA · 3600 s3.3V · 10mA · 3600 s
= 6054. (4.1)
Clearly, continuous reading of temperature and humidity, as well activity trackingandbatterymonitoring and consumebattery power evenwhen the user is not performingan acquisition. The activity tracking potentially allows to monitor when the deviceis worn, eventually turning all the equipment in low-power standby mode. Thus, aconservative maximum number of acquisitions with a single battery charge is expectedto be around 3000.
The ECG Watch, which is the reference device which drove the development ofVital EKG, allowed roughly 400 acquisitions with the same battery and was only able toperform EKG.
4.3 Hardware
This section provides detailed informations about hardware design, including circuitoperation and Printed Circuit Board (PCB) layout.
4.3.1 Circuit DesignThe circuit design can be organized in several sections, conceptually independent:microcontroller, power, RF, analog front-end, digital peripherals.
Microcontroller
The choice of Microcontroller (MCU) is critical from many points of view. Being VitalEKG a product with many peripherals, all of which need Digital Signal Processing (DSP)a fast 32 bit MCU is mandatory. Nonetheless, a power hungry MCU would invalidaterequirement 1 and costs must be kept under control to obey 8.
The TI CC2640R2FRGZ has been chosen for Vital EKG. A system block diagram isshown in Fig. 41.
TI CC2640R2FRGZ exhibits the following characteristics, among others [25]:
• ARM® Cortex® M3;
• Ultra-Low Power Sensor Controller Engine (SCE) with 16 bit architecture;

4.3. Hardware 31
SimpleLink CC26xx Wireless MCU
Main CPU:
128-KBFlash
Sensor Controller
cJTAG
20-KBSRAM
ROM
ARMCortex-M3
DC-DC Converter
RF Core
ARMCortex-M0
DSP modem
4-KB SRAM
ROM
Sensor Controller Engine
2× Comparator
12-bit ADC, 200 ks/s
Constant Current Source
SPI-I2C Digital Sensor IF
2-KB SRAM
Time-to-digital Converter
General Peripherals / Modules
4× 32-bit Timers
2× SSI (SPI, µW, TI)
Watchdog Timer
Temp. / Batt. Monitor
RTC
I2C
UART
I2S
10 / 14 / 15 / 31 GPIOs
AES
32 ch. µDMA
ADC
Digital PLL
Up to 48 MHz61 µA/MHz
TRNG
ADC
8-KBcache
Copyright © 2016, Texas Instruments Incorporated
3
CC2640R2Fwww.ti.com SWRS204A –DECEMBER 2016–REVISED JANUARY 2017
Submit Documentation FeedbackProduct Folder Links: CC2640R2F
Device OverviewCopyright © 2016–2017, Texas Instruments Incorporated
1.4 Functional Block DiagramFigure 1-1 shows a block diagram for the CC2640R2F device.
Figure 1-1. Block DiagramFigure 41: TI CC2640R2FRGZ system block diagram (Copyright ©2016, Texas InstrumentsIncorporated).
• Up to 48MHz clock speed;
• 275 kB of Non-Volatile Memory;
• 128 kB of In-System Programmable Flash;
• 20 kB of Ultra-Low Leakage SRAM;

32 Vital EKG
• 8 kB of Cache, which can be repurposed as RAM;
• 2 kB of Ultra-Low Leakage SRAM dedicated to Sensor Controller Engine whichcan be repurposed as ARM® Cortex® M3 RAM;
• 2-Pin cJTAG and JTAG Debugging;
• 31 General Purpose Input Output (GPIO);
• 12 bit, 200 kSa s−1 ADC with 8 channels analog input Multiplexer (MUX);
• Inter Integrated Circuit (I2C) driver;
• Serial Peripheral Interface (SPI) driver.
TI also specifies the following power consumption specifications:
• Normal operation power supply voltage range from 1.8V to 3.8V;
• Active-Mode BLE RX: 5.9mA;
• Active-Mode BLE TX at 0 dB: 6.1mA;
• Active-Mode BLE TX at 5 dB: 9.1mA;
• Active-Mode MCU: 61 µAMHz−1;
• Active-Mode SCE: 0.4mA + 8.2 µAMHz−1;
• Standby-Mode (RAM/CPU Retention): 1.1 µA;
• Shutdown-Mode (Wake Up on External Events): 100 nA.
TI CC2640R2FRGZ only requires few external components. Power supply tracesrequire decoupling and bulk capacitors; a ferrite bead is also used to suppress highfrequency noise. Two crystals have been used in Vital EKG design. Schematic pagesabout TI CC2640R2FRGZ are reported in Fig. 42 and 43.
The 24MHz crystal is required for BLE operations and is internally doubled to48MHz. ARM® Cortex® M3 has a software selectable internal capacitor array tobetter tune BLE carrier frequency. Thus, external capacitors are not required for correctoperation[26].
The 32 kHz crystal is technically speaking optional; however, a high accuracy crystal(better than ±500 ppm) is required if BLE connection has to be mantained while theARM® Cortex® M3 is in standby mode. Hence, to enable the maximum power savings(1) while acquisitions are not performed (I, II, III), it has been added to the design.

4.3. Hardware 335 5
4 4
3 3
2 2
1 1
DD
CC
BB
AA
RF caps should be placed
at opposite sides of L1
No traces should be routed
below RF front-end
Place RF passives
close to RF_N and RF_P
ANTENNA trace
should be 50
Ohm impedence
if longer than 10mm
Pin 13
Pin 22
Pin 44
Pin 34
Pin 48
Pin 45
RF DECOUPLING
VDDS DECOUPLING
Place all decoupling capacitors close
to their respective pins with multiple
vias to ground
CC2640R2FRHZ
CC2640R2FRHZ has internal
capacitor array for 24 MHz crystal
Active-Mode RX: 5.9 mA
Active-Mode TX at 0 dBm: 6.1 mA
Active-Mode TX at +5 dBm: 9.1 mA
Active-Mode MCU: 61 µA/MHz
Active-Mode MCU: 48.5 CoreMark/mA
Active-Mode Sensor Controller:
0.4mA + 8.2 µA/MHz
Standby: 1.1 µA (RTC Running and RAM/CPU
Retention)
Shutdown: 100 nA (Wake Up on External
Events)
Pin 34
Pin 33
2n
15n
10u
Place all decoupling capacitors close
to their respective pins with multiple
vias to ground
Place FID1, FID2, FID3 on TOP
Place FID4, FID5, FID6 on BOTTOM
DD
DD
DD
DD
DD
D
DD
DD
DD
D
DV
DC
D
TM
SC
TC
KC
RS
T
VD
DS
Titl
e
Siz
eD
ocu
ment N
um
ber
Rev
Date
:S
heet
of
Vita
l EK
G -
Zanic
helli
4.1
.1
Mic
roco
ntr
olle
r S
ect
ion
A4
25
Satu
rday,
Nove
mber
17, 2018
Titl
e
Siz
eD
ocu
ment N
um
ber
Rev
Date
:S
heet
of
Vita
l EK
G -
Zanic
helli
4.1
.1
Mic
roco
ntr
olle
r S
ect
ion
A4
25
Satu
rday,
Nove
mber
17, 2018
Titl
e
Siz
eD
ocu
ment N
um
ber
Rev
Date
:S
heet
of
Vita
l EK
G -
Zanic
helli
4.1
.1
Mic
roco
ntr
olle
r S
ect
ion
A4
25
Satu
rday,
Nove
mber
17, 2018
C9
100n
FID
1
DN
M
CT
3H
AR
WIN
M50-3
530242
C11
100n
L1
TA
IYO
YU
DE
N C
KS
2125100M
-T
FID
4
DN
M
C13
100n
C21
1u
F1
MU
RA
TA
BLM
18H
E152S
N1
C18
12p
C22
12p
C20
1.2
pC
19
1.2
p
U5A
TI C
C2640R
2F
RH
Z
JTA
G_T
MS
C24
JTA
G_T
CK
C25
RE
SE
T_N
35
DC
DC
_S
W33
X32K
_Q
13
X32K
_Q
24
DC
OU
PL
23
EG
P/G
ND
49
VD
DS
213
VD
DS
322
VD
DS
44
VD
DS
_D
CD
C34
VD
DR
_R
F48
VD
DR
45
RF
_N
2R
F_P
1
X24M
_P
47
X24M
_N
46
T5
R6
100k
FID
3
DN
M
Y2
TS
X-3
225 2
4.0
000M
F15X
-AC
3
13
4
2
T6
FID
6
DN
M
Y1
Seik
o S
C-2
0S
7pF
12
C12
10u
C16
100n
FID
2
DN
M
C15
100n
A1
DN
M
C23
12p
FID
5
DN
M
L3
MU
RA
TA
LQ
G15H
S15N
J02D
C14
10u
L2
MU
RA
TA
LQ
G15H
S2N
0S
02D
C17
100n
C10
100n
PI F
ILT
ER
DG
ND
RF
_P
RF_N
VDDS
VDDS
VDDR
DCOUPL
X32K 1
X32K 2
X24M 1
X24M 2
DC
DC
_S
W
DC
DC
_S
WF
EE
D
VD
DS
IN
VD
DR
Figure 42: Vital EKG schematic, microcontroller section.

34 Vital EKG
5 5
4 4
3 3
2 2
1 1
DD
CC
BB
AA
Red led on: micro in normal state
Red led blinking: battery low
Blue led blinking: BLE transmission
Vd = 2V
Vd = 3.1V
IO BLOCK
JTAG
UART
Place termination
resistors and capacitors
close to IC
All resistor:
- Package 0402 (imperial)
- Tolerance 1%
- Temperature coefficient 100ppm / C
except where otherwise indicated
Mating cable
SAMTEC FFSD-05-D-02.00-01-N
D
DV
DC
DD
D
D
DV
DC
DV
DC
DV
DC
D
DV
DC
EC
G O
UT
TM
SC
TC
KC
RS
T
SD
SW
SP
I C
SS
PI M
OS
IS
PI S
CLK
SP
I M
ISO
MR
D117 IN
TM
PU
9250 IN
T
HD
C2010 IN
T
MA
X17048 IN
T
I2C
SC
LI2
C S
DA
RE
F2033 E
NR
EF
Titl
e
Siz
eD
ocu
ment N
um
ber
Rev
Date
:S
heet
of
Vita
l EK
G -
Zanic
helli
4.1
.1
Mic
roco
ntr
olle
r D
IO S
ect
ion
A
35
Satu
rday,
Nove
mber
17, 2018
Titl
e
Siz
eD
ocu
ment N
um
ber
Rev
Date
:S
heet
of
Vita
l EK
G -
Zanic
helli
4.1
.1
Mic
roco
ntr
olle
r D
IO S
ect
ion
A
35
Satu
rday,
Nove
mber
17, 2018
Titl
e
Siz
eD
ocu
ment N
um
ber
Rev
Date
:S
heet
of
Vita
l EK
G -
Zanic
helli
4.1
.1
Mic
roco
ntr
olle
r D
IO S
ect
ion
A
35
Satu
rday,
Nove
mber
17, 2018
T12
SW
1
TE
1571563-4
124 3
T8
R10
3.3
k
R12
220
R9
3.3
k
R11
27
T9
R13
22
C25
22p
DL3
OS
RA
M L
S L
296-P
2Q
2-1
1-2 +
J3 SA
MT
EC
FT
SH
-105-0
1-L
-D-K
1 3 5 7 9
2 4 6 8 10
DL2
OS
RA
M L
B L
293-M
2P
1-3
6-1
-Z
1-2 +
T11
DIO
_0
5
DIO
_1
6
DIO
_2
7
DIO
_3
8
DIO
_4
9
DIO
_5
10
DIO
_6
11
DIO
_7
12
DIO
_8
14
DIO
_9
15
DIO
_10
16
DIO
_11
17
DIO
_12
18
DIO
_13
19
DIO
_14
20
DIO
_15
21
DIO
_16
26
DIO
_17
27
DIO
_18
28
DIO
_19
29
DIO
_20
30
DIO
_21
31
DIO
_22
32
DIO
_23
36
DIO
_24
37
DIO
_25
38
DIO
_26
39
DIO
_27
40
DIO
_28
41
DIO
_29
42
DIO
_30
43
T7
J4 DN
M
1 2
C24
22p
R14
22
T10
R8
3.3
kR
73.3
k
TD
OT
DI
RE
D L
ED
BLU
E L
ED
BT
N
UART RXD UA
RT
TX
D
BL R
ES
RL R
ES
I2C
SC
LI2
C S
DA
UA
RT
RX
DU
AR
T T
XD
UA
RT
RX
D T
ER
M
UA
RT
TX
D T
ER
M
BLU
E L
ED
BLU
E L
ED
RE
D L
ED
SP
I C
SS
PI M
OS
IS
PI S
CLK
SP
I M
ISO
BT
N
TD
OT
DI
SD
SW
Figure 43: Vital EKG schematic, microcontroller GPIO section.

4.3. Hardware 35
Power
Given the complexity of Vital EKG, a rechargeable LiPo battery has been chosen aspower source. This choice obviously requires circuitry to recharge it, as well as tomonitorthe voltage output and provide the user an estimation of the state of charge. Furthermore,LiPo cells typically require protection circuits to avoid permanent damage to the battery.The schematic of the power section is shown in Fig. 44.
A micro USB connector has been selected to recharge the LiPo battery. MAX1555 byMaxim Integrated [27] allows to safely recharge a single cell LiPo. Its input voltage rangesfrom 3.7V to 6.0V; typical output current is 100mA, considering that the device itselfis powered by USB connector during a recharge. Finally, the Power OK (POK) outputis low when the battery is recharging. This fact has been exploited to bias a green LED,which turns on in this condition. A careful evaluation of the prototype during testingunderlined that LED colors should be made compliant with CE certification in a futurerevision. Thus, it would be best to connect the green LED to the TI CC2640R2FRGZ toallow multiple informations to be delivered through blink patterns.
Battery voltage needs to be regulated to power the digital circuitry. This would notbe strictly required for TI CC2640R2FRGZ because it has its own internal regulator.MAX1759 by Maxim Integrated [28] provides voltage regulation using a Buck/Boostcharge pump. The output voltage is programmable and it has been set to 3.3 V. Outputcurrent is guaranteed to be at least 100mA. Quiescent supply current is 50 µA. Finally,only 3 ceramic capacitors are required, making it an ideal choice for spaced costraineddesigns.
The analog front end is powered by REF2033 by TI [29]. It conveniently providesboth a 3.3V and 1.65V voltage references, which is ideal for single supply systems. Inputvoltage is taken directly from the battery; outputs can be disabled (high impedence) tominimize the power consumption (1) using EN input, directly connected to a GPIO.This feature is really important because the analog section can be completely turned offmost of the time, given that Vital EKG is designed to provide only on-demand EKGmeasurements.
The last component of the power section is MAX17048 by Maxim Integrated [30],which is a tiny current fuel gauge for LiPo cells. It provides battery voltagemeasurementswith a precision of ±7.5mV as well the state of charge, which is estimated using aproprietary algorithm (ModelGauge™[31]). It conveniently provides I2C interface andseparate (configurable) interrupt pin, which has been connected to TI CC2640R2FRGZGPIO.
RF
TICC2640R2FRGZ integrates a dedicatedARM®Cortex®M0processor tomanage timecritical aspects of RF comunication. The RF Core must be completed with an analog RF
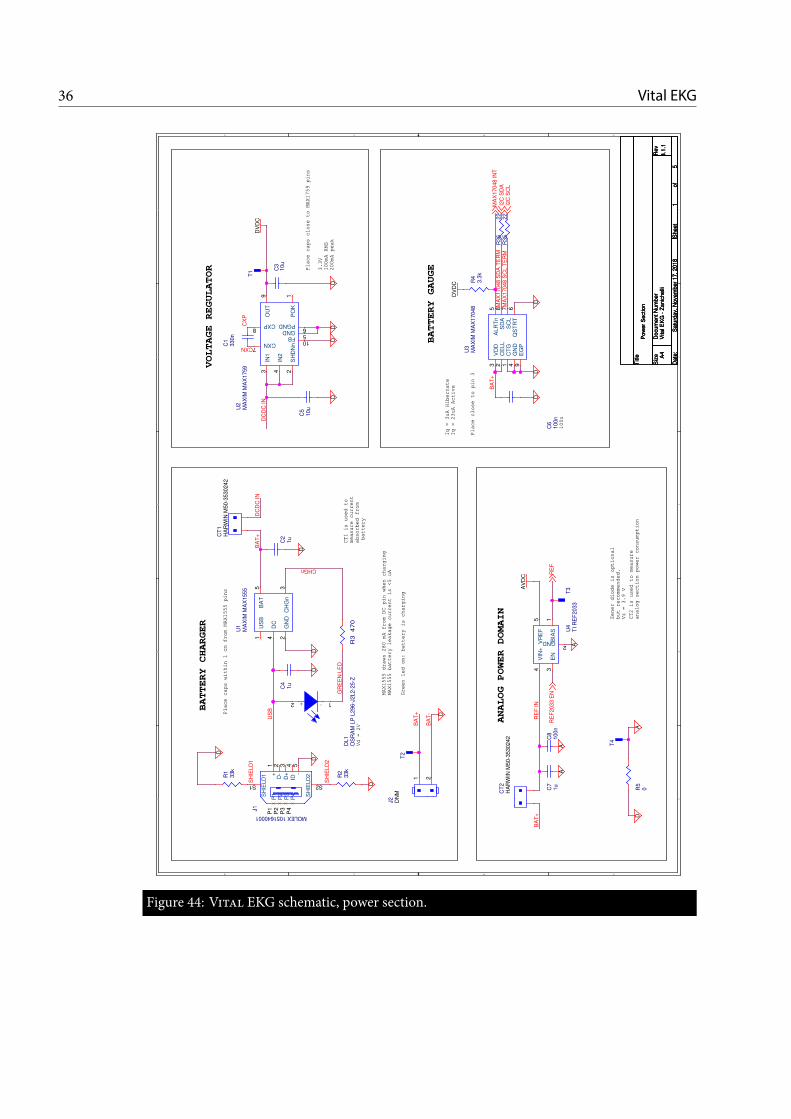
36 Vital EKG
5 5
4 4
3 3
2 2
1 1
DD
CC
BB
AA
Place caps within 1 cm from MAX1555 pins
MAX1555 draws 280 mA from DC pin when charging
MAX1555 battery leakage current is <5 uA
Place caps close to MAX1759 pins
BATTERY GAUGE
VOLTAGE REGULATOR
BATTERY CHARGER
Green led on: battery is charging
CT1 is used to
measure current
absorbed from
battery
Vd = 2V
Place close to pin 3
3.3V
100mA RMS
200mA peak
Iq = 3uA Hibernate
Iq = 23uA Active
Zener diode is optional
but recommended.
Vz = 3.9 V
ANALOG POWER DOMAIN
CT2 is used to measure
analog section power consumption
100n
D
DD
D
DD
D
D
DV
DC
DV
DC
DD
D
D
A
D
AA
AV
DC
DA
D
I2C
SD
AI2
C S
CL
MA
X17048 IN
T
RE
F2033 E
NR
EF
Titl
e
Siz
eD
ocu
ment N
um
ber
Rev
Date
:S
heet
of
Vita
l EK
G -
Zanic
helli
4.1
.1
Pow
er
Sect
ion
A4
15
Satu
rday,
Nove
mber
17, 2018
Titl
e
Siz
eD
ocu
ment N
um
ber
Rev
Date
:S
heet
of
Vita
l EK
G -
Zanic
helli
4.1
.1
Pow
er
Sect
ion
A4
15
Satu
rday,
Nove
mber
17, 2018
Titl
e
Siz
eD
ocu
ment N
um
ber
Rev
Date
:S
heet
of
Vita
l EK
G -
Zanic
helli
4.1
.1
Pow
er
Sect
ion
A4
15
Satu
rday,
Nove
mber
17, 2018
J1
MOLEX 1051640001
1+
2D
-3
D+
ID4 5
-
S1
SH
IELD
1
S2
SH
IELD
2
P1
P1
P2
P2
P3
P3
P4
P4
R2
33k
C4
1u
T1
U4
TI R
EF
2033
BIA
S1
GND2
EN
3
VR
EF
5V
IN+
4
C3
10u
U2
MA
XIM
MA
X1759
PO
K1
SH
DN
n2
IN1
3
IN2
4
GND5
PGND6
CXN7
CXP8
OU
T9
FB10
C1
330n
U1
MA
XIM
MA
X1555
US
B1
GN
D2
CH
Gn
3
DC
4
BA
T5
T3
C2
1u
C8
100n
R36
22
C7
1u
R1
33k
R35
22
CT
2H
AR
WIN
M50-3
530242
CT
1H
AR
WIN
M50-3
530242
U3
MA
XIM
MA
X17048
VD
D3
CE
LL
2
CT
G1
GN
D4
ALR
Tn
5
SD
A8
SC
L7
QS
TR
T6
EG
P9
DL1
OS
RA
M L
P L
296-J
2L2-2
5-Z
1-2 +
T2
C6
100n
R3
47
0
T4
R5
0
R4
3.3
k
J2 DN
M
1 2
C5
10u
SH
IELD
2
US
B
BA
T-
BA
T+
CHGn
GR
EE
N L
ED
CXN
CX
P
BA
T+
BA
T+
DC
DC
IN
DC
DC
IN
SH
IELD
1
RE
F IN
BA
T+
MA
X17048 S
DA
TE
RM
MA
X17048 S
CL T
ER
M
Figure 44: Vital EKG schematic, power section.

4.3. Hardware 37
C13
1pF
L12
2nH
1 2L13
2nH
1 2C14
12pF
ANT
C11
1pF
C21
1pF
C31
6.8pF
RFPRFN
L11
2.7nH
1 2
L212.4nH
1
2
C13
1pF
L12
2nH
1 2L13
2nH
1 2C14
12pF
ANT
C11
1pF
C21
1pF
C31
6.8pF
RFP
RX_TXRFN
L11
2.7nH
1 2
L212.4nH
1
2
L106.2nH
1
2
RF Frontend options
4 Differential output Single-ended output
I
nter
nal b
ias
Ext
erna
l bia
s
Sensitivity:
- BLE: -97 dBm
- Zigbee: -100 dBm
Sensitivity:
- BLE: -96 dBm
- Zigbee: -99 dBm
Sensitivity:
- BLE: -96 dBm
- Zigbee: -97 dBm
Sensitivity:
- BLE: -94 dBm
- Zigbee: -95 dBm
Pout_max = 5 dBm Pout_max = 2 dBm
RF_PC14
12pFC12
1.2pF
L21
15nH1 2
RF_N
C13
1.2pF
L12
2nH
1 2 ANT
RF_PC14
12pFC12
1.2pF
C13
1.2pF
L12
2nH
1 2 ANT
Figure 45: RF analog front end options.
front end and an antenna to provide BLE capabilities.TI recommends several proven designs, which are shown in Fig. 45 [32].Single-ended output with external bias has been chosen due to PCB space constraints
(ix). The presence of an additional inductor as a trade off to increase the sensitivityof 2 dBm seemed reasonable, also considering that TI suggests to avoid placing anycomponent too close to the RF analog front end.
Antenna selection is also critical to obtain desired performances. Chip antennashave the advantage of being small and a few have been considered during Vital EKGcomponent selection. However, they have the disadvantage of being considerably moreexpensive (8) than patch antennas (which are indeed free, if the production cost of aslightly larger PCB is neglected). After comparing performances of both antenna types,one of the patch antennas provided by TI was selected. Detailed performance analysisare provided in [33].
Analog Front-End
The analog front-end schematic is reported in Fig. 46.It can be essentially subdivided in four sections. Before analyzing each section in
full detail, a few general points will be highlighted. The single-rail 3.3 V power supply

38 Vital EKG
5 5
4 4
3 3
2 2
1 1
DD
CC
BB
AA
OPA4330AIPW 14-Pin
PW (TSSOP) Package
ANALOG FRONT-END
STAGE I
STAGE II
STAGE III
STAGE IV
BW-3dB = (0.48; 100) Hz
Gain = 705
Integrator on REF
works as HPF when
combined with INA333
4th order Bessel with 2
Sallen-Key cells
Each analog path to ground
requires vias to ground plane.
Traces up to INA333 must be symmetric
INA333 8-PIN WSON
EXPOSED GROUND PAD
AV
DC
AV
DC
A
A
A
A
A
AA
A
A
EC
G O
UT
RE
F
RE
F
Titl
e
Siz
eD
ocu
ment N
um
ber
Rev
Date
:S
heet
of
Vita
l EK
G -
Zanic
helli
4.1
.1
Analo
g S
ect
ion
A
45
Satu
rday,
Nove
mber
17, 2018
Titl
e
Siz
eD
ocu
ment N
um
ber
Rev
Date
:S
heet
of
Vita
l EK
G -
Zanic
helli
4.1
.1
Analo
g S
ect
ion
A
45
Satu
rday,
Nove
mber
17, 2018
Titl
e
Siz
eD
ocu
ment N
um
ber
Rev
Date
:S
heet
of
Vita
l EK
G -
Zanic
helli
4.1
.1
Analo
g S
ect
ion
A
45
Satu
rday,
Nove
mber
17, 2018
C32
12n
C35
100n
C27
33p
T15
+ -
U7D
TI O
PA
4330
R22
100k
R23
140k
T16
+ -
U7B
TI O
PA
4330
C37
100n
R24
1k
C33
5.6
n
R20
90.9
k
C31
33p
T14
R19
130k
J5 DN
M
1 2
C34
15n
+-
U7A
TI O
PA
4330
U7E
TI O
PA
4330
V+
V-
C36
100n
+ -
U7C
TI O
PA
4330
C29
15n
R16
24.9
k
R15
100k
C28
15n
T13
C26
100n R21
22M
R18
57.6
kC
30
330p
U6
TI IN
A333
VIN
-
VIN
+
RG
1
RG
2V
OU
T
V+V-
REFEGP
R17
121k
INA REF
EC
G IN
N
EC
G IN
P
RG
1
RG
2
ELN
INA FB
ST
AG
E III IN
P
ST
AG
E III O
UT
STAGE IV FB
ST
AG
E II F
B P
ST
AG
E III F
B P
STAGE I OUT
STAGE II OUT
STAGE III OUT
ELP
ST
AG
E II IN
P
Figure 46: Analog front-end schematic.

4.3. Hardware 39
is provided by TI REF2033 reference, which outputs also a 1.65V mid-range referencevoltage.
The analog front-end is essentially structured around two integrated circuits: TIINA333 [34] and TI OPA4330 [35], which have been selected among other similar partsfor their low-power specifications.
The first section is the differential section. Its input is LEAD I EKG signal, whoseamplitude is expected to be few mV.
The differential section inputs feature 1st order low pass filters to remove very highfrequency components. The cut-off frequency has been set to 48.229 kHz. Furthermore,the capacitor across the inputs (C30) helps to minimize common mode noise. It behavesas a differential low pass filter when combined with resistors R15 and R22, with a cut-offfrequency of 4.823 kHz.
The core of this section is TI INA333 instrumentation amplifier. The input signal,besides being only a fewmV in amplitude, is expected to be superimposed to a DC offset,which must be removed from the output. The DC offset, whose amplitude depends onthe electrodes, is present because the bias currents of operational amplifiers charge theelectrodes, which behave like the plates of a capacitor. 22MΩ resistors to ground wouldprovide a path to ground for these currents. In practice, such resistors did not reallymake a clear difference on the output since no baseline has been detected. This has beenverified in a first breadboard prototype of the analog front-end.
Metal electrodes plated with Silver Chloride have been selected for Vital EKGbecause disposable EKG electrodes are not really compatible with the wrist-band formfactor (ix). The DC offset which these electrodes can introduce is of the order of 300mV.
The DC offset must be filtered out before amplifying the signal to avoid saturation.To this end, an integrator is used as INA333 feedback network. A first order OperationalAmplifier (OpAmp) integrator, on its own, is highly unstable: the output quicklysaturates towards one of the supply rails. Conversely, when it is used as a negativefeedback network, its input is lowered (increased) by the INA333 whenever the outputincreases (lowers), stabilizing the system as a whole. Since an integrator has a Low-Passresponse, when used as a negative feedback network the overall response is High-Pass.The −3 dB cut-off frequency is set by the integrator resistor (R21) and capacitor (C34),according to Eq. 4.2:
fc =1
2πRC=
1
2π · 15 nF · 22MΩ= 0.48Hz. (4.2)
The −3 dB cut-off frequency fc has been selected as a trade-off between removal oflow frequency signals introduced by the user’s body (e.g. breathing, muscular noise) andthe duration of the step response transient, which increases as fc does.

40 Vital EKG
1 1.01 1.02 1.03 1.04 1.05 1.06 1.07 1.08 1.09 1.1
1.2
1.4
1.6
1.8
2
2.2
Time (s)
Volta
ge(V)
Differential Section Simulation
InputOutput
Figure 47: Simulation of differential section.
INA333 gain is set to 5.02V/V (Eq. 4.3).
G = 1 +100 kΩRG
= 1 +100 kΩ24.9 kΩ
= 5.02V/V. (4.3)
G has been chosen deliberately low to avoid the saturation of the INA333 due to thepresence of the differential DC offset. It should be noted that presence of the feedbacknetwork would not help in case of OpAmp saturation.
The differential section has been simulated with Cadence PSpice to verify the correctbehaviour of the negative feedback network. As such, the input capacitors and the powersupply network (REF2033) have not been simulated.
The positive input has been connected to a constant voltage V + = 1.65V; thenegative input has been set with a DC signal V −
DC = 1.85V and a sinusoidal signalV −pp = 100mV with a frequency of f = 100Hz. Input and output are shown in Fig. 47.
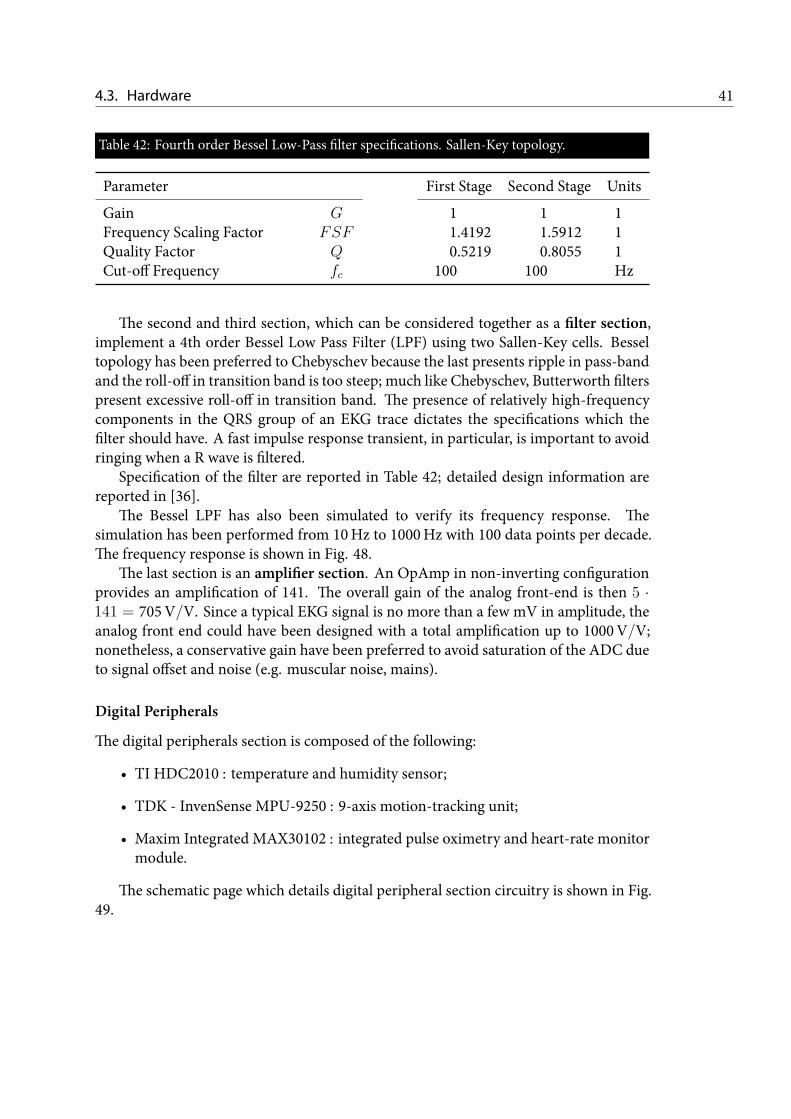
4.3. Hardware 41
Table 42: Fourth order Bessel Low-Pass filter specifications. Sallen-Key topology.
Parameter First Stage Second Stage Units
Gain G 1 1 1Frequency Scaling Factor FSF 1.4192 1.5912 1Quality Factor Q 0.5219 0.8055 1Cut-off Frequency fc 100 100 Hz
The second and third section, which can be considered together as a filter section,implement a 4th order Bessel Low Pass Filter (LPF) using two Sallen-Key cells. Besseltopology has been preferred to Chebyschev because the last presents ripple in pass-bandand the roll-off in transition band is too steep; much like Chebyschev, Butterworth filterspresent excessive roll-off in transition band. The presence of relatively high-frequencycomponents in the QRS group of an EKG trace dictates the specifications which thefilter should have. A fast impulse response transient, in particular, is important to avoidringing when a R wave is filtered.
Specification of the filter are reported in Table 42; detailed design information arereported in [36].
The Bessel LPF has also been simulated to verify its frequency response. Thesimulation has been performed from 10Hz to 1000Hz with 100 data points per decade.The frequency response is shown in Fig. 48.
The last section is an amplifier section. An OpAmp in non-inverting configurationprovides an amplification of 141. The overall gain of the analog front-end is then 5 ·141 = 705V/V. Since a typical EKG signal is no more than a few mV in amplitude, theanalog front end could have been designed with a total amplification up to 1000V/V;nonetheless, a conservative gain have been preferred to avoid saturation of the ADC dueto signal offset and noise (e.g. muscular noise, mains).
Digital Peripherals
The digital peripherals section is composed of the following:
• TI HDC2010 : temperature and humidity sensor;
• TDK - InvenSense MPU-9250 : 9-axis motion-tracking unit;
• Maxim Integrated MAX30102 : integrated pulse oximetry and heart-rate monitormodule.
The schematic page which details digital peripheral section circuitry is shown in Fig.49.

42 Vital EKG
100 101 102 103
−60
−40
−20
0
Frequency (Hz)
Mag
nitude
(dB)
Filter Section Frequency Response
Figure 48: Frequency response of 4th order Bessel LPF with Sallen-Key topology.
TIHDC2010 [37] is a digital temperature and humidity sensor, specifically designedfor low power battery operated products. It has a 6 pins Wafer Level Chip Scale Package(WLCSP) which occupies only 1.45mm2. Both temperature and relative humidity are11 bit wide with an accuracy of ±0.2 ◦C and ±2%, respectively. Average supply currentis only 500 nA in active mode when both temperature and humidity measurements areperformed. Digital interface is provided through I2C and an interrupt pin. Interruptfunctionality is configurable both with respect to source and frequency.
TDK Invensense MPU-9250 is a digital 9-axis motion-tracking unit. It ships in 24pins 3mmx3mmQFNpackage, which is ideal for space constrained designs. It supportsboth I2C and SPI and can also be configured as a master. It is equipped with a 512 BFirst-In, First-Out (FIFO) memory which allows to read many acquisitions with a singleprotocol transaction, thus reducing the overhead associated to slave address and registeraddress (I2C).
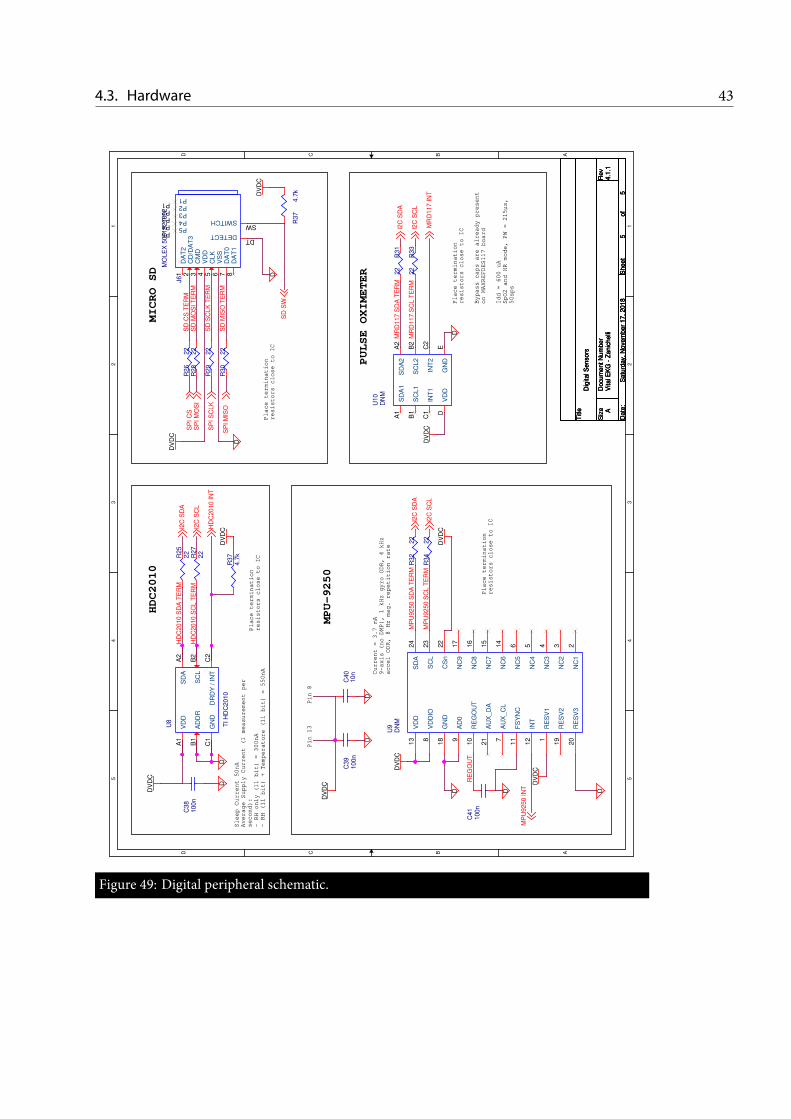
4.3. Hardware 435 5
4 4
3 3
2 2
1 1
DD
CC
BB
AA
Pin 8
Pin 13
HDC2010
MICRO SD
PULSE OXIMETER
MPU-9250
Sleep Current 50nA
Average Supply Current (1 measurement per
second):
- RH only (11 bit) = 300nA
- RH (11 bit) + Temperature (11 bit) = 550nA Current = 3.7 mA
9-axis (no DMP), 1 kHz gyro ODR, 4 kHz
accel ODR, 8 Hz mag. repetition rate
Idd = 600 uA
SpO2 and HR mode, PW = 215µs,
50sps
Bypass caps are already present
on MAXREFDES117 board
Place termination
resistors close to IC
Place termination
resistors close to IC
Place termination
resistors close to IC
Place termination
resistors close to IC
DD
DDDD
D
DD
DV
DC
DV
DC
DV
DC
DV
DC
DV
DC
DV
DC
DV
DC
D
DV
DC
DV
DC
MP
U9250 IN
T
I2C
SD
A
I2C
SC
L
HD
C2010 IN
TS
PI S
CLK
SP
I C
SS
PI M
OS
I
SP
I M
ISO
SD
SW
I2C
SC
L
I2C
SD
A
I2C
SD
A
I2C
SC
L
MR
D117 IN
T
Titl
e
Siz
eD
ocu
ment N
um
ber
Rev
Date
:S
heet
of
Vita
l EK
G -
Zanic
helli
4.1
.1
Dig
ital S
enso
rs
A
55
Satu
rday,
Nove
mber
17, 2018
Titl
e
Siz
eD
ocu
ment N
um
ber
Rev
Date
:S
heet
of
Vita
l EK
G -
Zanic
helli
4.1
.1
Dig
ital S
enso
rs
A
55
Satu
rday,
Nove
mber
17, 2018
Titl
e
Siz
eD
ocu
ment N
um
ber
Rev
Date
:S
heet
of
Vita
l EK
G -
Zanic
helli
4.1
.1
Dig
ital S
enso
rs
A
55
Satu
rday,
Nove
mber
17, 2018
R28
22
R30
22
U9
DN
M
RE
SV
11
NC
12
NC
23
NC
34
NC
45
NC
56
AU
X_C
L7
VD
DIO
8
AD
09
RE
GO
UT
10
FS
YN
C11
INT
12
SD
A24
SC
L23
CS
n22
AU
X_D
A21
RE
SV
320
RE
SV
219
GN
D18
NC
917
NC
816
NC
715
NC
614
VD
D13
R34
22
C40
10n
R27
22
C39
100n
C41
100n
J6
MO
LE
X 5
031821852
DA
T2
1
CD
/DA
T3
2
CM
D3
VD
D4
CLK
5
VS
S6
DA
T0
7
DA
T1
8
SWITCHSW
DETECTDT
P1P1 P2P2 P3P3 P4P4 P5P5
R32
22
R26
22
R29
22
U8
TI H
DC
2010
VD
DA
1S
DA
A2
SC
LB
2
DR
DY
/ IN
TC
2G
ND
C1
AD
DR
B1
U10
DN
M
SD
A1
A1
SC
L1
B1
INT
1C
1
VD
DD
SD
A2
A2
SC
L2
B2
INT
2C
2
GN
DE
R33
22
R31
22
R37
4.7
kR25
22
C38
100n
R37
4.7
k
MP
U9250 S
DA
TE
RM
MP
U9250 S
CL T
ER
M
RE
GO
UT
HD
C2010 S
CL T
ER
MS
D C
S T
ER
MS
D M
OS
I T
ER
M
SD
SC
LK
TE
RM
SD
MIS
O T
ER
M
MR
D117 S
DA
TE
RM
MR
D117 S
CL T
ER
M
HD
C2010 S
DA
TE
RM
Figure 49: Digital peripheral schematic.

44 Vital EKG
Table 43: Maxim Integrated MAX30102 LEDs specifications.
Characteristics IR RED Units
LED Peak Wavelength λP 880 660 nmFull Width at Half Max ∆λ 30 20 nmForward Voltage Vf 1.4 2.1 VRadiant Power PO 6.5 9.8 mW
Maxim Integrated MAX30102 is an integrated module which allows to measureHR and SpO2. It features 2 LEDs, whose specifications are reported in Table 43 [38].A photodetector with a Spectral Range of Sensitivity from 600 nm to 900 nm is alsoincluded in the module.
MAX30102 on itself is 5.6mm by 3.3mm and ships with an Organic Land GridArray (OLGA) package. This is very convenient for production because it minimizesthe footprint area. Nonetheless, it is not a good choice for a first prototype of VitalEKG because it makes the debug of any hardware problem very hard. Moreover,recommended power supply is VDD = 1.8V, plus and V led
DD = 5V for LEDs, whilethe working voltage for Vital EKG is 3.3 V.
For all these reasons, MAX30102 has been replaced by MAXREFDES117, which isa development PCB module designed by Maxim Integrated for rapid prototyping [39].It includes MAX30102, along with MAX14595 (I2C level translator) and MAX1921(step-down converter) to adapt all the voltage levels.
A 18 bit ADC converts the analog reading of the photodetector to digital samples.MAX30102 is equipped with an internal 192 B FIFO memory. Since a sample is 6 B long,up to 32 samples can be stored. MAX30102 can be configured to trigger an interruptwhenever the FIFO memory is in Almost FULL condition, which means there are a userselectable number of free positions (from 0 to 15).
Finally, MAX30102 RED LED can be used to enable a Proximity Interrupt. Indeed,when the user places a finger on MAX30102, the value of the readings substantiallyincreases because RED light which was previously diffused into the environment isabsorbed by the photodetector. This feature is very important because it has beenexploited to start synchronously both MAX30102 acquisition and TI CC2640R2FRGZinternal ADC conversion for EKG.
4.3.2 PCB LayoutThe PCB layout have been done with Cadence Allegro PCB Designer. Even though thePCB described in this work is intended as a first prototype and proof of concept forVital EKG, many effort have been made to keep the size of the PCB as small as possible.

4.3. Hardware 45
The PCB is a two-layer board. Copper layers have a thickness of 18 µm. The minimumtrace width and minimum trace distance have been set to 110 µm. Minimum valueshave been used for digital signals (e.g., I2C and SPI buses, interrupts signals), whichare not particularly affected by noise and do not suffer from increased trace resistance.Wider traces, up to 400 µm, have been used for more delicate signals; these includespower supply traces (300 µm and 400 µm, depending on how much current the specifictrace segment is expected to carry) and analog signals (200 µm). All the vias have beendesigned with 450 µm round pad and 250 µm drill size. It should be noted that the drillsize is merely the size of the tool used by the manufacturing company; finished hole sizevaries according to the plating specifications. Eurocircuits1specifies 100 µm decrease indiamater for plated vias.
.The components have beenplaced according to datasheets recommendations. TheRF
and the analog sections have been positioned at opposite sides of the board to minimizehigh frequency noise components in the EKG signal. The input traces of the analog frontend have been routed as a differential pair to minimize the differential noise picked upby before the instrumentation amplifier. All passive components have been kept as closeas possible to ICs.
The position of the antenna is critical. Ideally, it should not have components andtraces placed nearby or below to maximize performances. In practice, this is a difficultcondition to achieve given the constraints on PCB area. The antenna have been placedin a corner and TI CC2640R2FRGZ have been positioned accordingly to minimize thelength of the RF front end.
Via arrays connected with a trace on the top plane have been used to shield theantenna and the analog front-end. Via matrices have also been used to increase thethermal dissipation of TI CC2640R2FRGZ and INA333, as recommended by datasheets.Finally, decoupling capacitors have been connected with three vias (in a few occasionsonly two vias have been used due to lack of space) to the ground plane on the bottom layerto minimize the resistance. Decoupling capacitors have been placed as close as possibleto the pins to minimize the inductance introduced by the trace segment.
A solid copper pour have been used as ground plane on the bottom layer. Twolayers layout forced to route a few trace segments on the bottom layer. However,whenever possible traces on the bottom layer have been removed or kept short to preventlong return paths for currents. No copper have been placed below the antenna, asrecommended by TI. Moreover, no traces have been routed below the RF front end andTI CC2640R2FRGZ.
Symbol interference is a problem which generally affects digital communicationbuses, such as I2C, SPI and Universal Asynchronous Receiver-Transmitter (UART). Asymbol pulse might reflect at the end of trace and interact with the following symbol. If
1https://www.eurocircuits.com/

46 Vital EKG
the traces are short, the propagation time is also short and the symbol amplitude reducesto negligible values before the following symbol is sent. Conversely, the symbols mightinteract and digital communication may fail. To minimize this problem, 22Ω seriestermination resistors have been used on these traces.
Gerbers files are included in Appendix A.
4.4 Case Design and Fabrication
The PCB presented earlier in this Chapter (4.3.2) has been designed to provide a proofof concept and to ease the development of the firmware.
The design of a production ready PCB with Semi-Flex technology was also planned.The main board has a reduced size, which was possible due to the removal of all testpoints, UART protocol support and Maxim Integrated MAXREFDES117 developmentmodule. Two satellite boards, connected with a Semi-Flex PCB, are necessary to ensurecorrect placing of sensors. TI HDC2010 requires a small satellite board because it needsto be attached to the lower shell of the case to minimize the distance between the sensorand the skin. A second satellite board is necessary becauseMaxim IntegratedMAX30102needs to be visible from the outside, along with the Surface Mount Technology (SMT)LEDs. To satisfy these requirements, the PCB was designed following the open sourceMaxim Integrated MAXREFDES117 documentation.
A 3D-printable plastic case has been designed in partnership with two students ofDepartment of Architecture and Design (DAD) of Politecnico di Torino. A summary ofthe design files is reported in Fig. 410. The size of the case is approximately 50mm x30mm x 20mm. The case has been first 3D-printed at Politecnico di Torino. However, abetter quality result was obtained with a professional 3D-printing service.

4.4. Case Design and Fabrication 47
Ele
ttro
do
sup
erio
re
Ele
ttro
do
infe
riore
SD C
ard
USB
Ext
ern
al
Bat
teria SW T/H
Mai
n B
oard
CO
MP
ON
EN
TI A
LL’IN
TER
NO
DE
L C
ASE
ESP
LOSO
CO
MP
ON
EN
TI
E C
ASE
ESP
LOSO
CO
MP
ON
EN
TI
Figure 410: Summary of case design.

CHAPTER 5Firmware
This chapter has a double aim. On the one hand, it documents the firmwareand the algorithms which power Vital EKG; on the other hand, it serves as aGetting Started document to provide a basis for future development of VitalEKG. Sections 5.1 and 5.2 serve specifically this second purpose.
5.1 Introduction to BLE 4.2 Protocol
An in depth discussion about Bluetooth Low Energy 4.2 is well beyond the scope ofthis document. Nonetheless, a short introduction is necessary to understand why
certain decisions have been made during the design of the Custom Profiles which sitabove the TI BLE 4.2 protocol stack. All the information regarding this section can befound covered in full depth in the Bluetooth Core Specification Version 4.2 [40].
5.1.1 Physical LayerThe BLE Physical Layer (PHY) operates in the unlicensed industrial, scientific andmedical band in the range from 2.4MHz to 2.485MHz. It uses a 1Mbit s−1 GaussianFrequency-Shift Keying (FSK) modulation, which reduces the out-of-band high signalcomponents caused by sudden symbol switching of traditional FSK modulation. Toimprove robustness of the protocol, an adaptive frequency-hopping scheme is alsoimplemented.
Each device can be in any of the following five states:
• Standby;
• Advertising;
49

50 Firmware
• Scanning;
• Initiating;
• Connected.
There are a total of 40 channels, each separated by 2MHz. Connected devices canuse up to 37 channels for frequency-hopping; 3 are reserved to advertisment.
Advertisers broadcast Protocol Data Unit (PDU) on dedicated channels to announcetheir availability for a connection. Scanners listen PDU broadcasted by advertisers. Boththese roles are connectionless. When a scanner responds to an advertiser’s connectionrequest, it assumes the initiator state. If the connection is successfully established,the initiator becomes the master (Central role) and the advertiser becomes the slave(Peripheral role). Central and Peripheral roles are not mutually exclusive and can beassumed by the same device. During a connection, Central and Peripheral devicesswitch channel periodically. Each time they switch channel a new connection eventbegins.
5.1.2 Host and ControllerThe BLE protocol stack is split in two blocks: the Host and the Controller. The hostgroups the higher layers of the protocol stack; the controller includes the lower layers,from the PHY to theHost Controller Interface (HCI). The HCI can either be defined insoftware or in hardware. The TI BLE protocol stack implements the HCI in software.
Above the HCI, on the host side, there is the Logical Link Control and AdaptationLayer Protocol (L2CAP). The L2CAP is responsible for multiplexing, segmentation,and reassembly operations of higher layer packets. L2CAP input packets are technicallycalled Service Data Unit (SDU); a PDU is composed by the L2CAP header and an SDUand represents the L2CAP output.
The default PDU size is 27 B; the L2CAP header is 4 B long, leaving at most 23 Bfor the SDU. The standard PDU size ensures full compatibility between BLE 4.2 and BLE4.0/4.1. TheLowEnergy (LE)Data Length Extension feature of BLE 4.2 allows to increasethe PDU size up to 255 B, loosing compatibility with BLE 4.0/4.1 devices.
Currently, Vital EKG has been designed to support only BLE 4.2 devices. The PDUsize increase request must be issued by the Central device to allow compatibility withPAYLOAD characteristic of EKG Profile, which is 202 B long.
5.1.3 GATT LayerFrom the application standpoint, data communication is handled by the GATT layer ofthe procotol stack. TheGATT layer is an abstraction of theAttribute Profile (ATT) layer.Each device which participates in a connection can either be a GATT client or a GATT

5.1. BLE 4.2 51
server. Servers are the devices which have data to share while clients are those asking fordata. The GATT client/server roles are completely independent from the Generic AccessProfile (GAP) roles.
GATT servers expose data using a formatted database. Characteristics are usuallygrouped to form a service; multiple services consitute a profile, even though the twoterms are often used interchangably because it is common to find single service profiles.
A characteristic is a formatted, atomic abstract information which a GATT serverexposes. To realize such abstract communication, each characteristic is composed ofgroups of bit fields called attributes. Generally, a characteristic is composed of thefollowing attributes:
• Characteristic Declaration. The characteristic declaration informs the clientabout the properties of the characteristic.
• Characteristic Value. The characteristic value is the attribute where the actualinformation which the server wants to expose is stored.
• Client Characteristic Configuration. Notification or indication can be providedby configuring the client characteristic configuration. These messages, which havea dedicated bit field, are sent asynchronously by the server with or without clientacknowledgement, respectively.
• Characteristic user Description. The characteristc user description is an ASCIIstring with a human readable description of the characteristic.
Each attribute is composed of a number of bit fields, listed below.
• Handle. The handle is a unique index which identifies an attribute.
• Type. The type, also called Universal Unique Identifier (UUID), is a 128 bit fieldwhich informs the client about which kind of information is contained in theattribute. There is a number of predefined UUID provided by Bluetooth SpecialInterest Group (Bluetooth SIG) which have standardmeaning. CustomUUID canbe defined to encode custom application behaviour.
• Permissions. The permission flags define if the given attribute can be read (0x02),written with or without response (0x08 and 0x04, respectively), notified (0x10) orindicated (0x20) by the client. The flags, which are all single bit, can be combinedto precisely describe the behaviour of the attribute.
• Value. The value is the payload of the attribute.
When aGATT client intends to request informations from aGATT server, it performa service discovery. BLE specifications state that a client must be able to understand the

52 Firmware
features of a service by only looking at the characteristic declarations. For this reason, acharacteristic declaration attribute UUID must be 0x2803 and its value is a 5 B field withthe following meaning:
• Byte 0 is a code which matches the permissions of the characteristic value;
• Byte 1-2 is the (reversed) attribute handle of the characteristic value;
• Byte 3-4 is the (reversed) attribute UUID of the characteristic value.
5.1.4 GAP LayerThe states and roles for BLE devices are defined by the top layer of the protocol stack:the GAP. The GAP layer is responsible for connection functionality. There are severalconnection parameters which an initiator device sends during a connection requestwhich are controlled by the GAP.
Connection Interval
BLE uses an adaptive frequency-hopping scheme at the PHY layer. Devices whichparticipate in a connection switch channel after a connection interval T , which isconfigurable in the range 7.5ms to 4000ms in steps of 1.25ms. At the beginning ofa connection interval, central and peripheral devices exchange packets even though theGATT client does not make any request to the GATT server. This is required by theBLE specification to mantain the connection. As a consequence, at the beginning ofa connection interval an increase in current draw is normally observed and the powerconsumption increases proportionally. Increasing the connection interval has the directconsequence of lowering the power consumption. On the other hand, the throughputnormally decreases.
Slave Latency
A peripheral device has the option of skipping a number of connection events equalto the slave latency S. This has the advantage of decreasing the number of packetstransmitted by the Peripheral if no useful information needs to be sent, lowering itspower consumption. Furthermore, it gives the Peripheral device more time to receivedata transmitted by the Central device.
Both Peripheral and Central devices may adjust the connection parameters duringan ongoing connection.

5.1. BLE 4.2 53
Effective Connection Interval
From the Peripheral point of view, the connection interval is not respected if the slavelatency is greater than zero because it is allowed to skip connection events. It makes senseto define a new parameter, called effective connection interval Teff , which describe theinterval between two connection events in which the Peripheral device participate. It canbe calculated according to Eq. 5.1.
Teff = T · (1 + S). (5.1)
The slave latency S and the connection interval T must be configured such that theeffective connection interval Teff is lower than 16 s.
5.1.5 LE Data Length ExtensionTheLE data length extension is a feature introduced by the Bluetooth Core SpecificationsVersion 4.2. It permits negotiation of the PDU size between the master and the slave andincreases the maximum size to 251 B while in the connected state. This is a significantimprovement over the Bluetooth Core Specification Versions 4.0 and 4.1, which set themaximum PDU size to 27 B. The maximum transmission time for a PDU, defined at thePHY layer simbol rate, has also been increased to 2120 µs; previous BLE versions alloweda maximum transmission time of 328 µs. It is important to notice that a device can onlycontrol its transmission PDU size and time and the reception PDU size and time of a peerdevice which participate to the connection. The symmetrical parameters are controlledby the peer device.
The dynamic negotiation of higher PDU size and time allows BLE 4.2 devices tomantain full compatibility with older devices. The negotiation is performed by the LinkLayer, which is located in the controller; it sits above the PHY layer and below the lowerHCI.
Increasing PDU size has a direct impact on the amount of RAM which the protocolstack needs. Indeed, the transmission and reception buffers, located in the lower HCI inthe controller, require a larger space. The maximum size of these buffers is configurable:default values for TI BLE 4.2 protocol stack are 8 PDUs for the transmission buffer and4 PDUs for the reception buffer.
5.1.6 SecurityTI BLE 4.2 Stack implentation includes the GAP Bond Manager. It takes care of mostsecurity mechanisms, thus offloading the application from this task.
The Gap Bond Manager is responsible for managing the pairing and bondingprocesses. When two devices establish a connection, they generate and exchange keys(pairing). Optionally, the keys can be stored in non-volatile memory to ensure the

54 Firmware
devices can recognize each other even during following connections (bonding). In orderto enable bonding, the Gap Bond Manager needs to have access to non-volatile memory.This is provided by the SNV Driver. The Gap Bond Manager requires one page offlash memory (4 kB) and one page of Cache as temporary storage to perform memorycompaction. The Gap Bond Manager can also be configured to use two pages of flashto enable backup of bonding keys. This method has been used in Vital EKG, mainlybecause the 8 kB Cache memory has been repurposed as RAM.
5.1.7 ThroughputBLE Core Specification version 4.2 allows to extend the PHY packet size up to 255 B,greatly decreasing the overhead. Indeed, the L2CAP header is 4 B long regardless of PDUsize.
Throughput is only meaningful when talking about transmission of EKG waveform.Indeed, all other sensors produce data which are processed onboard to provide theCentral device only a short information, up to 2 B.
EKG waveform consists of 5000 samples of 2 B each. The processing is performedwith a batch size of 200 samples. Thus, each batch is split in 2 packets. Futher 2 B areappended to each packet to include the progressive number of the packet; this is done toensure correct ordering of the packet at the receiver side. All in all, 50 packets of 202 Bare sent.
To minimize the packet loss, the processing of a batch is started only after theCentral device reads the second (and last) packet of the previous batch. This is possiblebecause the BLE profiles include callback functions which the BLE stack invokes upontransmission of a packet. This choice is inherently slow and computing the throughputdoes not make sense, since it depends on the time the Central device takes to perform aread.
An alternative implementation of EKG waveform transmission would require afeedback characteristic NEXTPACKETOFFSET on EKG profile. Basically, Vital EKG couldprocess continuously all the batches, transmitting ready packets immediately. TheCentral device would read continuously (or subscribe to a notification) and verify theprogression of packets. In case of missed packets, NEXTPACKETOFFSET would be used byCentral device to let know to Vital EKG which packet need to be transmitted again.
5.2 General Architecture
As already mentioned, TI CC2640R2FRGZ is based on ARM® Cortex® M3. It can beused both bare metal or with a Real-Time Operating System (RTOS), conveniently
provided by TI and called TI RTOS. Its documentation can be found in [41].

5.2. General Architecture 55
Firmware development can be carried out using either TI’s proprietary IntegratedDevelopment Environment (IDE), Code Composer Studio (CCS), or IAR EmbeddedWorkbench. In this work, CCS has been used.
TI RTOS is a preemptive real-time operating system. Threads (also called Tasks)run concurrently and a scheduler switches context based on a priority value associatedto each Task.
A few thread-safe structures are part of TIRTOSkernel and simplify greatly inter-taskcommunication (Semaphores, Events, Mailboxes, Queues among others). ApplicationPublic Interface (API) documentation can be found in [42]. Several drivers are alsoprovided to ease the low level management of peripherals. Among others, I2C, SPI, ADC,ADCBuf, RF.
Using an operating system becomes imperative to exploit TI’s implementation of BLEprotocol stack. TI provides several pre-compiled BLE stack libraries, which cover allthe GAP roles a BLE device can assume. In practice, the Stack project is linked to theApplication project and provides a high level interface for BLE communication. Moreinformations about the BLE protocol stack can be found in 5.1. TI’s stack libraries forTI CC2640R2FRGZ are grouped within the SimpleLink™TI CC2640R2FRGZ SoftwareDevelopment Kit (SDK) (latest version at the time of writing is v2.30.00.xx); completedocumentation can be found online at [43].
Vital EKG assumes the Peripheral GAP role. A sample application project can befound by browsing the online resources from within CCS (Resource Explorer). BLEstack library can be accessed by the application using ICall software layer. The use ofICall is not mandatory, since all the standard BLE layers described by the BluetoothCore Specification have their own API. However it is very convenient to simplify thecommunication with the stack library project. All the tasks which send requests overBLE must be ICall-aware and need to register with it before using any ICall API.
The application firmware is organized into several entities. Each entity can begenerally thought as the manager of a sensor, even though this is not true in all thecases (the Continuous Monitoring entity manages the battery gauge, the temperatureand humidity sensor and the motion tracking device).
Communication among entities is achieved using Events, Mailboxes and Queues.The first provides a data-less communication, where only situations are notified; theother modules implement structures which can carry data payloads as well as notifyinga change of state. A communication diagram of Vital EKG behaviour is shown in Fig.51.
5.2.1 BLE DispatcherThe entry point of the application is the BLE Dispatcher, which is in charge of thefollowing:

56 Firmware
BLEDispatcher
SmartDevice
MAX30102Manager
EKGManager
ContinuousMonitoringManager
SDManager
FlashMemoryManager
CMD, D STATUS, D
EVT
EVT_R, D
EVT
EVT_R, D
EVT_R
EVT_R, D
Figure 51: Vital EKG communication diagram. Messages which involve data are marked withD.
• dispatch commands received from the Central device, which is the one whichinterprets the Central GAP role to the appropriate entity;
• forward status updates received from entities to the Central device;
• forward data received from entities to the Central device.
It is important to note that the BLE Dispatcher is a stateless asynchronous entitywhich does not produce or process any data. It is only in charge of managing BLEcommunication at data level and is used to separate conceptually the acquisition andprocessing of information from its transmission. Details about commands and statuscodes are included in Appendix B.

5.2. General Architecture 57
5.2.2 MAX30102 ManagerMAX30102 Manager is a Task which deals with Maxim Integrated MAX30102 sensorconfiguration, RED and IR channels data acquisitions and processing.
MAX30102 Manager is implemented as a Finite State Machine (FSM). This choicearchitecture prevents most deadlock conditions which might happen if BLE Dispatcherreceives unexpected commands from Central device. Indeed, being the BLE Dispatcherstateless, it has no clues about correctness and timing of the commands it forwards.
The configuration of MAX30102 is performed before the FSM starts and is the firstoperation performed by the thread. Parameters are reported in Appendix C, along withheavily commented code about MAX30102 Manager execution.
MAX30102 Manager is also responsible of controlling the execution of the EKGManager. Indeed, there is no way for the analog front-end to understand when the useris really ready for an acquisition (finger placed on the electrode), once the start commandhas been sent from the Central device. For this reason, the Proximity Sensor feature ofMAX30102 has been exploited to synchronize the acquisitions of PPG and EKG signals.This is particularly important for a future development of the firmware, described in7.1.10. Furthermore, the DSP of PPG and EKG signals are performed sequentially toreuse the same RAMblock. The communication betweenMAX30102manager and EKGManager is realized using the Event module; complete reference is provided in AppendixB.
MAX30102Manager FSM is sensible to an acquisition start command only in the idlestate. If this is the case, the FSM proceeds only if the battery voltage is within the range3.4V to 4.0V. MAX30102 Manager is sensible to two events posted by the MonitoringTask, which takes care of signaling the status of the battery. More informations can befound in the events reference (Appendix B).
MAX30102 Manager is also in charge of monitoring the execution of EKG Manager.In particular, it needs to know if the latter completed the processing and transferredall data to the Central device or if the processing is still in progress. In this last case,the ongoing EKG processing is cancelled and a new acquisition can start only whenMAX30102 Manager receives an acknowledge from EKG Manager.
Once these preliminary checks have been completed, MAX30102 is turned on inSPO2 mode with proximity sensor functionality enabled. The sensor generates aninterrupt when the photodetector reading exceeds a programmable threshold. Thishappens whenever an object gets too close to the sensor, because the LEDs light isreflected by the object instead of being diffused into the environment. When theproximity interrupt is caught by TI CC2640R2FRGZ, the sensor is reconfigured togenerate interrupts whenever the internal FIFO memory is almost full. This conditionhas been configured to be triggered when 20 new samples are collected, which means12 positions are still available for new data. At the same time, an acquisition startmessage is sent to EKG Manager to let it start its acquisition. Upon FIFO almost full

58 Firmware
interrupt, samples are read from the FIFO, and transferred to the FlashMemoryManagerfor non-volatile storage. All the samples are checked to make sure no saturation ofMAX30102 ADC or FIFO occurred. More information on this problems are includedin Chapter 7.1.5.
After completing the acquisition, the processing does not start until also EKGManager has completed its acquisition. This synchronization is necessary to ensurethread safety. Indeed, a global memory buffer is used for EKG Manager acquisition andprocessing and MAX30102 Manager acquisition. Alternative design choices are detailedin Chapter 7.1.6. It should be noted that in general communication between FSMs havebeen assumed asynchronous. Whenever a message from an other FSM arrives, it isbuffered until the receiver is ready to process said message.
At this point, MAX30102 Manager executes a data processing algorithm with aquasi-online approach; data are then processed according to different strategy to verifythe results of the first algorithm. The processing phase is described in all detail in Section5.3.
After the processing, a message is sent to EKGManager to communicate thememorybuffer is available and EKG waveform processing can start.
5.2.3 EKGManagerEKG Manager is responsible for acquisitions of EKG signal. Also this Task is organizedas a FSM. When MAX30102 Manager commands the start of an acquisition, the analogfront-end is powered on by setting REF2033_EN pin high. The analog front-end isnormally unpowered to increase battery life. TI REF2033 takes at most 500 µs tostabilize the output signals with 0.1% accuracy. Since the sampling frequency is set to500 Sa s−1, the settling time is short enough to justify this operation at the beginning ofeach acquisition1. The ADC driver which is used is ADCBuf, which provides continuoussampling with two buffers. A callback function is invoked when a buffer is full. Thesamples are saved in internal flash memory after a light processing.
Since the ADC has a maximum sampling frequency of 200 kSa s−1, an oversamplingstrategy has been employed to increase the effective number of bits. Oversampling of1 bit is done by accumulating 4 consecutive samples and dividing the results by 2. Clearlythe sampling frequency must be increases of a factor 4 as well. An oversampling of 2 bithas been performed, obtaining samples with 14 bit effective resolution. The processinghighlighted in Section 5.3.2 has been performed without oversampling to preserve theoriginal signal and to evaluate the performances of the analog front end.
EKG Manager uses four buffers obtained from a unique array used for most ofacquisition and processing. These are as follows:
1Oversampling increases the sampling frequency by 4 times for each added bit of resolution. Thisfact does not impact the timing because the output waveform after oversampling has still a frequency of500 Sa s−1.

5.2. General Architecture 59
• 320 B ADC first buffer;
• 320 B ADC second buffer;
• 320 B ADC support buffer;
• 100 B memory transfer buffer.
The first two buffers of 320 B are used to accumulate 160 Sa of 12 bit, each stored on2 B. After the oversampling processing, 10 Sa are obtained from each ADC buffer. Thesupport buffer is used to transfer the samples from the ADC callback (it is providedas argument of ADCBuf conversion structure) to EKG Manager task context. This isnecessary because the operation performed in callback context should be reduced asmuch as possible. Finally, the memory transfer buffer is used to save the samples inflash memory. This means flash memory is accessed during the acquisition once each100ms at 500 Sa s−1 effective sampling frequency.
After the acquisition is completed, the FSM releases the buffers by signaling toMAX30102 that they can be used for PPG processing.
Once PPG processing has been completed, MAX30102 Manager lets know EKGManager that the memory buffer can be used for EKG processing. EKG Managerprocesses 200 Sa at a time, which are converted to 4 B signed integers before processing.A fixed point strategy with 10 fractional bits is used to represent fractions. This approachreduces the usable dynamics to [−221; 221 − 1] and about 3 decimal digits of accuracy.After the completion of the processing of the first batch of samples, EKGManager signalsto BLE Dispacher that the batch is ready to be sent over BLE using the standard queueon which BLE Dispacher listens to messages.
Processed samples are converted back to 16 bit signed integers before transmission.This allows to halve the amount of data to transmit (400 B for 200 Sa), drastically reducingpower consumption. The output dynamics in this case is [−215; 215 − 1]. However, noreal information is lost in this process. In fact, the raw waveform after oversampling hada resolution of 14 bit.
Data Length Extension allows to send up to 251 B PDU and for this reason each batchof samples is split in two packets before transmission. A further 2 B are added at the endof each packet to indicate its progressive number and facilitate the reconstruction of thesignal without ordering errors.
To minimize the probability of losing packets, a new batch of samples is loaded fromflash and processed only when the Central device performs a read of both packets of thepreviously processed batch of samples. This feedback mechanism clearly introducesa misalignment between MAX30102 Manager and EKG Manager, with the formerentering in idle state much earlier than the latter. To cover error situations in whichMAX30102 Manager commands to EKG Manager to perform a new acquisition even

60 Firmware
though the processing of the previous has not yet been completed, MAX30102 Managerhas the possibility to cancel an ongoing EKG processing.
Appendix D includes commented code about EKG Manager execution.
5.2.4 Monitoring TaskThe Monitoring Task handles all the functionalities of Vital EKG which do not dependon the interaction of the user with Central device. These are:
• skin temperature and humidity monitoring, using TI HDC2010;
• battery monitoring, using Maxim Integrated MAX17048;
• activity tracking, using TDK Invensense MPU-9250.
As all tasks, the basic structure is a never ending loop which blocks on events. Forthis task, a FSM is not required because the interaction with other entities is minimal andthe events are periodic.
TI HDC2010 is configurable to generate an interrupt on a dedicated pin withspecified timeout. The interrupt pin requires a pull-up resistor which was not includedduring the design of the schematic. More information about this error are included inChapter 7.1. Since skin temperature and humidity monitoring needs to be continuous, aworkaround using a timer (Clockmodule of TI RTOS) has been used. The timer timeoutis longer than the sensor reading interval, to be sure to read always updated data.
Maxim Integrated MAX17048 has been configured to provide interrupts when thebattery voltage rises above 4.0V or falls below 3.4V. In both cases, the Central device isnotified of the situation. In the first case, no other action is required since the notificationis only intended to let the user know the battery is fully charged. In the second case, thebattery level is dangerously low, considering that the working voltage is 3.3 V. Hence,the Monitoring task takes care of notifying MAX30102 Manager, which does not allowany acquisition to be started. In both situations, the interrupts are disabled until thevoltage level returns within normal range. The voltage level is monitored by periodicallyreadingMAX17048 registers; the reading interval is decreasedwhen threshold interruptsare generated to reduce the latency associated to the restoring of normal operation.
The current version of Vital EKG does not support activity tracking, despite thehardware is fully operational (a design fault is documented in Chapter 7.1.4). A lowlevel library has been designed to allow configuration, reading and calibration of TDKInvensense MPU-9250. A first approach which allows to classify the types of movementand implement a pedometer is suggested in Chapter 7.1.9.
5.3. Digital Signal Processing 61
5.2.5 Flash Memory ManagerThe Flash Memory Manager handles the internal non-volatile storage using the NVSDriver. The management of the flash memory storage has been offloaded to a dedicatedTask mainly to ensure thread-safety. The Task structure consists of a never endingloop which blocks waiting for a Mailbox message. Entities which intends to perform amemory operation are required to enqueue a message in the mailbox using a specifiedformat. In case of write operations, no response is given, except when errors occur; incase of read operations, data is returned using a response Mailbox message, which thecaller entity provides in the request Mailbox message.
The Flash Memory Manager source code file includes instructions on how to addsupport for Micro-SD card operations using FAT32 file system. This feature is notsupported in the current version of Vital EKG because too much RAM is required asworking memory to operate a file system.
5.2.6 Memory ConfigurationTICC2640R2FRGZ features 128 kBof non-volatile flashmemory, which is shared amongthe BLE stack, the application and eventual data. Furthermore, it is equippedwith 147 kBROM, which are factory programmed with RTOS code.
Volatile storage includes 20 kB of ultra low-leakage main RAM, further 2 kB of RAMdedicated to SCE and 8 kB of Cache.
Since SCE is not used in this version of VitalEKG, itsmemory has been reconfiguredas main RAM. It can be found in the linker configuration file as AUXRAM. Furthermore,also the Cache needed to be repurposed as RAM to fit the whole application. Clearly thischoice trades speed and power consumption for memory size. Indeed, the Cache, whichis found in the linker configuration file as GPRAM, is not an ultra-low-leakagememory andTI CC2640R2FRGZ runs at slightly reduced speed without Cache memory.
5.3 Digital Signal Processing
This section illustrates the algorithms which have been employed for DSP. Generally,all the presented algorithms have been developed in MATLAB first to quickly test
their effectiveness and reliability on data samples. A second phase has required thetranslation of MATLAB code to C code, compatible with ARM® Cortex® M3.
5.3.1 PPG Digital Signal ProcessingThe implementation of a dedicated algorithm to extract HR and SpO2 values has been acore activity of this thesis project.

62 Firmware
0 2 4 6 8 103.86
3.88
3.9
3.92
·104
Time (s)
Value(1
8bitADC)
RED Channel
0 2 4 6 8 10
3.94
3.96
3.98
4
4.02
·104
Time (s)
IR Channel
Figure 52: MAX30102 output. 10 s acquisition at 50Hz (effective).
Due to the limited resources of TI CC2640R2FRGZ (30 kB of RAM overall), dataacquisition and data processing phases have been separated. This only partially violatesthe real-time constraint of Vital EKG (4). This requirement is relaxed by on-demandacquisitions, as explained in 4.1.
The DSP can be conceptually split in 2 distinct algorithms. The first algorithm allowsthe identification of both HR and SpO2 by directly operating on RED and IR channels;the second allows only to find the HR and is used to improve the reliability of the firstalgorithm. In the following, they are identified as Time Domain (TD) processing andFrequency Domain (FD) processing, respectively.
At this point, it is useful to refer to a typical MAX30102 acquisition. RED and IRchannels are shown in Fig. 52. The acquisition has been performed in typical conditions:10 s at 50Hz. More details about MAX30102 configuration are included in 4.3.1.
The channels are both characterized by an AC signal superimposed to a large DCsignal. Furthermore, the first samples of any acquisition should not be consideredbecause they are affected by artifacts introduced by the finger placed on the sensor. Inthe following, only effective samples are considered when referring to 10 s acquisitions.Generally, most acquisitions present a slowly-varying baseline signal in both channels.In other words, the DC signal (as defined in [44]) should not be considered constantduring an acquisition.
Optimization of the RAM of ARM® Cortex® M3 has required the DSP to be donefew samples at a time. Nonetheless, the processing is not performed online because theacquisition is completed before starting the DSP on the first batch of samples. This kindof processing, easily adaptable to a strictly online scenario, will be called quasi-online.

5.3. Digital Signal Processing 63
TD processing
TD processing is based on the observation that both channels have a clearly periodicsignal. In order to evaluate SpO2, precise peaks and valleys locations and values must beestimated. Channels are processed sequentially in the same way. Thus, only one channelwill be considered during in this Section.
The first step, after loading a few samples from flash memory, is to LPF the signal.Specifications are listed below:
• Butterworth;
• 4th order;
• 5Hz cut-off frequency;
• unitary DC gain;
• 30 samples step response transient;
• 7 samples maximum group delay (close to 5Hz).
This step is necessary to reduce high frequency components. It has been implementedas two second order sections Infinite Impulse Response (IIR) filter in TransposedDirect-Form II because of superior numerical stability in fixed point implementations.To minimize the effects of the step response transient, the filter internal state variablesare initialized to a typical DC value. Clearly, this static choice does not eliminate thetransient but an improvement has been observed. Furthermore, the first 7 samples arenot considered in the following processing steps because of the delay introduced by thefilter. Results are shown in Fig. 53.
The rest of the processing for main peaks and valleys detection is based on theobservation that peaks represent systoles; as such, they are impulsive and after a peak thesignal exhibits a large decrease inmagnitude in short time. As a consequence, the discretetime derivative of the signal is expected to have large negative peaks right after a peak ofthe channel signal, as shown in Fig. 54. The differentiation performed according to 5.2 isfar from optimal. Indeed, it greatly amplifies noise as well as high frequency useful signalcomponents. However, in-depth testing has proved that a first order difference equationis enough and has the great advantage of being computationally extremely simple.
y[n] = x[n]− x[n− 1]. (5.2)
After computing the derivative, a threshold value is calculated as a fraction of theminimum value in the time interval.
At this point, it is necessary to evaluate the locations at which the derivative is equalto the threshold. Two points, which are called left and right threshold locations in the

64 Firmware
0 1 2 3 4 5 6 7 8 9 103.93
3.94
3.95
3.96
3.97
3.98
3.99
4
4.01
4.02
·104
HR = 82 BPM SpO2 = 99
Time (s)
Value(1
8bitADC)
IR Channel
PeaksValleys
Figure 53: MAX30102 IR channel after Butterworth LPF filtering. Peaks and valleys detectedby TD DSP are highlighted.
following, are expected for each peak of the derivative. Clearly, for a digital signal thisstep is a minimization problem: the pair of points for which the difference between thethreshold and the derivative is lower is considered (for each peak).
This step is critical to correctly identify peaks and valleys. Indeed, if a threshold tooclose to the minimum value is chosen (threshold factor too close to 1), too few peaksmight be detected and estimated HR will be too low. To minimize this problem, thethreshold factor is initially set close to 1 and iteratively decreased by 10% until at least apair of threshold locations is found; if no pair is found within the first 5 iterations, systoleevents are assumed to be absent in the time interval under analysis. If the number ofiterations were not limited, threshold locations might be found were no systole eventoccurred, causing excessive HR estimation.
Since the search of threshold location pairs is performed by scanning linearly the

5.3. Digital Signal Processing 65
0 1 2 3 4 5 6 7 8 9 10
−50
−40
−30
−20
−10
0
10
20
30
Time (s)
Value(1
8bitADC)
IR Channel Derivative
Figure 54: MAX30102 IR channel. First order discrete time differentiation.
sample interval (online detection), a few limit cases are considered below and illustratedin Fig. 55.
1. Thefirst threshold location pair of a sample interval is detected but no peak is reallyassociated to it because the sample interval begins between the peak (which is inthe previous interval) and the left threshold location point; a specular case can beidentified at the end of the sample interval.
2. Only the right threshold location point is detected at the beginning of a sampleinterval because the sample interval begins right in the middle of a thresholdlocation pair; also in this situation, a specular case exists at the end of the sampleinterval.
These problems are solved by considering an adaptive size for the sample interval.More specifically, all the samples which follow the last right point threshold location

66 Firmware
are prepended to the following sample interval. A key point to remember is that ina Butterworth filter current output depends on past inputs and past outputs. In otherwords, it is an IIR filter characterized by zeros and poles. This fact does not allow toperform double filtering of the same samples (the ones which must be prepended to thenew sample interval) to avoid a modification of the state of the filter. The sample intervalis composed of a variable number of past elements and a fixed number of new elements(50), which are linked together only after filtering.
Once that threshold location points have been identified, peaks and valleys locationscan finally be estimated easily. Indeed, it can be assumed that no maxima and minimaare present in the interval between a peak and a valley. Thus, for each couple of thresholdlocation points, a peak location can be found by scanning the derivative signal backwardstarting from the left threshold location point; conversely, a valley can be found byscanning the same signal forward starting from the right threshold location point. Inboth case, the location of peak and valley is determined by the zero of the derivativesignal (in wide sense: finding the zeros of a discrete signal is again a minimizationproblem).
During forward scanning to find a valley location, the end of the interval mightbe encountered before a zero is found in the derivative signal (for the last thresholdlocation pair of the interval). In this case, the simplest approach to solve the problemis to modify the number of samples which must be processed again in the followinginterval. Specifically, it must be extended back up to the right threshold point of thelast peak-valley pair successfully detected in the current interval.
The identification of peaks and valleys, along with their locations, concludes thequasi-online, channel-independent processing. The alignment of the channels is keypoint to successfully estimate SpO2: each peak-valley pair of the RED channel shouldbe superimposed to a peak-valley pair of the IR channel. To make sure this happens,the lists of peaks and valleys of the 2 channels are analyzed with a peak-valley matchingprocedure which keeps only the peaks and valleys whose location differ by less than 5samples across the channels. A tolerance of±5 samples means that RED and IR data canhave a shift of no more than±100ms at the typical sample rate of 50 Sa s−1. At this point,HR, expressed in Beats per Minute (BPM), can be estimated easily using Eq. 5.3.
BPM =60fs
PP. (5.3)
PP is the average distance in samples between peaks after the application of thepeak-valley matching procedure.
Estimation of SpO2 is based on computation of RED:IR modulation ratio (Eq. 2.9).Maxim Integrated indicates a simple method for evaluation of DC and AC components[44]. The DC component is the value component of the projection of a peak on thestraight line crossing its two adjacent valleys; the AC component is the distance betweenDC point and the peak used for the projection.

5.3. Digital Signal Processing 67
4 4.2 4.4 4.6 4.8 5 5.2 5.4 5.6 5.8 6
−40
−30
−20
−10
0
10
20
Time (s)
Value(1
8bitADC)
IR Channel Derivative - detail
Left threshold locationsRight threshold locations
Figure 55: Evaluation of the threshold location pairs in MAX30102 channels.
Finally, the SpO2 is linked to R by a relationship which strongly depends on thelight sources and photodetectors. Maxim Integrated provides the following calibrationrelation:
SpO2 = −45.060R2+ 30.354 ∗R + 94.845, (5.4)
where R indicate the average R across the whole acquisition interval. Testing hasunderlined that Eq. 5.4 is a parabola which presents an excessive aperture. In practice,values in the range 99% to 100% were too common when compared to the fingerclipsensor used as a reference. For this reason, Eq. 5.5 has been derived experimentally andused instead as a calibration relation.
SpO2 = −1R2+ 1 ∗R + 1. (5.5)
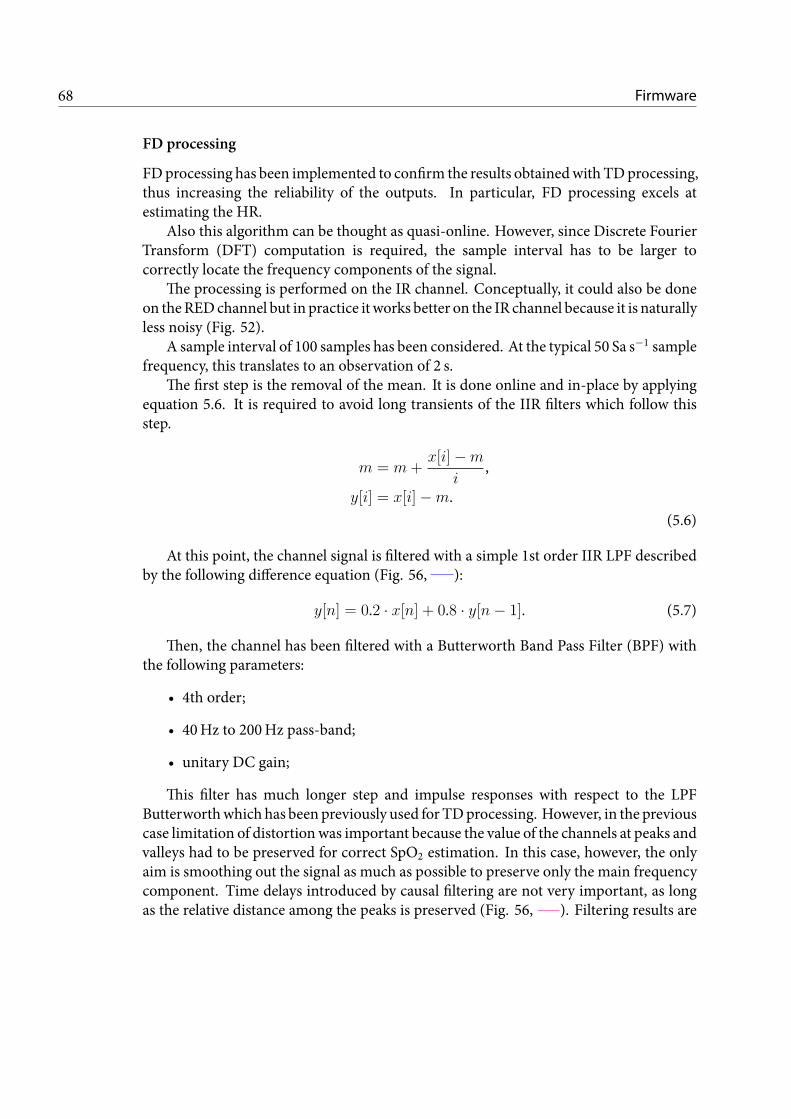
68 Firmware
FD processing
FDprocessing has been implemented to confirm the results obtainedwith TDprocessing,thus increasing the reliability of the outputs. In particular, FD processing excels atestimating the HR.
Also this algorithm can be thought as quasi-online. However, since Discrete FourierTransform (DFT) computation is required, the sample interval has to be larger tocorrectly locate the frequency components of the signal.
The processing is performed on the IR channel. Conceptually, it could also be doneon theREDchannel but in practice it works better on the IR channel because it is naturallyless noisy (Fig. 52).
A sample interval of 100 samples has been considered. At the typical 50 Sa s−1 samplefrequency, this translates to an observation of 2 s.
The first step is the removal of the mean. It is done online and in-place by applyingequation 5.6. It is required to avoid long transients of the IIR filters which follow thisstep.
m = m+x[i]−m
i,
y[i] = x[i]−m.(5.6)
At this point, the channel signal is filtered with a simple 1st order IIR LPF describedby the following difference equation (Fig. 56, ):
y[n] = 0.2 · x[n] + 0.8 · y[n− 1]. (5.7)
Then, the channel has been filtered with a Butterworth Band Pass Filter (BPF) withthe following parameters:
• 4th order;
• 40Hz to 200Hz pass-band;
• unitary DC gain;
This filter has much longer step and impulse responses with respect to the LPFButterworthwhich has been previously used for TDprocessing. However, in the previouscase limitation of distortionwas important because the value of the channels at peaks andvalleys had to be preserved for correct SpO2 estimation. In this case, however, the onlyaim is smoothing out the signal as much as possible to preserve only the main frequencycomponent. Time delays introduced by causal filtering are not very important, as longas the relative distance among the peaks is preserved (Fig. 56, ). Filtering results are

5.3. Digital Signal Processing 69
0 2 4 6 8 10
−200
0
Time (s)
Value(1
8bitADC)
IR Channel - LPF
0 2 4 6 8 10
−50
0
50
Time (s)
IR Channel - Butterworth BPF
Figure 56: MAX30102 10 s acquisition at 50Hz (effective). FD processing.
shown on the whole acquisition for presentation reasons. However, as long as the stateof IIR filters is preserved during the transition from an inteval to the next and no sampleis filtered twice, the results are exactly the same.
At this point the channel signal is clean enough to continue the processing in thefrequency domain. The HR can be estimated by computing the periodicity of the signal.A simple and reliable way to do that is to calculate the Autocorrelation Function (ACF),that is the correlation of a signal with a delayed copy of itself. The location of the firstpeak (excluding the one at 0 delay, which is the ACF of the signal with a non delayedversion of itself and it’s not informative), expressed in seconds, gives the periodicity ofthe original signal. The ACF for a discrete signal x is defined according to Eq. 5.8.
Rxx[ℓ] =N−1∑i=0
x[i] · x[i− ℓ], (5.8)
in which ℓ ∈ Z is the delay of the copy. For a time limited signal of sizeN ,Rxx[ℓ] = 0for |ℓ| > N .
The computation of the ACF according to 5.8 has a quadratic complexity; that is notacceptable in most cases in which N is large. An efficient method to calculate the ACFis to use the DFT. Indeed, it turns out that:
Rxx[ℓ] = IDFT{∣∣DFT
{x[n]
}∣∣2}, (5.9)
as a consequence of the Wiener-Khinchin theorem [45]. The advantage stems fromthe fact that the computation of DFT can be performed using Fast Fourier Transform

70 Firmware
(FFT) algorithm if N = 2m, reducing the complexity to N · log(N). Given the size ofthe interval set to 100 samples, a FFT of size N = 256 has been chosen and the signalhas been zero-padded to obtain the required length. Moreover, computation of the ACFusing FFT requires N to be at least twice the signal length to avoid circular convolutionintroduced by FFT [46].
Further optimizations have been applied to reduce the memory footprint of thealgorithm. In general, a N points FFT algorithm takes a complex sequence of length Nand produces a complex sequence of the same length. However, if the input is real theoutput is guaranteed to be Hermitian. It can be proved that the FFT of a real sequenceof length N can be obtained by rearranging the input into a complex sequence of lengthN/2, performing a FFT of length N/2 and a few additional computations. In this case,the output is a complex sequence of length N/2 which does not present any symmetry[47].
At this point, |DFT{x[n]
}∣∣2 must be computed. A convenient way to do that ismultiplying the complex FFToutput of lengthN/2 just obtained by its complex conjugateto obtain aN/2 real signal. The optimization exploited earlier is useful again because theinverse FFT of a real sequence of length N/2 has to be computed. However, since theACF is known to be real, it is convenient to mirror2 the signal and produce a real eveninput signal of length N for the optimized inverse FFT algorithm3. Finally, the ACF canbe truncated to the first 50 samples because it is even; furthermore, the last 156 samples(zero-padding) are zero (Eq. 5.8). The ACF has been normalized in the interval [−1; 1],since the maximum is always at 0 lag.
The relation between the lags and the HR expressed in BPM is shown in Eq. 5.10.Note the similarity with Eq. 5.3.
BPM =60fsℓpeak
. (5.10)
The ACF for 100 samples (from the 300th to the 399th of the IR channel is shown inFig. 57.
5.3.2 EKG Digital Signal Processing
The EKG DSP is performed for two reasons. Firstly, the raw signal, as acquired fromthe ADC, has large noise components which must be filtered in order to appreciate
the waves of a typical EKG; secondly, the location of the R waves must be identified to2When mirroring a signal of length N to produce an even sequence of length 2N , it must be
remembered that FFT algorithm expects a periodic input. As such, mirroring the sequence {4, 3, 2, 1}produces {4, 3, 2, 1, 1, 1, 2, 3} which is even when extended to [−∞; +∞].
3Alternatively, the (inverse) FFT of a real even sequence can be computed efficiently using a DiscreteCosine Transform (DCT). This step would further halve the complexity and the memory requirements.Efficient algorithms to compute the DCT based on FFT are documented in literature [].
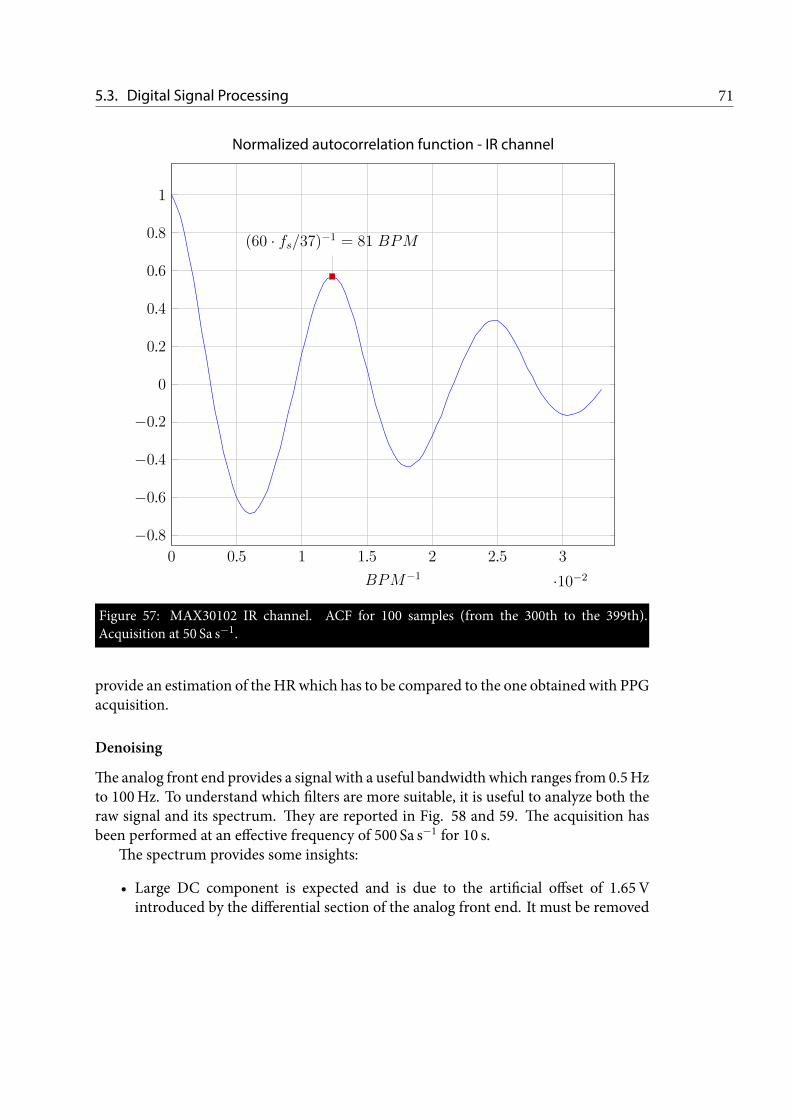
5.3. Digital Signal Processing 71
0 0.5 1 1.5 2 2.5 3
·10−2
−0.8
−0.6
−0.4
−0.2
0
0.2
0.4
0.6
0.8
1
(60 · fs/37)−1 = 81 BPM
BPM−1
Normalized autocorrelation function - IR channel
Figure 57: MAX30102 IR channel. ACF for 100 samples (from the 300th to the 399th).Acquisition at 50 Sa s−1.
provide an estimation of the HRwhich has to be compared to the one obtained with PPGacquisition.
Denoising
Theanalog front end provides a signal with a useful bandwidth which ranges from 0.5Hzto 100Hz. To understand which filters are more suitable, it is useful to analyze both theraw signal and its spectrum. They are reported in Fig. 58 and 59. The acquisition hasbeen performed at an effective frequency of 500 Sa s−1 for 10 s.
The spectrum provides some insights:
• Large DC component is expected and is due to the artificial offset of 1.65Vintroduced by the differential section of the analog front end. It must be removed

72 Firmware
0 1 2 3 4 5 6 7 8 9 10
1,200
1,300
1,400
1,500
1,600
1,700
1,800
1,900
2,000
2,100
Time (s)
Value(1
2bitADC)
Raw EKG Signal
Figure 58: Raw EKG signal. Acquisition of 10 s at 500 Sa s−1.
before processing to minimize the step response of IIR filters.
• There is a strong 50Hz component (and multiples) due to mains. Upon carefulinspection, the first peak in the spectrum occurs at 49.68Hz. After exhaustivetesting with a 50Hz sinusoidal signal, it was found that the internal ADC of TICC2640R2FRGZ introduces a systematic frequency shift. The simplest solution tothis problem is to set the sampling frequency at 496 Sa s−1. This value has beenobtained experimentally.
The processing of raw EKG signal has been kept as simple as possible to preserve thefeatures of the signal and avoid distortions. As a first operation, the artificial offset of1.65V has been removed sample by sample. This is possible because this offset has beenintentionally introduced in the analog front-end to make the waveform compatible withsingle-rail supply voltage. The remainingDCcomponent, alongwith 50Hz andmultiples

5.3. Digital Signal Processing 73
0 20 40 60 80 100 120 140 160 180 200 220 24020
40
60
80
100
120
140
Frequency (Hz)
Mag
nitude
(dB)
Spectrum of raw EKG Signal
Figure 59: Spectrum of raw EKG signal computed with FFT of size 213.
and slowly-varying baseline components, has been removed using a Comb Notch filterwith the following specifications:
• order N = 10;
• bandwidth BW = 0.01;
• unitary DC gain;
• 300 samples step response transient;
• 300 samples impulse response transient;
• 64 samples maximum group delay at notch frequencies.

74 Firmware
0 20 40 60 80 100 120 140 160 180 200 220 240
0
0.2
0.4
0.6
0.8
1
Frequency (Hz)
Mag
nitude
Magnitude Response
Figure 510: Magnitude response of 10th order Comb Notch filter.
The order is computed according to Eq. 5.11.
N =fsff
, (5.11)
where fs = 500 Sa s−1 is the sampling frequency and ff = 50Hz is the center of thenotch where the filter provides maximum attenuation. A 10th order comb notch exhibits10 equally spaced notches in the range −fs/2 to fs/2. The bandwidth is computed at−3 dB and represents the width of the notch. The magnitude response is shown in Fig.510.
The comb notch filter is the simplest approach to denoise a EKG signal. However,the 300 samples impulse response transient heavily affects the QRS complex, whichbehaves like an impulse. Furthermore, the group delay has peaks of 64 samples atmultiples of 50Hz. Significant distortion is introduced for these frequencies. To provide
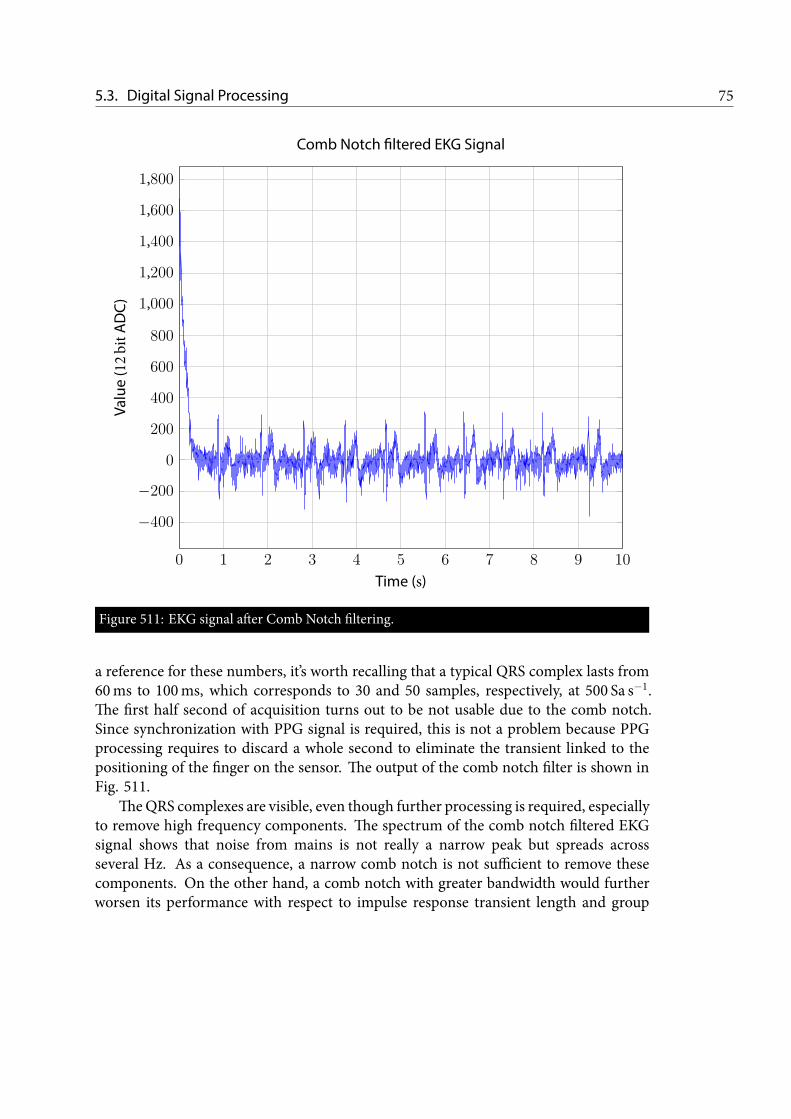
5.3. Digital Signal Processing 75
0 1 2 3 4 5 6 7 8 9 10
−400
−200
0
200
400
600
800
1,000
1,200
1,400
1,600
1,800
Time (s)
Value(1
2bitADC)
Comb Notch filtered EKG Signal
Figure 511: EKG signal after Comb Notch filtering.
a reference for these numbers, it’s worth recalling that a typical QRS complex lasts from60ms to 100ms, which corresponds to 30 and 50 samples, respectively, at 500 Sa s−1.The first half second of acquisition turns out to be not usable due to the comb notch.Since synchronization with PPG signal is required, this is not a problem because PPGprocessing requires to discard a whole second to eliminate the transient linked to thepositioning of the finger on the sensor. The output of the comb notch filter is shown inFig. 511.
TheQRS complexes are visible, even though further processing is required, especiallyto remove high frequency components. The spectrum of the comb notch filtered EKGsignal shows that noise from mains is not really a narrow peak but spreads acrossseveral Hz. As a consequence, a narrow comb notch is not sufficient to remove thesecomponents. On the other hand, a comb notch with greater bandwidth would furtherworsen its performance with respect to impulse response transient length and group

76 Firmware
delay. For these reasons, a 4th order Low-Pass Butterworth filter has been applied afterthe comb notch. Specifications are listed below.
• order N = 4;
• cut-off frequency fc = 40Hz;
• unitary DC gain;
• 30 samples step response transient;
• 30 samples impulse response transient;
• 8 samples maximum group delay at cut-off frequency.
This filter provides an attenuation of only 9 dB at 50Hz; it ismuchmore effective at itsmultiples, providing 36 dB attenuation at 100Hz. Furthermore, introduced distortionsare very modest with respect to the comb notch.
The filtering phase has been concluded with the application of 2 moving averagefilters of length 10 (also called box filters) to smooth out the signal. The use of movingaverage filters is controversial. Their response is Low-Pass but they have the downside ofwidening the QRS complexes. Further analyses of the signals cannot rely on typical QRScomplex duration after the application of wide box filters.
The final result of the denoising filtering is shown in Fig. 512. The distortionsintroduced by the comb notch filter are clearly visible in increased S wave after the Rwave and negative deflection after the T wave. Furthermore, the ST segment should beisolectric and the increased S waves cause this feature not to be visible. Finally, 50Hznoise components remain because Butterworth LPF is only moderately effective at thisfrequency.
5.3.3 QRS complexes identificationThe identification of QRS complexes is in development on the Central device, after BLEtransmission to the denoised EKG waveform. The employed procedure is a modifiedversion of Pan-Tompkins algorithm, which is a classic QRS detection routine introducedin 1985 by J. Pan and W. Tompkins [48].
5.4 Android Application
An Android application is in development to pair Vital EKG with a user-friendlyvisualization of acquisition results. A rendering of the interface is shown in Fig.
513.

5.4. Android Application 77
6 6.2 6.4 6.6 6.8 7 7.2 7.4 7.6 7.8 8 8.2 8.4 8.6 8.8 9
−0.25
−0.2
−0.15
−0.1
−5 · 10−2
0
5 · 10−2
0.1
0.15
0.2
0.25
0.3
Time (s)
Volta
ge(m
V)
Denoised EKG Signal
Figure 512: EKG signal after denoising filtering. Focus on 3 s. The signal is scaled by the totalamplification of the analog front end (705).

78 Firmware
Figure 513: Android app rendering. Results window.

CHAPTER 6Testing and Discussion
After complete hardware testing, which highlighted a few pitfalls in the designwhich are described in all detail in Chapter 7.1, Vital EKG’s firmwarehas been verified to ensure correct behaviour in all circumstances withoutdeadlocks and to assess correctness and accuracy of the algorithms discussed
in 5.3.
6.1 Testing with Vital Sign Patient Simulator
All the algorithms described in 5.3 have been coded specifically for Vital EKG. Insome cases, such as TD PPG processing, the algorithms have been engineered from
scratch; in other cases, such as FFT implementation, the coding phase has been limitedto a translation of already existing Matlab code or pseudocode found in literature. Toexclude potential pitfalls in the design phase of the algorithms, the initial testing hasbeen performed with Fluke ProSim 3 Vital Sign and ECG Simulator.
6.1.1 EKG Acquisition SystemThe analog front end, along with the ADC configuration, has been tested using FlukeProSim 3 Vital Sign and ECG Simulator. LA and RA terminals have been used andattached to Vital EKG’s electrodes. Several of the available configurations have beentested but only a few of them are included in this section for brevity. UnfortunatelyFluke ProSim 3 Vital Sign and ECG Simulator does not allow to export data to assessnumerically the acquisition system. For each test, both the raw ( ) and denoised( ) signals are included. All the acquisitions have been performed for 10 s at aneffective sampling frequency of 500 Sa s−1 (the ADC has been set to 16 · 496 Sa s−1 foran oversampling of 2 bit).
79

80 Testing and Discussion
6 7 8 9
−500
0
500
1,000
Time (s)
Value(1
4bit)
Raw EKG
6 7 8 9
0
500
Time (s)
Denoised EKG
Figure 61: ProSim 3 waveform. 100 BPM, 1mV, adult.
6 7 8 9
0
1,000
Time (s)
Value(1
4bit)
Raw EKG
6 7 8 9
0
500
Time (s)
Denoised EKG
Figure 62: ProSim 3 waveform. 100 BPM, 1mV, adult, 50Hz noise.
Fig. 61 and 62 show a healthy heart with an accelerated heart rate of 100 BPM.Artificial mains noise at 50Hz is added to the waveform in Fig. 62. In this case thefiltering is effective, with two major drawbacks:
1. the short ST interval is not isoelectric, due to the strong distortion that the CombNotch filter introduces. The effect worsens with accelerated heart rates.
2. Comb Notch aggressive filtering introduces an artificial negative deflection after

6.1. Patient Simulator 81
6 7 8 9−500
0
500
1,000
Time (s)
Value(1
4bit)
Raw EKG
6 7 8 9−500
0
500
Time (s)
Denoised EKG
Figure 63: ProSim 3 waveform. 60 BPM, 1mV, adult, muscular noise.
6 7 8 9
0
1,000
Time (s)
Value(1
4bit)
Raw EKG
6 7 8 9
0
500
Time (s)
Denoised EKG
Figure 64: ProSim 3 waveform. 60 BPM, 1mV, adult, breathing noise.
the T wave.
Fig. 63, 64 and 65 introduce artificial muscular noise, breathing and wanderingeffects, respectively. Muscular noise cannot really be removed completely because itsfrequency coincides with important frequency components of the EKG signal.
Breathing introduces a low frequency baseline in the signal around 0.3Hz. Thehardware 1st order High-Pass filter, realized by the feedback integrator network of theinstrumentation amplifier, does not help in this case because it has been designed with

82 Testing and Discussion
6 7 8 9
−500
0
500
1,000
Time (s)
Value(1
4bit)
Raw EKG
6 7 8 9
0
500
Time (s)
Denoised EKG
Figure 65: ProSim 3 waveform. 60 BPM, 1mV, adult, wandering noise.
a cut-off frequency of 0.48Hz.The Comb Filter is instead effective. Indeed, it has been designed with a bandwidth
BW = 0.01 · fs/2 = 2.5Hz, which means only half of it lies in the positive frequencyaxis for the DC notch. The attenuation provided at 0.3Hz is greater than 12 dB. Thebaseline is not completely removed and is still visible between the T wave and the P wave,where the signal presents an abnormally increasing segment.
The term wandering noise groups all the movements which modify the conductionpaths during the acquisition. These includes, for example, small arm movements, whichare very common in real EKG acquisition. The net effect is a denoised signal very similarto the previous case.
Fig. 66 depicts a simulation of atrial fibrillation condition. The atria contractautonomously and the ventricular systole is not regular. In this case, the oscillationswhich derive from atrial contractions are not removed by the denoising algorithm,potentially allowing correct identification of the condition.
Many other waveforms have been tested. However they are not included because thefocus of this thesis work is not on the correct identification of cardiac abnormal rythms.
6.2 Testing on Patients
A further validation phase was carried out with the help of generally healthy subjects.A few difficulties have been encountered and are presented in this section, along
with relevant results.

6.2. Testing on Patients 83
6 7 8 9−500
0
500
1,000
Time (s)
Value(1
4bit)
Raw EKG
6 7 8 9
0
500
Time (s)
Denoised EKG
Figure 66: ProSim 3 waveform. 1mV, adult, atrial fibrillation.
6.2.1 EKG Acquisition SystemEKG acquisition system, as underlined already in previous Chapters, presents weakpoints in the DSP. Specifically, the step and impulse responses of the Comb Notch filterintroduce deflections both after R waves and after T waves.
Furthermore, a meaningful validation of the analog front-end and digital filterswould require a numerical comparison with a synchronized waveform acquired by aprofessional certified electrocardiograph. Unfortunately, such a system is not availableat the time of writing.
6.2.2 Maxim Integrated MAX30102The validation of Maxim Integrated MAX30102 with artificial PPG signals has beentried with Fluke SPOT Light SpO2 FUNCTIONAL TESTER. Unfortunately this tool isonly intended to test transmittance based devices, since it features photodetectors andLEDs on opposite sides. In order to generate a signal, two samples of MAX30102 weremounted on the tester. The first sample was positioned below the tester, in order to facethe photodetectors and allow the generation of a suitable response, which was measuredby the first sample. The system as whole did not produce intended results, probablyas a consequence of misaligned emission and detection phases. Since MAX30102 onlymounts one photodetector which is sensible to both RED and IR light, the acquisitioncircuitry of MAX30102 needs to be synchronized with the LEDs to save the values inthe internal FIFO memory in the correct position. The synchronization was clearly notpossible between two different MAX30102 devices.

84 Testing and Discussion
0 2 4 6 8 102.45
2.5
2.55
2.6 ·104
Time (s)
Value(1
8bitADC)
RED Channel
0 2 4 6 8 102.4
2.5
2.6
2.7 ·104
Time (s)
Value(1
8bitADC)
IR Channel
Figure 67: MAX30102 acquisition with a sensor with faulty FIFO memory.
Testing of Maxim Integrated MAX30102 underlined a weakness of the internal FIFOmemory. Five samples of MAXREFDES117 have been tested with the following results:
• sample 1: failure after 6 weeks;
• sample 2: failure after 4 weeks;
• sample 3: no failures;
• sample 4: failure from day 1;
• sample 5: no failures.
The sensor samples have been configured in the same way. The failure consistedin saturation of a random number of contiguous bytes. An example of such situationis shown in Fig. 67, where saturated samples have been cut to show the meaningfulportion of the signal. Since a single sample is 3 B long, saturated samples have value224. Several acquisitions have shown that the number of saturated samples tend to besmall. More specifically, it has been noticed that replacing the saturated samples withconstant values equal to the last non-saturated sample does not invalidate HR and SpO2estimation because the beat can still be identified in most of the cases.
HR and SpO2 were estimated for 10 subjects using MAX30102 PPG waveforms withonboard processing. Results are compared with JPD-500E fingertip Pulse Oximeter andreported in Table 61.
In one case (subject 6), TD and FD gave compatible results only using the thumb.The subject was also wearing red nail polish.Since the nail polish was present on all the

6.2. Testing on Patients 85
Table 61: Comparison among Vital EKG and JPD-500E fingertip Pulse Oximeter on HR andSpO2.
Subject Gender Vital EKG JPD-500E
HR SpO2 HR SpO2
1 M 65 98 65 972 M 64 99 66 983 M 65 99 67 984 M 57 98 60 985 M 64 99 64 996 F 78 97 80 997 F 63 98 63 988 F 82 99 84 999 F 74 99 74 9710 F 77 98 78 98
fingers but only the thumb allowed to complete the processing successfully, the reasonlies in the particularly small size of the fingers. In order to obtain a significant SNR, thefinger must cover completely the LEDs and photodetector and no light shall diffuse intothe environment.


CHAPTER 7Conclusions
This Chapter documents limitations of Vital EKG, such as hardware errorswhich have been noticed during testing, bugs and potential weaknesses inthe firmware; it also gives suggestions on possible improvements of DSP.Furthermore, it provides guidelines to improve Vital EKG in future releases
and implement new features.
7.1 Limitations and Future Work
During the electrical and functional testing of Vital EKGPCB, a few design errors inthe schematic have been discovered. They are documented here such that a future
version of Vital EKG can correct them.
7.1.1 Pull-up ResistorsPull-up resistors should have been included for TI HDC2010 temperature and humiditysensor and Micro-SD card interrupt traces. For TI HDC2010 a polling technique hasbeen used to read data, as described in 5.2.4; the Micro-SD card interrupt functionalitywould have allowed to understand when a card is inserted and ejected. Since this firstversion of Vital EKG does not offer firmware support for the Micro-SD card, thisproblem remains open.
7.1.2 Micro SD card SupportA number of solutions have been explored to include the micro SD already in this firstversion of the firmware, including raw use of the card and a FAT32 filesystem. Raw
87

88 Conclusions
Figure 71: Correction of TI REF2033 (U4) schematic symbol error in PCB. bent pins are in blue.Orange lines are wires.
reading and writing operations, despite straightforward from the implementation pointof view, are not an optimal solution because Vital EKG was designed with hardwaresupport for a Micro-SD card to be able to offload old acquisitions quickly, eventuallyenabling post processing of rawdatawith a desktop application and relaxing the real-timerequirements. Clearly, raw use of the card forces the desktop application to be aware ofthe exact location of the data.
TI provides a third-party FAT32 implementation, adapted from an open sourceproject to use TI CC2640R2FRGZ peripherals and TI’s drivers. However, the memoryfootprint of the filesystem library is too large and a successfull integration has not beenpossible.
7.1.3 TI REF2033 Symbol ErrorTI REF2033 feature a 5-pin SOT-23 package. During the creation of the schematicsymbol for this component, pin 1 (VIN) and 4 (BIAS) were inverted. The problem wasdiscovered during electrical testing of the PCB.The fix consisted in bending the pins suchthat wires could be hand soldered from the bent pins to the correct pads. The operationis documented in Fig. 71.

7.1. Limitations and Future Work 89
Figure 72: Correction of TDK Invensense MPU-9250 (U9) schematic connection error in PCB.The trace cut is represented by 2 parallel blue lines. Orange line is the wire which needs to besoldered.
7.1.4 TDK Invensense MPU-9250 Connection ErrorA schematic mistake about TDK Invensense MPU-9250 9-axis motion-tracking unitwas discovered during functional testing. Also in this case, a modification of PCB wasnecessary to correct the error. More specifically, FSYNC (pin 11) needed to be connectedto ground and was instead connected to pin 10 (the schematic in Fig. 49 is alreadycorrect). To fix the problem, the trace was cut and a wire has been soldered from pin11 to ground. The operation is documented in Fig. 72.
7.1.5 MAX30102 ErrorsMaxim Integrated MAX30102 pulse oxymetry sensor appeared to present a weakness inthe management of the FIFO. Indeed, even though it features a 18 bit ADC, saturationto 0xFFFFFF happened randomly during an acquisition for a random number of samples.The weakness is thought to be related to the FIFO, since the saturation occurs for bothchannels at the same time.
Moreover, the FIFO turned out to be unable to receive samples from theADCat a rategreater 50 Sa s−1. Several combinations of ADC sampling rate and onboard averagingwere tested to debug this problem, which did not occur when the sampling frequencywas set at 400 Sa s−1 with averaging of 8 consecutive samples. Increasing the effective rate

90 Conclusions
at which the FIFO received samples caused FIFO almost full interrupts to be generatedrandomly even though the sensor was configured properly. Possible solutions includeusing a more recent version of the IC (e.g., MAX30110, MAX30112, which are describedby Maxim Integrated as optimized versions of basic MAX30102).
7.1.6 Acquisition and Processing Global BufferTI CC2640R2FRGZ features an ultra low-leakage RAM which is barely enough tosupport basic functionalities of Vital EKG. In order to optimize thememory usage at alltimes and minimize deadlocks caused by failed memory allocations, dynamic memoryusage has been limited to short messages for inter-task communication. Large arrays fordata acquisition and processing were initially allocated from the stack of the tasks. Thisapproach caused large portion of RAM to be used only rarely. The problemwas solved bynoticing that a unique large memory buffer could be used for all operations which couldbe time-multiplexed. Great care has been taken to ensure thread-safety, even thoughusing a globally allocated buffer leads to code which is hard to be maintained becauseit is difficult to remember which portion of the array is used in which task at any giventime.
A possible solution would be to move the array in the Flash Memory Manager. Taskswhich intend to use the memory buffer would need to register with the Flash MemoryManager; messages would be used to request a portion of memory and return the samememory after use. The Flash Memory Buffer could ensure thread safety by book keepingall requests.
This approach apparently looks similar to using a heap memory manager. However,the memory buffer would still be allocated on the stack, thus avoiding potential dynamicmemory allocation failures.
7.1.7 EKG ProcessingThe EKG processing has been intentionally kept simple to provide a proof of concept forVital EKG. DSP clearly showed that a Comb Notch filter should not be used for thisapplication because it introduces artifacts in the signal due to its long impulse response.Many more advanced techniques are described in literature, such as adaptive filters andprocessing based on wavelet transforms [49].
7.1.8 Calibration of TI HDC2010TI HDC2010 temperature and humidity sensor allows onboard offset compensation bysetting specific registers. More complex errors, like gain and hysteresis, can be correctedusing a look-up table. Clearly, the look-up table needs to include many values in order to

7.2. Concluding Remarks 91
provide high accuracy. Given the limited non-volatile flash memory to store such table,the best approach would probably be to perform the correction on the Central device.
7.1.9 TDK Invensense MPU-9250 Motion Tracking AlgorithmTDK Invensense MPU-9250 is fundamental for Vital EKG because a motion trackingunit can provide additional information which are required to filter out wandering andmuscular noises from EKG signal. Furthermore, many studies (such as [50]) are devotedto the development of algorithms to detect several types of motion, such as walking,running, phoning statically. A library to configure MPU-9250 and read output data hasbeen written and can be used as a basis for a development of motion tracking algorithms.
7.1.10 Blood Pressure EstimationRecent works have shown that synchronized EKG and PPG waveforms can providean estimation of systolic blood pressure [51]. The method is extremely promising toreplace cuff-based blood pressure measurements and enable continuous monitoring ofthis important vital sign.
The pulse transit time, which is the time elapsed from an Rwave to the fingertip PPGwaveform peak, is believed to be related to the systolic blood pressure through arterialstiffness. Diastolic blood pressure estimation poses more challanges. Indeed, while thebeginning of a ventricular systole can be easily detected because it is marked by a R wave,diastole detection algorithms cannot rely on clear fiducial marks.
7.2 Concluding Remarks
A first proof of concept of a wrist-worn PHS device has been designed. Vital EKGonly partially fulfills the requirements due to technological limitations related to
the positioning of the electrodes for LEAD-I EKG. Moreover, a novel set of algorithmshave been designed to process PPG signals, despite a few problems with the specificsensor employed in this first hardware revision have been encountered. The presenceof temperature and humidity sensors, as well as a motion-tracking unit, potentiallyallows to correlate HR and SpO2 with the daily activities of the user, thus providingmore accurate estimation of general health conditions. Low-power Bluetooth v4.2communication provides nearly infinite possibilities to connect Vital EKG with theInternet of Things. Finally, this work sets the basis for more advanced studies using thesame hardware. A general firmware and software framework, composed by interfacelibraries to communicate with sensors and an Android application, have been designedspecifically to ease customization and documented thoroughly to guide the developerand provide a steep learning curve.


APPENDIX APCB Design Material
A.1 Gerber Files
Figure A1: Vital EKG: Top Layer.
93
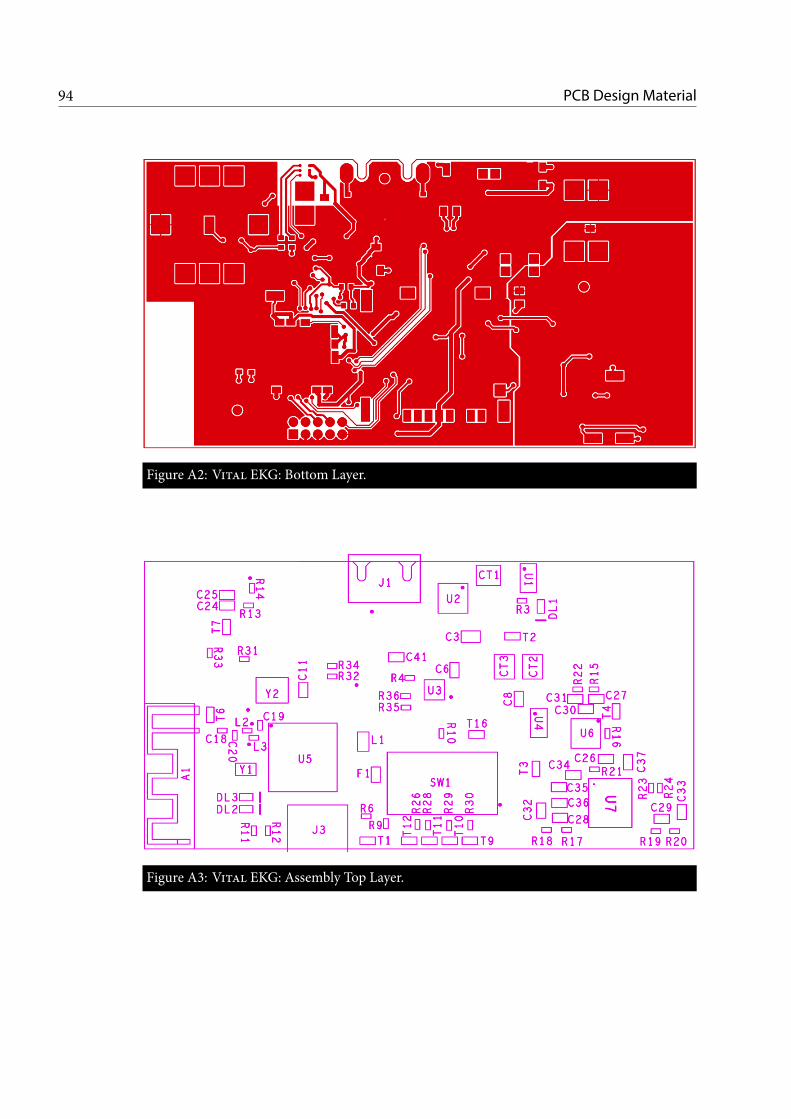
94 PCB Design Material
Figure A2: Vital EKG: Bottom Layer.
Figure A3: Vital EKG: Assembly Top Layer.

A.1. Gerber Files 95
Figure A4: Vital EKG: Assembly Bottom Layer.


APPENDIX BEvents Reference, BLE Dispatcher
Commands and Status Codes
B.1 BLE Dispatcher Commands
The following commands are sent by Central device to BLE Dispatcher.CMD_START_ACQ
• Value : 0x03
• Start PPG and EKG acquisitions.
B.2 BLE Dispatcher Status Codes
The following status codes are sent by BLE Dispatcher to Central device on STATUScharacteristic of Misc Service.
STATUS_MAX30102_ACQ_STARTED
• Value : 0x10
• MAX30102 acquisition started.
STATUS_ECG_ACQ_STARTED
• Value : 0x20
• EKG acquisition started.
STATUS_MAX30102_ACQ_DONE
97

98 Reference
• Value : 0x11
• MAX30102 acquisition completed.
STATUS_ECG_ACQ_STARTED
• Value : 0x21
• EKG acquisition completed.
STATUS_MAX30102_ACQ_FAILED
• Value : 0x12
• MAX30102 acquisition failed. This is likely due to sensor FIFO failure.
STATUS_ECG_ACQ_FAILED
• Value : 0x22
• EKG acquisition failed.
STATUS_HDC2010_ACQ_FAILED
• Value : 0x32
• HDC2010 acquisition failed.
STATUS_MAX17048_ACQ_FAILED
• Value : 0x42
• MAX17048 acquistion failed.
STATUS_MAX30102_FD_PROCESSING_DONE
• Value : 0x14
• MAX30102 frequency domain processing completed.
STATUS_MAX30102_TD_PROCESSING_DONE
• Value : 0x13
• MAX30102 time domain processing completed.
STATUS_RESULT_NON_VALID
• Value : 0x19

B.2. BLE Dispatcher Status Codes 99
• MAX30102 time domain and frequency domain processing gave non compatibleresults. Processing is not valid.
STATUS_ECG_PROCESSING_DONE
• Value : 0x23
• EKG processing completed. All the packets have been transmitted.
STATUS_ECG_PAYLOAD_RDY
• Value : 0x2A
• EKG packet is ready to be read.
STATUS_ECG_PROCESSING_FAILED
• Value : 0x25
• Processing of EKG waveform failed.
STATUS_MAX17048_OVERVOLTAGE
• Value : 0x4C
• Device is fully charged. Battery voltage is greater than 4.0V.
STATUS_MAX17048_UNDERVOLTAGE
• Value : 0x4D
• Device needs to be recharged. Battery voltage is lower than 3.4V. No acquisitionis possible until battery voltage gets back in the normal range.
STATUS_MAX30102_MEM_ALLOC_ERR
• Value : 0x17
• A memory allocation error occurred in MAX30102 Manager.
STATUS_ECG_MEM_ALLOC_ERR
• Value : 0x27
• A memory allocation error occurred in EKG Manager.
STATUS_MAX30102_NVS_TIMEOUT
• Value : 0x17

100 Reference
• Flash Memory Manager message Mailbox timed out while MAX30102 Managerwas requesting a flash memory operation.
STATUS_ECG_NVS_TIMEOUT
• Value : 0x28
• Flash Memory Manager message Mailbox timed out while BLE Manager wasrequesting a flash memory operation.
B.3 I2C Events
I2C_TRANSFER_SUCCESS_EVT
• Value : Event_Id_01
• Description : this event is returned when a I2C transfer succeeds. The eventvariable must be provided by the calling task. The event is posted in the callbackfunction of I2C.
I2C_TRANSFER_ERROR_EVT
• Value : Event_Id_01
• Description : this event is returned when a I2C transfer succeeds. The eventvariable must be provided by the calling task. The event is posted in the callbackfunction of I2C.
B.4 Non-Volatile Memory Events
NVS_WR_ERROR_EVT
• Value : Event_Id_21
• Description : this event is posted by Flash Memory Manager on the event variableprovided as arg2 by the calling taskmessage of type NvsMsg. This event signals thata write operation to internal flash memory failed. Possible causes includes writinga non-erased page or writing outside the boundaries of memory associated to NVSDriver.
NVS_RD_ERROR_EVT
• Value : Event_Id_22

B.5. BLE Dispatcher Response Messages 101
• Description : this event is posted by Flash Memory Manager on the event variableprovided as arg2 by the calling taskmessage of type NvsMsg. This event signals thata read operation to internal flash memory failed. Possible causes includes readingfrom a location not associated to NVS Driver.
B.5 BLE Dispatcher Response Messages
Themessages included in this sections are really just status codes included in the payloadof a queue message delivered to BLE Dispatcher. The event variable associated to allthese codes is syncEvent. The event which is posted is APP_QUEUE_EVT. A convention isfollowed for message values:
• bit 0 to 7 encode the proper message code;
• bit 8 to 11 encode the entity which generated the message (e.g., MAX30102Manager, EKG Manager, Monitoring Task);
• bit 12 to 15 are reserved for future use.
B.5.1 Profile MessagesECG_CHAR_CHANGE_EVT
• Value : 0x0001
• Description : this code is posted in EKG profile callback function whenever acharacteristic changes.This is done to handle the change in BLE Dispatcher task context.
MISC_CHAR_CHANGE_EVT
• Value : 0x0002
• Description : this code is posted in Misc profile callback function whenever acharacteristic changes.This is done to handle the change in BLE Dispatcher task context.
HDC2010_CHAR_CHANGE_EVT
• Value : 0x0003
• Description : this code is posted in HDC2010 profile callback function whenevera characteristic changes.This is done to handle the change in BLE Dispatcher task context.

102 Reference
B.5.2 EKGMessagesECG_INT_ACQ_STARTED_EVT_R
• Value : 0x0101
• Description : this code is posted by EKGManager to BLEDispatcher to signal thatthe acquisition was started correctly. The final R indicates that the receiver of themessage is BLE Dispatcher.
ECG_INT_ACQ_DONE_EVT_R
• Value : 0x0102
• Description : this code is posted by EKGManager to BLEDispatcher to signal thatthe acquisition was completed successfully. The final R indicates that the receiverof the message is BLE Dispatcher.
ECG_INT_ACQ_FAILED_EVT_R
• Value : 0x0105
• Description : this code is posted by EKGManager to BLEDispatcher to signal thatthe acquisition failed for unspecified reasons. The final R indicates that the receiverof the message is BLE Dispatcher.
ECG_INT_SECTOR_RDY_EVT_R
• Value : 0x0103
• Description : this code is posted by EKG Manager to BLE Dispatcher to signalthat the processing of a portion of the signal has been completed and is readyfor transmission. When this message is received, the payload contains 204 B ofdata. The first 200 B contain 100 samples arranges on 2 B; the last 2 B contain theprogressive number of the transmission packet. The payload must not be freedbecause it is allocated on the stack. The final R indicates that the receiver of themessage is BLE Dispatcher.
ECG_INT_PROCESSING_DONE_EVT_R
• Value : 0x0104
• Description : this code is posted by EKGManager to BLEDispatcher to signal thatthe processing has been completed. The final R indicates that the receiver of themessage is BLE Dispatcher.
ECG_INT_PROCESSING_FAILED_EVT_R

B.5. BLE Dispatcher Response Messages 103
• Value : 0x0106
• Description : this code is posted by EKGManager to BLEDispatcher to signal thatthe processing failed for unspecified reasons. The final R indicates that the receiverof the message is BLE Dispatcher.
ECG_INT_MEMORY_ALLOC_ERR_EVT_R
• Value : 0x0107
• Description : this code is posted by EKG Manager to BLE Dispatcher to signalthat a memory allocation error occured. The only memory allocations which canfails are associated to inter-task communication messages, since data processinguses memory allocated on the stack. The final R indicates that the receiver of themessage is BLE Dispatcher.
ECG_INT_NVS_TIMEOUT_EVT_R
• Value : 0x0108
• Description : this code is posted by EKGManager to BLEDispatcher to signal thatthe caller taskwas unable to enqueue amessage in FlashMemoryManagermailboxwithin specified time. The final R indicates that the receiver of the message is BLEDispatcher.
B.5.3 MAX30102 MessagesMAX30102_INT_ACQ_STARTED_EVT_R
• Value : 0x0201
• Description : this code is posted by MAX30102 Manager to BLE Dispatcher tosignal that the acquisition was started correctly. The final R indicates that thereceiver of the message is BLE Dispatcher.
MAX30102_INT_ACQ_DONE_EVT_R
• Value : 0x0202
• Description : this code is posted by MAX30102 Manager to BLE Dispatcher tosignal that the acquisition was completed successfully. The final R indicates thatthe receiver of the message is BLE Dispatcher.
MAX30102_INT_ACQ_FAILED_EVT_R
• Value : 0x0203

104 Reference
• Description : this code is posted by MAX30102 Manager to BLE Dispatcher tosignal that the acquisition failed for unspecified reasons. The final R indicates thatthe receiver of the message is BLE Dispatcher.
MAX30102_INT_MEMORY_ALLOC_ERR_EVT_R
• Value : 0x0204
• Description : this code is posted by MAX30102 Manager to BLE Dispatcher tosignal that a memory acquisition error occurred.See ECG_INT_MEMORY_ALLOC_ERR_EVT_R for further details. Thefinal R indicatesthat the receiver of the message is BLE Dispatcher.
MAX30102_INT_NVS_TIMEOUT_EVT_R
• Value : 0x0205
• Description : this code is posted by MAX30102 Manager to BLE Dispatcher tosignal that the caller task was unable to enqueue a message in Flash MemoryManager mailbox within specified time. The final R indicates that the receiver ofthe message is BLE Dispatcher.
MAX30102_INT_FD_PROCESSING_DONE_EVT_R
• Value : 0x0206
• Description : this code is posted by MAX30102 Manager to BLE Dispatcher tosignal that the frequency domain processing has terminated. The final R indicatesthat the receiver of the message is BLE Dispatcher.
MAX30102_INT_TD_PROCESSING_DONE_EVT_R
• Value : 0x0207
• Description : this code is posted by MAX30102 Manager to BLE Dispatcher tosignal that the time domain processing has terminated. The final R indicates thatthe receiver of the message is BLE Dispatcher.
MAX30102_INT_FD_PROCESSING_FAILED_EVT_R
• Value : 0x0208
• Description : this code is posted by MAX30102 Manager to BLE Dispatcher tosignal that the frequency domain processing failed. The final R indicates that thereceiver of the message is BLE Dispatcher.

B.5. BLE Dispatcher Response Messages 105
MAX30102_INT_TD_PROCESSING_FAILED_EVT_R
• Value : 0x0209
• Description : this code is posted by MAX30102 Manager to BLE Dispatcher tosignal that the time domain processing failed. The final R indicates that the receiverof the message is BLE Dispatcher.
MAX30102_INT_RESULT_NON_VALID_EVT_R
• Value : 0x020A
• Description : this code is posted by MAX30102 Manager to BLE Dispatcher tosignal that frequency domain processing and time domain processing producesHR which are not equal, within specified tolerance. The final R indicates that thereceiver of the message is BLE Dispatcher.
B.5.4 Other MessagesHDC2010_INT_RD_ERROR_EVT_R
• Value : 0x0303
• Description : this code is posted by Monitoring Task to BLE Dispatcher to signalthat reading HDC2010 failed. The final R indicates that the receiver of the messageis BLE Dispatcher.
MAX17048_INT_RD_ERROR_EVT_R
• Value : 0x0403
• Description : this code is posted by Monitoring Task to BLE Dispatcher to signalthat reading MAX17048 failed. The final R indicates that the receiver of themessage is BLE Dispatcher.
HDC2010_INT_DATA_RDY_EVT_R
• Value : 0x0307
• Description : this code is posted by Monitoring Task to BLE Dispatcher to signalthat HDC2010 temperature and humidity values are ready to be transmitted. Thismessage has an associated 4 B payload. The first 2 B encode the temperature value;the last 2 B the relative humidity. For each quantity, the first byte encodes theinteger part and the last byte the fractional part. The payload must not be freed.The final R indicates that the receiver of the message is BLE Dispatcher.

106 Reference
MAX17048_INT_DATA_RDY_EVT_R
• Value : 0x0407
• Description : this code is posted by Monitoring Task to BLE Dispatcher to signalthat MAX17048 voltage level has been read. This message has an associated 1 Bpayload representing the voltage level, where value 0 is 0V and 255 is 5.20V. Thepayload must not be freed. The final R indicates that the receiver of the message isBLE Dispatcher.
B.6 MAX30102 Events
These events are posted to max30102Event variable and deliver messages to MAX30102Manager.
MAX30102_INT_START_ACQ_EVT
• Value : Event_Id_01
• Description : this event is posted by BLE Dispatcher to forward to MAX30102Manager the start acquisition command received from the Central device.
MAX30102_INT_INTERRUPT_EVT
• Value : Event_Id_02
• Description : this event is posted in the callback function registered with MaximIntegrated MAX30102 FIFO interrupt to manage the reading from the FIFO intask context.
MAX30102_INT_START_PROCESSING_EVT
• Value : Event_Id_03
• Description : this event is posted by EKG Manager when its acquisition phaseis completed to allow MAX30102 Manager to start MAX30102 processing. Thisinter-task synchronization is required because MAX30102 processing and EKGacquisition use the same automatic memory. Since in general this event might begenerated beforeMAX30102 Manager completed its own acquisition, it is saved ina boolean variable (ecgAcqDone) and consumed whenever MAX30102 Manager isready.
MAX30102_INT_NEXT_STATE_EVT
• Value : Event_Id_04

B.6. MAX30102 Events 107
• Description : this event is posted at the endof each state handler function each timethe FSM must change state without waiting for external events. This is analogousto the clock signal for hardware FSMs.
MAX30102_INT_BATTERY_DEAD_EVT
• Value : Event_Id_05
• Description : this event is posted by the Monitoring Task when the battery levelfalls below 3.4V. This event is saved in a boolean variable (batteryOK). Noacquisitions are possible until MAX30102_INT_BATTERY_OK_EVT is posted by theMonitoring Task.
MAX30102_INT_BATTERY_OK_EVT
• Value : Event_Id_06
• Description : this event is posted by the Monitoring Task when the batteryvoltage level returns within normal range. batteryOK boolean variable is resetand acquisitions are enabled.
ECG_INT_PROCESSING_DONE_EVT
• Value : Event_Id_07
• Description : this event is posted by the EKG Manager when the processing isfinished. This is required because MAX30102 Manager needs to know if all EKGvalues have been read before a new acquisition is requested fromCentral device. Ifthis is not the case (that is, this event is not detected), MAX30102 Manager needsto cancel ongoing EKG processing the battery voltage level returns within normalrange. batteryOK boolean variable is reset and acquisitions are enabled.
ECG_INT_CANCEL_ACK_EVT
• Value : Event_Id_08
• Description : this event is posted by the EKGManagerwhen an ongoing processingcancel request is acknowledged. This is required because EKG Manager needs tobe in idle state before a new acquisition can start.

108 Reference
B.7 EKG Events
These events are posted to ecgEvent variable and deliver messages to EKG Manager.ECG_INT_START_ACQ_EVT
• Value : Event_Id_01
• Description : this event is posted by MAX30102 Manager to forward the startacquisition command from the Central device to EKG Manager.
ECG_INT_BUFFER_FULL_EVT
• Value : Event_Id_02
• Description : this event is posted by ADCBuf callback function whenever anacquisition buffer is full and ready to be stored in memory. This event is necessaryto perform the operations in task context.
ECG_INT_START_PROCESSING_EVT
• Value : Event_Id_02
• Description : this event is posted by MAX30102 Manager when it finishes itsprocessing and only in case frequency domain processing and time domainprocessing results are in accordance. In case they are not, there is clearly noneed to waste resources doing EKG processing and transmission.
ECG_INT_CANCEL_EVT
• Value : Event_Id_04
• Description : this event is posted by MAX30102 Manager when it receives a startacquisition command from Central device before EKG Manager processing isfinished. Note that this situation might happen each time Central device doesnot read all the packets, since processing of a batch is started only when theprevious batch has been read. This is necessary to allow EKG Manager to getback to idle state before its acquisition starts. MAX30102 Manager forwardsthe start acquisition command to EKG Manager only when it receives the eventECG_INT_CANCEL_ACK_EVT, which means EKG Manager has acknlowledged thecommand.
ECG_INT_PROCESS_SECTOR_EVT
• Value : Event_Id_05

B.8. Monitoring Task Events 109
• Description : this event is posted by BLEDispatcher when the Central device readsa EKGpacket. In this case, a new series of samples can be loaded from internal flashmemory and processed.
ECG_INT_NEXT_STATE_EVT
• Value : Event_Id_07
• Description : this event is posted at the endof each state handler function each timethe FSM must change state without waiting for external events. This is analogousto the clock signal for hardware FSMs.
B.8 Monitoring Task Events
These events are posted to monitEvent variable and deliver messages to ContinuousMonitoring Manager.
HDC2010_INT_DATA_RDY_EVT
• Value : Event_Id_01
• Description : this event is posted by HDC2010 timer callback function to managein task context the reading of temperature and humidity data.
MAX17048_INT_INTERRUPT_EVT
• Value : Event_Id_02
• Description : this event is posted by MAX17048 interrupt callback function tohandle in task context a detection of out of normal range battery voltage.
MAX17048_INT_DATA_RDY_EVT
• Value : Event_Id_03
• Description : this event is posted by MAX17048 timer callback function to handlein task context the reading of battery voltage.
MAX17048_INT_DATA_RDY_EVT
• Value : Event_Id_04
• Description : this event is posted byMAX30102Manager when the Central devicerequests an acquisition. This is done to provide updated temperature and humidityreadings.


APPENDIX CMAX30102 Manager
Listing C.0.1: MAX30102 Manager finite state machine.
1 /**********************************************************************/2 static void MAX30102_taskInit(MAX30102 * max30102,3 MAX30102Params * params)4 {5 /* Create an Event to notify the task of I2C Transfer outcome */6 Event_construct(&i2cTransferEventStruct, NULL);7 i2cTransferEvent = Event_handle(&i2cTransferEventStruct);89 /* Create a Mailbox to read from NVS */
10 Mailbox_Params mbxParams;11 Mailbox_Params_init(&mbxParams);12 mbxParams.buf = (Ptr)max30102NvsReadMbxBuffer;13 mbxParams.bufSize = sizeof(max30102NvsReadMbxBuffer);14 Mailbox_construct(&max30102NvsReadMbxStruct,15 sizeof(NvsMsg),16 MAX30102_NVS_READ_MBX_MAX_NUM_MSG,17 &mbxParams,18 NULL);19 max30102NvsReadMbx = Mailbox_handle(&max30102NvsReadMbxStruct);2021 /* Allocate a pin for MAX30102 interrupts and link a ISR */22 if(!(max30102Int = PIN_open(&max30102IntState, max30102IntTable)))23 {24 while(1);25 }2627 if (PIN_registerIntCb(max30102Int, &MAX30102_intCallbackFxn) != 0)28 {
111

112 MAX30102 Manager
29 while(1);30 }3132 /* Set MAX30102 parameters */33 params->interruptEnable1 = 0x00;34 params->interruptEnable2 = 0x00;35 params->FIFOConfig = SMP_AVE_8Sa |36 FIFO_ROLLOVER_EN |37 FIFO_A_FULL_12Sa;38 params->modeConfig = SHDN;39 params->SPO2Config = SPO2_ADC_RGE_16384nA |40 SPO2_SR_400SaS |41 LED_PW_411us;42 params->ledRedPulseAmplitude = 0x2F;43 params->ledIRPulseAmplitude = 0x2F;44 params->proxModeLed2PulseAmplitude = 0x7F;45 params->multiLedModeCtrl1 = SLOT_disabled;46 params->multiLedModeCtrl2 = SLOT_disabled;47 params->proxModeInterruptThreshold = 0x1F;484950 if(!MAX30102_init(max30102,51 i2c,52 i2cTransferEvent,53 params,54 MAX30102_DEFAULT_SLAVE_ID))55 {56 while(1);57 }5859 if (!MAX30102_reset(max30102))60 {61 while(1);62 }63 Task_sleep(1000 / Clock_tickPeriod);6465 if (!MAX30102_open(max30102))66 {67 while(1);68 }69 }7071 /**********************************************************************/72 static void MAX30102_taskFxn(UArg a0, UArg a1)73 {74 MAX30102 max30102;75 MAX30102Params params;76

MAX30102 Manager 113
77 MAX30102_taskInit(&max30102, ¶ms);7879 /* FSM state variable */80 MAX30102_state_t state = state_MAX30102_IDLE;8182 /* Asynchronous FSM inputs */83 unsigned char batteryOK = 1;84 unsigned char startRequested = 0;85 unsigned char ecgAcqDone = 0;86 unsigned char ecgReady = 1;8788 /* Allocate 5 biquads for processing */89 iir_biquad_t biquads[5];9091 /* Frequency domain processing */92 MAX30102_processing_t dsp;9394 /* Time domain processing */95 MAX30102_channel_dsp_t td_dsp;96 MAX30102_results_t red_results;97 MAX30102_results_t ir_results;9899 /* Infinite Loop */
100 for (;;)101 {102 uint32_t events;103104 /* Wait for an event */105 events = Event_pend(max30102Event,106 Event_Id_NONE,107 MAX30102_ALL_EVENTS,108 BIOS_WAIT_FOREVER);109110 if (events & MAX30102_INT_BATTERY_DEAD_EVT)111 {112 batteryOK = 0;113 }114115 if (events & MAX30102_INT_BATTERY_OK_EVT)116 {117 batteryOK = 1;118 }119120 if (events & MAX30102_INT_START_PROCESSING_EVT)121 {122 ecgAcqDone = 1;123 }124

114 MAX30102 Manager
125 /* ECG finished the processing or acknowledged126 * a cancelled processing127 */128 if (events & ECG_INT_CANCEL_ACK_EVT ||129 events & ECG_INT_PROCESSING_DONE_EVT)130 {131 ecgReady = 1;132 }133134 switch (state)135 {136 /* Default IDLE state */137 case state_MAX30102_IDLE :138 {139 /* Prevent acquisition if battery is dead */140 if (batteryOK)141 {142 if (events & MAX30102_INT_START_ACQ_EVT)143 {144 /* Remember that a start was sent */145 startRequested = 1;146 }147 }148149 if (startRequested)150 {151 if (ecgReady)152 {153 state = state_MAX30102_IDLE_handler(154 &max30102,155 memoryBuffer);156157 startRequested = 0;158 ecgAcqDone = 0;159 ecgReady = 0;160 } else161 {162 /* Cancel ongoing ECG processing */163 Event_post(ecgEvent, ECG_INT_CANCEL_EVT);164 }165 }166 break;167 }168169 /* Proximity sensor feature:170 * proceed to acquisition171 */172 case state_MAX30102_START_ACQ :

MAX30102 Manager 115
173 {174 if (events & MAX30102_INT_INTERRUPT_EVT)175 {176 state = state_MAX30102_START_ACQ_handler(177 &max30102,178 &dsp);179 }180 break;181 }182183 /* Fifo full:184 * Discard the first samples185 * to avoid the transient due to186 * the placing of the finger187 */188 case state_MAX30102_TRANSIENT_READ :189 {190 /* Interrupt from MAX30102*/191 if (events & MAX30102_INT_INTERRUPT_EVT)192 {193 state = state_MAX30102_TRANSIENT_READ_handler(194 &max30102,195 &dsp);196 }197 break;198 }199200 /* Fifo full:201 * save data and get back here202 * unless enough samples were203 * collected204 */205 case state_MAX30102_FIFO_READ :206 {207 if (events & MAX30102_INT_INTERRUPT_EVT)208 {209 state = state_MAX30102_FIFO_READ_handler(210 &max30102,211 &dsp);212 }213 break;214 }215216217 /* Acquisition is finished:218 * notify Central device219 */220 case state_MAX30102_ACQ_DONE :

116 MAX30102 Manager
221 {222 if (events & MAX30102_INT_NEXT_STATE_EVT)223 {224 state = state_MAX30102_ACQ_DONE_handler(225 &max30102);226 }227 break;228 }229230 /* Processing can start only when ECG231 * finishes its acquisition232 * because we need the same memory buffer.233 * Initialize filters and buffers here234 */235 case state_MAX30102_FD_PROCESS_INIT :236 {237 if (ecgAcqDone)238 {239 state = state_MAX30102_FD_PROCESS_INIT_handler(240 &dsp,241 biquads,242 (float*) (memoryBuffer + 300),243 memoryBuffer);244 ecgAcqDone = 0;245 }246 break;247 }248249250 /* Perform Quasi-online251 * Frequency Domain252 * processing253 */254 case state_MAX30102_FD_PROCESS :255 {256 if (events & MAX30102_INT_NEXT_STATE_EVT)257 {258 state = state_MAX30102_FD_PROCESS_handler(259 &dsp);260 }261 break;262 }263264 /* Frequency domain processing265 * failed266 */267 case state_MAX30102_FD_PROCESS_FAILED :268 {

MAX30102 Manager 117
269 if (events & MAX30102_INT_NEXT_STATE_EVT)270 {271 state = state_MAX30102_FD_PROCESS_FAILED_handler();272 }273 break;274 }275276 /* Frequency domain processing277 * completed successfully278 */279 case state_MAX30102_FD_PROCESS_DONE :280 {281 if (events & MAX30102_INT_NEXT_STATE_EVT)282 {283 state = state_MAX30102_FD_PROCESS_DONE_handler(284 &dsp);285 }286 break;287 }288289 /* Initialize Time Domain processing290 * of red channel291 */292 case state_MAX30102_TD_RED_PROCESS_INIT :293 {294 if (events & MAX30102_INT_NEXT_STATE_EVT)295 {296 state = state_MAX30102_TD_RED_PROCESS_INIT_handler(297 &td_dsp,298 (float*) (memoryBuffer + 300),299 memoryBuffer,300 biquads,301 &red_results);302 }303 break;304 }305306 /* Quasi online time domain307 * processing of red channel308 */309 case state_MAX30102_TD_RED_PROCESS :310 {311 if (events & MAX30102_INT_NEXT_STATE_EVT)312 {313 state = state_MAX30102_TD_RED_PROCESS_handler(314 &td_dsp,315 &red_results);316 }
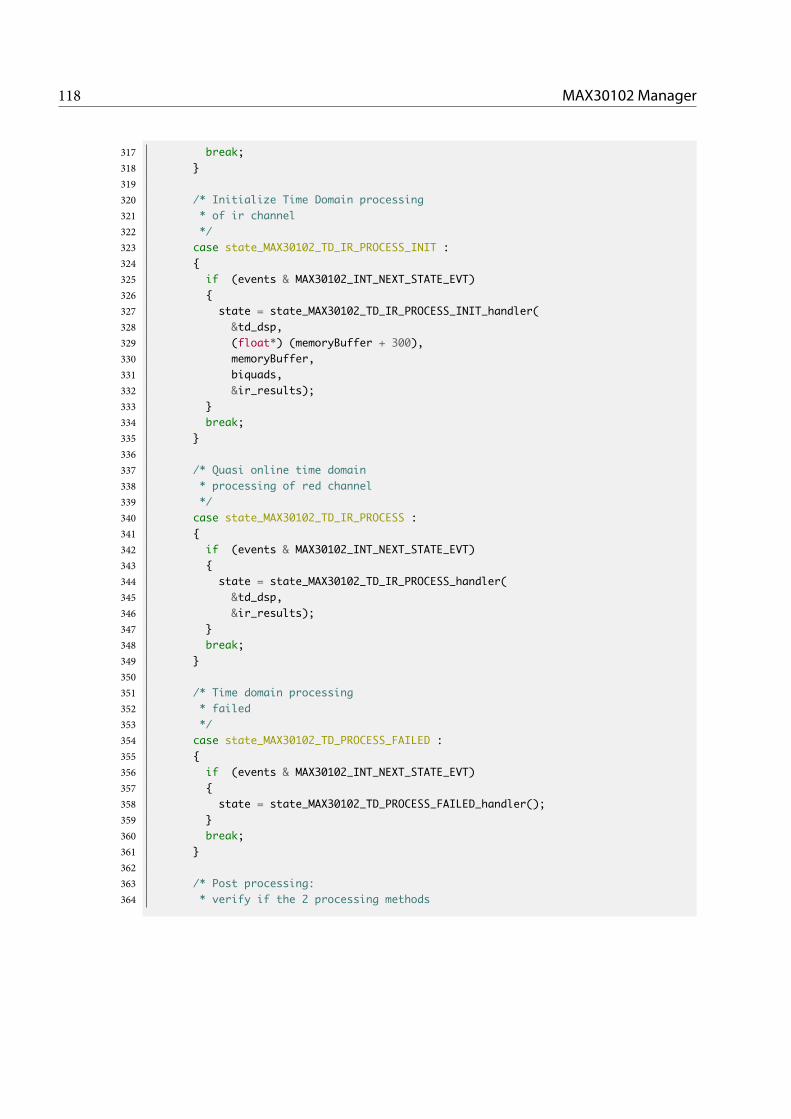
118 MAX30102 Manager
317 break;318 }319320 /* Initialize Time Domain processing321 * of ir channel322 */323 case state_MAX30102_TD_IR_PROCESS_INIT :324 {325 if (events & MAX30102_INT_NEXT_STATE_EVT)326 {327 state = state_MAX30102_TD_IR_PROCESS_INIT_handler(328 &td_dsp,329 (float*) (memoryBuffer + 300),330 memoryBuffer,331 biquads,332 &ir_results);333 }334 break;335 }336337 /* Quasi online time domain338 * processing of red channel339 */340 case state_MAX30102_TD_IR_PROCESS :341 {342 if (events & MAX30102_INT_NEXT_STATE_EVT)343 {344 state = state_MAX30102_TD_IR_PROCESS_handler(345 &td_dsp,346 &ir_results);347 }348 break;349 }350351 /* Time domain processing352 * failed353 */354 case state_MAX30102_TD_PROCESS_FAILED :355 {356 if (events & MAX30102_INT_NEXT_STATE_EVT)357 {358 state = state_MAX30102_TD_PROCESS_FAILED_handler();359 }360 break;361 }362363 /* Post processing:364 * verify if the 2 processing methods

MAX30102 Manager 119
365 * gave compatible results366 */367 case state_MAX30102_TD_POST_PROCESS :368 {369 if (events & MAX30102_INT_NEXT_STATE_EVT)370 {371 state = state_MAX30102_TD_POST_PROCESS_handler(372 &red_results,373 &ir_results,374 &dsp);375 }376 break;377 }378379 /* Notify Central device and allow ECG380 * to start its processing381 */382 case state_MAX30102_TD_PROCESS_DONE :383 {384 if (events & MAX30102_INT_NEXT_STATE_EVT)385 {386 state = state_MAX30102_TD_PROCESS_DONE_handler(387 &dsp);388 }389 break;390 }391392 /* MAX30102 Fifo failed */393 case state_MAX30102_FIFO_ERR :394 {395 if (events & MAX30102_INT_NEXT_STATE_EVT)396 {397 state = state_MAX30102_FIFO_ERR_handler(398 &max30102);399 }400 break;401 }402403 /* Memory allocation failed */404 case state_MAX30102_MEMORY_ALLOC_ERR :405 {406 if (events & MAX30102_INT_NEXT_STATE_EVT)407 {408 state = state_MAX30102_MEMORY_ALLOC_ERR_handler();409 }410 break;411 }412

120 MAX30102 Manager
413 /* Flash Memory Manager communication414 * took longer than expected415 */416 case state_MAX30102_NVS_TIMEOUT :417 {418 if (events & MAX30102_INT_NEXT_STATE_EVT)419 {420 state = state_MAX30102_NVS_TIMEOUT_handler();421 }422 break;423 }424425 default :426 state = state_MAX30102_IDLE;427 }428429 /* Error during NVS_operation430 * Terminate execution and restore IDLE state431 * asynchronously432 */433 if (events & NVS_WR_ERROR_EVT)434 {435 MAX30102_changeMode(&max30102, SHDN);436 enqueueMsg(MAX30102_INT_NVS_TIMEOUT_EVT_R,437 0, NULL, 0, BLEsyncEvent, BLEappMsgQueue);438 state = state_MAX30102_IDLE;439 }440441 /* Error during NVS_read */442 if (events & NVS_RD_ERROR_EVT)443 {444 enqueueMsg(MAX30102_INT_NVS_TIMEOUT_EVT_R,445 0, NULL, 0, BLEsyncEvent, BLEappMsgQueue);446 state = state_MAX30102_IDLE;447 }448 }449 }

APPENDIX DEKGManager
Listing D.0.1: EKG Manager finite state machine.
1 /**********************************************************************/2 static void ECG_taskInit(ECG * ecg,3 unsigned short * sampleBufferOne,4 unsigned short * sampleBufferTwo,5 unsigned short * supportBuffer,6 unsigned short * nvsBuffer)7 {89 /* REF2033 enable */
10 if(!(ref2033En = PIN_open(&ref2033EnState, ref2033EnTable)))11 {12 while(1);13 }1415 /* Initialize ADCBuf driver */16 ADCBuf_init();1718 /* Set up ADCBuf */19 ADCBuf_Params adcBufParams;20 ADCBuf_Params_init(&adcBufParams);21 adcBufParams.callbackFxn = adcBufCallback;22 adcBufParams.recurrenceMode = ADCBuf_RECURRENCE_MODE_CONTINUOUS;23 adcBufParams.returnMode = ADCBuf_RETURN_MODE_CALLBACK;24 adcBufParams.samplingFrequency = ECG_SAMPLING_FREQUENCY;25 ecg->adcBuf = ADCBuf_open(CC2640R2_LAUNCHXL_ADCBUF0, &adcBufParams);2627 /* Make sure ADCBuf opened correctly. */28 if (!ecg->adcBuf){
121

122 EKG Manager
29 while(1);30 }3132 /* Set up adc buffers */33 ecg->sampleBufferOne = sampleBufferOne;34 ecg->sampleBufferTwo = sampleBufferTwo;35 ecg->supportBuffer = supportBuffer;36 ecg->nvsBuffer = nvsBuffer;3738 /* Set up ADCBuf conversion structure */39 ecg->continuousConversion.arg =40 ecg->supportBuffer;41 ecg->continuousConversion.adcChannel =42 CC2640R2_LAUNCHXL_ADCBUF0CHANNEL0;43 ecg->continuousConversion.sampleBuffer =44 ecg->sampleBufferOne;45 ecg->continuousConversion.sampleBufferTwo =46 ecg->sampleBufferTwo;47 ecg->continuousConversion.samplesRequestedCount =48 ECG_SAMPLES_PER_BUFFER;4950 /* Create a Mailbox to read from NVS */51 Mailbox_Params mbxParams;52 Mailbox_Params_init(&mbxParams);53 mbxParams.buf = (Ptr)ecgNvsReadMbxBuffer;54 mbxParams.bufSize = sizeof(ecgNvsReadMbxBuffer);55 Mailbox_construct(&ecgNvsReadMbxStruct,56 sizeof(NvsMsg),57 ECG_NVS_READ_MBX_MAX_NUM_MSG,58 &mbxParams, NULL);59 ecgNvsReadMbx = Mailbox_handle(&ecgNvsReadMbxStruct);60 }6162 /**********************************************************************/63 static void ECG_taskFxn(UArg a0, UArg a1)64 {65 ECG ecg;6667 /* Initialize application */68 ECG_taskInit(&ecg,69 (unsigned short*) (memoryBuffer+300),70 (unsigned short*) (memoryBuffer+30071 +1*(ECG_SAMPLES_PER_BUFFER*ECG_MEM_SAMPLE_SIZE)),72 (unsigned short*) (memoryBuffer+30073 +2*(ECG_SAMPLES_PER_BUFFER*ECG_MEM_SAMPLE_SIZE)),74 (unsigned short*) (memoryBuffer+30075 +3*(ECG_SAMPLES_PER_BUFFER*ECG_MEM_SAMPLE_SIZE)));76

EKG Manager 123
77 /* FSM State variable */78 ECG_state_t state = state_ECG_IDLE;7980 /* Processing structs */81 ECG_processing_t dsp;82 iir_biquad_fixed_t biquads[7];83 movmean_t movmean[2];848586 /* Application main loop */87 for (;;)88 {89 uint32_t events;9091 events = Event_pend(ecgEvent,92 Event_Id_NONE,93 ECG_ALL_EVENTS,94 BIOS_WAIT_FOREVER);9596 /* Next state computation logic */97 switch (state)98 {99 /* Idle state */
100 case state_ECG_IDLE :101 {102 if (events & ECG_INT_START_ACQ_EVT)103 {104 state = state_ECG_IDLE_handler(&ecg, &dsp);105 }106 break;107 }108109 /* Consume samples to take care of initial transient */110 case state_ECG_TRANSIENT_READ :111 {112 if (events & ECG_INT_BUFFER_FULL_EVT)113 {114 state = state_ECG_TRANSIENT_READ_handler(&ecg, &dsp);115 }116 break;117 }118119 /* Buffer full: perform oversampling processing */120 case state_ECG_READ :121 {122 if (events & ECG_INT_BUFFER_FULL_EVT)123 {124 state = state_ECG_READ_handler(&ecg, &dsp);

124 EKG Manager
125 }126 break;127 }128129 /* Transfer the samples to Flash Memory Manager for130 * non-volatile storage131 */132 case state_ECG_NVS_WRITE :133 {134 if (events & ECG_INT_NEXT_STATE_EVT)135 {136 state = state_ECG_NVS_WRITE_handler(&ecg, &dsp);137 }138 break;139 }140141 /* Acquisition is finished: notify MAX30102 Manager */142 case state_ECG_ACQ_DONE :143 {144 if (events & ECG_INT_NEXT_STATE_EVT)145 {146 state = state_ECG_ACQ_DONE_handler(&ecg);147 }148 break;149 }150151 case state_ECG_PROCESS_INIT :152 {153 /* MAX30102 Manager requested to cancel the processing.154 * Send the acknowledge and proceed to idle state.155 */156 if (events & ECG_INT_CANCEL_EVT)157 {158 Event_post(max30102Event, ECG_INT_CANCEL_ACK_EVT);159 state = state_ECG_PROCESSING_FAILED_handler();160 break;161 }162163 /* Initialize the processing. This event is sent by MAX30102164 * Manager when its processing is finished165 */166 if (events & ECG_INT_START_PROCESSING_EVT)167 {168 state = state_ECG_PROCESS_INIT_handler(&dsp,169 (int*) (memoryBuffer),170 (int*) (memoryBuffer + ECG_SAMPLES_PER_PROCESSING_BUFFER *171 ECG_PROC_SAMPLE_SIZE),172 biquads,

EKG Manager 125
173 movmean);174 }175 break;176 }177178 case state_ECG_PROCESS :179 {180 /* MAX30102 Manager requested to cancel the processing.181 * Send the acknowledge and proceed to idle state.182 */183 if (events & ECG_INT_CANCEL_EVT)184 {185 Event_post(max30102Event, ECG_INT_CANCEL_ACK_EVT);186 state = state_ECG_PROCESSING_FAILED_handler();187 break;188 }189190 /* Continue the processing by loading samples from flash memory.191 * This event is posted by BLE Dispatcher when previous192 * packet of processed samples is read from Central device.193 */194 if (events & ECG_INT_PROCESS_SECTOR_EVT)195 {196 state = state_ECG_PROCESS_handler(&dsp);197 }198 break;199 }200201 /* Buffer state to handle clean up before getting back to idle. */202 case state_ECG_PROCESSING_FAILED :203 {204 /* MAX30102 Manager requested to cancel the processing.205 * Send the acknowledge and proceed to idle state.206 */207 if (events & ECG_INT_CANCEL_EVT)208 {209 Event_post(max30102Event, ECG_INT_CANCEL_ACK_EVT);210 }211212 state = state_ECG_PROCESSING_FAILED_handler();213 break;214 }215216 case state_ECG_SEND_FIRST :217 {218 /* MAX30102 Manager requested to cancel the processing.219 * Send the acknowledge and proceed to idle state.220 */
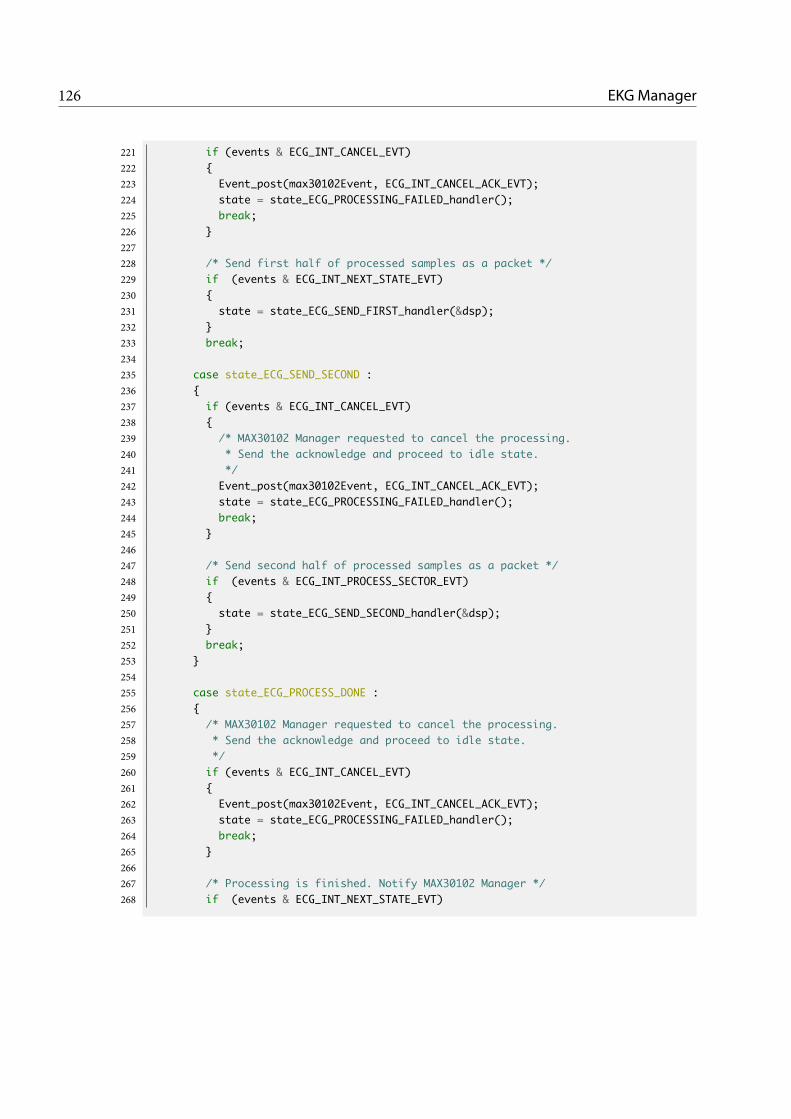
126 EKG Manager
221 if (events & ECG_INT_CANCEL_EVT)222 {223 Event_post(max30102Event, ECG_INT_CANCEL_ACK_EVT);224 state = state_ECG_PROCESSING_FAILED_handler();225 break;226 }227228 /* Send first half of processed samples as a packet */229 if (events & ECG_INT_NEXT_STATE_EVT)230 {231 state = state_ECG_SEND_FIRST_handler(&dsp);232 }233 break;234235 case state_ECG_SEND_SECOND :236 {237 if (events & ECG_INT_CANCEL_EVT)238 {239 /* MAX30102 Manager requested to cancel the processing.240 * Send the acknowledge and proceed to idle state.241 */242 Event_post(max30102Event, ECG_INT_CANCEL_ACK_EVT);243 state = state_ECG_PROCESSING_FAILED_handler();244 break;245 }246247 /* Send second half of processed samples as a packet */248 if (events & ECG_INT_PROCESS_SECTOR_EVT)249 {250 state = state_ECG_SEND_SECOND_handler(&dsp);251 }252 break;253 }254255 case state_ECG_PROCESS_DONE :256 {257 /* MAX30102 Manager requested to cancel the processing.258 * Send the acknowledge and proceed to idle state.259 */260 if (events & ECG_INT_CANCEL_EVT)261 {262 Event_post(max30102Event, ECG_INT_CANCEL_ACK_EVT);263 state = state_ECG_PROCESSING_FAILED_handler();264 break;265 }266267 /* Processing is finished. Notify MAX30102 Manager */268 if (events & ECG_INT_NEXT_STATE_EVT)

EKG Manager 127
269 {270 state = state_ECG_PROCESS_DONE_handler(&dsp);271 }272 break;273 }274275276 /* An error occurred during ADCBuf operations */277 case state_ECG_READ_ERR :278 {279 if (events & ECG_INT_NEXT_STATE_EVT)280 {281 state = state_ECG_READ_ERR_handler(&ecg);282 }283 break;284 }285286 /* An error occurred during memory allocation */287 case state_ECG_MEMORY_ALLOC_ERR :288 {289 if (events & ECG_INT_NEXT_STATE_EVT)290 {291 state = state_ECG_MEMORY_ALLOC_ERR_handler(&ecg);292 }293 break;294 }295296 /* Flash Memory Manager did not accept the message */297 case state_ECG_NVS_TIMEOUT :298 {299 if (events & ECG_INT_NEXT_STATE_EVT)300 {301 state = state_ECG_NVS_TIMEOUT_handler(&ecg);302 }303 break;304 }305306 default :307 state = state_ECG_IDLE;308 }309310311 /* Error during NVS_operation312 * Terminate execution and restore IDLE state313 * asynchronously314 */315 if (events & NVS_WR_ERROR_EVT)316 {

128 EKG Manager
317 enqueueMsg(ECG_INT_NVS_TIMEOUT_EVT_R,318 0, NULL, 0, BLEsyncEvent, BLEappMsgQueue);319 state = state_ECG_IDLE;320 }321322 /* Error during NVS_read */323 if (events & NVS_RD_ERROR_EVT)324 {325 enqueueMsg(ECG_INT_NVS_TIMEOUT_EVT_R,326 0, NULL, 0, BLEsyncEvent, BLEappMsgQueue);327 state = state_ECG_IDLE;328 }329330 /* Error during SD create new file331 * SD operations are not supported at this point332 */333 if (events & SD_FILE_CREATION_ERR_EVT)334 {335 enqueueMsg(ECG_INT_SD_FILE_CREATION_ERR_EVT_R,336 0, NULL, 0, BLEsyncEvent, BLEappMsgQueue);337 state = state_ECG_IDLE;338 }339 }340 }

Bibliography
[1] “Troppi esami diagnostici prescritti inutilmente: i medici lo ammettono,” May2016. [Online]. Available: https://federproprieta.it/2499-2/
[2] E. Guirguis, “Holter Monitoring,” Canadian Family Physician, vol. 33, pp. 985–992,Apr. 1987. [Online]. Available:https://www.ncbi.nlm.nih.gov/pmc/articles/PMC2218473/
[3] R. R. Kroll, E. D. McKenzie, J. G. Boyd, P. Sheth, D. Howes, M. Wood, and D. M.Maslove, “Use of wearable devices for post-discharge monitoring of ICU patients:a feasibility study,” Journal of Intensive Care, vol. 5, Nov. 2017. [Online]. Available:https://www.ncbi.nlm.nih.gov/pmc/articles/PMC5698959/
[4] A. Pantelopoulos and N. Bourbakis, “A survey on wearable biosensor systems forhealth monitoring,” in 2008 30th Annual International Conference of the IEEEEngineering in Medicine and Biology Society, Aug. 2008, pp. 4887–4890.
[5] R. M. Anderson, J. M. Fritz, and J. E. O’Hare, “The mechanical nature of the heartas a pump,” American Heart Journal, vol. 73, no. 1, pp. 92–105, Jan. 1967. [Online].Available: http://www.sciencedirect.com/science/article/pii/0002870367903134
[6] H. Lodish, A. Berk, S. L. Zipursky, P. Matsudaira, D. Baltimore, and J. Darnell,Molecular Cell Biology, 4th ed. W. H. Freeman, 2000.
[7] I. P. Temple, S. Inada, H. Dobrzynski, and M. R. Boyett, “Connexins and theatrioventricular node,” Heart Rhythm, vol. 10, no. 2, pp. 297–304, Feb. 2013.[Online]. Available: https://www.ncbi.nlm.nih.gov/pmc/articles/PMC3572393/
[8] P. Schweitzer and S. Keller, “Willem Einthoven–inventor of electrocardiography,”Vnitrni Lekarstvi, vol. 48 Suppl 1, pp. 20–23, Dec. 2002.
[9] “EKG/ECG Machine Buyers Guide.” [Online]. Available:https://www.usamedicalsurgical.com/blog/ekg-ecg-machine-buyers-guide/
129

130 Bibliography
[10] J. Crawford and L. Doherty, “Ten steps to recording a standard 12-lead ECG,”Practice Nursing, vol. 21, no. 12, pp. 622–630, Dec. 2010. [Online]. Available:http://www.magonlinelibrary.com/doi/10.12968/pnur.2010.21.12.622
[11] M. B. Conover, Understanding Electrocardiography. Elsevier Health Sciences, Jan.2002, google-Books-ID: pcPekl1Q1cAC.
[12] J. E. Madias, “On Recording the Unipolar ECG Limb Leads via the Wilson’s vs theGoldberger’s Terminals: aVR, aVL, and aVF Revisited,” Indian Pacing andElectrophysiology Journal, vol. 8, no. 4, pp. 292–297, Nov. 2008. [Online]. Available:https://www.ncbi.nlm.nih.gov/pmc/articles/PMC2572021/
[13] “Cardiovascular Lab: Electrocardiogram: Basics.” [Online]. Available:https://www.medicine.mcgill.ca/physio/vlab/cardio/ECGbasics.htm
[14] T. A. Neff, “Routine Oximetry: A Fifth Vital Sign?” CHEST, vol. 94, no. 2, p. 227,Aug. 1988. [Online]. Available:https://journal.chestnet.org/article/S0012-3692(16)33429-8/fulltext
[15] J. W. Severinghaus and Y. Honda, “History of blood gas analysis. VII. Pulseoximetry,” Journal of Clinical Monitoring, vol. 3, no. 2, pp. 135–138, Apr. 1987.[Online]. Available: https://doi.org/10.1007/BF00858362
[16] C. P. Criée, S. Sorichter, H. J. Smith, P. Kardos, R. Merget, D. Heise, D. Berdel,D. Köhler, H. Magnussen, W. Marek, H. Mitfessel, K. Rasche, M. Rolke, H. Worth,and R. A. Jörres, “Body plethysmography – Its principles and clinical use,”Respiratory Medicine, vol. 105, no. 7, pp. 959–971, Jul. 2011. [Online]. Available:http://www.sciencedirect.com/science/article/pii/S0954611111000552
[17] E. D. Chan, M. M. Chan, and M. M. Chan, “Pulse oximetry: Understanding itsbasic principles facilitates appreciation of its limitations,” Respiratory Medicine, vol.107, no. 6, pp. 789–799, Jun. 2013. [Online]. Available:http://www.sciencedirect.com/science/article/pii/S095461111300053X
[18] P. D. Mannheimer, “The light-tissue interaction of pulse oximetry,” Anesthesia andAnalgesia, vol. 105, no. 6 Suppl, pp. S10–17, Dec. 2007.
[19] “Il monitor indossabile QardioCore per l’ECG per iPhone.” [Online]. Available:https://www.getqardio.com/it/qardiocore-wearable-ecg-ekg-monitor-iphone_it/
[20] “CALM. Wearable ECG sensor with sports and sleep analysis,” Feb. 2017. [Online].Available: https://www.calm-health.com/
[21] “Sito ufficiale Fitbit per i rilevatori di attività e altro.” [Online]. Available:https://www.fitbit.com/it/home

Bibliography 131
[22] J. Lee, K. Matsumura, K. Yamakoshi, P. Rolfe, S. Tanaka, and T. Yamakoshi,“Comparison between red, green and blue light reflection photoplethysmographyfor heart rate monitoring during motion,” in 2013 35th Annual InternationalConference of the IEEE Engineering in Medicine and Biology Society (EMBC), Jul.2013, pp. 1724–1727.
[23] F. Lacirignola and E. Pasero, “Hardware design of a wearable ECG-sensor:Strategies implementation for improving CMRR and reducing noise,” in 2017European Conference on Circuit Theory and Design (ECCTD), Sep. 2017, pp. 1–4.
[24] S. Navaretti, E. Pasero, and V. Randazzo, “Vital-ecg: a portable wearable hospital,”2018 IEEE Sensors Applications Symposium, pp. 361–366, Mar. 2018.
[25] “CC2640r2f SimpleLink™ Bluetooth® low energy Wireless MCU.” [Online].Available: http://www.ti.com/product/cc2640r2f
[26] S. Bible, “Crystal Oscillator Basics and Crystal Selection for rfPIC™andPICmicro®Devices.” [Online]. Available:http://ww1.microchip.com/downloads/en/appnotes/00826a.pdf
[27] “SOT23 Dual-Input USB/AC Adapter 1-Cell Li+ Battery Chargers.” [Online].Available: https://www.maximintegrated.com/en/products/power/battery-management/MAX1555.html
[28] “Buck/Boost Regulating Charge Pump in µMAX.” [Online]. Available: https://www.maximintegrated.com/en/products/power/charge-pumps/MAX1759.html
[29] “REF20xx Low-Drift, Low-Power, Dual-Output, VREF and VREF/2 Voltage.”[Online]. Available: http://www.ti.com/product/REF2033
[30] “3 µA 1-Cell/2-Cell Fuel Gauge with ModelGauge.” [Online]. Available:https://www.maximintegrated.com/en/products/power/battery-management/MAX17048.html
[31] “Modelgauge battery fuel gauge technology.” [Online]. Available:https://www.maximintegrated.com/en/design/partners-and-technology/design-technology/modelgauge-battery-fuel-gauge-technology.html
[32] F. Kervel, “CC26xx HW Training - RF Front End options and Antennas.” [Online].Available: http://processors.wiki.ti.com/images/4/45/CC26xx_HW_training_RF_Frontends_and_Antennas.pdf
[33] A. Andersen, “Application Note AN043 - Small Size 2.4 GHz PCB antenna.”[Online]. Available: http://www.ti.com/lit/an/swra117d/swra117d.pdf

132 Bibliography
[34] “INA333 - Low-Power, Zero-Drift, Precision Instrumentation Amplifier.”[Online]. Available: http://www.ti.com/product/INA333
[35] “OPA4330 - 1.8V, 35 µA, microPower, Precision, Zero Drift CMOS Op Amp.”[Online]. Available: http://www.ti.com/product/OPA4330
[36] J. Karki, “Active Low-Pass Filter Design.” [Online]. Available:http://www.ti.com/lit/an/sloa049b/sloa049b.pdf
[37] “HDC2010 - Low Power Digital Humidity and Temperature Sensor.” [Online].Available: http://www.ti.com/product/HDC2010
[38] “High-Sensitivity Pulse Oximeter and Heart-Rate Sensor for Wearable Health.”[Online]. Available:https://datasheets.maximintegrated.com/en/ds/MAX30102.pdf
[39] “MAXREFDES117: HEART-RATE AND PULSE-OXIMETRY MONITOR.”[Online]. Available: https://www.maximintegrated.com/en/design/reference-design-center/system-board/6300.html
[40] “Bluetooth Core Specifications.” [Online]. Available:https://www.bluetooth.com/specifications/bluetooth-core-specification
[41] “SYS/BIOS (TI-RTOS Kernel) - User’s Guide.” [Online]. Available:http://www.ti.com/lit/ug/spruex3t/spruex3t.pdf
[42] “Core threading modules for the SYS/BIOS kernel.” [Online]. Available:http://software-dl.ti.com/dsps/dsps_public_sw/sdo_sb/targetcontent/sysbios/6_35_01_29/exports/bios_6_35_01_29/docs/cdoc/index.html
[43] “BLE-Stack User’s Guide for Bluetooth 4.2.” [Online]. Available:http://dev.ti.com/tirex/content/simplelink_cc2640r2_sdk_1_40_00_45/docs/blestack/ble_user_guide/html/ble-stack-3.x-guide/index.html
[44] “Recommended Configurations and Operating Profiles forMAX30101/MAX30102 EV Kits.” [Online]. Available:https://pdfserv.maximintegrated.com/en/an/AN6409.pdf
[45] E. W. Weisstein, “Wiener-Khinchin Theorem.” [Online]. Available:http://mathworld.wolfram.com/Wiener-KhinchinTheorem.html
[46] W. H. Press, S. A. Teukolsky, W. T. Vetterling, and B. P. Flannery, NumericalRecipes in C (2Nd Ed.): The Art of Scientific Computing. New York, NY, USA:Cambridge University Press, 1992.

Bibliography 133
[47] R. Matusiak, “Implementing Fast Fourier Transform Algorithms of Real-ValuedSequences With the TMS320 DSP Platform,” Aug 2001.
[48] J. Pan and W. Tompkins, “A Real-Time QRS Detection Algorithm,” IEEETransactions on Biomedical Engineering, vol. 32, no. 3, pp. 230–236, Mar 1985.
[49] Y. Tan and L. Du, “Study on Wavelet Transform in the Processing for ECGSignals,” in 2009 WRI World Congress on Software Engineering, vol. 4, May 2009,pp. 515–518.
[50] M. Susi, V. Renaudin, and G. Lachapelle, “Motion Mode Recognition and StepDetection Algorithms for Mobile Phone Users,” Sensors (Basel, Switzerland),vol. 13, no. 2, pp. 1539–1562, Jan. 2013. [Online]. Available:https://www.ncbi.nlm.nih.gov/pmc/articles/PMC3649428/
[51] R. Wang, W. Jia, Z.-H. Mao, R. J. Sclabassi, and M. Sun, “Cuff-Free Blood PressureEstimation Using Pulse Transit Time and Heart Rate,” International conference onsignal processing proceedings. International Conference on Signal Processing, vol.2014, pp. 115–118, Oct. 2014. [Online]. Available:https://www.ncbi.nlm.nih.gov/pmc/articles/PMC4512231/