Awareness raising and campaigns – Driving under the influence
21
Awareness raising and campaigns – Driving under the influence Please refer to this document as follows: Eichhorn, A., Kaiser, S. (2017), Awareness raising and campaigns – Driving under the influence, European Road Safety Decision Support System, developed by the H2020 project SafetyCube. Retrieved from www.roadsafety-dss.eu on DD MM YYYY Please note: The studies included in this synopsis were selected from those identified by a systematic literature search of specific databases (see supporting document). The main criterion for inclusion of studies in this synopsis and the DSS was that each study provides a quantitative effect estimate, preferably on the number or severity of crashes or otherwise on road user behaviour that is known to be related to the occurrence or severity of a crash. Therefore, key studies providing qualitative information might not be included in this synopsis.
Transcript of Awareness raising and campaigns – Driving under the influence
Awareness raising and campaigns – Driving under the influence Please refer to this document as follows: Eichhorn, A., Kaiser, S. (2017), Awareness raising and campaigns – Driving under the influence, European Road Safety Decision Support System, developed by the H2020 project SafetyCube. Retrieved from www.roadsafety-dss.eu on DD MM YYYY Please note: The studies included in this synopsis were selected from those identified by a systematic literature search of specific databases (see supporting document). The main criterion for inclusion of studies in this synopsis and the DSS was that each study provides a quantitative effect estimate, preferably on the number or severity of crashes or otherwise on road user behaviour that is known to be related to the occurrence or severity of a crash. Therefore, key studies providing qualitative information might not be included in this synopsis.
Awareness raising and campaigns – Driving under the influence
1 Summary
Eichhorn, A., Kaiser, S., June 2017
1.1 COLOUR CODE: LIGHT GREEN
There is some indication that drink-driving campaigns have a positive impact on attitudes towards drink-driving and even on the related accident occurrence. There is less evidence of the effectiveness of designated driver programmes.
1.2 KEY WORDS
Campaign, evaluation, impact, effectiveness, awareness raising, driving under the influence, drunk driving, drink-driving, impaired driving, drugged-driving, alcohol, designated driver, heroin, LSD, ketamine, cocaine, ecstasy, cannabis
1.3 ABSTRACT
The main purpose of DUI (Driving Under the Influence) campaigns is to raise awareness regarding impaired driving as well as to promote sober driving. Results provide some indication that drink-driving campaigns can have positive effects on road safety. One out of two meta-analyses showed an association with crash reduction. A further meta-analysis and other individual studies with indirect outcome measures showed mixed results. While self-reported drink-driving behaviour did not considerably change, attitudes towards drink-driving were favourably influenced to some extent. Designated driver programmes (assigning someone to not drink and drive and to bring others home safely) seem to have lower potential to prevent drink-driving. However, most of the coded individual studies focus on young drivers and to some extent on passengers aged up to 34 years. Thus, conclusions can only be drawn regarding this age group. Furthermore, it should be noted that some analysed DUI campaigns were accompanied by enforcement activities. Therefore, it is not clear to what extent the effects are attributable to the campaign itself.
1.4 BACKGROUND
This synopsis focuses on the effectiveness of campaigns addressing specifically driving under the influence. For more detailed information on campaigns and awareness raising in general, please also see the synopsis “Effectiveness of road safety campaigns”. How is ‘campaign’ as a road safety measure defined? The EU project CAST1 provides the following definition of campaigns in the field of road safety: “Road safety communication campaigns can be defined as purposeful attempts to inform, persuade, or motivate people in view of changing their beliefs and/or behaviour in order to improve road safety as a whole or in a specific, well-defined large audience, typically within a given time period by means of organised communication activities involving specific media channels often combined with interpersonal support and/or supportive actions such as enforcement, education, legislation, enhancing personal commitment, rewards, etc.” (Elliott, 1993; Rice & Atkin, 1994; Vaa et al., 2008, as cited in Delhomme et al., 2009, p.16). How do campaigns affect road safety?
1 The EU-project CAST “Campaigns and Awareness-Raising Strategies in Traffic Safety” was carried out from 2006 to 2009 by 19 organisations from 15 European countries. This project identified essential parameters of campaigns effectiveness.
Awareness raising and campaigns – Driving under the influence
The effect of a campaign can be increased information, knowledge, raised awareness, changed attitude and changed behaviour to the extent that eventually the frequency of accidents is reduced. However, since accident occurrence is multicausal and highly influenced by chance, there is rarely a direct link from a campaign to accident reduction. Many campaigns are combined with enforcement and new legislation. It is difficult to attribute the effect to a single element of this combination. Campaigns can also be used to establish favourable preconditions in the public for new legislation. Which factors influence the effect of a campaign on road safety and which are the modifying conditions? Important factors for an effective campaign are clearly defined road safety problems and target groups, as well as a corresponding tailored message. Furthermore, it is necessary to use theoretical psychological models that explain the risk behaviour or safety problem (Delhomme et al., 2009). It is important to note that communication has to be based on the cultural codes used in the target community (national, regional, sub-groups etc.). Other influencing factors are the duration and intensity of a campaign. Other situational factors such as simultaneous competing events (e.g. tragic accident reported in media) can also have an impact on the campaign effects. How is the effect of campaigns on DUI measured? The following measures are used to assess the effectiveness of DUI-campaigns:
• Self-reported and intended behaviour • Attitudes, opinions, perceived norm, knowledge, behavioural beliefs • Accident occurrence
The vast majority of studies in this field apply a before-after design to measure the campaign effect. Accident statistics are seldom the means of evaluation because behaviour of road users is multicausal.
1.5 OVERVIEW OF RESULTS
Four meta-analyses on the effectiveness of drink-driving campaigns have been considered (Yadav & Kobayashi, 2015; Phillips et al., 2009 and 2011; Ditter et al., 2005). They show mixed results regarding the effects on road safety. Phillips et al. (2011) found a significant accident reduction due to drink-driving campaigns. Yadav & Kobayashi (2015) on the other hand reported non-significant effects on accident reduction. A meta-analysis on alternative outcome measures (other than crashes, but safety performance indicators such as risk behaviour, attitudes etc.) did not indicate a significant improvement of observed and self-reported drink-driving behaviour (Phillips et al., 2009). As regards designated driver programmes, Ditter et al. (2005) indicated insufficient evidence to determine their effectiveness. With reference to drugged driving only one study was eligible for coding, which reports a significant positive change in the attitude that cannabis has a severe impact on driving. No such change could be found for all other surveyed drug types (Angle et al., 2009). Nathanail and Adamos (2009) and Linkenbach (2005) analysed driver’s self-reported drink-driving behaviour after DUI campaigns. None of the reported effects indicate a significant positive change. Concerning perceived impairment due to drink-driving, three studies indicate a (partly significant) improvement of young males’ attitudes towards DUI. Another study, however, did not find a change in that respect (Nathanail & Adamos, 2009). Evaluation studies of designated driver programmes show a (partly significant) increase in using a designated driver (Watson & Nielson, 2008; Linkenbach, 2005). However, acting as designated driver (committing to not drink and drive and to bring others home safely) did not significantly change (Watson & Nielson, 2008).

Awareness raising and campaigns – Driving under the influence
In applying a regression model considering compulsory breath tests (before and after campaign) and a measure of retained awareness of a television advertising campaign Tay (1999) pointed out that the evaluated campaign is associated with a significant drop in drink-driving behaviour. However, all analysed studies had at least minor limitations. Some of the evaluated campaigns were accompanied by enforcement activities, lacked details of reported significance testing or measured only short-term campaign effects.
Awareness raising and campaigns – Driving under the influence
2 Scientific details
2.1 THEORETICAL BACKGROUND
Aim and methods of awareness raising measures and campaigns The main purpose of awareness raising measures and communication campaigns is to encourage road users to engage in safe behaviour in traffic. With respect to DUI campaigns, the primary aim is favourable attitudes against drink-driving and to restrain from impaired driving. The underlying concept of campaigns in road safety is social marketing which aims at influencing and changing social behaviours. When developing a campaign, it is crucial to conduct a detailed analysis of the road safety problem and the target group. Furthermore, psychological theoretical models are very helpful in the development of the campaign message to increase the effectiveness (Robertson & Pashley, 2015). A description of these models – such as the Theory of Planned Behaviour (TPB) – can be found in Theofilatos et al. (2017). Besides developing the message, the campaign strategy has to be defined. Campaigns may use an information approach or emotive, especially using fear to draw the attention of the target audience to the message. However, there are still controversial discussions regarding the effectiveness of fear-based messages (see e.g. Castillo-Manzano et al., 2012). Whether or not a message has reached the target group, is also a question of group characteristics and local culture. To evaluate whether or not the message of the campaign can influence the behaviour of the target group as intended, a pre-test of message and slogan should be conducted (Delhomme et al., 2009; Hoekstra & Wegman, 2011). For road safety campaigns the following type of media is generally used: television, radio, newspaper/magazines, cinema, web/online, social media, billboards, flyers/leaflets/posters, message signs and events involving face to face communication. An overview of advantages and disadvantages of different types of media for road safety campaigns can be found in Delhomme et al. (2009). Campaign effects and influencing factors Awareness raising activities and campaigns can positively influence a number of road safety relevant constructs, such as favourable attitudes, knowledge and perceptions as well as safe behaviour and therefore also accident rates. However, there are various factors to be considered to maximise impact. According to Phillips et al. (2011) the following factors of campaigns are associated with accident reduction:
• Personal communication • Road side delivery (billboards, message signs) • Drink-driving theme • Combination with enforcement • Short campaign duration (0-29 days)
Limitations of campaigns and challenges of evaluation In the past, evaluations of campaigns were rarely carried out for various reasons. For one, there is sometimes a lack of awareness of the benefit of evaluating, or there may be budget and time constraints. Uncertainties in terms of methodological application are also a barrier. As previously described, the effectiveness of road safety campaigns can be measured by various means. The most important outcome measure is a reduction in crashes. It is difficult though, to link an accident reduction to a campaign while controlling for all other possible contributing factors. The defined outcome measures to account for campaign effects are therefore often ‘indirect’, like intended behaviour or attitudes etc. Even though there is evidence concerning the influence of these
Awareness raising and campaigns – Driving under the influence
constructs on actual behaviour, there are always other additional determining factors (e.g. situational factors) that cannot be accounted for. A before-after-design ideally includes a meaningful reference group to control for confounding factors (e.g. a similar geographical region without exposure to the contents of the campaign), which is however rarely the case. Next to a lack of (systematical and valid) evaluation of effects, campaigns are often combined or conducted simultaneously with enforcement measures and implementation of new legislation. If an effect (improvement) is measured then, it remains unclear to which of the single components it is attributable, and to what extent.
2.2 CODED STUDIES
The literature search was carried out in three databases (Scopus, TRID and a KFV-internal literature database) with separate search strategies (for a detailed description see “Supporting documents”). Additionally, a free web-based search was conducted via Google. Below first information on the characteristics of coded studies is given and subsequently the main research methods used for campaigns and awareness raising measures against driving under the influence is provided. Description of coded studies A more detailed description of the campaigns and the corresponding design of evaluation can be found in the supporting documents (3.2). Description of the main research methods In order to evaluate the effectiveness of DUI campaigns mainly before-after designs are used. Evaluations of DUI campaigns are rarely linked to accidents and focus mainly on outcomes of questionnaires and interviews using self-reported behaviour, attitudes, beliefs and opinions as measures of effectiveness. For the majority of the evaluation studies, it is not clear from the publication whether or not a theoretical psychological model was the basis for designing the respective campaigns. The studies vary in whether significance tests are applied/reported or not. A control group is missing in most of the studies. Four meta-analyses calculated (weighted) average effects.
2.3 OVERVIEW OF RESULTS
The following table provides information on the main outcomes of coded studies on DUI campaigns and awareness raising.
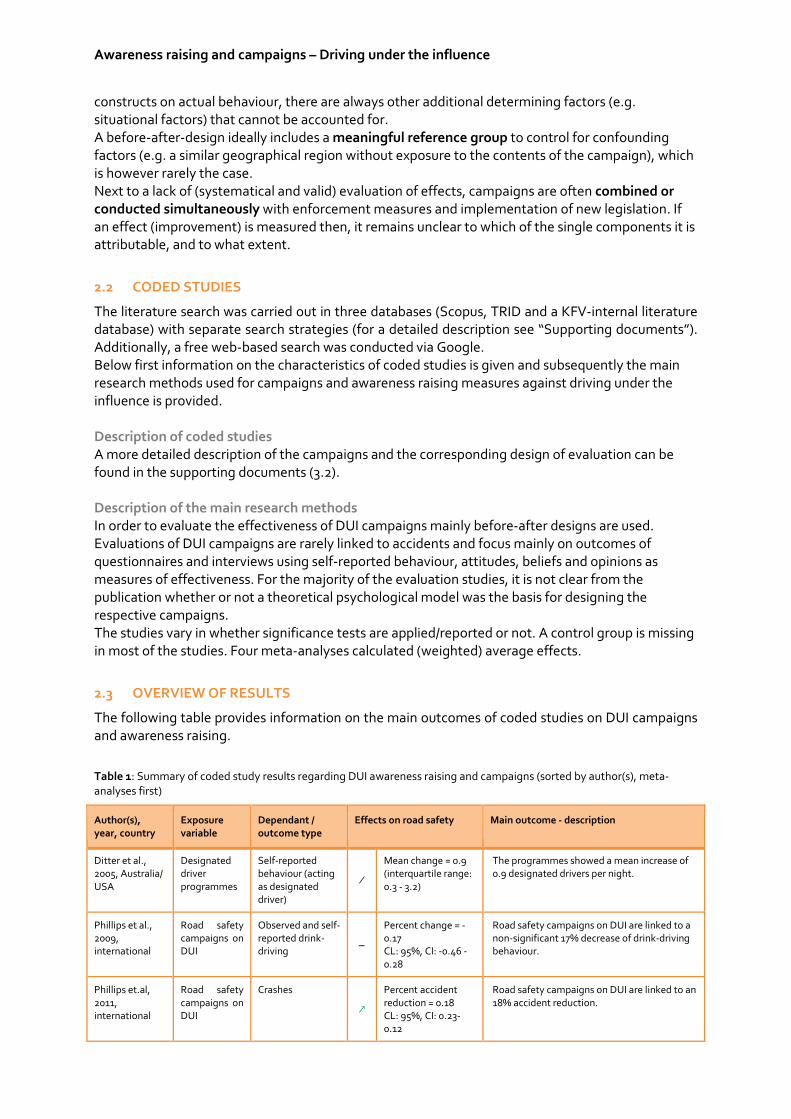
Table 1: Summary of coded study results regarding DUI awareness raising and campaigns (sorted by author(s), meta-analyses first)
Author(s), year, country
Exposure variable
Dependant / outcome type
Effects on road safety Main outcome - description
Ditter et al., 2005, Australia/ USA
Designated driver programmes
Self-reported behaviour (acting as designated driver)
∕
Mean change = 0.9 (interquartile range: 0.3 - 3.2)
The programmes showed a mean increase of 0.9 designated drivers per night.
Phillips et al., 2009, international
Road safety campaigns on DUI
Observed and self-reported drink-driving −
Percent change = -0.17 CL: 95%, CI: -0.46 - 0.28
Road safety campaigns on DUI are linked to a non-significant 17% decrease of drink-driving behaviour.
Phillips et.al, 2011, international
Road safety campaigns on DUI
Crashes
↗
Percent accident reduction = 0.18 CL: 95%, CI: 0.23-0.12
Road safety campaigns on DUI are linked to an 18% accident reduction.
Awareness raising and campaigns – Driving under the influence
Author(s), year, country
Exposure variable
Dependant / outcome type
Effects on road safety Main outcome - description
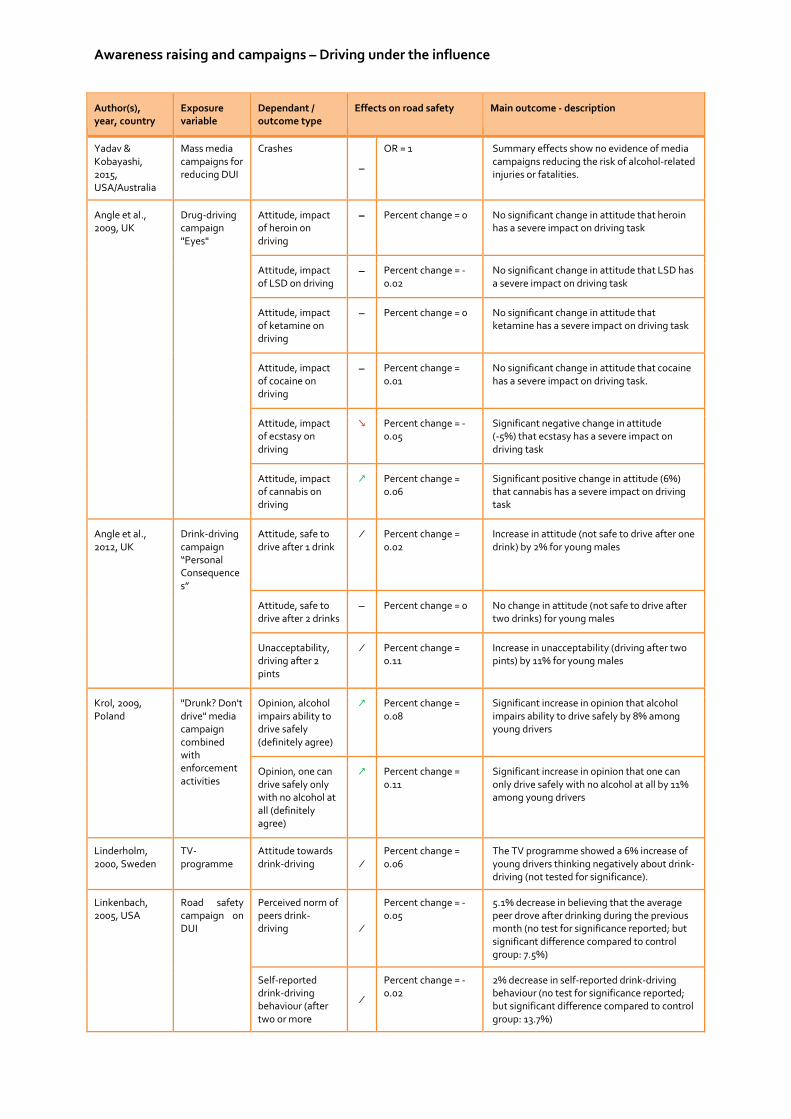
Yadav & Kobayashi, 2015, USA/Australia
Mass media campaigns for reducing DUI
Crashes
−
OR = 1 Summary effects show no evidence of media campaigns reducing the risk of alcohol-related injuries or fatalities.
Angle et al., 2009, UK
Drug-driving campaign "Eyes"
Attitude, impact of heroin on driving
− Percent change = 0 No significant change in attitude that heroin has a severe impact on driving task
Attitude, impact of LSD on driving
− Percent change = -0.02
No significant change in attitude that LSD has a severe impact on driving task
Attitude, impact of ketamine on driving
− Percent change = 0 No significant change in attitude that ketamine has a severe impact on driving task
Attitude, impact of cocaine on driving
− Percent change = 0.01
No significant change in attitude that cocaine has a severe impact on driving task.
Attitude, impact of ecstasy on driving
↘ Percent change = -0.05
Significant negative change in attitude (-5%) that ecstasy has a severe impact on driving task
Attitude, impact of cannabis on driving
↗ Percent change = 0.06
Significant positive change in attitude (6%) that cannabis has a severe impact on driving task
Angle et al., 2012, UK
Drink-driving campaign “Personal Consequences”
Attitude, safe to drive after 1 drink
∕ Percent change = 0.02
Increase in attitude (not safe to drive after one drink) by 2% for young males
Attitude, safe to drive after 2 drinks
− Percent change = 0 No change in attitude (not safe to drive after two drinks) for young males
Unacceptability, driving after 2 pints
∕ Percent change = 0.11
Increase in unacceptability (driving after two pints) by 11% for young males
Krol, 2009, Poland
"Drunk? Don't drive" media campaign combined with enforcement activities
Opinion, alcohol impairs ability to drive safely (definitely agree)
↗ Percent change = 0.08
Significant increase in opinion that alcohol impairs ability to drive safely by 8% among young drivers
Opinion, one can drive safely only with no alcohol at all (definitely agree)
↗ Percent change = 0.11
Significant increase in opinion that one can only drive safely with no alcohol at all by 11% among young drivers
Linderholm, 2000, Sweden
TV-programme
Attitude towards drink-driving ∕
Percent change = 0.06
The TV programme showed a 6% increase of young drivers thinking negatively about drink-driving (not tested for significance).
Linkenbach, 2005, USA
Road safety campaign on DUI
Perceived norm of peers drink-driving ∕
Percent change = -0.05
5.1% decrease in believing that the average peer drove after drinking during the previous month (no test for significance reported; but significant difference compared to control group: 7.5%)
Self-reported drink-driving behaviour (after two or more
∕
Percent change = -0.02
2% decrease in self-reported drink-driving behaviour (no test for significance reported; but significant difference compared to control group: 13.7%)
Awareness raising and campaigns – Driving under the influence
Author(s), year, country
Exposure variable
Dependant / outcome type
Effects on road safety Main outcome - description
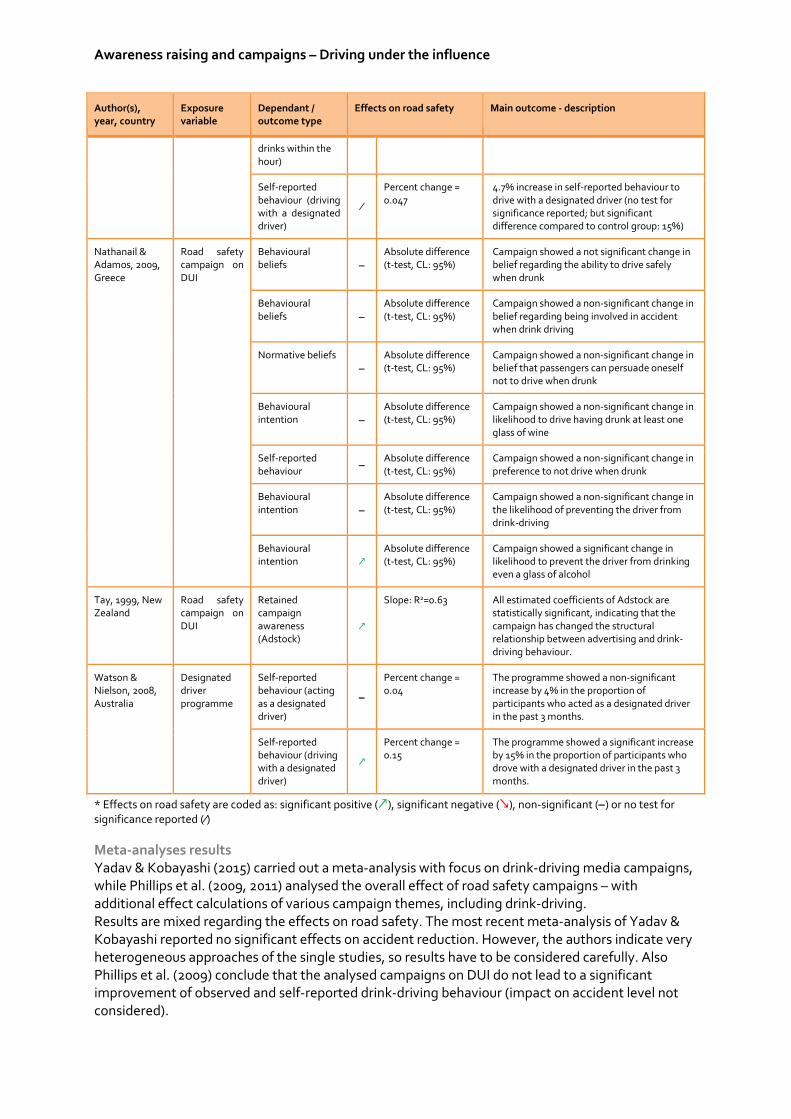
drinks within the hour)
Self-reported behaviour (driving with a designated driver)
∕
Percent change = 0.047
4.7% increase in self-reported behaviour to drive with a designated driver (no test for significance reported; but significant difference compared to control group: 15%)
Nathanail & Adamos, 2009, Greece
Road safety campaign on DUI
Behavioural beliefs −
Absolute difference (t-test, CL: 95%)
Campaign showed a not significant change in belief regarding the ability to drive safely when drunk
Behavioural beliefs −
Absolute difference (t-test, CL: 95%)
Campaign showed a non-significant change in belief regarding being involved in accident when drink driving
Normative beliefs −
Absolute difference (t-test, CL: 95%)
Campaign showed a non-significant change in belief that passengers can persuade oneself not to drive when drunk
Behavioural intention −
Absolute difference (t-test, CL: 95%)
Campaign showed a non-significant change in likelihood to drive having drunk at least one glass of wine
Self-reported behaviour −
Absolute difference (t-test, CL: 95%)
Campaign showed a non-significant change in preference to not drive when drunk
Behavioural intention −
Absolute difference (t-test, CL: 95%)
Campaign showed a non-significant change in the likelihood of preventing the driver from drink-driving
Behavioural intention ↗
Absolute difference (t-test, CL: 95%)
Campaign showed a significant change in likelihood to prevent the driver from drinking even a glass of alcohol
Tay, 1999, New Zealand
Road safety campaign on DUI
Retained campaign awareness (Adstock)
↗
Slope: R2=0.63 All estimated coefficients of Adstock are statistically significant, indicating that the campaign has changed the structural relationship between advertising and drink-driving behaviour.
Watson & Nielson, 2008, Australia
Designated driver programme
Self-reported behaviour (acting as a designated driver)
−
Percent change = 0.04
The programme showed a non-significant increase by 4% in the proportion of participants who acted as a designated driver in the past 3 months.
Self-reported behaviour (driving with a designated driver)
↗
Percent change = 0.15
The programme showed a significant increase by 15% in the proportion of participants who drove with a designated driver in the past 3 months.
* Effects on road safety are coded as: significant positive (↗), significant negative (↘), non-significant (−) or no test for significance reported (∕) Meta-analyses results Yadav & Kobayashi (2015) carried out a meta-analysis with focus on drink-driving media campaigns, while Phillips et al. (2009, 2011) analysed the overall effect of road safety campaigns – with additional effect calculations of various campaign themes, including drink-driving. Results are mixed regarding the effects on road safety. The most recent meta-analysis of Yadav & Kobayashi reported no significant effects on accident reduction. However, the authors indicate very heterogeneous approaches of the single studies, so results have to be considered carefully. Also Phillips et al. (2009) conclude that the analysed campaigns on DUI do not lead to a significant improvement of observed and self-reported drink-driving behaviour (impact on accident level not considered).
Awareness raising and campaigns – Driving under the influence
Phillips et al. (2011) on the other hand found a significant accident reduction due to drink-driving campaigns. All meta-analyses calculated effects of campaigns with and without enforcement components. Only Phillips et al. (2011) reported results adjusted for accompanied enforcement measures, however, not on the DUI-level. Considering different campaign themes it turned out that especially drink-driving campaigns can be associated with accident reduction (see also synopsis “Effectiveness of Road Safety Campaigns”). With regard to designated driver programmes Ditter et al. (2005) indicated an increase of the mean number of designated drivers per night. However, due to the small effect sizes observed there is insufficient evidence to determine the effectiveness of incentive programmes to promote designated driver use. Additional studies on DUI campaigns Additionally considered studies were quite different regarding the exposure variable(s) (different aims and resources of campaigns) and outcome variables. Furthermore, all studies had at least minor limitations and some lacked reported significance testing, so it was not feasible to give a summarised analysis in terms of meta-analysis or vote-count analysis. Table 1 shows an overview of the main results of these studies. Only one study could be found with respect to the effectiveness of drugged-driving campaigns. Angle et al. (2009) report a significant positive change in the attitude that cannabis has a severe impact on driving after the “Eyes” campaign. In contrast, a significant negative change was found regarding the attitude that ecstasy has a severe impact on driving. No change was found for heroin, LSD, ketamine and cocaine. Despite the fact that the study only assessed changes in attitudes, the reported facts do not show a clear trend and therefore, no conclusion can be drawn. Nathanail & Adamos (2009) and Linkenbach (2005) analysed drivers’ self-reported drink-driving behaviour after a DUI campaign. The latter found a small decrease of 2% (driving after two or more drinks within the hour), however, did not indicate whether this change is significant or not. The other study reported a non-significant change in the “preference to not drive when drunk” as well as a non-significant change regarding the likelihood to drive having drunk at least one glass of wine. Still, due to a small sample size, results have to be interpreted with caution. Concerning the perceived impairment due to drink-driving Krol (2009) indicated a significant increase of 8% among young drivers and an 11% increase in thinking that one can only drive safely with no alcohol at all (“Drunk? Don't drive" media campaign). Also Angle et al. (2012) and Linderholm (2000) report an increase of young males (11% and 6%, respectively), who think negatively about drink-driving. However, no information concerning significance is provided. Nathanail & Adamos (2009) on the other hand found no difference in beliefs regarding either the ability to drive safely or being involved in an accident when drunk after a Greek DUI campaign. Some of the coded studies evaluated designated driver programmes. Only Watson & Nielson (2008) found a significant increase in participants who drove with a designated driver after the Australian “Skipper” campaign. However, acting as designated driver did not significantly change. Linkenbach (2005) also reports an increase in passengers driving with a designated driver (no significance test reported). In order to examine the relationship on advertising exposure (DUI campaign, New Zealand) and drink-driving behaviour Tay (1999) used regression models including the following two variables: compulsory breath tests (before and after campaign), advertising stock (measures the retained awareness of advertising). Different models show that the estimated coefficients for the Adstock variables are statistically significant and negative. Results of the log-linear model indicate that the television advertising campaign is associated with a significant drop in drink-driving behaviour
Awareness raising and campaigns – Driving under the influence
during the period analysed, after adjusting for changes in compulsory breath tests and seasonal trends. Modifying conditions Most of the coded individual studies focus on young drivers and to some extent on passengers aged up to 34 years. Thus, conclusions can only be drawn regarding this age group. Phillips et al. (2011) carried out a meta-regression (model of predictor variables) based on 119 individual campaign effects to identify the relative importance of factors influencing the effectiveness of road safety campaigns. They identified the following factors of campaigns to be associated with accident reduction:
• Personal communication • Road side delivery (billboards, message signs) • Combination with enforcement • Short campaign duration (0-29 days)
Phillips et al. (2009) outlined conclusions on a meta-regression by Vaa et al. (2004). They considered various outcome variables, not only accident reduction (e.g. self-reported behaviour or attitudes) and found the same factors to be beneficially influencing campaign outcomes.
2.4 CONCLUSION
General The focus of this synopsis is on drink-driving campaigns, as only one study on a drug-driving campaign was identified and thus no general conclusions can be drawn. Main results Results provide some indications that drink-driving campaigns can have positive effects on road safety. One out of two meta-analyses showed an association with crash reduction. A further meta-analysis and other individual studies with indirect outcome measure (observed and self-reported behaviour) showed mixed results, as well. While self-reported drink-driving behaviour did not considerably change, attitudes towards drink-driving were favourably influenced to some extent. The evaluation studies of designated driver programmes show a (partly significant) increase in using a designated driver. However, acting as designated driver did not significantly change. Furthermore, one study indicated a significant drop in drink-driving behaviour after a television advertising campaign (number of positive compulsory breath tests). Biases and transferability All studies had at least minor limitations. It is difficult to link changes in accidents solely to a campaign. The defined outcome measures to account for campaign effects are therefore often ‘indirect’ like intended behaviour or attitudes. Even though there is evidence concerning the influence of these constructs on actual behaviour, there are also always other determining factors that cannot be accounted for. Furthermore, often self-reported data is used to assess effectiveness, which may introduce biases such as social desirability. Another limitation is that some evaluated campaigns were accompanied by enforcement activities or other road safety measure. In that case, it is not clear to what extent the effects are attributable to the single measures. Also, all individual campaigns (exposure) were heterogeneous regarding design (exact target group, period, media etc.). Moreover, many studies did not indicate whether significance was tested. Long term effects are available for only a few studies. Therefore, sustainable changes in behaviour due to campaigns remain unclear. Finally, to control for confounding factors ideally a meaningful reference group is included, which is rarely done.

Awareness raising and campaigns – Driving under the influence
3 Supporting documents
3.1 LITERATURE SEARCH STRATEGY
The literature search was conducted in December 2016. It was carried out in three databases and a complementary free internet search. The queried databases were
• Scopus: a large abstract and citation database of peer-reviewed literature • TRID: a large online bibliographic database of transportation research • DOK-DAT: a KFV-internal literature database.
Database: Scopus Date: 16th of December 2016 limitations: published: 2006 to present
Search N0. Search terms, logical operators, combined queries Hits
#1 “Campaign” OR “awareness” OR “public information” 248,963
#2 “DUI” OR “driving under influence” OR “alcohol” OR “drunk driving” OR “drink driving” OR “drugged driving” OR “drugs” OR “medic*” OR “alcohol-impaired driving” OR “drug-impaired driving”
4,684,113
#3 “road safety” OR “traffic safety” 12,033
#4 #1 AND #2 AND #3 131
#5 Limit to Europe, Russia, USA, Canada, Australia and New Zealand 80
Table 2: Used search terms, logical operators, and combined queries of literature search (Scopus).
Detailed search terms as well as their linkage with logical operators and combined queries are shown in Table 2. Using search fields title, abstract and keywords (TITLE-ABS-KEY), and a general limitation to studies which were published from 2006 to current, led to 131 studies. In a further reduction step, results were limited to European countries, as well as Russia, USA, Canada, Australia and New Zealand. This led to a final sample of 80 studies of literature search in the database Scopus (Table 2).
Database: DOK-DAT Date: 7th of December 2016
Search no. Search terms, operators, combined queries Hits
#1 “Werbung” (advertisement) AND “Sicherheit” (safety) 467
#2 (within #1) “Wirksamkeit*” (effectiveness) OR “Evalu*” (evaluation) OR “Bewertung*” (assessment)
278
Table 3: Used search terms, logical operators, and combined queries of literature search (DOK-DAT). German search fields ‘Titel’, ‘ITRD Schlagworte’ and ‘freie Schlagworte’ were used. Hits were only limited to the years 1990 to 2016 and got 278 more potential studies (Table 3).
Database: TRID database Date: 20th of December 2016
Search no. Search terms / operators / combined queries Hits
#1 “safety” AND “campaign” AND “evaluation” 240
Table 4: Used search terms, logical operators, and combined queries of literature search (TRID).
Awareness raising and campaigns – Driving under the influence
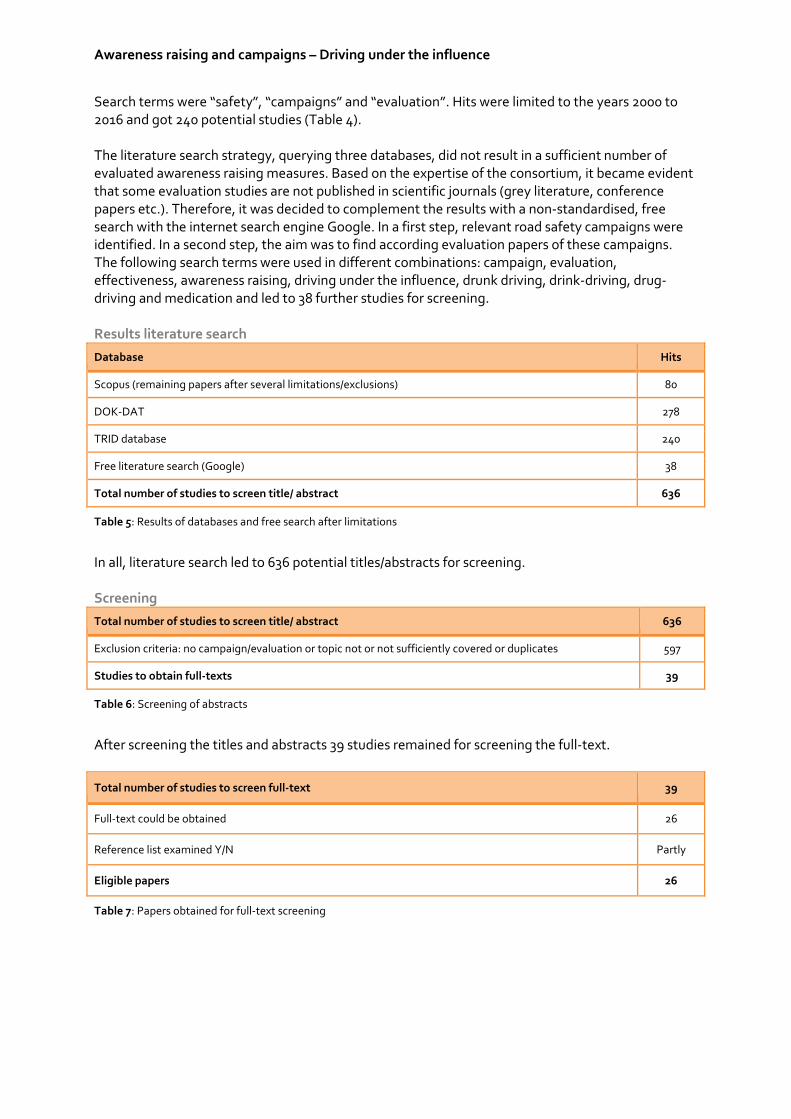
Search terms were “safety”, “campaigns” and “evaluation”. Hits were limited to the years 2000 to 2016 and got 240 potential studies (Table 4). The literature search strategy, querying three databases, did not result in a sufficient number of evaluated awareness raising measures. Based on the expertise of the consortium, it became evident that some evaluation studies are not published in scientific journals (grey literature, conference papers etc.). Therefore, it was decided to complement the results with a non-standardised, free search with the internet search engine Google. In a first step, relevant road safety campaigns were identified. In a second step, the aim was to find according evaluation papers of these campaigns. The following search terms were used in different combinations: campaign, evaluation, effectiveness, awareness raising, driving under the influence, drunk driving, drink-driving, drug-driving and medication and led to 38 further studies for screening. Results literature search
Database Hits
Scopus (remaining papers after several limitations/exclusions) 80
DOK-DAT 278
TRID database 240
Free literature search (Google) 38
Total number of studies to screen title/ abstract 636
Table 5: Results of databases and free search after limitations
In all, literature search led to 636 potential titles/abstracts for screening. Screening
Total number of studies to screen title/ abstract 636
Exclusion criteria: no campaign/evaluation or topic not or not sufficiently covered or duplicates 597
Studies to obtain full-texts 39
Table 6: Screening of abstracts
After screening the titles and abstracts 39 studies remained for screening the full-text.
Total number of studies to screen full-text 39
Full-text could be obtained 26
Reference list examined Y/N Partly
Eligible papers 26
Table 7: Papers obtained for full-text screening
Awareness raising and campaigns – Driving under the influence
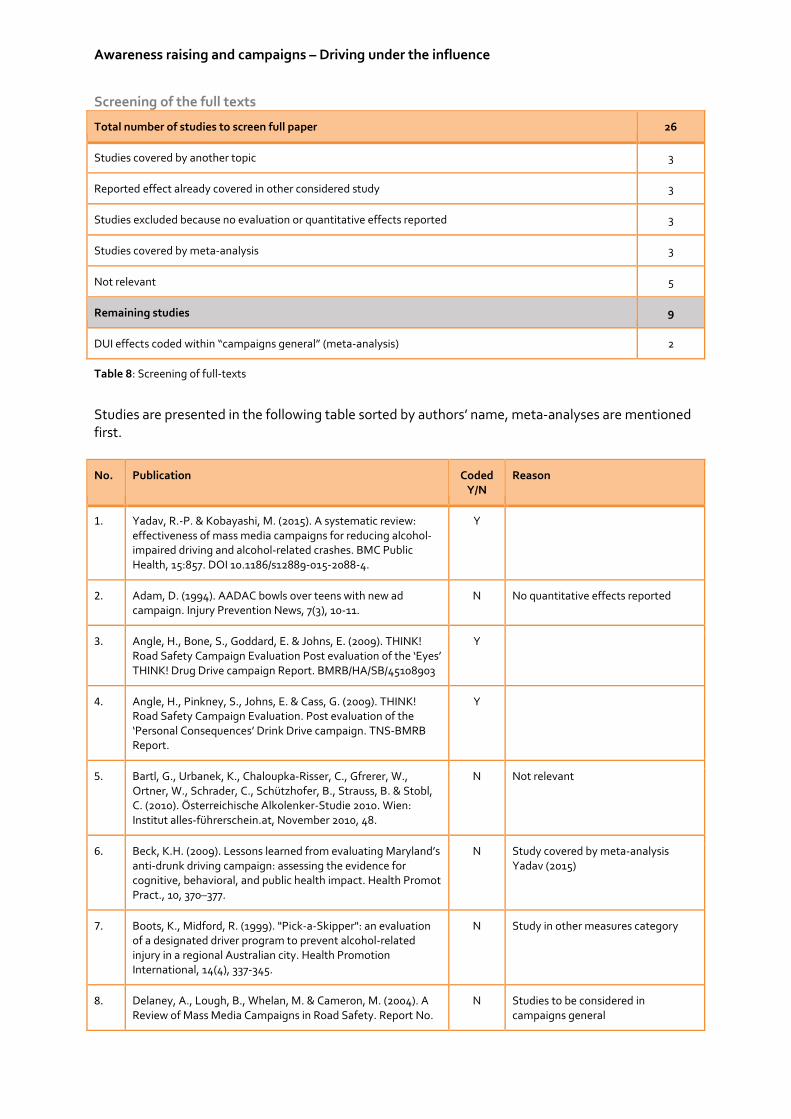
Screening of the full texts
Total number of studies to screen full paper 26
Studies covered by another topic 3
Reported effect already covered in other considered study 3
Studies excluded because no evaluation or quantitative effects reported 3
Studies covered by meta-analysis 3
Not relevant 5
Remaining studies 9
DUI effects coded within “campaigns general” (meta-analysis) 2
Table 8: Screening of full-texts
Studies are presented in the following table sorted by authors’ name, meta-analyses are mentioned first.
No.
Publication Coded Y/N
Reason
1. Yadav, R.-P. & Kobayashi, M. (2015). A systematic review: effectiveness of mass media campaigns for reducing alcohol-impaired driving and alcohol-related crashes. BMC Public Health, 15:857. DOI 10.1186/s12889-015-2088-4.
Y
2. Adam, D. (1994). AADAC bowls over teens with new ad campaign. Injury Prevention News, 7(3), 10-11.
N No quantitative effects reported
3. Angle, H., Bone, S., Goddard, E. & Johns, E. (2009). THINK! Road Safety Campaign Evaluation Post evaluation of the ‘Eyes’ THINK! Drug Drive campaign Report. BMRB/HA/SB/45108903
Y
4. Angle, H., Pinkney, S., Johns, E. & Cass, G. (2009). THINK! Road Safety Campaign Evaluation. Post evaluation of the ‘Personal Consequences’ Drink Drive campaign. TNS-BMRB Report.
Y
5. Bartl, G., Urbanek, K., Chaloupka-Risser, C., Gfrerer, W., Ortner, W., Schrader, C., Schützhofer, B., Strauss, B. & Stobl, C. (2010). Österreichische Alkolenker-Studie 2010. Wien: Institut alles-führerschein.at, November 2010, 48.
N Not relevant
6. Beck, K.H. (2009). Lessons learned from evaluating Maryland’s anti-drunk driving campaign: assessing the evidence for cognitive, behavioral, and public health impact. Health Promot Pract., 10, 370–377.
N Study covered by meta-analysis Yadav (2015)
7. Boots, K., Midford, R. (1999). "Pick-a-Skipper": an evaluation of a designated driver program to prevent alcohol-related injury in a regional Australian city. Health Promotion International, 14(4), 337-345.
N Study in other measures category
8. Delaney, A., Lough, B., Whelan, M. & Cameron, M. (2004). A Review of Mass Media Campaigns in Road Safety. Report No.
N Studies to be considered in campaigns general
Awareness raising and campaigns – Driving under the influence
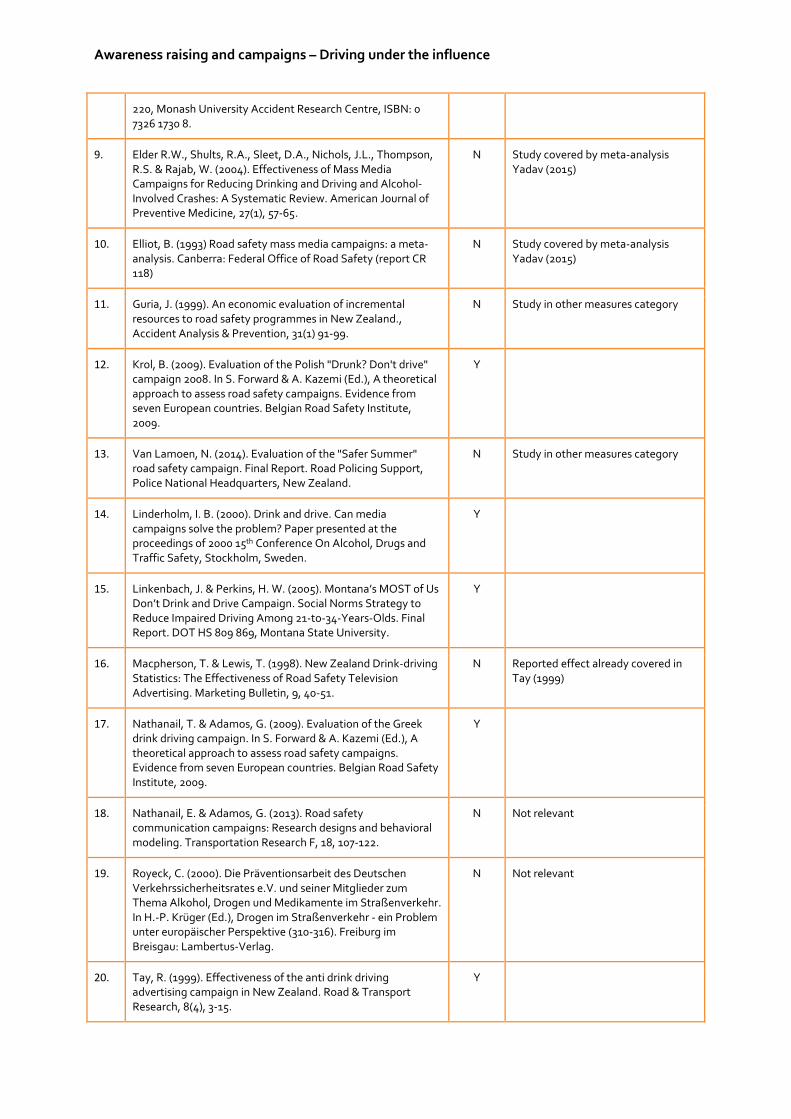
220, Monash University Accident Research Centre, ISBN: 0 7326 1730 8.
9. Elder R.W., Shults, R.A., Sleet, D.A., Nichols, J.L., Thompson, R.S. & Rajab, W. (2004). Effectiveness of Mass Media Campaigns for Reducing Drinking and Driving and Alcohol-Involved Crashes: A Systematic Review. American Journal of Preventive Medicine, 27(1), 57-65.
N Study covered by meta-analysis Yadav (2015)
10. Elliot, B. (1993) Road safety mass media campaigns: a meta-analysis. Canberra: Federal Office of Road Safety (report CR 118)
N Study covered by meta-analysis Yadav (2015)
11. Guria, J. (1999). An economic evaluation of incremental resources to road safety programmes in New Zealand., Accident Analysis & Prevention, 31(1) 91-99.
N Study in other measures category
12. Krol, B. (2009). Evaluation of the Polish "Drunk? Don't drive" campaign 2008. In S. Forward & A. Kazemi (Ed.), A theoretical approach to assess road safety campaigns. Evidence from seven European countries. Belgian Road Safety Institute, 2009.
Y
13. Van Lamoen, N. (2014). Evaluation of the "Safer Summer" road safety campaign. Final Report. Road Policing Support, Police National Headquarters, New Zealand.
N Study in other measures category
14. Linderholm, I. B. (2000). Drink and drive. Can media campaigns solve the problem? Paper presented at the proceedings of 2000 15th Conference On Alcohol, Drugs and Traffic Safety, Stockholm, Sweden.
Y
15. Linkenbach, J. & Perkins, H. W. (2005). Montana’s MOST of Us Don’t Drink and Drive Campaign. Social Norms Strategy to Reduce Impaired Driving Among 21-to-34-Years-Olds. Final Report. DOT HS 809 869, Montana State University.
Y
16. Macpherson, T. & Lewis, T. (1998). New Zealand Drink-driving Statistics: The Effectiveness of Road Safety Television Advertising. Marketing Bulletin, 9, 40-51.
N Reported effect already covered in Tay (1999)
17. Nathanail, T. & Adamos, G. (2009). Evaluation of the Greek drink driving campaign. In S. Forward & A. Kazemi (Ed.), A theoretical approach to assess road safety campaigns. Evidence from seven European countries. Belgian Road Safety Institute, 2009.
Y
18. Nathanail, E. & Adamos, G. (2013). Road safety communication campaigns: Research designs and behavioral modeling. Transportation Research F, 18, 107-122.
N Not relevant
19. Royeck, C. (2000). Die Präventionsarbeit des Deutschen Verkehrssicherheitsrates e.V. und seiner Mitglieder zum Thema Alkohol, Drogen und Medikamente im Straßenverkehr. In H.-P. Krüger (Ed.), Drogen im Straßenverkehr - ein Problem unter europäischer Perspektive (310-316). Freiburg im Breisgau: Lambertus-Verlag.
N Not relevant
20. Tay, R. (1999). Effectiveness of the anti drink driving advertising campaign in New Zealand. Road & Transport Research, 8(4), 3-15.
Y

Awareness raising and campaigns – Driving under the influence
21. Tay, R. (2001). Methodological issues in evaluation models: The New Zealand road safety advertising campaign revisited. Road & Transport Research 10(2), 29ff.
N Reported effect already covered in Tay (1999)
22. Tay, R. (2002). Exploring the Effects of a Road Safety Advertising Campaign on the Perceptions and Intentions of the Target and Nontarget Audiences to Drink and Drive. Traffic Injury Prevention, 3, 195-200.
N Reported effect already covered in Tay (1999)
23. Watson, B. & Nielson, A. (2008). An evaluation of the 'Skipper' designated driver program: Preliminary results. In High Risk Road Users Motivating Behaviour Change: what works and what doesn't work? Australasian College of Road Safety Annual Conference. Brisbane, 18-19 September 2008, 14 S.
Y
24. Whittam, K., Dwyer, W. & Simpson, P. (2006). Effectiveness of a media campaign to reduce traffic crashes involving young drivers. Journal of Applied Social Psychology, 36, 614–628.
N Studies to be considered in campaigns aggressive behaviour
25. U.S. Department of Transportation (2007). Evaluation of the National Impaired Driving High-Visibility Enforcement. Report No. DOT HS 810 789.
N No quantitative effects reported
26. Ramirez, R, Nguyen, D., Cannon, C., Carmona, M. & Freisthler, B. (2008). A Campaign to Reduce Impaired Driving Through Retail-Oriented Enforcement in Washington State. Demonstration Project Report.
N Not relevant
Awareness raising and campaigns – Driving under the influence
3.2 DESCRIPTION OF CODED STUDIES
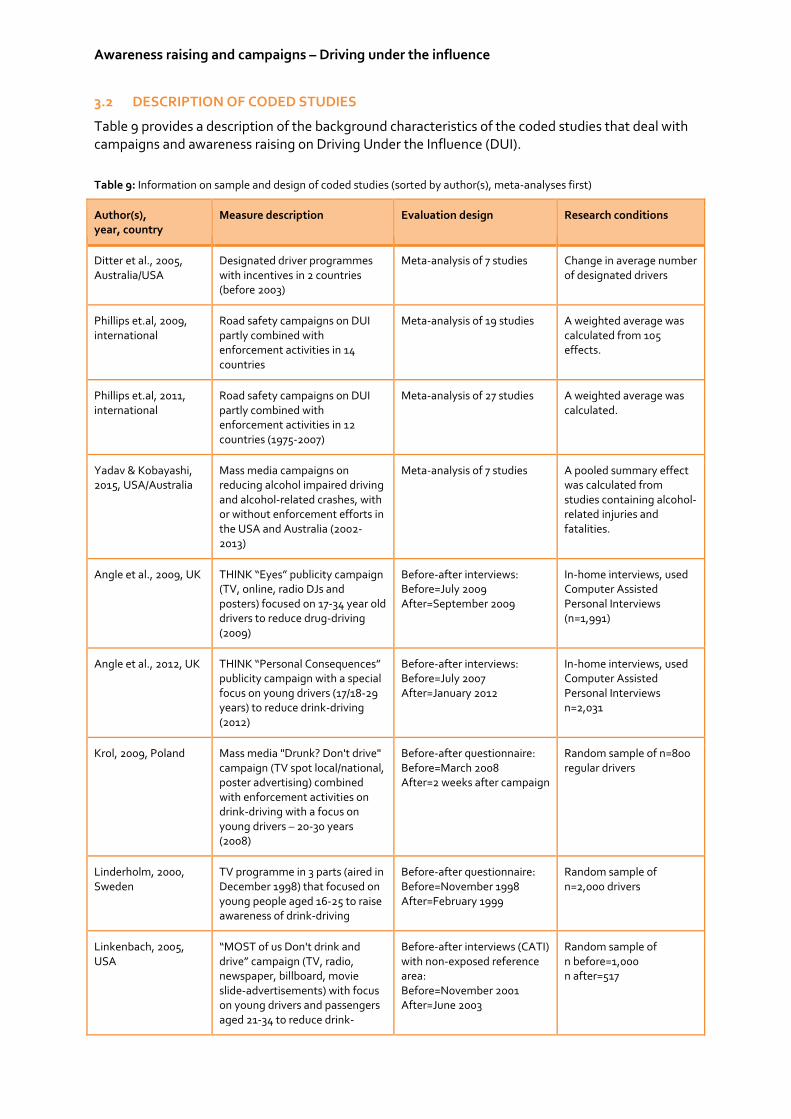
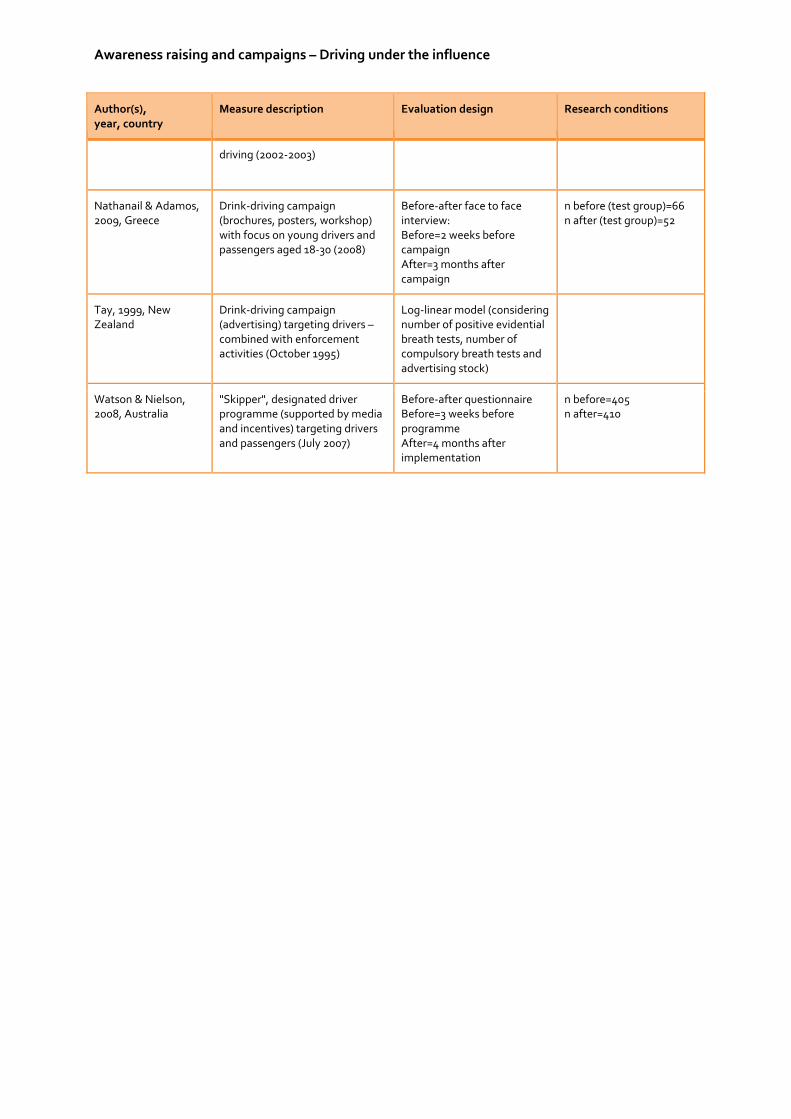
Table 9 provides a description of the background characteristics of the coded studies that deal with campaigns and awareness raising on Driving Under the Influence (DUI).
Table 9: Information on sample and design of coded studies (sorted by author(s), meta-analyses first)
Author(s), year, country
Measure description Evaluation design Research conditions
Ditter et al., 2005, Australia/USA
Designated driver programmes with incentives in 2 countries (before 2003)
Meta-analysis of 7 studies Change in average number of designated drivers
Phillips et.al, 2009, international
Road safety campaigns on DUI partly combined with enforcement activities in 14 countries
Meta-analysis of 19 studies A weighted average was calculated from 105 effects.
Phillips et.al, 2011, international
Road safety campaigns on DUI partly combined with enforcement activities in 12 countries (1975-2007)
Meta-analysis of 27 studies A weighted average was calculated.
Yadav & Kobayashi, 2015, USA/Australia
Mass media campaigns on reducing alcohol impaired driving and alcohol-related crashes, with or without enforcement efforts in the USA and Australia (2002-2013)
Meta-analysis of 7 studies A pooled summary effect was calculated from studies containing alcohol-related injuries and fatalities.
Angle et al., 2009, UK THINK “Eyes” publicity campaign (TV, online, radio DJs and posters) focused on 17-34 year old drivers to reduce drug-driving (2009)
Before-after interviews: Before=July 2009 After=September 2009
In-home interviews, used Computer Assisted Personal Interviews (n=1,991)
Angle et al., 2012, UK THINK “Personal Consequences” publicity campaign with a special focus on young drivers (17/18-29 years) to reduce drink-driving (2012)
Before-after interviews: Before=July 2007 After=January 2012
In-home interviews, used Computer Assisted Personal Interviews n=2,031
Krol, 2009, Poland Mass media "Drunk? Don't drive" campaign (TV spot local/national, poster advertising) combined with enforcement activities on drink-driving with a focus on young drivers – 20-30 years (2008)
Before-after questionnaire: Before=March 2008 After=2 weeks after campaign
Random sample of n=800 regular drivers
Linderholm, 2000, Sweden
TV programme in 3 parts (aired in December 1998) that focused on young people aged 16-25 to raise awareness of drink-driving
Before-after questionnaire: Before=November 1998 After=February 1999
Random sample of n=2,000 drivers
Linkenbach, 2005, USA
“MOST of us Don't drink and drive” campaign (TV, radio, newspaper, billboard, movie slide-advertisements) with focus on young drivers and passengers aged 21-34 to reduce drink-
Before-after interviews (CATI) with non-exposed reference area: Before=November 2001 After=June 2003
Random sample of n before=1,000 n after=517
Awareness raising and campaigns – Driving under the influence
Author(s), year, country
Measure description Evaluation design Research conditions
driving (2002-2003)
Nathanail & Adamos, 2009, Greece
Drink-driving campaign (brochures, posters, workshop) with focus on young drivers and passengers aged 18-30 (2008)
Before-after face to face interview: Before=2 weeks before campaign After=3 months after campaign
n before (test group)=66 n after (test group)=52
Tay, 1999, New Zealand
Drink-driving campaign (advertising) targeting drivers – combined with enforcement activities (October 1995)
Log-linear model (considering number of positive evidential breath tests, number of compulsory breath tests and advertising stock)
Watson & Nielson, 2008, Australia
"Skipper", designated driver programme (supported by media and incentives) targeting drivers and passengers (July 2007)
Before-after questionnaire Before=3 weeks before programme After=4 months after implementation
n before=405 n after=410
Awareness raising and campaigns – Driving under the influence
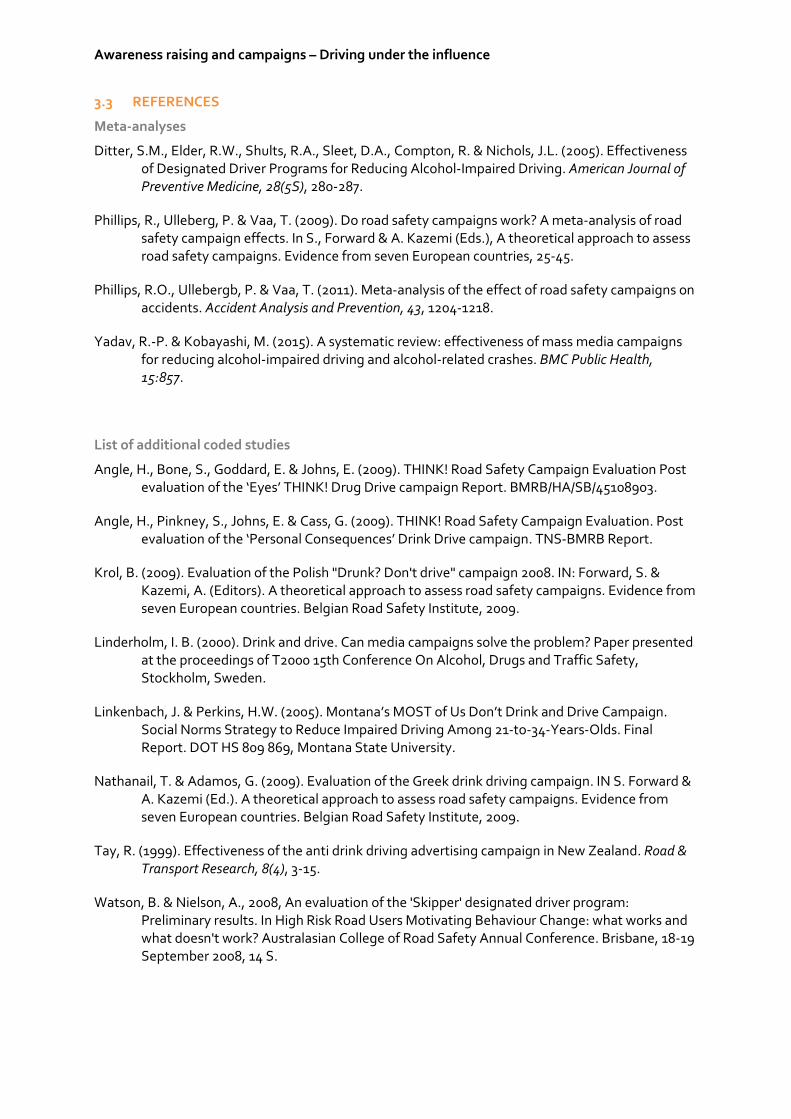
3.3 REFERENCES
Meta-analyses
Ditter, S.M., Elder, R.W., Shults, R.A., Sleet, D.A., Compton, R. & Nichols, J.L. (2005). Effectiveness of Designated Driver Programs for Reducing Alcohol-Impaired Driving. American Journal of Preventive Medicine, 28(5S), 280-287.
Phillips, R., Ulleberg, P. & Vaa, T. (2009). Do road safety campaigns work? A meta-analysis of road safety campaign effects. In S., Forward & A. Kazemi (Eds.), A theoretical approach to assess road safety campaigns. Evidence from seven European countries, 25-45.
Phillips, R.O., Ullebergb, P. & Vaa, T. (2011). Meta-analysis of the effect of road safety campaigns on accidents. Accident Analysis and Prevention, 43, 1204-1218.
Yadav, R.-P. & Kobayashi, M. (2015). A systematic review: effectiveness of mass media campaigns for reducing alcohol-impaired driving and alcohol-related crashes. BMC Public Health, 15:857.
List of additional coded studies
Angle, H., Bone, S., Goddard, E. & Johns, E. (2009). THINK! Road Safety Campaign Evaluation Post evaluation of the ‘Eyes’ THINK! Drug Drive campaign Report. BMRB/HA/SB/45108903.
Angle, H., Pinkney, S., Johns, E. & Cass, G. (2009). THINK! Road Safety Campaign Evaluation. Post evaluation of the ‘Personal Consequences’ Drink Drive campaign. TNS-BMRB Report.
Krol, B. (2009). Evaluation of the Polish "Drunk? Don't drive" campaign 2008. IN: Forward, S. & Kazemi, A. (Editors). A theoretical approach to assess road safety campaigns. Evidence from seven European countries. Belgian Road Safety Institute, 2009.
Linderholm, I. B. (2000). Drink and drive. Can media campaigns solve the problem? Paper presented at the proceedings of T2000 15th Conference On Alcohol, Drugs and Traffic Safety, Stockholm, Sweden.
Linkenbach, J. & Perkins, H.W. (2005). Montana’s MOST of Us Don’t Drink and Drive Campaign. Social Norms Strategy to Reduce Impaired Driving Among 21-to-34-Years-Olds. Final Report. DOT HS 809 869, Montana State University.
Nathanail, T. & Adamos, G. (2009). Evaluation of the Greek drink driving campaign. IN S. Forward & A. Kazemi (Ed.). A theoretical approach to assess road safety campaigns. Evidence from seven European countries. Belgian Road Safety Institute, 2009.
Tay, R. (1999). Effectiveness of the anti drink driving advertising campaign in New Zealand. Road & Transport Research, 8(4), 3-15.
Watson, B. & Nielson, A., 2008, An evaluation of the 'Skipper' designated driver program: Preliminary results. In High Risk Road Users Motivating Behaviour Change: what works and what doesn't work? Australasian College of Road Safety Annual Conference. Brisbane, 18-19 September 2008, 14 S.
Awareness raising and campaigns – Driving under the influence
List of studies included in Ditter et al., 2005
Boots, K. & Midford, R. (1999). “Pick-a-Skipper”: an evaluation of a designated driver program to prevent alcohol-related injury in a regional Australian city. Health Promotion International, 14, 337-45.
Brigham, T., Meier, S. & Goodner, V. (1995). Increasing designated driving with a program of prompts and incentives. Journal of Applied Behavior Analysis, 1928, 83-94.
Simons-Morton, B. & Cummings, S. (1997). Evaluation of a local designated driver and responsible server program to prevent drinking and driving (Study 1-3). Journal of Drug Education, 27, 321-33.
Meier, S., Brigham, T. & Gilbert, B. (1998). Analyzing methods for increasing designated driving. Journal of Prevention & Intervention in the Community, 17, 1-14.
Boots K. (1994). The designated driver program: an outcome evaluation. Health Promotion Journal of Australia, 4, 26-9.
List of studies included in Phillips et al., 2009
Agent K.R., Green E.R. & Langley R.E. (2002). Evaluation of Kentucky's "You Drink and Drive. You Lose." Campaign. KTC-02-28/KSP1-02-2F University of Kentucky College of Engineering, Kentucky Transportation Center. Kentucky, USA.
Baldcock M.R.J.&.Bailey T.J. (1997). Random breath testing in South Australia: operation and effectiveness, 1996. 3/97 Office of Road Safety, Adelaïde.
Blomberg R.D., Preusser D.F. & Ulmer R.G. (1987). Deterrent effects of mandatory license suspension for DWI conviction. National Highway Traffic Safety Administration. DOT HS 807 138 US Department of Transportation. US.
Boughton C.J., South D.R. (1985). Evaluation of a drink driving publicity campaign. In Proceedings, 9th International Conference on Drugs and Traffic Safety, San Juan, Puerto Rico, 1983.
Elliott B. & South D.R. (1983).The development and assessment of a drinkdriving campaign: a case study. CR26 Australian Office of Road Safety.
Harrison W. (1989). Evaluation of a publicity and enforcement campaign to breath test any drivers detected speeding at night. GR/89/06 Road Traffic Authority, Victoria.
Homel R., Carseldine D. & Kearns I. (1988). Drink-driving countermeasures in Australia. Alcohol, Drugs and Driving, 4, 113-144.
Illinois Department of Transportation. (2007). Evaluation of the 2006 Labor Day You Drink & Drive. You Lose. Campaign. July 24 – September 17, 2006. Technical Report, February 2007.
McCaul K.A. & McLean A.J. (1990). Publicity, police resources and the effectiveness of random breath testing. Medical Journal of Australia, 152, 284-286.
McLean A.J., Kloeden C.N., McCaul K.A. (1991). Drink-driving in the general night-time driving population, Adelaide 1989.
Awareness raising and campaigns – Driving under the influence
Mercer G.W., Cooper P.J. & Kristiansen L. (1996). A cost/benefit analysis of a 5 month intensive alcohol-impaired driving road check campaign. 40th Annual Proceedings of the Association for the Advancement of Automotive Medicine, October 7-9, 1996, Vancouver, B.C: pp. 283-292.
Murry J.P., Stam A. & Lastovicka J.L. (1993). Evaluating an anti-drinking and driving advertising campaign with a sample survey and time series intervention analysis. American Statistical Association, 88, 50-56.
Rydgren, H. (1981). Resultat från för -och eftermätning i samband med information i Örebro län om användning av baksätesbälten. Accessed via CAST partner Per Henriksson using structured questionnaire.
Strand, L.-G. (2000). Alkohol och bilkörning. Undersökning om ungdomar i Skåne 1994 och 1999. Accessed via CAST partner Per Henriksson using structured questionnaire.
Törnos, J. (1995). Intensifierad övervakning med utandningsprov. Försök i södra Sverige. 746 - 1995 Väg- och transport-forsikningsinstitutet. Linköping, Sweden.
Wells J.K., Preusser D.F. & Williams A.F. (1992). Enforcing alcohol-impaired driving and seat belt use laws, Binghamton, NY. Journal of Safety Research, 23, 63-71.
Williams A.F., Preusser D.F., Blomberg R.D. & Lund A.K. (1987). Seat belt use law enforcement and publicity in Elmira, New York: a reminder campaign. American Journal of Public Health, 77, 1450-1451.
Wolfe A.C. (1983). Interim (two-year) evaluation report on the Oakland County alcohol enforcement / education project. UMTRI-63-12 University of Michigan Transport Research Institute. MI, USA.
Worden J.K., Waller J.A. & Riley T.J. (1987). The Vermont public education campaign in alcohol and highway safety: a final review and evaluation. Accident Analysis and Prevention, 19, 285-303.
List of studies included in Phillips et al., 2011
The cited authors did not indicate which of the meta-analysed studies correspond to the effect calculated for DUI.
List of studies included in Yadav et al., 2015
Agent, K.R., Green, E.R. & Langley, R.E. (2002). Evaluation of Kentucky’s “You Drink and Drive. You Lose” Campaign. Report, p.31.
Beck, K.H. (2009). Lessons learned from evaluating Maryland’s anti-drunk driving campaign: assessing the evidence for cognitive, behavioral, and public health impact. Health Promot Pract., 10, 370-377.
Epperlein, T. (1987). Initial deterrent effects of the crackdown on drinking drivers in the state of Arizona. Accident Analysis Prevention, 19, 285-303.
Jones, R., Rodriguez-Iglesias, C. & Cyr, E. (2005). Evaluation of Pueblo County. Springfield: Colorado’s Smart Roads Project.
Awareness raising and campaigns – Driving under the influence
Murry, J., Stam, A. & Lastovicka, J.L. (1993). Evaluating an anti-drinking and driving advertising campaign with a sample survey and time series intervention analysis. Journal of American Statistical Association, 88, 50-56.
Newstead, S., Cameron, M., Gantzer, S. & Vulcan, P. (1995). Modelling of some major factors influencing road trauma trends in Victoria, 1989-93. Monash University.
Solomon, M.G., Hedlund, J., Haire, E. & Chaffe, R.H.B. (2008). The 2006 National Labor Day impaired driving enforcement crackdown: drunk driving. Over limit. Under arrest. Washington DC.
References on further background information (sorted by authors)
Castillo-Manzano, J., Castro-Nuno, M. & Pedregal, D. (2012). How many lives can bloody and shocking road safety advertising save? Transportation Research Part F, 15, 174-187.
Delhomme, P., De Dobbeleer, W., Forward, S. & Simoes, A. (Eds.) (2009). Manual for Designing, Implementing, and Evaluating Road Safety Communication Campaigns. EU-Project CAST. Belgium 2009.
Hoekstra, T. & Wegmann, F. (2012). Improving the effectiveness of road safety campaigns: Current and new practices. IATSS Research, 34, 80-86.
Phillips, R., Ulleberg, P. & Vaa, T. (2011): Meta-analysis of the effect of road safety campaigns on accidents. Accident Analysis and Prevention, 43, 1204–1218.
Robertson, R.D. & Pashley, C.R. (2015). Road safety campaigns – what the research tells us. Traffic Injury Reserach Foundation, Ottawa, Canada.
Theofilatos, A., Aigner-Breuss, E., Kaiser, S., Alfonsi, R., Braun, E., Eichhorn, A. et al. (2017), Identification and Safety Effects of Road User Related Measures, Deliverable 4.2 of the H2020 project SafetyCube.
Vaa T., Assum, T., Ulleberg, P. & Veisten, K. (2004). Effekter av informasjonskampanjer på atferd og trafikkulykker - forutsetninger, evaluering og kostnadseffektivitet. TØI Rapport. 727/2004 Institute of Transport Economics. Oslo.