The Science of Color, Light and Shade Selection Presented by Lisa Fedor James D.D.S.

AD_________________
Award Number: W81XWH-12-1-0434
TITLE: Sensitivity of retinal ganglion cell photoreceptors in traumatic brain injury patients with photophobia
PRINCIPAL INVESTIGATOR: Andrew T.E. Hartwick
CONTRACTING ORGANIZATION: Ohio State University Columbus, OH 43210
REPORT DATE: November 2015
TYPE OF REPORT: Final
PREPARED FOR: U.S. Army Medical Research and Materiel Command Fort Detrick, Maryland 21702-5012
DISTRIBUTION STATEMENT: Approved for Public Release; Distribution Unlimited
The views, opinions and/or findings contained in this report are those of the author(s) and should not be construed as an official Department of the Army position, policy or decision unless so designated by other documentation.
REPORT DOCUMENTATION PAGE Form Approved
OMB No. 0704-0188 Public reporting burden for this collection of information is estimated to average 1 hour per response, including the time for reviewing instructions, searching existing data sources, gathering and maintaining the data needed, and completing and reviewing this collection of information. Send comments regarding this burden estimate or any other aspect of this collection of information, including suggestions for reducing this burden to Department of Defense, Washington Headquarters Services, Directorate for Information Operations and Reports (0704-0188), 1215 Jefferson Davis Highway, Suite 1204, Arlington, VA 22202-4302. Respondents should be aware that notwithstanding any other provision of law, no person shall be subject to any penalty for failing to comply with a collection of information if it does not display a currently valid OMB control number. PLEASE DO NOT RETURN YOUR FORM TO THE ABOVE ADDRESS. 1. REPORT DATENovember 2015
2. REPORT TYPEFinal
3. DATES COVERED1Sep2012 - 31Aug2015
4. TITLE AND SUBTITLESensitivity of retinal ganglion cell photoreceptors in traumatic brain
5a. CONTRACT NUMBER W81XWH-12-1-0434
injury patients with photophobia 5b. GRANT NUMBER Proposal #11262024 5c. PROGRAM ELEMENT NUMBER
6. AUTHOR(S)Andrew T.E. Hartwick Betty Diamond
5d. PROJECT NUMBER
5e. TASK NUMBER
E-Mail: [email protected]
5f. WORK UNIT NUMBER
7. PERFORMING ORGANIZATION NAME(S) AND ADDRESS(ES) 8. PERFORMING ORGANIZATION REPORTNUMBER
Ohio State University1960 Kenny RdColumbus OH 43210-1016
9. SPONSORING / MONITORING AGENCY NAME(S) AND ADDRESS(ES) 10. SPONSOR/MONITOR’S ACRONYM(S)U.S. Army Medical Research and Materiel Command Fort Detrick, Maryland 21702-5012
11. SPONSOR/MONITOR’S REPORTNUMBER(S)
12. DISTRIBUTION / AVAILABILITY STATEMENTApproved for Public Release; Distribution Unlimited
13. SUPPLEMENTARY NOTES
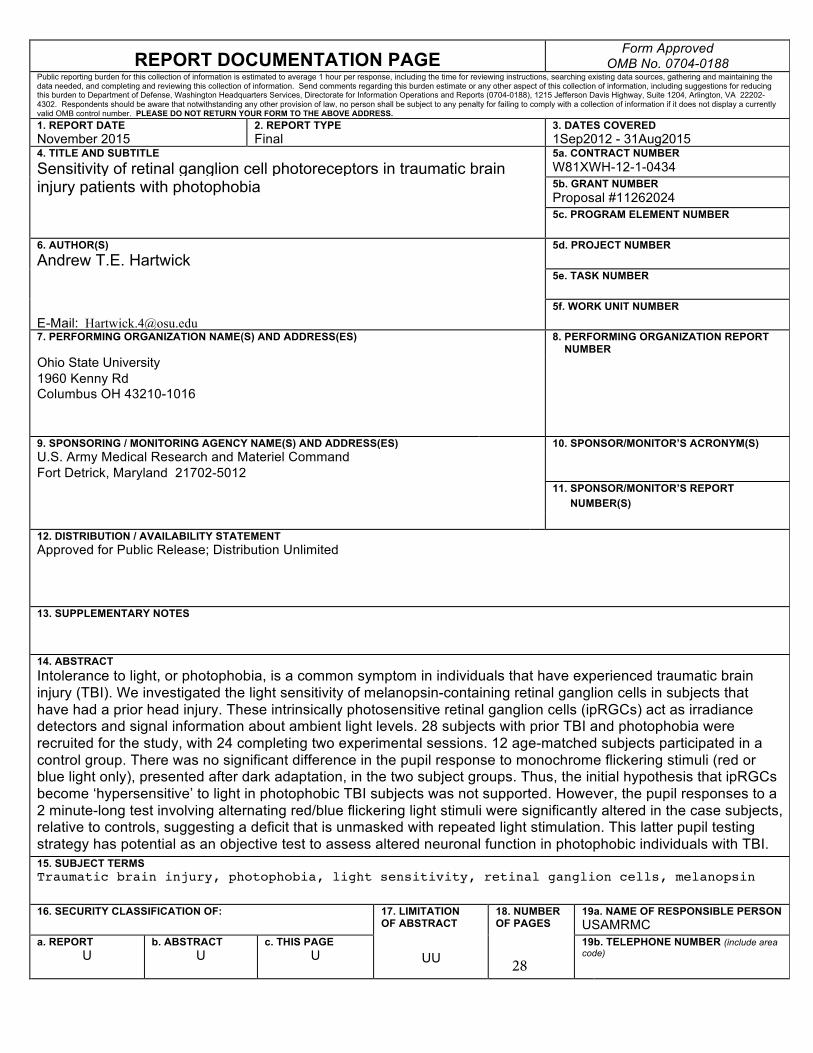
14. ABSTRACTIntolerance to light, or photophobia, is a common symptom in individuals that have experienced traumatic brain injury (TBI). We investigated the light sensitivity of melanopsin-containing retinal ganglion cells in subjects that have had a prior head injury. These intrinsically photosensitive retinal ganglion cells (ipRGCs) act as irradiance detectors and signal information about ambient light levels. 28 subjects with prior TBI and photophobia were recruited for the study, with 24 completing two experimental sessions. 12 age-matched subjects participated in a control group. There was no significant difference in the pupil response to monochrome flickering stimuli (red or blue light only), presented after dark adaptation, in the two subject groups. Thus, the initial hypothesis that ipRGCs become ‘hypersensitive’ to light in photophobic TBI subjects was not supported. However, the pupil responses to a 2 minute-long test involving alternating red/blue flickering light stimuli were significantly altered in the case subjects, relative to controls, suggesting a deficit that is unmasked with repeated light stimulation. This latter pupil testing strategy has potential as an objective test to assess altered neuronal function in photophobic individuals with TBI. 15. SUBJECT TERMSTraumatic brain injury, photophobia, light sensitivity, retinal ganglion cells, melanopsin
16. SECURITY CLASSIFICATION OF: 17. LIMITATIONOF ABSTRACT
18. NUMBEROF PAGES
19a. NAME OF RESPONSIBLE PERSON USAMRMC
a. REPORTU
b. ABSTRACTU
c. THIS PAGEU UU
19b. TELEPHONE NUMBER (include area code)
28

Hartwick; W81XWH-12-1-0434 3
TABLE OF CONTENTS
Cover 1
Form 298 2
Table of Contents 3
Introduction 4
Keywords 4
Key Accomplishments 4
Summary of Research Results 5
1) ipRGCs are not ‘hypersensitive’ to light in TBI subjects with photophobia 5
2) Altered adaptation of pupil responses in photophobic individuals with TBI 11
3) Grading video-recorded light aversion responses by masked observers 19
Overall Conclusions 27
Impact 27
Products 27
Participants 28

Hartwick; W81XWH-12-1-0434 4
Introduction:
Intolerance to light, or photophobia, is a common symptom in individuals that have experienced traumatic brain injury (TBI). In this work, we investigated the light sensitivity of melanopsin-containing retinal ganglion cells in subjects that have had a prior head injury. These intrinsically photosensitive retinal ganglion cells (ipRGCs) act as irradiance detectors, providing the brain with information regarding the amount of light present in the environment. ipRGCs are particularly sensitive to blue light and their responses typically persist for many seconds after light stimulation. Thus, their function can be assessed by monitoring the sustained pupil constriction that occurs after stimulation with a relatively bright blue light, relative to that for comparable red light.
Our guiding hypothesis for this research was that ipRGCs respond to dimmer light levels in TBI patients and this contributes to the photophobia experienced by these individuals. We recruited subjects with photophobia due to prior TBI and subjects to serve as age-matched controls and measured their pupil response to flickering red and blue light. The research has practical implications for the U.S. Army because, in addition to establishing a role for ipRGCs in the neural circuitry that mediates photophobia, the pupil testing strategies tested in this proposal could be used as an objective test to quantify photophobia in veterans that have suffered a TBI. This work should also stimulate future investigations into therapeutic interventions that restore ipRGC function as a potential therapy for photophobia.
Keywords:
Traumatic brain injury (TBI); photophobia; light sensitivity; intrinsically photosensitive retinal ganglion cell (ipRGC); melanopsin; pupillary light reflex; pupil; circadian rhythms
Key Accomplishments:
• Primary study: “The Head Injury-associated Photosensitivity and Pupillary function (HIPP)study” approved by OSU Institutional Review Board and then DoD HRPO in Aug, 2013
• Poster on preliminary pilot study, entitled “Correlation of observer-graded light sensitivityto pupil responses in healthy subjects stimulated with red and blue flickering light”, presented at American Academy of Optometry meeting in Seattle WA, Oct 2013
• Oral paper on portion of initial results from the HIPP Study, entitled “Altered adaptation ofthe pupillary light reflex in photophobic individuals with traumatic brain injury”, presented at the American Academy of Optometry meeting in Denver CO, Nov 2014
• Oral paper on portion of initial results from the HIPP Study, entitled “Assessment ofipRGC-mediated pupil constriction in photophobic individuals with traumatic brain injury”, presented at the American Academy of Optometry meeting in Denver CO, Nov 2014
• Invited speaker at AEVR-sponsored Congressional Briefing on deployment-related visiontrauma research on Capitol Hill, Washington DC. Presented seminar entitled ‘Understanding light sensitivity in patients with traumatic brain injury (TBI), Mar 2015
• Poster on updated results from the HIPP Study, entitled “Blue and red light-evoked pupilresponses in photophobic individuals with traumatic brain injury” presented at the Association for Research in Vision & Ophthalmology meeting in Denver CO, May 2015

Hartwick; W81XWH-12-1-0434 5
• Invited speaker in special keynote session entitled ‘Ezell Fellows Present: TacklingTraumatic Brain Injury’ at American Academy of Optometry meeting in New Orleans LA; presented summary of results from HIPP Study, Oct 2015
• Poster on final results from the HIPP Study, entitled “Altered adaptation of the pupillarylight reflex and sleep irregularity in photophobic individuals with TBI” at the Association for Research in Vision & Ophthalmology meeting in Seattle WA, May 2016
• Invited speaker in special session entitled “Vision and Traumatic Brain Injury: The Outlookfor Therapeutics” at the Association for Research in Vision & Ophthalmology meeting in Denver CO, May 2016
• Manuscript on findings of HIPP study was submitted to Optometry & Vision Science forpublication in a feature issue on “Eye and Vision Changes from Head Trauma”. The paper, entitled “Blue and red light-evoked pupil responses in photophobic subjects with TBI” required minor revisions and was re-submitted in Apr 2016. This paper contains the findings relevant to the primary hypothesis of this study on ipRGC light sensitivity
• Second manuscript on findings of HIPP study, entitled “Altered adaptation of the pupillarylight reflex in photophobic individuals with traumatic brain injury” is nearing completion. This paper will focus on the finding that pupil responses to repeated red/blue alternating light stimuli are altered in TBI subjects with photophobia, relative to controls
Summary of Research Results:
1) ipRGCs are not ‘hypersensitive’ to light in TBI subjects with photophobia
Pupose: Photophobia is a common symptom in individuals suffering from traumatic braininjury. Recent evidence has implicated blue light-sensitive ipRGCs in contributing to theneural circuitry mediating photophobia in migraine sufferers. The goal of this work was totest the hypothesis that ipRGC light sensitivity is increased (i.e. ipRGCs become‘hypersensitive’ to light after the injury) in TBI patients with photophobia by assessingpupillary responses to blue and red light.
Methods: 28 case subjects (mean age 43.3; 58% female), with mild TBI and self-reportedphotophobia, and 12 control subjects (mean age 42.6; 58% female) were recruited for thisstudy (Table 1). All participants were given a comprehensive eye exam to rule out clinicallydetectable ocular pathology. Case subjects had to score a 2 or 3 on the OSU-TBI ID survey,indicating likely mild TBI, while controls scored 0 or 1. There were no significant differencesin ocular findings between the two subject groups but the case group was taking moreprescribed medications (Table 2). The case subjects had a range of underlying TBIetiologies (Table 3) and the last injury had to have occurred >6 months prior. 24 of the 28case subjects were eligible to return for a second study visit (Table 3).
With 10 min dark adaptation before each trial, two trials involving monochrome blue (470nm, 1x10¹³ phots/s/cm2) and red (625 nm, 7x10¹³ phots/s/cm2) flashing (0.1 Hz) light stimuliwere delivered for 30 s (3 light pulses) to the dilated left eye while the right pupil wasrecorded. The stimuli were LED-generated using a custom pupillometer. The amplitude ofpupil fluctuation (constriction and dilation) was quantified with fast Fourier transforms.

Hartwick; W81XWH-12-1-0434
6
Cases Controls p-value
Age (years) 43.3 (2.34) 42.6 (4.46) 0.87 Sex (percent female) 58.3% F 58.3% F 0.56 Ethnicity 0.63 Caucasian 75% 67% African American 17% 17% Native American 8% 16% Refractive error (D) OD (spherical equivalent)
-0.94 (0.35) -1.42 (0.76) 0.93
OS (spherical equivalent)
-1.03 (0.35) -1.30 (0.74) 0.81
Cover Test (Δ; + is exo) Distance 0.42 (0.29) 0.67 (0.45) 0.52 Near 4.71 (1.31) 3.75 (1.51) 0.66 Optic Nerve (C/D ratio) OD 0.28 (0.02) 0.29 (0.03) 0.60 OS 0.26 (0.02) 0.29 (0.03) 0.26
Table 1. Demographics of case and control subjects. Age, visual acuity, refractive error, cover test, and optic nerve cup-to-disk (C/D) ratio values are means (SEM). These values were compared using Mann-Whitney rank sum tests. Sex and ethnicity are represented as percent of cohort and these values were compared using Chi-squared tests.
Medication Class Cases Controls
Analgesic 12 (50) 1 (8) Anti-diabetic 1 (4) 1 (8) Anti-infective 4 (17) 0 (0) Anti-rheumatic 1 (4) 0 (0) Cardiovascular 10 (42) 2 (17) CNS/Mental health 18 (75) 2 (17) Digestive 9 (38) 0 (0) No medication 1 (4) 2 (17) Nutritional supplement 4 (17) 3 (25) Reproductive/Hormone 7 (29) 1 (8) Respiratory 7 (29) 4 (33) Sleep aid 6 (25) 0 (0)
Table 2. Medications prescribed to the case and control subjects during the study. Values represent the number of subjects taking at least one medication in the designated class, with percent of the cohort in parentheses.

Hartwick; W81XWH-12-1-0434
7
Subject Number of Reported TBIs Cause of Most Recent TBI OSU TBI-ID Short
Form Score 101ǂ 1 MVA 5 102ǂ 3 MVA 3 103+ 1 Strike/blow to head 2 104 4 Fall 3 105 3 Fall 3
106ǂ 3 Assault 5 107 5 MVA 3 108 1 Athletics 2 109 1 Fall 2 110 1 MVA 3 111 1 Strike/blow to head 3 112 2 MVA 2
113ǂ 1 Strike/blow to head 3 114 12 Strike/blow to head 3 115 8 Strike/blow to head 3 116 2 Strike/blow to head 2 117 7 MVA 3 118 3 Fall 3 119 4 MVA 3 120 5 Fall 3 121 4 Strike/blow to head 3
122+ 4 Strike/blow to head 3 123 4 Assault 3 124 2 Strike/blow to head 3 125 1 Blast injury 3 126 3 Strike/blow to head 3 127 7 Strike/blow to head 2 128 2 Fall 2
Table 3. Head injury history of case subjects. OSU TBI-ID score of 0 = no TBI; 1 = improbable TBI; 2 = mild TBI (no loss of consciousness); 3 = mild TBI (loss of consciousness); 4 = moderate TBI; 5 = severe TBI. All control subjects scored 0 or 1 on OSU TBI-ID. ǂ Due to inclusion/exclusion criteria, these subjects did not participate in the second session for pupil testing. + Unable to complete pupil testing protocol (blepharospasm, head withdrawal from instrument). Motor vehicle accident (MVA).

Hartwick; W81XWH-12-1-0434 8
Results: All case subjects had mild TBI based on the OSU-TBI ID survey, and their responses to the photophobic symptom questionnaire were significantly (P<0.01) higher than controls (Figure 1).
Figure 1. Survey of the effect of photophobia on daily activities of subjects. At both study visits, case (n=24) and control (n=12) subjects were read 6 statements and asked to reply whether each situation applied to them never, sometimes, occasionally, frequently or always. These answers were given grades 0 to 4, respectively. The responses to all 6 statements from the case subjects were significantly higher than those for the control subjects. ** P < 0.01; One-Way ANOVA, Holm-Sidak post-hoc test.
Macular pigment optical density (MPOD) has been implicated in glare sensitivity, but there was no significant difference in this variable between the two subject groups. Thus, differences in MPOD were unlikely to have significantly contributed to the increased photosensitivity experienced by the TBI subjects.
Figure 2. Macular pigment optical density (MPOD) measurements in subject groups. At both study visits, MPOD was measured in case (n=24) and control (n=12) subjects using a commercial device (Quantifeye) that tests heterochromatic flicker sensitivity.

Hartwick; W81XWH-12-1-0434 9
In response to the flashing light stimuli, the amplitude of pupil fluctuation was significantly less for the blue light stimuli as compared to the red light stimuli. This smaller amplitude for the blue light stimuli is consistent with a contribution of ipRGCs to these pupil responses. In between-group comparisons, there was no significant difference in the mean pupil fluctuation amplitudes between the two subject groups (Figure 3). Thus, this data does not support the hypothesis that ipRGCs are more sensitive to light in TBI patients with photophobia.
Figure 3. Pupil responses to flashes of red or blue light in subject groups. A) Traces of mean (± SEM) pupil size (normalized; 100% = smallest measured pupil area in experimental session, and 0% = baseline pupil area) elicited by 3 pulses of blue or red light (bars at top indicate light was on) flashed at 0.1 Hz in case (n=22) and B) control subjects (n=12). The blue light stimuli had an irradiance of 1x10¹³ photons/s/cm2 and the red light stimuli had irradiances of 7x10¹³ photons/s/cm2. C) Same traces with the data for the blue and D) red light stimuli for the two subject groups plotted together to aid comparison. E) Mean (± SEM) amplitude of the fluctuation (at 0.1 Hz) in the pupil responses to the flickering lights, as determined by fast Fourier transforms (FFT) of the data. ** P < 0.01, NS = not significant. Intra-group comparisons with paired T-tests and inter-group comparisons with T-tests.
While the grouped mean data was not significantly different between the two subject groups,

Hartwick; W81XWH-12-1-0434 10
closer inspection of the individual pupil trace data revealed that there was considerable variability in the TBI subject group. This is apparent by examining the collection of individual traces and the width of the area between ±2 standard deviations from the mean pupil size during the trials (Figure 4).
Figure 4. Inter-individual variability of the pupil responses. A) Each red and B) blue trace represents traces of normalized pupil responses evoked by red and blue light stimuli, respectively, in individual case subjects. C) Similar traces of responses to red and D) blue light stimuli in individual control subjects. Solid black lines in A-D) represent mean data shown in Figure 3. Dotted black lines signify two standard deviations from the mean data. Note the higher variability in the data for the case subjects. E) The inter-individual variation was further quantified by measuring the absolute difference (in % pupil constriction) between each individual trace and the mean data at each time-point. The mean sum difference (± SEM) per individual is plotted. ** P < 0.01, NS = not significant. Inter-group comparisons with T-tests.

Hartwick; W81XWH-12-1-0434 11
Conclusions: Case and control subjects showed robust ipRGC-mediated components in their pupil responses to blue light. There was no difference in these responses between the two subjects groups, and so the results did not support the hypothesis that ipRGCs are 'hypersensitive' to light in TBI subjects with photophobia. However, greater pupil response variability in the case subjects suggests that ipRGC function may be more heterogeneous in this group. A more sophisticated stimulus (see next section) may be necessary to better isolate and classify normal from abnormal ipRGC input in the pupillary light response.
2) Altered adaptation of the pupillary light reflex in photophobic individuals with TBI
Purpose: While the pupil responses to flashing monochrome blue and red stimuli were not significantly altered in the TBI subjects with photophobia (see first Summary above), we also assessed pupil responses to a longer duration (2 minutes) red/blue alternating flashing light stimulus. We have observed that enhanced pupil constriction can occur over time in response to alternating stimuli, an effect we have termed ‘photopotentiation’. The goal of this work was to examine whether this adaptive pupillary response is altered in individuals with persistent photosensitivity after mild traumatic brain injury.
Methods: In these experiments, a commercial pupillometer (RAPDx; Konan, USA) was employed. The instrument was capable of recording infrared-illuminated images of the pupil at approximately 40 Hz, with automatic gaze tracking. All stimuli consisted of either red or blue light, with measured corneal irradiances of 2.58 x 10¹² (peak: 608 nm) and 2.70 x 10¹² (peak: 448 nm) photons/s/cm2 respectively (Figure 5), as measured with a spectroradiometer (PR-670; Photoresearch). These irradiances are near threshold for the melanopsin-driven intrinsic response of ipRGCs.
Figure 5. Corneal irradiance at maximum brightness, as measured with spectroradiometer (PR-670; Photoresearch), and spectral spread of blue and red stimuli generated by the RAPDx pupillometer.
24 subjects with TBI-associated photophobia and 12 control subjects completed both sessions for the study. Details on these subjects can be found in Tables 1 to 3 earlier in this report. Stimuli were either presented monocularly with simultaneous recording of the

Hartwick; W81XWH-12-1-0434
12
contralateral pupil response, or binocularly with simultaneous recordings of both pupils. In the former case, all stimuli involved alternating red and blue lights that were provided to the left eye with a pharmacologically-dilated pupil. For the binocular tests, the subjects’ pupils were not pharmacologically dilated. The light stimulus consisted of alternating red and blue lights presented at a flicker rate of 0.1 Hz (5 seconds on, 5 seconds off) for 2 min. A custom macro-based data analysis template was constructed in Microsoft Excel to automate much of the data processing. For bilateral tests, outcome measures for the OD and OS were averaged together since the direct and consensual pupil responses are essentially identical in humans. To evaluate photopotentiation, an enhancement of pupil constriction during the test, all tests were divided into six periods, and the average pupil constriction (APC) occurring during each period was calculated. The difference in APC between the first and last (6th) period (∆APC1→6) was determined (see Figure 6).
Figure 6. Average Pupil Constriction (APC) was calculated for each 20 s period (bars labeled APC1 through APC6), and the difference between APC for the first and last periods was the primary outcome measure. Fourier analysis-derived amplitudes and decay constants for rate of re-dilation were also measured but are not included in this report.
Subjects were seen on 2 separate visits, separated by approximately 2 weeks (Figure 7). On the first visit, after consent and in cases, prior to the comprehensive eye examination, acuities were measured and the ALT #1 test was administered with no dark adaptation period preceding the test. At the second visit, the subjects were dark adapted for 5 minutes, and the ALT #2 test was administered (which was identical to ALT #1, with the addition of dark adaptation prior to testing). For ALT #1 and #2 tests the light stimuli (as shown in Figure 6) were delivered binocularly to the undilated eyes. Each subject then had their left eyes dilated and patched, and were dark adapted for 30 minutes. The FULL, DISC, and RING tests (see Table 4) were then administered with 5 minutes of dark adaptation between each test. The lights were presented in the dilated eye only, and the consensual pupil response was captured for analysis. During the 2 weeks between the 1st and 2nd pupillometry visits, subjects wore a watch that measured their light exposure and daily

Hartwick; W81XWH-12-1-0434 13
activity patterns. Activity data was used to assess measures of sleep quality.
Figure 7. Flowchart showing order of pupil testing strategies using the RAPDx pupillometer.
Table 4. Spatial characteristics of light stimuli used in FULL, DISC and RING monocular pupil testing strategies. The FULL light was also used in the binocular ALT #1 and ALT #2 testing strategies.

Hartwick; W81XWH-12-1-0434
14
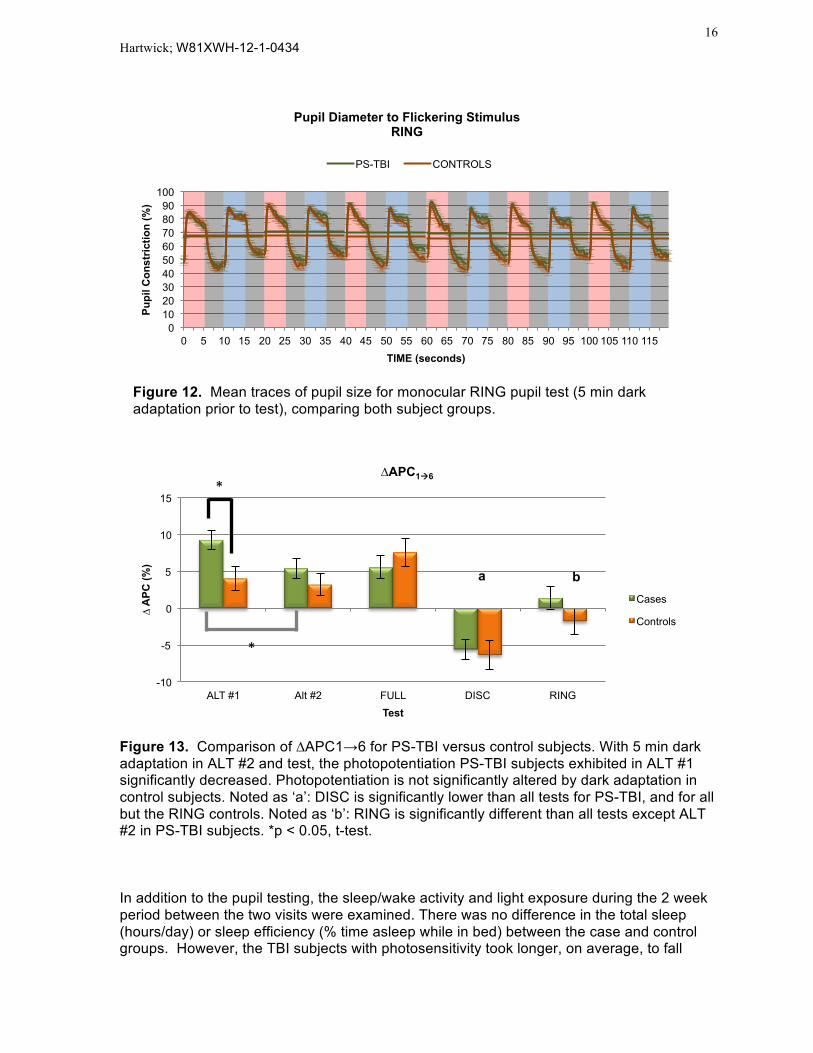
Results: In the light adapted test involving binocular stimulation, (ALT #1, Figure 8), PS-TBI subjects had a significantly higher ∆APC1→6 than the control subjects (p = 0.022, t-test) (Figure 13). When the same test was preceded by 5 minutes of dark adaptation, there was no significant difference in the values for ∆APC1→6 between the two subject groups (Figures 9, 13). For the monocular (light applied to dilated left eye) FULL (Figure 10), DISC (Figure 11), and RING (Figure 12) tests, there were no differences between cases and controls for any of the outcome measures (Figure 13).
Figure 8. Mean traces of pupil size for binocular ALT #1 pupil test (no dark adaptation prior to test), comparing both subject groups. Note that the average pupil constriction (APC1) starts lower for PS-TBI subjects than the controls, but it finishes higher (APC6). Thus, the photopotentiation is enhanced in the PS-TBI subjects.
Figure 9. Mean traces of pupil size for binocular ALT #2 pupil test (5 min dark adaptation prior to test), comparing both subject groups.
0 10 20 30 40 50 60 70 80 90
100
0 5 10 15 20 25 30 35 40 45 50 55 60 65 70 75 80 85 90 95 100 105 110 115
Pupi
l Con
stric
tion
(%)
TIME (seconds)
Pupil Diameter to Flickering Stimulus ALT #1 (No Dark Adaptation)
PS-TBI CONTROLS
0 10 20 30 40 50 60 70 80 90
100
0 5 10 15 20 25 30 35 40 45 50 55 60 65 70 75 80 85 90 95 100 105 110 115
Pupi
l Con
stric
tion
(%)
TIME (seconds)
Pupil Diameter to Flickering Stimulus ALT #2 (5 min of Dark Adaptation)
PS-TBI CONTROLS

Hartwick; W81XWH-12-1-0434
15
Figure 10. Mean traces of pupil size for monocular FULL pupil test (30 min dark adaptation prior to test), comparing both subject groups.
Figure 11. Mean traces of pupil size for monocular DISC pupil test (5 min dark adaptation prior to test), comparing both subject groups.
0 10 20 30 40 50 60 70 80 90
100
0 5 10 15 20 25 30 35 40 45 50 55 60 65 70 75 80 85 90 95 100 105 110 115
Pupi
l Con
stric
tion
(%)
TIME (seconds)
Pupil Diameter to Flickering Stimulus FULL (30 min Dark Adaptation)
PS-TBI CONTROLS
0 10 20 30 40 50 60 70 80 90
100
0 5 10 15 20 25 30 35 40 45 50 55 60 65 70 75 80 85 90 95 100 105 110 115
Pupi
l Con
stric
tion
(%)
TIME (seconds)
Pupil Diameter to Flickering Stimulus DISC
PS-TBI CONTROLS
Hartwick; W81XWH-12-1-0434
16
Figure 12. Mean traces of pupil size for monocular RING pupil test (5 min dark adaptation prior to test), comparing both subject groups.
Figure 13. Comparison of ∆APC1→6 for PS-TBI versus control subjects. With 5 min dark adaptation in ALT #2 and test, the photopotentiation PS-TBI subjects exhibited in ALT #1 significantly decreased. Photopotentiation is not significantly altered by dark adaptation in control subjects. Noted as ‘a’: DISC is significantly lower than all tests for PS-TBI, and for all but the RING controls. Noted as ‘b’: RING is significantly different than all tests except ALT #2 in PS-TBI subjects. *p < 0.05, t-test.
In addition to the pupil testing, the sleep/wake activity and light exposure during the 2 week period between the two visits were examined. There was no difference in the total sleep (hours/day) or sleep efficiency (% time asleep while in bed) between the case and control groups. However, the TBI subjects with photosensitivity took longer, on average, to fall
0 10 20 30 40 50 60 70 80 90
100
0 5 10 15 20 25 30 35 40 45 50 55 60 65 70 75 80 85 90 95 100 105 110 115
Pupi
l Con
stric
tion
(%)
TIME (seconds)
Pupil Diameter to Flickering Stimulus RING
PS-TBI CONTROLS
-10
-5
0
5
10
15
ALT #1 Alt #2 FULL DISC RING
∆ A
PC (%
)
Test
∆APC1à6
Cases
Controls
*
*
a b

Hartwick; W81XWH-12-1-0434
17
asleep (sleep onset latency) than controls (Figure 14). Of interest, those subjects that showed altered sleep patterns (greater deviation from mean sleep time in minutes) tended to exhibit greater potentiation of the pupil constriction (Figure 15) in response to the alternating red/blue pupil test (ALT #1; see Figure 8). This trend suggests a link between pupil dysfunction and sleep disturbance, consistent with possible altered ipRGC function.
Figure 14. Top: Representative actogram generated by Respironics Actiware software for a subject in HIPP study. Light blue shading represents sleep periods, light green shading indicates rest periods (in bed but not sleeping), and purple shading indicates watch off wrist. Black bars represent activity (accelerometer-dected movement). Yellow, red, blue and green line graphs represent white, red, blue and green light exposure, respectively. Bottom: Case subjects were not different from control subjects in total sleep (left panel) or sleep efficiency (middle panel), but they did take longer to fall asleep (sleep onset latency) than controls (right panel). * p < 0.05, t-test
*

Hartwick; W81XWH-12-1-0434
18
Figure 15. Interaction between pupil and sleep functionality. Case subjects (with TBI-associated photosensitivity) who demonstrated robust pupil photopotentiation (data taken from ALT #1 test) trended toward sleeping for either more or less time than that group’s average time. R = 0.39, p = 0.06 With respect to the light meter data collected by the Actiwatch, there was no difference in the amount of white, red, blue and green light that the case group was exposed to, relative to the controls, during the 2-week period (Figure 16). While somewhat counterintuitive, as the case subjects reported significant discomfort under ambient lighting conditions (see Figure 1), it’s important to note that the watches record light exposure to the wrist. As many of the case subjects wore sunglasses both indoors and outdoors, it’s possible (and likely) that the watch-incorporated light-meters do not accurately reflect light exposure to the retina in the eye.

Hartwick; W81XWH-12-1-0434
19
Figure 16. Average daily exposure to white (left panel), red, green and blue (right panel) light in both subject groups, as measured by the Actiwatch worn on the wrist. There was no significant difference in the light exposure between the case and control subject groups.
Conclusions: The most significant finding was that a two-minute pupil test, involving flashing light stimuli that alternates between red and blue light flashes, elicits a significantly different response in subjects with TBI-associated photophobia as compared to age-matched controls. With no prior dark adaptation, the case subjects showed enhanced pupil constriction, relative to initial pupil size, at the end of the test which indicates more robust light-evoked signaling in the neural circuitry that mediates the pupillary light reflex. As ipRGCs are a key contributor to the circuitry that mediates pupil constriction, altered ipRGC function may underlie the difference in the pupil responses observed in this study. Importantly, the difference in the pupil response exhibited by the two subject groups was eliminated with increasing dark adaptation occurring prior to the test. Combining these results with those outlined in first summary in this report, our data suggest that, rather than increased ipRGC sensitivity, there is an alteration in how ipRGCs adapt to ambient light conditions in TBI subjects with photophobia.
3) Grading video-recorded light aversion responses by masked observers
Purpose: We investigated whether masked-observer gradings of video-recorded subject responses to light stimuli (blinking, squinting, tearing) could be used to assess photophobia. Before applying this technique to the subjects with TBI, we first developed a grading protocol for assessing photophobia using digital recordings on young healthy subjects.
Methods: The initial study to develop the grading protocol was performed on video recordings of light-evoked pupil responses that were obtained from 19 subjects (age range: 23-27, 42% female) that were monocularly stimulated with bright (1014 phots/s/cm2), slowly (0.1 Hz) flickering red and blue light in their pharmacologically-dilated left eye. An extended

Hartwick; W81XWH-12-1-0434
20
Maxwellian-view optical system was utilized to deliver the LED-generated light stimuli (same apparatus used to generate pupil responses shown in Figures 3 and 4). Pupil diameters were measured and the difference in the pupil size fluctuation elicited by the red versus blue flickering light was determined following Fourier analysis. Using a 5-point scale, 5 observers used the digital recordings (n = 38) to grade the magnitude of photophobic signs (blinking, squinting, tearing) exhibited by the subjects in response to the same two colored light stimuli. The observers were masked to the color of light (red versus blue) used in a given recording and to the Fourier-derived pupil fluctuation amplitude. Using examples from the first set of videos (young, healthy subjects) as references for the different grades, masked observers used a 5-point scale to grade the videos collected from the TBI subjects (n = 24) and age-matched control (n = 12) subjects in the pupil recording experiments (outlined in first Summary above).
Results: For the videos obtained from young healthy subjects, the 5 masked observers used a range of grades on the 5-point scale to assess the perceived photophobic response (Figure 17). The intraclass correlation (ICC) came out to 0.74, with a 95% confidence interval of 0.63 to 0.84, which is considered to be good agreement. The grades were further tested for rater bias using a one-way ANOVA (all-pairwise comparison) and only the only significant difference (P < 0.05) was between the gradings for Rater 4 (who graded the lowest) and Rater 5 (who graded the highest).
Figure 17. Distribution of gradings of subject photosensitivity. Five observers were given 38 digital recordings, which showed close-up images of eyes in subjects who were stimulated with 0.1 Hz flickering red or blue light. The observers graded the subject’s aversion response to the light (blinking, squinting, tearing) on a 5-point scale (y-axis). The number of symbols represent the number of videos given each grade by the individual observers. Dotted lines represent the mean grades given by each observer.
Using the grades obtained from the masked observers, we determined whether red or blue light stimulation elicited greater light aversion responses in this group of young normal subjects (Figure 18). The gradings for the responses to blue light stimulation (19 subjects x 5 observers = 95 gradings) were pooled and compared to the gradings for the red light stimulations (n = 95 gradings). The mean was 2.79 for the blue (median = 3) and 2.54 for the red (median = 2). This difference was statistically significant (P = 0.007,
1
2
3
4
5
Rater 1 Rater 2 Rater 3 Rater 4 Rater 5

Hartwick; W81XWH-12-1-0434
21
Wilcoxon test). These results indicate that the blue light elicited a greater aversion response, as graded by 5 masked observers.
Figure 18. Percentage of grades in each category on the 5-point scale for the recordings of subjects’ response to blue light (n = 95 grades) or red light (n = 95 grades). A similar comparison was performed to look at the effect of gender. Of the 19 subjects, 11 were males and 8 were females. As shown in Figure 19, the observers gave out a grading of ‘1’ (black shaded region at bottom of bars) more frequently to females. Thus, within this sample of healthy young individuals, the male subjects exhibit significantly greater aversion responses to the light stimuli, as compared to the female subjects.
Figure 19. Percentage of grades in each category on 5-point scale for the recordings of male (n = 110 grades) versus female (n = 80 grades) subject’s response to blue or red light.

Hartwick; W81XWH-12-1-0434
22
The photophobia gradings were then correlated to the pupil responses that were evoked by the red and blue flashing stimuli. In Figure 20 shown below, the data were normalized so that 100% is maximum pupil constriction. Red and blue light stimuli were presented monocularly to a dilated eye at a flicker rate of 0.1 Hz (5 s on, 5 s off). The two lights (red and blue LEDs) were calibrated so that they caused identical pupil constriction and re-dilation when presented at a moderate intensity (red: 7x10¹⁴; blue: 1x10¹⁴ phots/s/cm2). In the mean data (n = 19 subjects), note the significant reduction in the recovery in pupil size (re-dilation) during the 5 second ‘OFF’ phases (Figure 20, left panel). Based on the temporal properties of ipRGCs, this reduction in pupil flicker to a bright blue flashing light is due to the contribution of ipRGCs to the pupillary light reflex. The magnitude of pupil fluctuation (constriction/re-dilation) during the flickering light stimuli can be quantified through Fourier analysis. There was significantly less fluctuation in the pupil response to the blue light (15.4% ± 0.9 SE) compared to the red light (22.7% ± 1.0 SE), consistent with an increased contribution of ipRGCs to the blue light-driven response (Figure 20, right panel).
Figure 20. Left: Mean changes (± SE) in pupil size in young healthy subjects (n = 19) stimulated with red (7x10¹⁴ phots/s/cm2) or blue (7x10¹⁴ phots/s/cm2) light that flickered at 0.1 Hz. Right: On average, the Fourier-derived pupil fluctuation was less for blue versus red light, consistent with a greater contribution of ipRGCs for the former; p < 0.01, Paired T-test
Although the mean data (Figure 20) showed a difference in the pupil responses to the red and blue stimuli, there was variability in the difference in pupil fluctuation evoked by the two colored stimuli within individual subjects. This variability is evident by examining the pupil responses in a subject in which there was little difference between the red- and blue-light driven pupil responses, as compared to a subject where the difference was large (Figure 21).

Hartwick; W81XWH-12-1-0434
23
Figure 21. Pupil responses to the red and blue flickering light in two individuals in which the responses to the two colored stimuli were essentially the same (right panel) or different (left panel). Both individuals contributed to the mean data shown in Figure 20.
The difference in the Fourier-derived pupil fluctuation for the red versus blue flickering light was plotted against the graded light aversion scores for each subject. As illustrated in Figure 22, red dots are the light aversion grades given to the red light stimulation digital recordings and blue dots represent the grades for blue light recordings. Data like that shown in the left panel of Figure 21 would be plotted near the right end of the X-axis (large difference in amplitude) and data like that shown in the right panel of Figure 21 would be plotted at the left end of the X-axis (small difference) in Figure 22. There was a significant inverse correlation (R=0.61) between the pupil responses and the light aversion gradings. In other words, there was a general trend that indicates the more similar the pupil responses to the red and blue flickering light, the more likely the subject exhibited greater light aversion responses.
Figure 22. There was a significant (p<0.01) correlation (R=0.61) between the mean light aversion score for each recording (red = red light; blue = blue light) and the difference (red minus blue) in the Fourier-derived amplitude of the pupil fluctuation evoked by the two stimuli.

Hartwick; W81XWH-12-1-0434
24
After establishing the photophobia grading protocol in the videos obtained from young healthy subjects, a similar protocol was applied to videos obtained from TBI subjects with photophobia. The videos were from the trials involving: 1) three monochrome blue light pulses (pupil data in Figure 3 A-B); and 2) three monochrome red light pulses (pupil data in Figure 3 C-D). In addition to these masked gradings, we assessed whether the TBI subjects reported that the lights were brighter, as compared to the controls. During the procedure, the subjects were asked to grade each light pulse on a scale of 1 to 5, with 5 being considered very bright so that the subject felt they almost had to close their eyes during the trial. The distribution of these subject-reported grades show that the case subjects consistently rated the light pulses as being subjectively brighter (Figure 23), consistent with the photophobia during daily activities reported by this group (see Figure 1). Case subjects also rated the blue light as significantly brighter than the red.
Figure 23. Subject rating of light ‘brightness’ for the 3 pulses of blue (left panel) and red (right panel) stimuli. Data for case subjects (n = 24) are colored dark blue and red, with data for control subjects (n = 12) being colored light blue and red. Horizontal lines represent mean values. Adding values for all 3 pulses together within a trial, the case subjects rated both the blue and red pulses as significantly brighter (P < 0.05, t-test). Four masked observers were asked to grade each pupil recording video on the light aversion response exhibited. The videos were graded from 1 (no photophobic response evident) to 5 (severe blinking, squinting, fixation losses) using example videos for each grade that were obtained from the study on young, healthy subjects described above. In total, the observers graded 68 videos (34 videos each for trials involving red and blue light, respectively); 44 videos from 22 case subjects (the videos for 2 subjects were unusable, see Table 3) and 24 videos from 12 control subjects. The grades were distributed across the 5-point scale and the intraclass correlation was 0.77, indicating good agreement (Figure 24). In comparisons between the subject groups, there was no significant difference (p > 0.05) in the grades assigned to the videos associated with either the blue or red light trials (Figure 25). Within group, the grades were significantly higher (p < 0.01) for the blue light trials, relative to red light, in the case subjects, but there was no significant difference in the control subjects (Figure 25).

Hartwick; W81XWH-12-1-0434
25
• Figure 24. Left: Example image during light exposures from videos in which the light aversion response was graded as a 5 (Top) and 1 (Bottom). Right: Distribution of grades for the 68 videos ranked by each of the 4 masked observers. Horizontal lines represent mean rankings. Intraclass correlation = 0.77 (95% CI: 0.66 to 0.85).
Figure 25. Percentage of grades in each category on the 5-point scale for the recordings of both case and control subjects’ response to blue light (n = 44 grades) or red light (n = 22 grades). There was no significant difference in the grades for the case versus control subjects (either blue or red light). There was a significant difference (p < 0.05, t-test), within the case subject group, between the rankings for the blue and red light trials, with the blue light trials being graded higher (greater light aversion response).
Cases Controls
Hartwick; W81XWH-12-1-0434
26
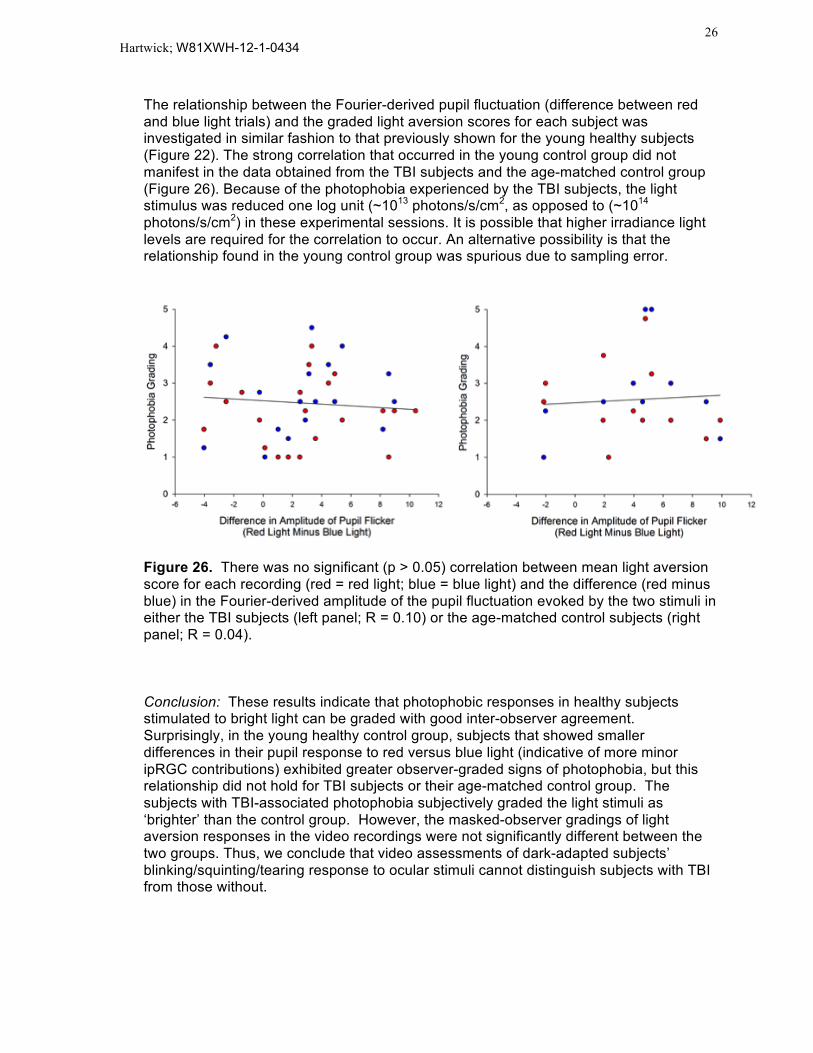
The relationship between the Fourier-derived pupil fluctuation (difference between red and blue light trials) and the graded light aversion scores for each subject was investigated in similar fashion to that previously shown for the young healthy subjects (Figure 22). The strong correlation that occurred in the young control group did not manifest in the data obtained from the TBI subjects and the age-matched control group (Figure 26). Because of the photophobia experienced by the TBI subjects, the light stimulus was reduced one log unit (~1013 photons/s/cm2, as opposed to (~1014 photons/s/cm2) in these experimental sessions. It is possible that higher irradiance light levels are required for the correlation to occur. An alternative possibility is that the relationship found in the young control group was spurious due to sampling error.
Figure 26. There was no significant (p > 0.05) correlation between mean light aversion score for each recording (red = red light; blue = blue light) and the difference (red minus blue) in the Fourier-derived amplitude of the pupil fluctuation evoked by the two stimuli in either the TBI subjects (left panel; R = 0.10) or the age-matched control subjects (right panel; R = 0.04). Conclusion: These results indicate that photophobic responses in healthy subjects stimulated to bright light can be graded with good inter-observer agreement. Surprisingly, in the young healthy control group, subjects that showed smaller differences in their pupil response to red versus blue light (indicative of more minor ipRGC contributions) exhibited greater observer-graded signs of photophobia, but this relationship did not hold for TBI subjects or their age-matched control group. The subjects with TBI-associated photophobia subjectively graded the light stimuli as ‘brighter’ than the control group. However, the masked-observer gradings of light aversion responses in the video recordings were not significantly different between the two groups. Thus, we conclude that video assessments of dark-adapted subjects’ blinking/squinting/tearing response to ocular stimuli cannot distinguish subjects with TBI from those without.

Hartwick; W81XWH-12-1-0434
27
Overall Conclusions: The following three conclusions represent the major findings outlined in the three preceding summaries above.
1. Using pupil responses to red and blue flashing light, there was no evidence to support the hypothesis that ipRGCs are hypersensitive to light in subjects with TBI-associated photophobia.
2. Instead, the TBI subjects exhibited greater photopotentiation (enhanced constriction) of their pupil response to a 2-minute long 0.1 Hz flashing stimulus consisting of alternating red and blue light. This effect was evident under light-adapted conditions and dissipated after the subjects were dark adapted. We postulate that the effect may be due to an inability of ipRGCs to adapt to repeated light stimuli.
3. In addition to pupil size, we examined whether the video recordings taken during the pupil testing trials could be used to assess photophobia based on the blinking/squinting/tearing reactions exhibited by the dark-adapted subjects. There was a range of responses elicited by the light stimuli, and the inter-rater agreement was good. However, there was no significant difference in the graded light aversion responses between the TBI group and the matched controls. Thus, this methodology, which is more subjective than the objective monitoring of pupil size, was not as effective as the pupil test (involving alternating red and blue light stimuli) for assessing photophobia in subjects with TBI.
Impact:
The results collected and analyzed in this DoD-funded project support the premise that ipRGC function is altered in TBI patients with photophobia. Rather than a change in light sensitivity, one interpretation of these data is that ipRGCs exhibit an altered ability to adapt to repeated light stimuli in these subjects. This work indicates that there is a biological change in TBI patients that may explain why these subjects experience photophobia. Furthermore, this research has identified a potential pupil test – a 2 min-long test using flashing alternating red/blue lights in patients are light-adapted to ambient indoor lighting conditions – that should be of use in detecting and quantifying this functional change in TBI patients with photophobia.
Products: This work has developed a pupil testing protocol that has merit in idenifying a functional change in TBI subjects with photophobia. This test was administered with a commercial pupillometer, but the test does not have to be specifically tied to this device in the future. The test consists of 0.1 Hz flashing alternating red and blue light stimuli with a duration of 2 min. Our results show that applying this test after exposure to ambient light levels (no dark adaptation) is the best way to administer the test so that it identifies a difference in TBI subjects with photophobia as compared to controls.

Hartwick; W81XWH-12-1-0434 28
Participants:
The following personnel were involved in this study:
Andrew Hartwick, OD PhD: Primary I nvestigator - Involved in study design, subject recruitment, data collection, data analysis
Michael Earley, OD PhD: Co-investigator - Involved in study design, subject recruitment
Catherine McDaniel, OD - Involved in subject recruitment, data collection
Patrick Shorter, OD - Involved in data collection, data analysis
Phillip Yuhas, OD MS - Involved in data collection, data analysis
Puneet Sodhi - Involved in data analysis
Samantha Papadakis - Involved in data analysis