Awang Noor Abd. Ghani - dosm.gov.my Content/2... · Awang Noor Abd. Ghani Valuing Ecosystem...
33
Statistics for Sustainable Social Environmental Development Awang Noor Abd. Ghani Valuing Ecosystem Services as a Key Driver of Sustainable Development in Malaysia
Transcript of Awang Noor Abd. Ghani - dosm.gov.my Content/2... · Awang Noor Abd. Ghani Valuing Ecosystem...

Statistics for Sustainable Social Environmental
Development
Awang Noor Abd. Ghani
Valuing Ecosystem Services as a Key Driver of Sustainable Development in Malaysia
1. Introduction
2. Sustainable development
3. Ecosystem service (ES)
4. Valuation methods of ES
5. Valuation of ecosystem services in Malaysia
6. Challenges and actions needed
7. Conclusion
2
Introduction
• Ecosystems generate a wide range of goods and services important for human well-
being ecosystem services
• Progress has been made in understanding how ecosystems provide services and how
service provision translates into economic value
• However, it is difficult to move from general findings about the benefits nature
provides to people to credible, quantitative estimates of ecosystem service values
• Explicit values of ecosystem services across landscapes that might inform policy and
decision makers are still lacking
Introduction
• Sustainable development goals (SDGs) recognize the interconnections between
social and ecological systems.
• New interest in integrated social–ecological indicators
• SDGs from sector specific goals towards more integrated social–ecological
planning, tracking and reporting
• Integrated SDG will require tracking and monitoring nature's contribution to
human wellbeing and impacts of human activity on nature
• Most common notion of nature-human interaction is through ecosystem
services
the benefits people derive from their interaction with ecosystems
Need to value ecosystem services as a key enabler in achieving SDGs
4
Meaning of sustainable development
Brundtland Report (1987)
“Sustainable development is development that meets the needs of the present without compromising the ability of future generations to meet their own needs.”
Three elements: Ecological, Social, Economic
Sustainability is the foundation for today’s leading global framework for international cooperation – the 2030 Agenda for Sustainable Development and its Sustainable Development Goals (SDGs).
17 SDGs have been formulated
5
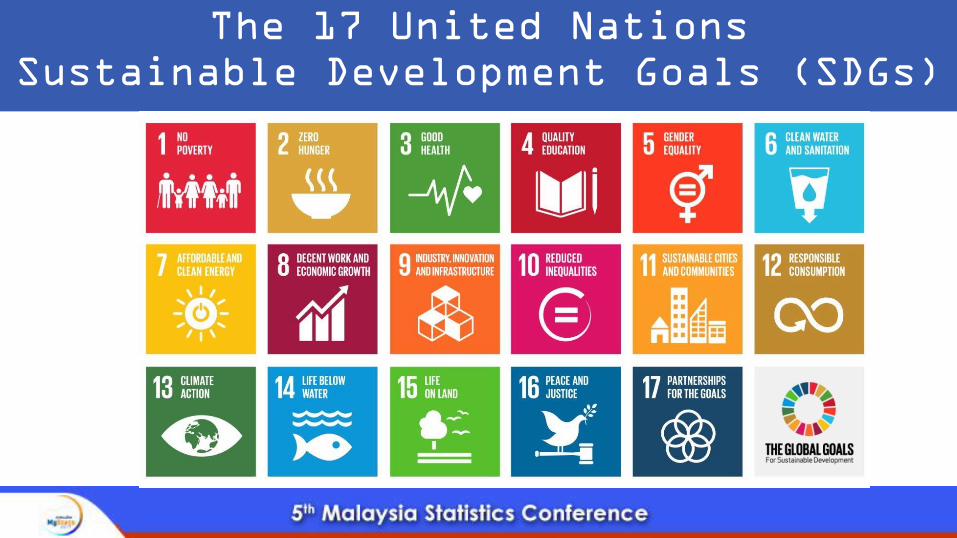
The 17 United Nations
Sustainable Development Goals (SDGs)
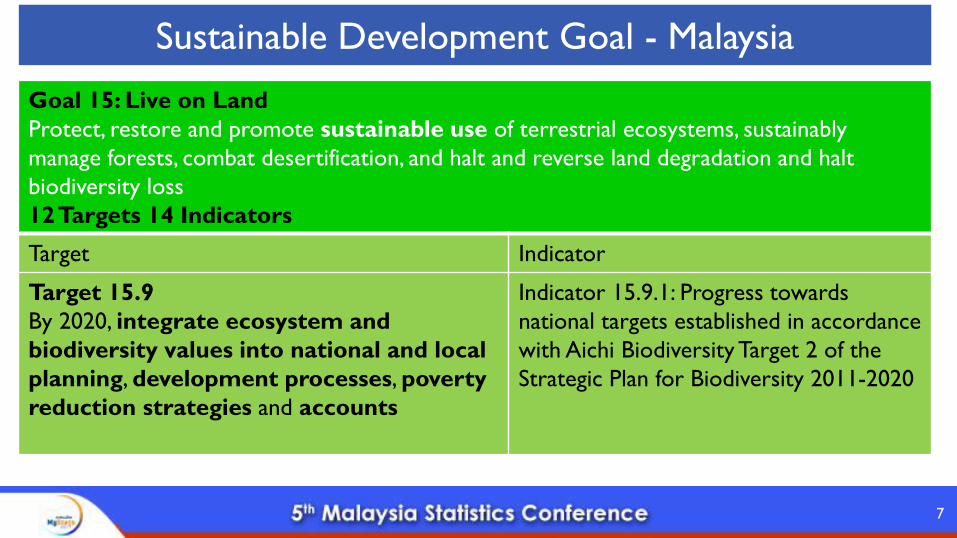
Sustainable Development Goal - Malaysia
Goal 15: Live on Land
Protect, restore and promote sustainable use of terrestrial ecosystems, sustainably
manage forests, combat desertification, and halt and reverse land degradation and halt
biodiversity loss
12 Targets 14 Indicators
Target Indicator
Target 15.9
By 2020, integrate ecosystem and
biodiversity values into national and local
planning, development processes, poverty
reduction strategies and accounts
Indicator 15.9.1: Progress towards
national targets established in accordance
with Aichi Biodiversity Target 2 of the
Strategic Plan for Biodiversity 2011-2020
7
National Biodiversity Action Plan
2016-2025
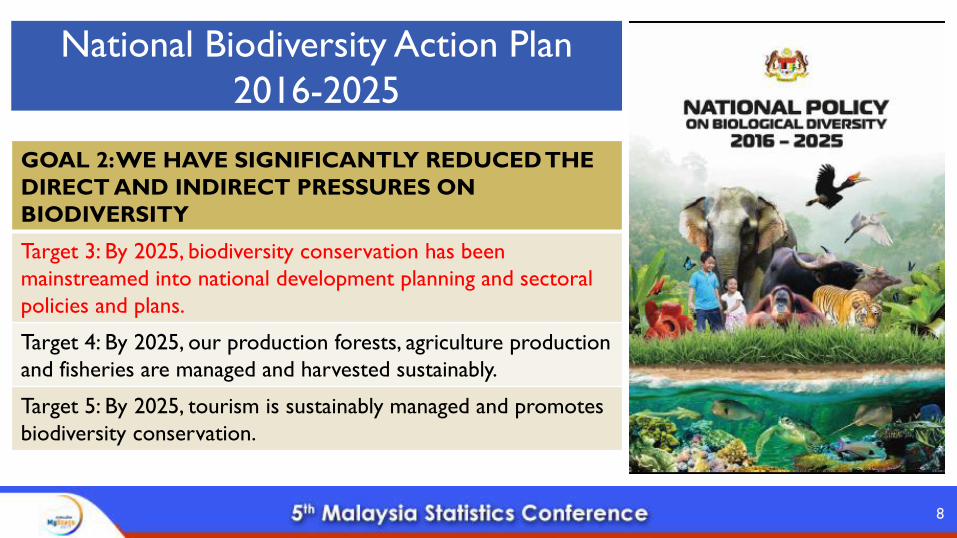
GOAL 2: WE HAVE SIGNIFICANTLY REDUCED THE
DIRECT AND INDIRECT PRESSURES ON
BIODIVERSITY
Target 3: By 2025, biodiversity conservation has been
mainstreamed into national development planning and sectoral
policies and plans.
Target 4: By 2025, our production forests, agriculture production
and fisheries are managed and harvested sustainably.
Target 5: By 2025, tourism is sustainably managed and promotes
biodiversity conservation.
8
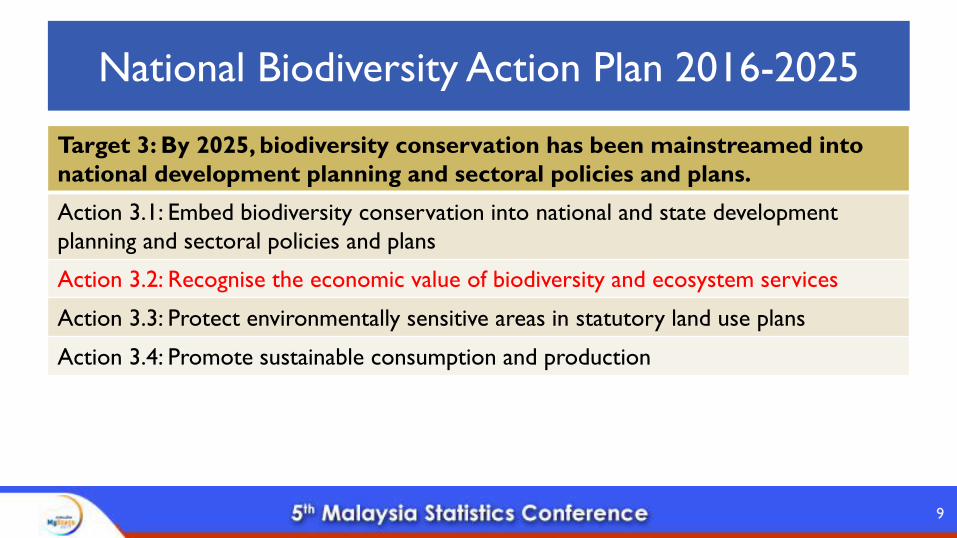
National Biodiversity Action Plan 2016-2025
Target 3: By 2025, biodiversity conservation has been mainstreamed into
national development planning and sectoral policies and plans.
Action 3.1: Embed biodiversity conservation into national and state development
planning and sectoral policies and plans
Action 3.2: Recognise the economic value of biodiversity and ecosystem services
Action 3.3: Protect environmentally sensitive areas in statutory land use plans
Action 3.4: Promote sustainable consumption and production
9
Action 3.2
• Establish a Natural Resource Accounting programme to monitor the
values of natural resources, including biodiversity, to provide information
that will permit the economic value of biodiversity to be taken properly
into account in national planning.
• Undertake a comprehensive valuation of biodiversity and
ecosystem services including research on full-cost accounting of
perverse subsidies and the internalizing externalities
• Adopt appropriate mechanisms which may include payment for
ecosystem services (PES) schemes such as public payment instruments,
carbon trade and biodiversity offsets.
10
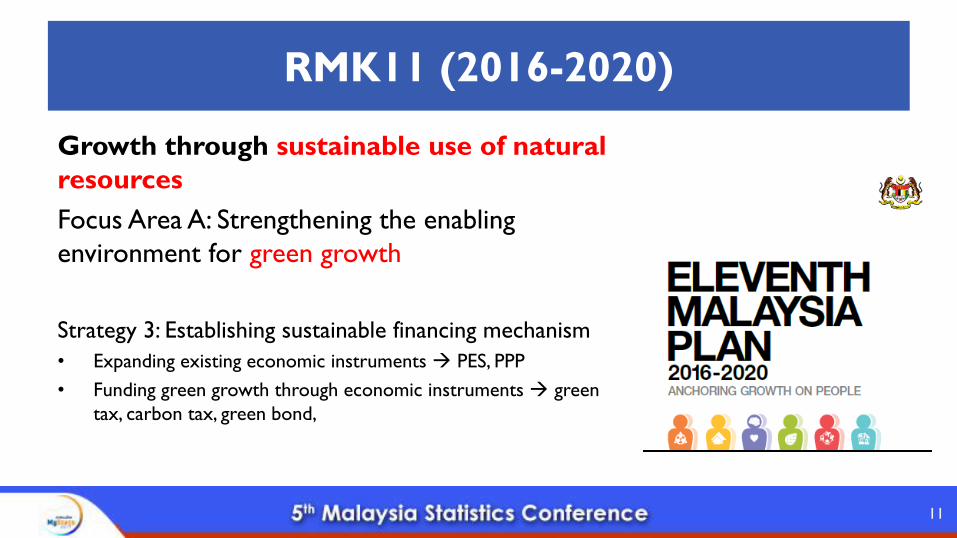
RMK11 (2016-2020)
Growth through sustainable use of natural
resources
Focus Area A: Strengthening the enabling
environment for green growth
Strategy 3: Establishing sustainable financing mechanism
• Expanding existing economic instruments PES, PPP
• Funding green growth through economic instruments green
tax, carbon tax, green bond,
11
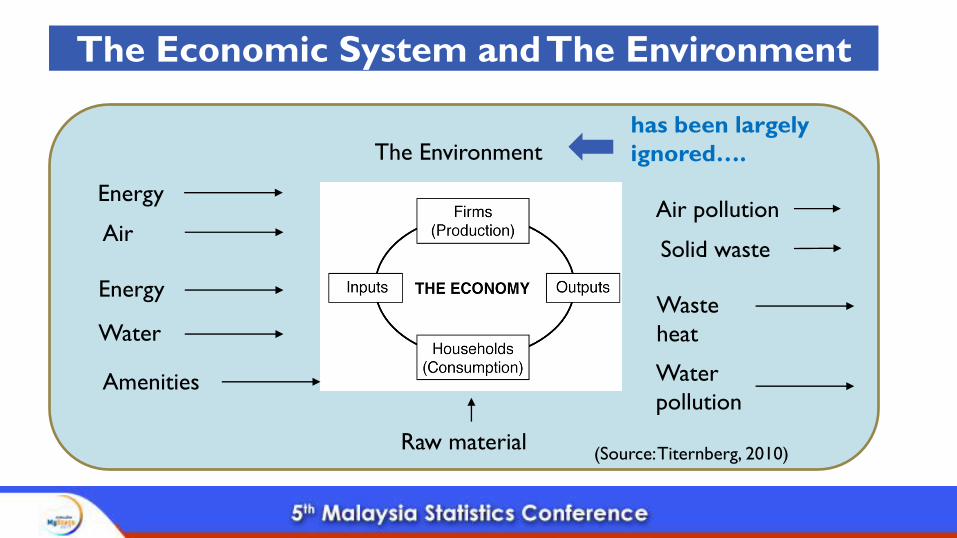
The Economic System and The Environment
has been largely
ignored….The Environment
Energy
Air
Energy
Water
Amenities
Air pollution
Solid waste
Waste
heat
Water
pollution
Raw material(Source: Titernberg, 2010)
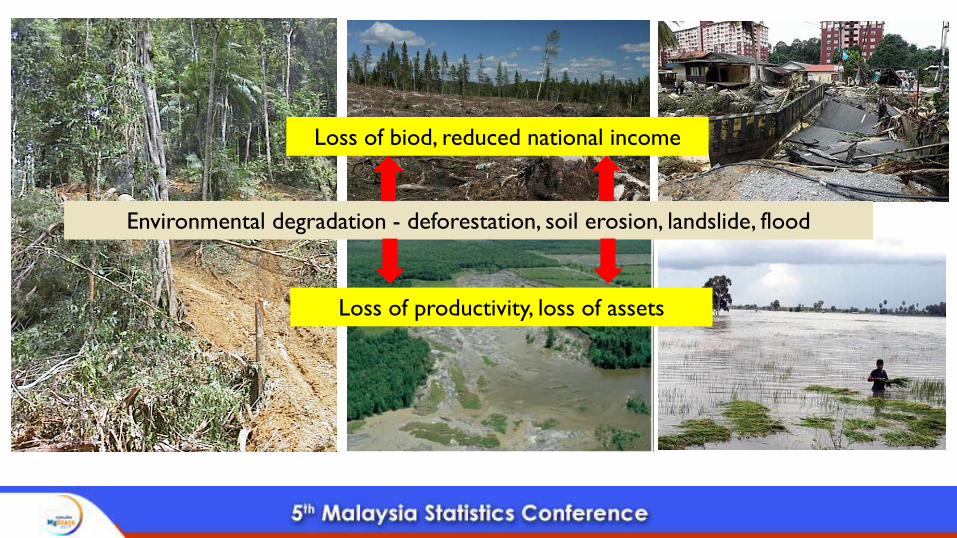
Loss of productivity, loss of assets
Environmental degradation - deforestation, soil erosion, landslide, flood
Loss of biod, reduced national income
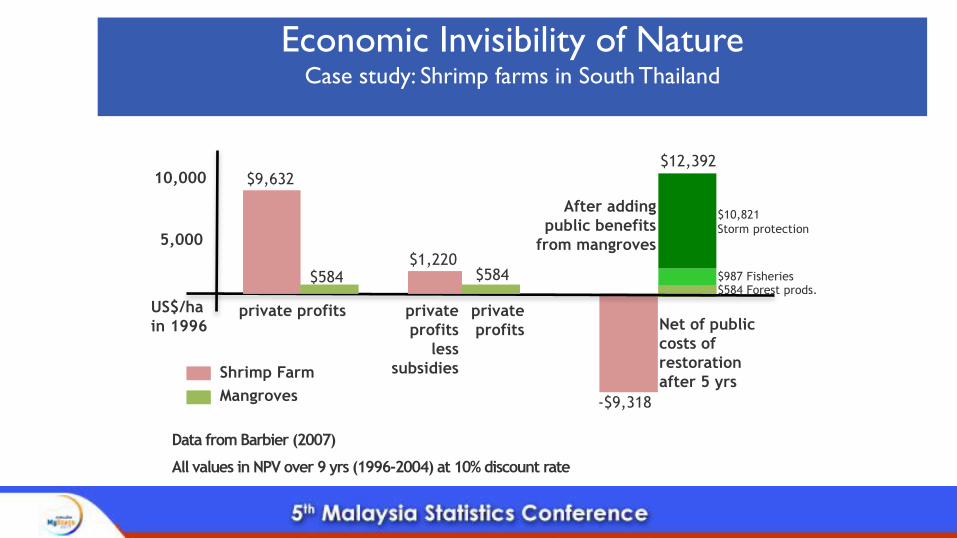
Economic Invisibility of NatureCase study: Shrimp farms in South Thailand
Mangroves
Shrimp Farm
private
profits
less
subsidies
Net of public
costs of
restoration
after 5 yrs
private
profits
10,000
US$/ha
in 1996private profits
5,000
$584$1,220
$9,632
$584
-$9,318
$12,392
After adding
public benefits
from mangroves
Data from Barbier (2007)
All values in NPV over 9 yrs (1996-2004) at 10% discount rate
$584 Forest prods.$987 Fisheries
$10,821
Storm protection
15
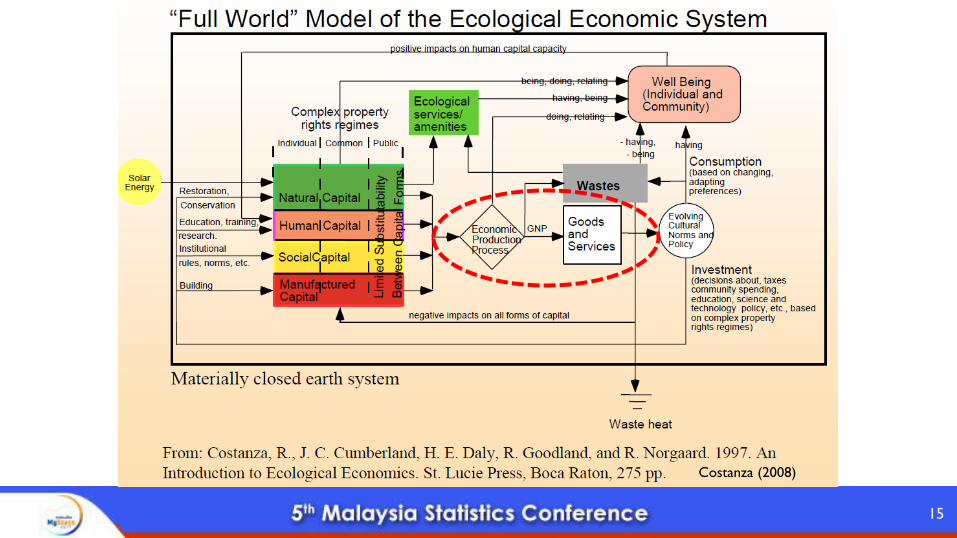
Costanza (2008)
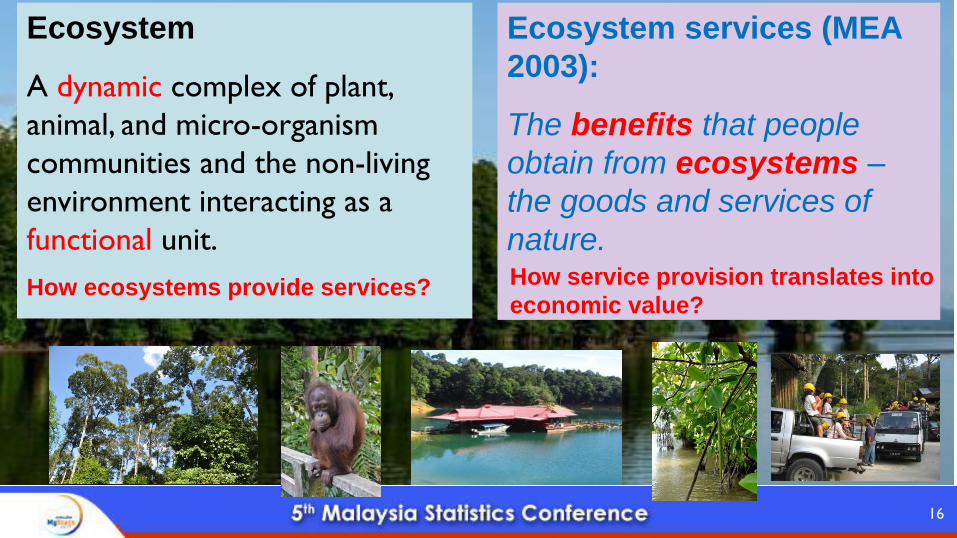
Ecosystem
A dynamic complex of plant,
animal, and micro-organism
communities and the non-living
environment interacting as a
functional unit.
Ecosystem services (MEA
2003):
The benefits that people
obtain from ecosystems –
the goods and services of
nature.
16
How service provision translates into
economic value?How ecosystems provide services?
17
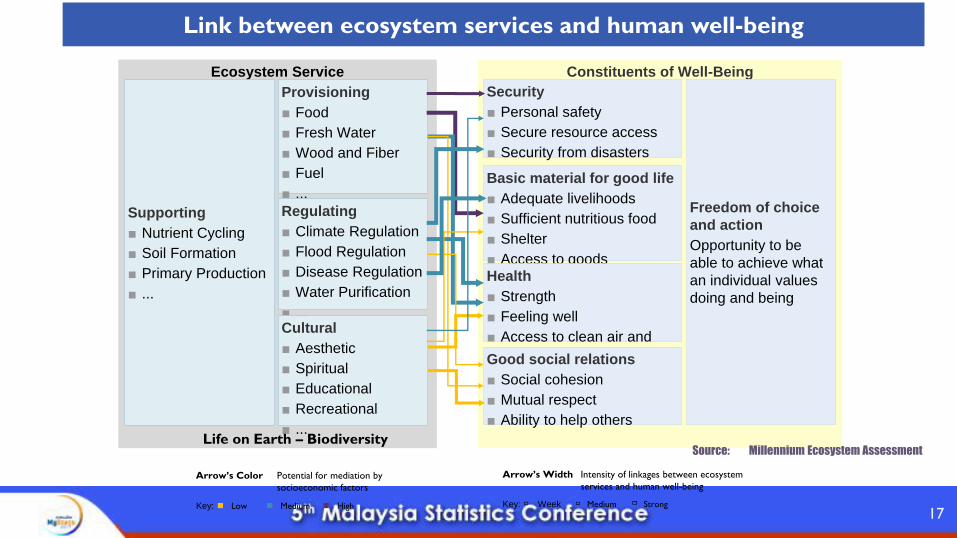
Constituents of Well-BeingEcosystem Service
Supporting
■ Nutrient Cycling
■ Soil Formation
■ Primary Production
■ ...
Provisioning
■ Food
■ Fresh Water
■ Wood and Fiber
■ Fuel
■ ...
Regulating
■ Climate Regulation
■ Flood Regulation
■ Disease Regulation
■ Water Purification
■ ...Cultural
■ Aesthetic
■ Spiritual
■ Educational
■ Recreational
■ ...
Freedom of choice
and action
Opportunity to be
able to achieve what
an individual values
doing and being
Security
■ Personal safety
■ Secure resource access
■ Security from disasters
Basic material for good life
■ Adequate livelihoods
■ Sufficient nutritious food
■ Shelter
■ Access to goodsHealth
■ Strength
■ Feeling well
■ Access to clean air and
waterGood social relations
■ Social cohesion
■ Mutual respect
■ Ability to help others
Life on Earth – BiodiversitySource: Millennium Ecosystem Assessment
Link between ecosystem services and human well-being
Arrow’s Color Potential for mediation by
socioeconomic factors
Arrow’s Width Intensity of linkages between ecosystem
services and human well-being
Key: Low Medium High Key: Week Medium Strong
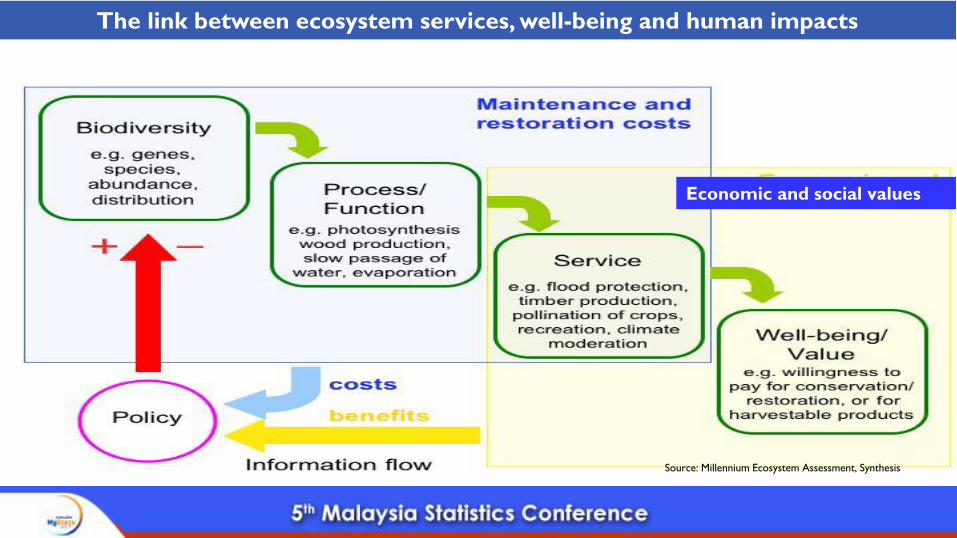
The link between ecosystem services, well-being and human impacts
Economic and social values
Source: Millennium Ecosystem Assessment, Synthesis
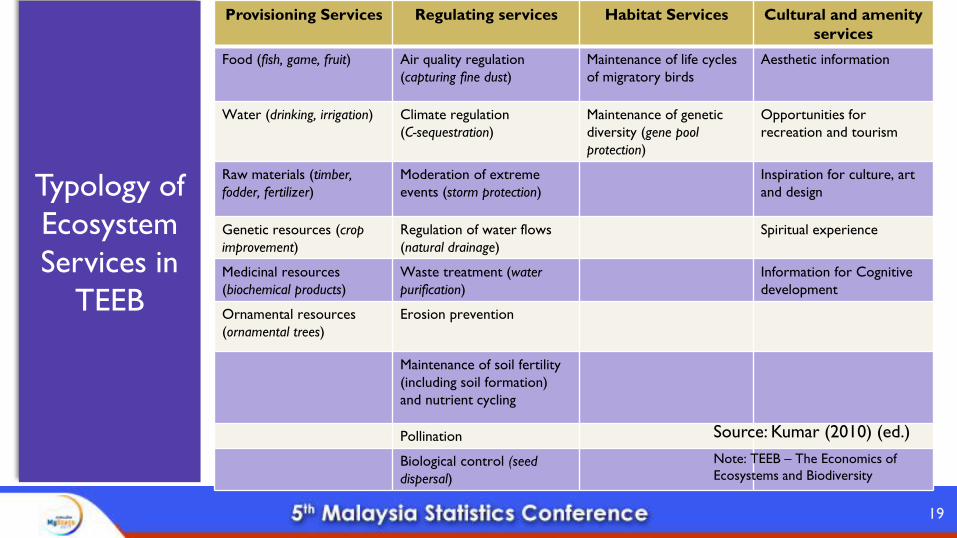
Provisioning Services Regulating services Habitat Services Cultural and amenity
services
Food (fish, game, fruit) Air quality regulation
(capturing fine dust)
Maintenance of life cycles
of migratory birds
Aesthetic information
Water (drinking, irrigation) Climate regulation
(C-sequestration)
Maintenance of genetic
diversity (gene pool
protection)
Opportunities for
recreation and tourism
Raw materials (timber,
fodder, fertilizer)
Moderation of extreme
events (storm protection)
Inspiration for culture, art
and design
Genetic resources (crop
improvement)
Regulation of water flows
(natural drainage)
Spiritual experience
Medicinal resources
(biochemical products)
Waste treatment (water
purification)
Information for Cognitive
development
Ornamental resources
(ornamental trees)
Erosion prevention
Maintenance of soil fertility
(including soil formation)
and nutrient cycling
Pollination
Biological control (seed
dispersal)
19
Source: Kumar (2010) (ed.)
Note: TEEB – The Economics of
Ecosystems and Biodiversity
Typology of
Ecosystem
Services in
TEEB
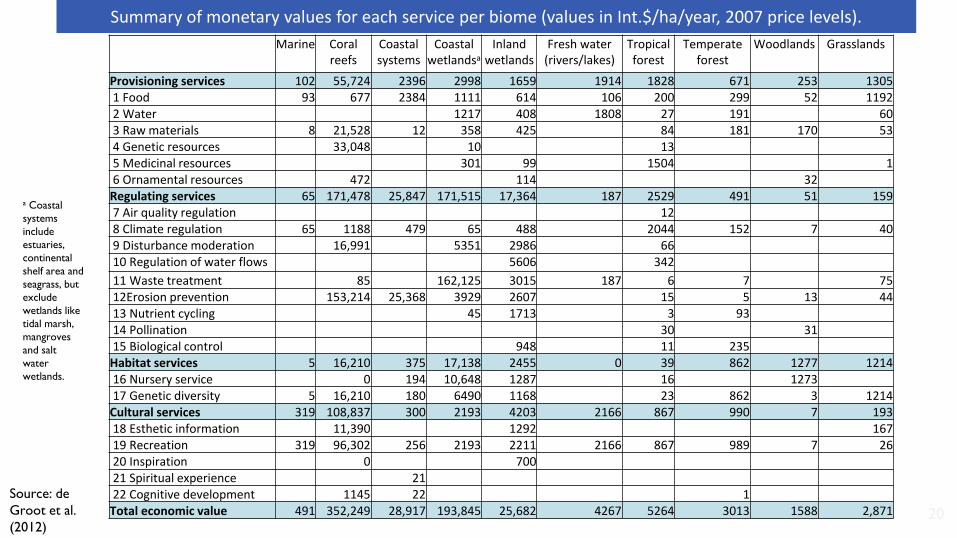
Summary of monetary values for each service per biome (values in Int.$/ha/year, 2007 price levels).
Marine Coral reefs
Coastal systems
Coastal wetlandsa
Inland wetlands
Fresh water (rivers/lakes)
Tropical forest
Temperate forest
Woodlands Grasslands
Provisioning services 102 55,724 2396 2998 1659 1914 1828 671 253 13051 Food 93 677 2384 1111 614 106 200 299 52 11922 Water 1217 408 1808 27 191 603 Raw materials 8 21,528 12 358 425 84 181 170 534 Genetic resources 33,048 10 135 Medicinal resources 301 99 1504 16 Ornamental resources 472 114 32
Regulating services 65 171,478 25,847 171,515 17,364 187 2529 491 51 1597 Air quality regulation 128 Climate regulation 65 1188 479 65 488 2044 152 7 409 Disturbance moderation 16,991 5351 2986 6610 Regulation of water flows 5606 342
11 Waste treatment 85 162,125 3015 187 6 7 7512Erosion prevention 153,214 25,368 3929 2607 15 5 13 4413 Nutrient cycling 45 1713 3 9314 Pollination 30 3115 Biological control 948 11 235
Habitat services 5 16,210 375 17,138 2455 0 39 862 1277 121416 Nursery service 0 194 10,648 1287 16 127317 Genetic diversity 5 16,210 180 6490 1168 23 862 3 1214
Cultural services 319 108,837 300 2193 4203 2166 867 990 7 19318 Esthetic information 11,390 1292 16719 Recreation 319 96,302 256 2193 2211 2166 867 989 7 2620 Inspiration 0 70021 Spiritual experience 2122 Cognitive development 1145 22 1
Total economic value 491 352,249 28,917 193,845 25,682 4267 5264 3013 1588 2,871 20
Source: de
Groot et al.
(2012)
a Coastal
systems
include
estuaries,
continental
shelf area and
seagrass, but
exclude
wetlands like
tidal marsh,
mangroves
and salt
water
wetlands.
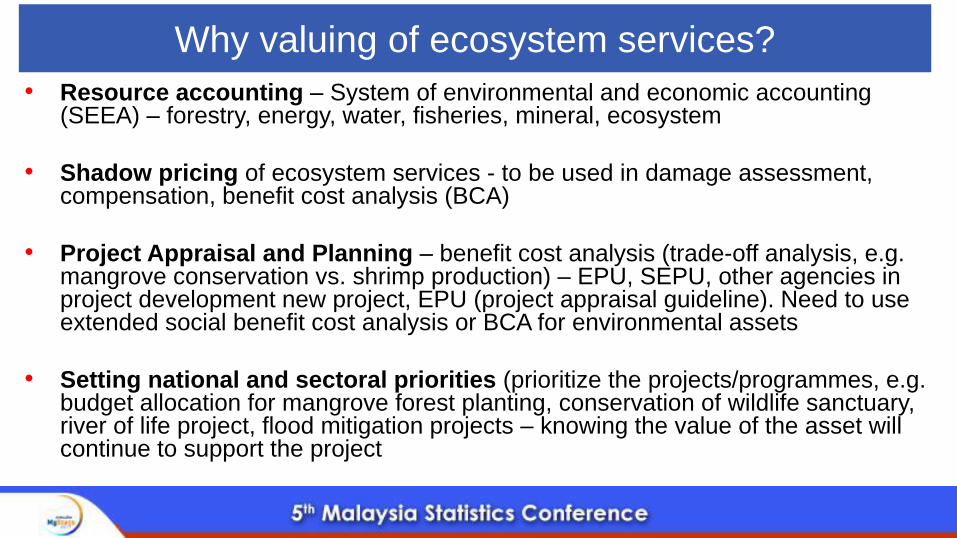
• Resource accounting – System of environmental and economic accounting (SEEA) – forestry, energy, water, fisheries, mineral, ecosystem
• Shadow pricing of ecosystem services - to be used in damage assessment, compensation, benefit cost analysis (BCA)
• Project Appraisal and Planning – benefit cost analysis (trade-off analysis, e.g. mangrove conservation vs. shrimp production) – EPU, SEPU, other agencies in project development new project, EPU (project appraisal guideline). Need to use extended social benefit cost analysis or BCA for environmental assets
• Setting national and sectoral priorities (prioritize the projects/programmes, e.g. budget allocation for mangrove forest planting, conservation of wildlife sanctuary, river of life project, flood mitigation projects – knowing the value of the asset will continue to support the project
Why valuing of ecosystem services?
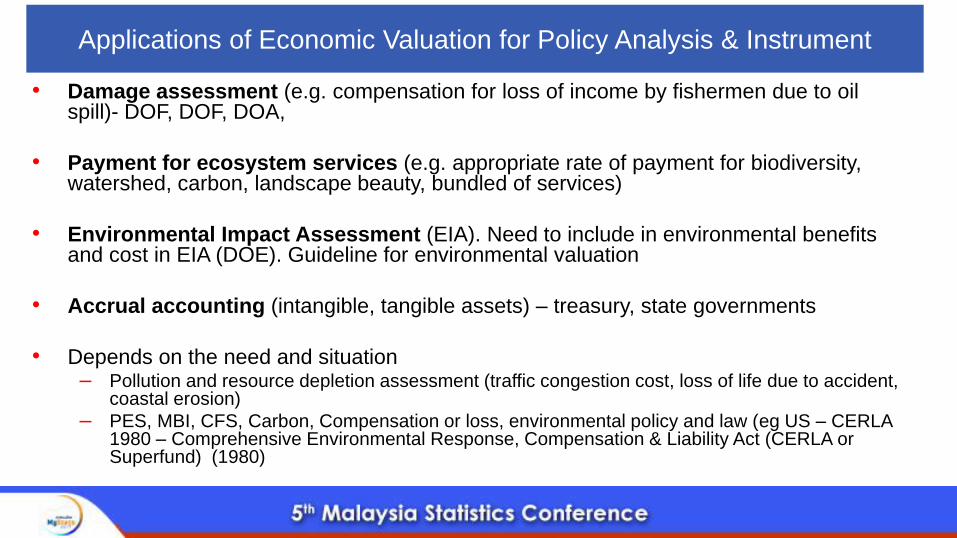
• Damage assessment (e.g. compensation for loss of income by fishermen due to oil spill)- DOF, DOF, DOA,
• Payment for ecosystem services (e.g. appropriate rate of payment for biodiversity, watershed, carbon, landscape beauty, bundled of services)
• Environmental Impact Assessment (EIA). Need to include in environmental benefits and cost in EIA (DOE). Guideline for environmental valuation
• Accrual accounting (intangible, tangible assets) – treasury, state governments
• Depends on the need and situation – Pollution and resource depletion assessment (traffic congestion cost, loss of life due to accident,
coastal erosion)
– PES, MBI, CFS, Carbon, Compensation or loss, environmental policy and law (eg US – CERLA 1980 – Comprehensive Environmental Response, Compensation & Liability Act (CERLA or Superfund) (1980)
Applications of Economic Valuation for Policy Analysis & Instrument
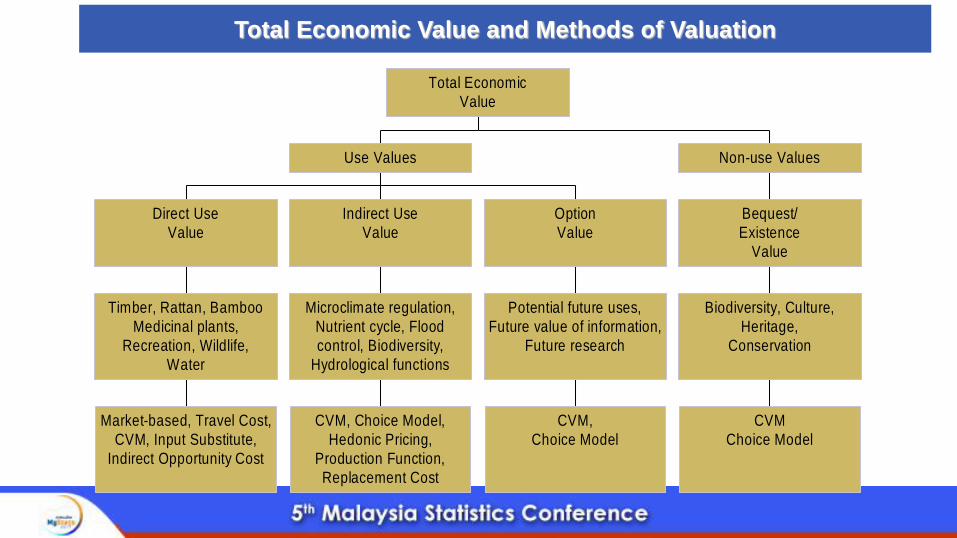
Market-based, Travel Cost,
CVM, Input Substitute,
Indirect Opportunity Cost
Timber, Rattan, Bamboo
Medicinal plants,
Recreation, Wildlife,
Water
Direct Use
Value
CVM, Choice Model,
Hedonic Pricing,
Production Function,
Replacement Cost
Microclimate regulation,
Nutrient cycle, Flood
control, Biodiversity,
Hydrological functions
Indirect Use
Value
CVM,
Choice Model
Potential future uses,
Future value of information,
Future research
Option
Value
Use Values
CVM
Choice Model
Biodiversity, Culture,
Heritage,
Conservation
Bequest/
Existence
Value
Non-use Values
Total Economic
Value
Total Economic Value and Methods of Valuation
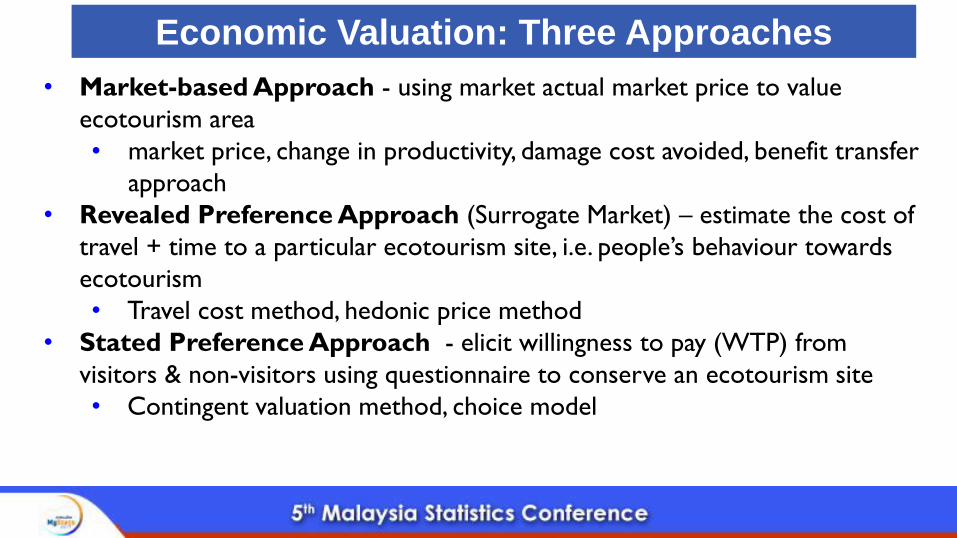
Economic Valuation: Three Approaches
• Market-based Approach - using market actual market price to value
ecotourism area
• market price, change in productivity, damage cost avoided, benefit transfer
approach
• Revealed Preference Approach (Surrogate Market) – estimate the cost of
travel + time to a particular ecotourism site, i.e. people’s behaviour towards
ecotourism
• Travel cost method, hedonic price method
• Stated Preference Approach - elicit willingness to pay (WTP) from
visitors & non-visitors using questionnaire to conserve an ecotourism site
• Contingent valuation method, choice model
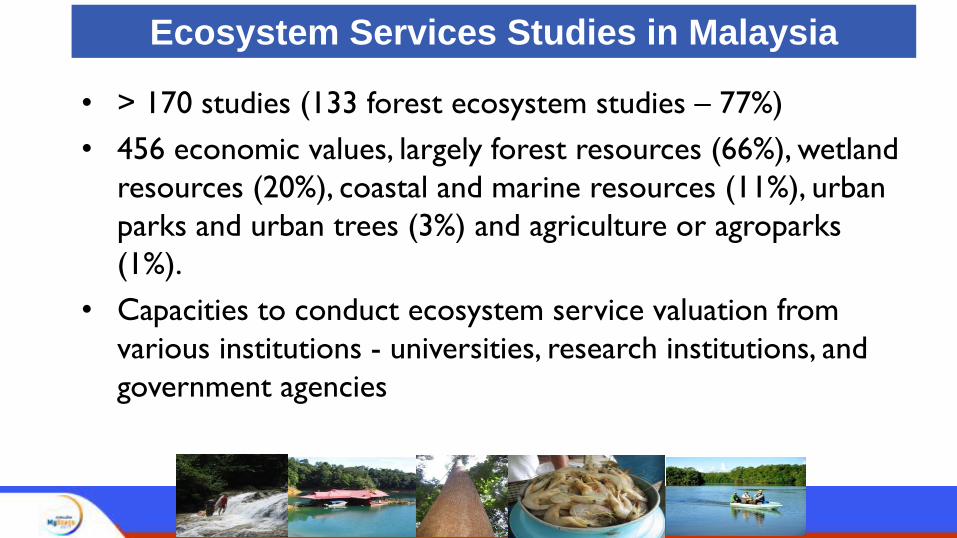
• > 170 studies (133 forest ecosystem studies – 77%)
• 456 economic values, largely forest resources (66%), wetland
resources (20%), coastal and marine resources (11%), urban
parks and urban trees (3%) and agriculture or agroparks
(1%).
• Capacities to conduct ecosystem service valuation from
various institutions - universities, research institutions, and
government agencies
Ecosystem Services Studies in Malaysia
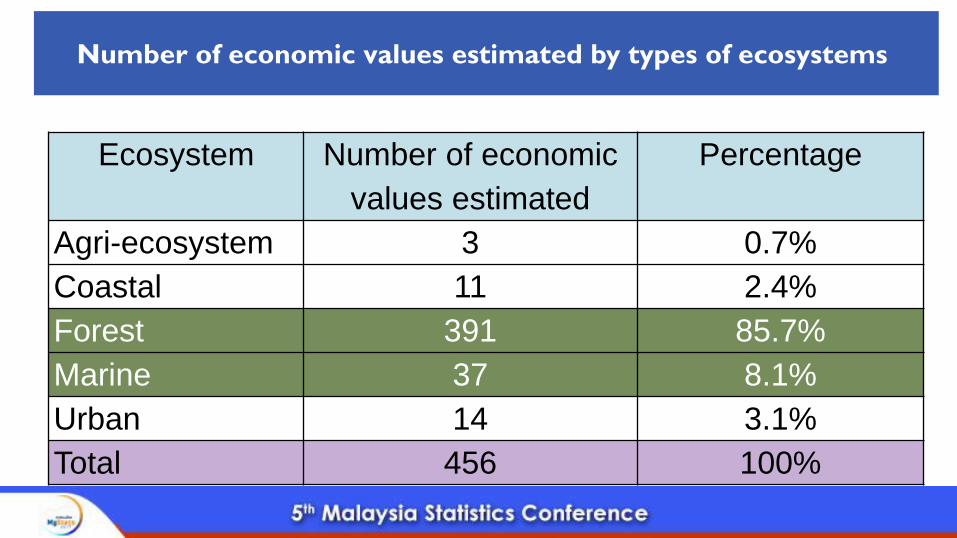
Number of economic values estimated by types of ecosystems
Ecosystem Number of economic
values estimated
Percentage
Agri-ecosystem 3 0.7%
Coastal 11 2.4%
Forest 391 85.7%
Marine 37 8.1%
Urban 14 3.1%
Total 456 100%
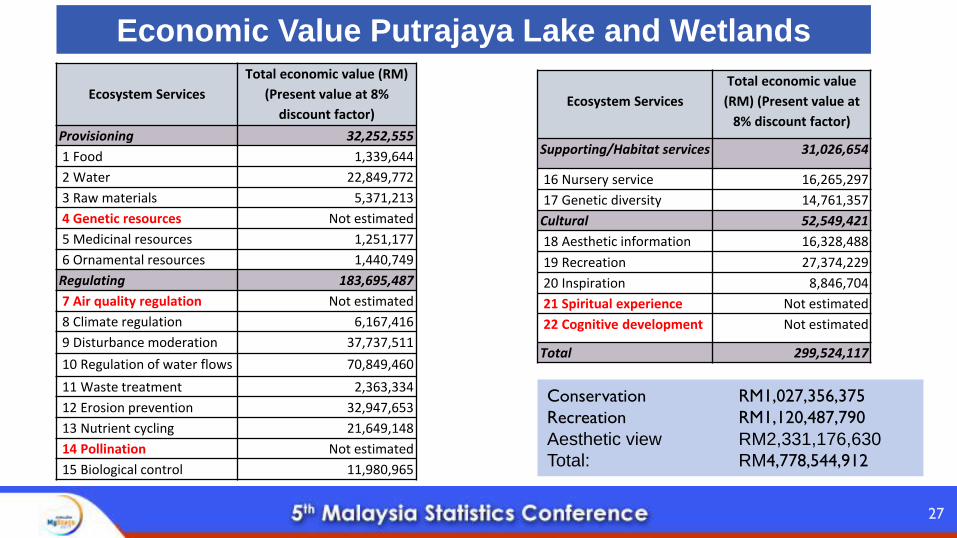
Economic Value Putrajaya Lake and Wetlands
Ecosystem Services
Total economic value (RM)
(Present value at 8%
discount factor)
Provisioning 32,252,555
1 Food 1,339,644
2 Water 22,849,772
3 Raw materials 5,371,213
4 Genetic resources Not estimated
5 Medicinal resources 1,251,177
6 Ornamental resources 1,440,749
Regulating 183,695,487
7 Air quality regulation Not estimated
8 Climate regulation 6,167,416
9 Disturbance moderation 37,737,511
10 Regulation of water flows 70,849,460
11 Waste treatment 2,363,334
12 Erosion prevention 32,947,653
13 Nutrient cycling 21,649,148
14 Pollination Not estimated
15 Biological control 11,980,965
27
Ecosystem Services
Total economic value
(RM) (Present value at
8% discount factor)
Supporting/Habitat services 31,026,654
16 Nursery service 16,265,297
17 Genetic diversity 14,761,357
Cultural 52,549,421
18 Aesthetic information 16,328,488
19 Recreation 27,374,229
20 Inspiration 8,846,704
21 Spiritual experience Not estimated
22 Cognitive development Not estimated
Total 299,524,117
Conservation RM1,027,356,375
Recreation RM1,120,487,790
Aesthetic view RM2,331,176,630
Total: RM4,778,544,912
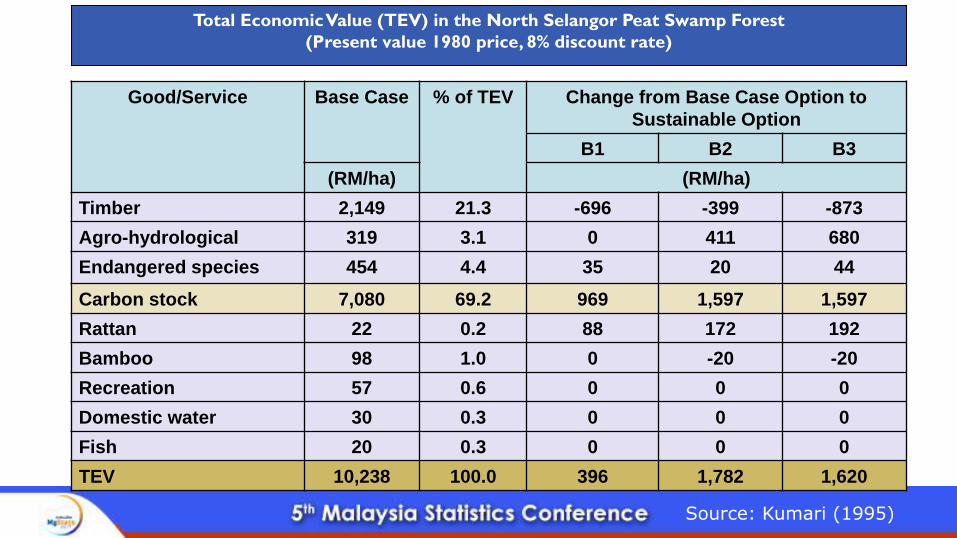
Total Economic Value (TEV) in the North Selangor Peat Swamp Forest
(Present value 1980 price, 8% discount rate)
Good/Service Base Case % of TEV Change from Base Case Option to
Sustainable Option
B1 B2 B3
(RM/ha) (RM/ha)
Timber 2,149 21.3 -696 -399 -873
Agro-hydrological 319 3.1 0 411 680
Endangered species 454 4.4 35 20 44
Carbon stock 7,080 69.2 969 1,597 1,597
Rattan 22 0.2 88 172 192
Bamboo 98 1.0 0 -20 -20
Recreation 57 0.6 0 0 0
Domestic water 30 0.3 0 0 0
Fish 20 0.3 0 0 0
TEV 10,238 100.0 396 1,782 1,620
Source: Kumari (1995)
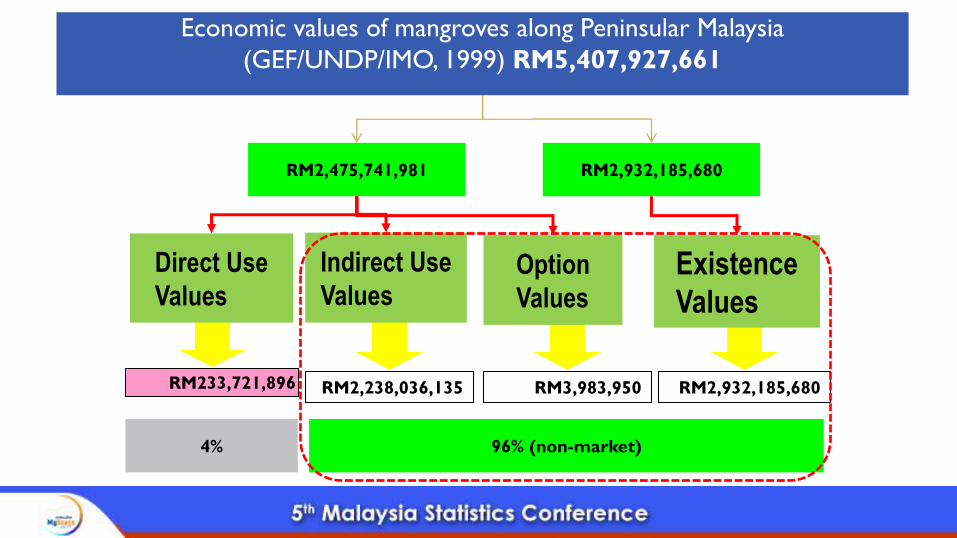
Economic values of mangroves along Peninsular Malaysia
(GEF/UNDP/IMO, 1999) RM5,407,927,661
RM233,721,896 RM2,238,036,135 RM3,983,950
Direct Use
Values
Indirect Use
ValuesOption
Values
RM2,932,185,680
Existence
Values
RM2,475,741,981 RM2,932,185,680
96% (non-market)4%
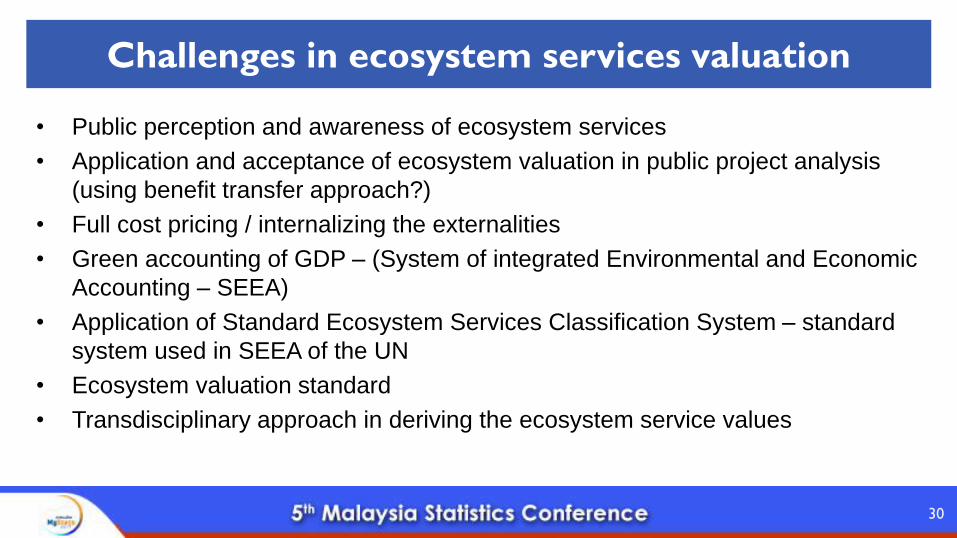
Challenges in ecosystem services valuation
• Public perception and awareness of ecosystem services
• Application and acceptance of ecosystem valuation in public project analysis
(using benefit transfer approach?)
• Full cost pricing / internalizing the externalities
• Green accounting of GDP – (System of integrated Environmental and Economic
Accounting – SEEA)
• Application of Standard Ecosystem Services Classification System – standard
system used in SEEA of the UN
• Ecosystem valuation standard
• Transdisciplinary approach in deriving the ecosystem service values
30
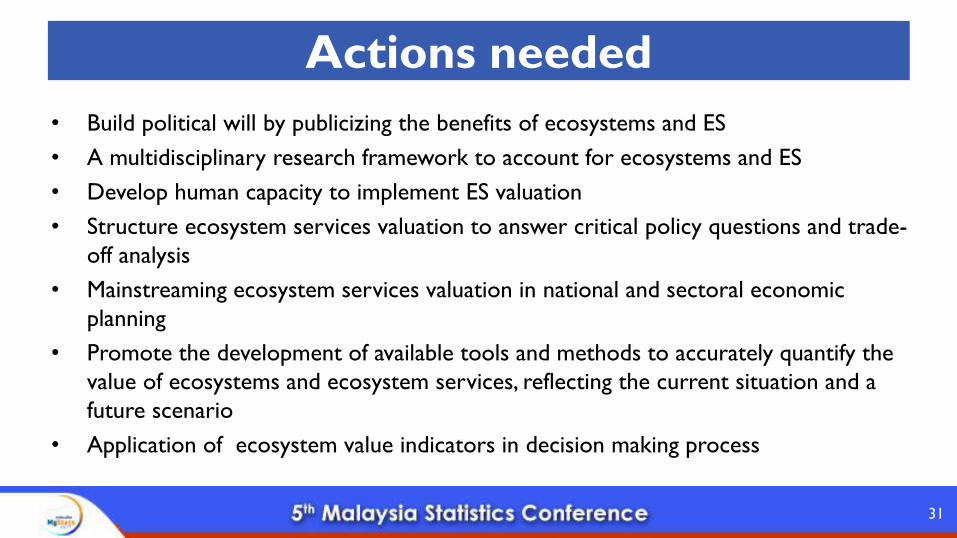
Actions needed
• Build political will by publicizing the benefits of ecosystems and ES
• A multidisciplinary research framework to account for ecosystems and ES
• Develop human capacity to implement ES valuation
• Structure ecosystem services valuation to answer critical policy questions and trade-
off analysis
• Mainstreaming ecosystem services valuation in national and sectoral economic
planning
• Promote the development of available tools and methods to accurately quantify the
value of ecosystems and ecosystem services, reflecting the current situation and a
future scenario
• Application of ecosystem value indicators in decision making process
31
• Ecosystem should be treated as an
important asset in an economy
• Ecosystem services should be valued in a
similar manner as any other forms of
wealth
• Need to understand the economics and
ecology in assessing ecosystem services
and their values and implications in a
wealth accounting framework and to
achieve sustainable development goals
(SDGs)
Conclusion

Thank You
33
Questions?