Avoid Simple Solutions and Quick Fixes: Lessons Learned from a ...
48
AVOID SIMPLE SOLUTIONS AND QUICK FIXES Paper submitted to Closing the School Discipline Gap: Research to Practice January 2, 2013 Authors: David M. Osher, Ph.D., Vice President, American Institutes for Research (AIR) Jeffrey M. Poirier, M.A., Senior Researcher, AIR G. Roger Jarjoura, Ph.D., Principal Researcher, AIR Russell Brown, Ph.D., Deputy Chief of Organizational Accountability, Cleveland Metropolitan School District Kimberly Kendziora, Ph.D., Principal Researcher, AIR LESSONS LEARNED FROM A COMPREHENSIVE DISTRICTWIDE APPROACH TO IMPROVING CONDITIONS FOR LEARNING
Transcript of Avoid Simple Solutions and Quick Fixes: Lessons Learned from a ...

AVOID SIMPLE
SOLUTIONS AND
QUICK FIXES
Paper submitted to Closing the School Discipline Gap:
Research to Practice
January 2, 2013
Authors:
David M. Osher, Ph.D., Vice President, American Institutes for
Research (AIR)
Jeffrey M. Poirier, M.A., Senior Researcher, AIR
G. Roger Jarjoura, Ph.D., Principal Researcher, AIR
Russell Brown, Ph.D., Deputy Chief of Organizational Accountability,
Cleveland Metropolitan School District
Kimberly Kendziora, Ph.D., Principal Researcher, AIR
LESSONS LEARNED
FROM A
COMPREHENSIVE
DISTRICTWIDE
APPROACH TO
IMPROVING
CONDITIONS FOR
LEARNING
Avoid Simple Solutions and Quick Fixes: Lessons Learned from a Comprehensive Districtwide Approach to Improving Student Behavior and School Safety
January 2, 2013 Page i
CONTENTS
ACKNOWLEDGMENTS ..................................................................................................................... ii
ABSTRACT ...................................................................................................................................... iii
I. INTRODUCTION ........................................................................................................................ 1
II. LITERATURE AND THEORY ....................................................................................................... 3
III. CLEVELAND DISTRICT CONTEXT AND INTERVENTIONS ........................................................ 4
IV. FINDINGS ................................................................................................................................ 12
V. RECOMMENDATIONS ............................................................................................................... 20
VII: CONCLUSION ........................................................................................................................ 22
REFERENCES ................................................................................................................................. 24
TECHNICAL NOTES ....................................................................................................................... 31
LIST OF FIGURES
Box 1. Recommendations of AIR’s Audit .......................................................................................5 Figure 1. Cleveland Metropolitan School District Achievement Model .........................................7
Box 2. Information from CMSD Planning Center Brochure .........................................................11 Figure 2. Analytic Model ...............................................................................................................13
Avoid Simple Solutions and Quick Fixes: Lessons Learned from a Comprehensive Districtwide Approach to Improving Student Behavior and School Safety
January 2, 2013 Page ii
ACKNOWLEDGMENTS
Some of the research presented here was funded by the NoVo Foundation, Cleveland
Metropolitan School District, and the American Institutes for Research (AIR) Human and Social
Development Program. This paper draws upon analytic work of Drs. Sandy Eyster (AIR) and
Ann-Marie Faria (AIR), Dr. Laura Salganik’s (AIR) quality review, and Dr. Abraham
Wandersman’s (University of South Carolina, Department of Psychology) review of the
implementation section.

Avoid Simple Solutions and Quick Fixes: Lessons Learned from a Comprehensive Districtwide Approach to Improving Student Behavior and School Safety
January 2, 2013 Page iii
ABSTRACT
Urban schools are often viewed as disorderly and unsafe and often have poor conditions for
learning that affect student attendance, behavior, achievement, and safety. These conditions
include the experience of emotional and physical safety, connectedness to and support from
caring adults and peers, peer social and emotional competence, and academic engagement and
challenge. Although connectedness and appropriate mental health services can improve safety as
well as conditions for learning, many school districts focus on control through hardware and
security officers. This paper examines the Cleveland Metropolitan School District’s (CMSD)
systematic efforts during the past four years that incorporated regular use of school-level data to
improve safety, order, and the conditions for learning. These districtwide approaches included
implementing (1) an empirically validated social and emotional learning program that helps
students in elementary grades to understand, regulate, and express emotions (Promoting
Alternative Thinking Strategies, or PATHS); (2) student support teams, a widely used planning
model for students who exhibit early warning signs (including those related to attendance and
behavior) with a referral process to respond to student needs in a timely, coordinated, and
effective manner; and (3) planning centers, which replaced punitive in-school suspension with a
learner-centered approach to discipline that focuses on student needs and helps students learn
self-discipline, and aligns with the student support teams and CMSD’s focus on social and
emotional learning.
Five sets of findings illustrate the importance of CMSD’s efforts between 2008–09 and 2010–11
(and, in one case, 2010–12):
Improved conditions for learning for students in Grades 5 to 12.
Improved teacher ratings of student social competence and attentiveness, but not in
aggression, for students K–5 during the 2010–12 academic years.
Improved student attendance districtwide, which increased 1.5 percentage points.
Improved student behavior—the average number of reported suspendable behavioral
incidents per school declined from 233.1 to 132.4, including reductions in:
o Disobedient/disruptive behavior (from 131.8 to 73.9).
o Fighting/violence (from 54.5 to 36.4).
o Harassment/intimidation (from 12.8 to 5.6).
o Serious bodily injury (from 13.3 to 5.8).
Reduced use of school removal:
o Out-of-school suspensions decreased districtwide by 58.8%.

Avoid Simple Solutions and Quick Fixes: Lessons Learned from a Comprehensive Districtwide Approach to Improving Student Behavior and School Safety
January 2, 2013 Page iv
Our analyses suggest the importance of implementation quality for PATHS, student support
teams, and planning centers. Implementation quality, as reported by CMSD staff, was related to
changes in behavior and conditions for learning. For example:
Disciplinary incidents decreased more in schools with “medium” or “high”
implementation of PATHS (35.9%), student support teams (49.1%), and planning centers
(51.4%).
Perceptions of safety increased more where these three interventions were rated higher in
terms of their implementation quality.
Although our data suggest that the rate of suspension and expulsion decreased, disparities may
remain. Our analyses of Office for Civil Rights (OCR) data for the one year available (2009–10)
determined that the relative risk of experiencing suspension or expulsion for male and female
Black and Latino students with or without disabilities was higher than for their White peers. In
addition, the relative risk increased as disciplinary actions moved from less serious to more
serious responses (i.e., from in-school suspension to one out-of-school suspension, more than
one out-of-school suspension, and expulsion).
Improved conditions for learning as well as student support interventions can reduce reliance on
suspension and expulsion while fostering safer, more productive school communities. The paper
concludes with six recommendations to improve conditions for learning, provide effective
student support, and reduce discipline-related disparities:
(1) External audits of conditions for learning and disparities in school discipline and safety.
(2) Use of conditions for learning data to inform improvement efforts.
(3) Three-tiered approaches to prevention and addressing mental health challenges, including
those related to trauma.
(4) Evidence-based social and emotional learning programming.
(5) Broadened incentives for investing in student support
(6) Improved implementation quality of interventions and greater cultural competence of
school staff.
Transforming the conditions contributing to exclusionary discipline will often require a
sustained, multi-year effort. This should begin with an understanding that a culture of change,
unlike “quick fixes” like metal detectors, requires an extended period of time to engage
stakeholders, cultivate their buy-in, and develop and implement an effective plan.

Avoid Simple Solutions and Quick Fixes: Lessons Learned from a Comprehensive Districtwide Approach to Improving Conditions for Learning
January 2, 2013 Page 1
I. INTRODUCTION
Urban schools are often viewed as disorderly and unsafe and often have poor conditions for
learning that affect student attendance, behavior, achievement as well as safety. When positive,
these conditions include the experience of emotional and physical safety, connectedness to and
support from caring adults and peers, peer social and emotional competence, and academic
engagement and challenge. Although connectedness, mental health support, and the provision of
appropriate mental health services can improve safety as well as the conditions for learning,
many school districts focus on control through hardware and security officers. Policymakers and
researchers need more information to understand how interventions intended to improve school
climate and conditions for learning can reduce reliance on suspension and expulsion while
fostering safer school communities. They also need information on how to support the effective
implementation of practices that reduce or eliminate exclusionary discipline and improve
conditions for learning. The Cleveland Metropolitan School District (CMSD) has experienced
challenges in its schools, but has undertaken multiple efforts to improve teaching and supports
for students to improve their social competence, behavior, and academic growth. Both CMSD’s
successes as well as the implementation challenges that they have faced provide a proof point
that conditions for learning can be improved and that alternatives to punishment and exclusion
can be developed. The CMSD experience as well as this paper’s findings demonstrate that
policymakers and school leaders should look beyond “quick fixes” for school safety issues, such
as zero tolerance policies, armed police in schools, and metal detectors if they want to improve
discipline, reduce removal from opportunities to learn, and improve student well-being.
These analyses are rooted in an extensive body of research that demonstrates the importance of
safe and orderly schools (Cornell & Mayer, 2010; Osher, Dwyer, Jimerson, & Brown, 2012).
Students want to attend safe schools where they can learn; families want their children to attend
safe and productive schools; teachers, staff, and administrators want to work in safe
environments that minimize distractions; and public policy mandates safety and achievement.
The frequent response to the lack of school safety and the presence of student disorder is control-
oriented approaches that include surveillance through technology, punishment, and exclusionary
discipline (Borum, Cornell, Modzeleski, & Jimerson, 2010; Gagnon & Leone, 2001; Osher,
Bear, Sprague, & Doyle, 2010). This control-oriented approach is particularly pervasive in urban
settings serving large numbers of students of color who experience the adversities of poverty and
racism (Gregory, Skiba, & Noguera, 2010; Losen & Skiba, 2010).
A series of Federal reports, based on expert reviews and released by President Clinton and his
Surgeon General, Attorney General, and Secretary of Education, called for an alternative public
health approach to creating safe and orderly schools at a time when school discipline and
violence was a public priority (Dwyer & Osher, 2000; Dwyer, Osher, & Warger, 1998; U.S.
Department of Health & Human Services, 1999). These reports recommended a data-driven,
three-tiered approach to promoting safety and order—universal prevention, early intervention for
students who were at elevated levels of risk, and individualized interventions for students who

Avoid Simple Solutions and Quick Fixes: Lessons Learned from a Comprehensive Districtwide Approach to Improving Conditions for Learning
January 2, 2013 Page 2
were at the highest level of risk. This approach has been applied to efforts to address the
“pipeline to prison” and school dropout for children of color (Osher, Woodruff, & Sims, 2002;
Osher, Sandler, & Nelson, 2001; Osher, Morrison, & Bailey, 2003), was incorporated in the Safe
Schools, Healthy Students Initiative (Furlong, Paige, & Osher, 2003), and was called for in
response to the December 14, 2012 school shootings at Sandy Hook Elementary School (Astor et
al., 2012). However, this approach is contested and has not been institutionalized in the policies
and procedures of many schools and districts where many stakeholders still believe that control-
oriented approaches are necessary in their communities due to the high level of risk factors that
affect their students, and that “soft” youth development approaches will not work in their
community context.
CMSD, which struggles with many of these risk factors, offers a powerful example to those who
say that it is not possible in their community. Currently, 100% of CMSD’s students receive free
lunch at school. The majority of CMSD students are also students of color, and more than 80%
of the students are Black or Latino. Moreover, in 52 of the district’s 99 schools, students of color
make up more than 90% of the student body. Beginning in the 2008–09 school year, CMSD
adopted a three-tiered public health approach to address the impact of high levels of community
and school risk factors on school safety and order, to reduce the number of suspendable
behavioral incidents and to improve attendance and conditions for learning districtwide. This
paper examines CMSD’s efforts during the past four years to improve conditions for learning
and safety. These efforts were undertaken in response to a districtwide audit that the American
Institutes for Research (AIR) conducted for CMSD and the Mayor of Cleveland in 2007–08 to
assess the district’s needs regarding student connectedness, safety, student support, and other
conditions for learning.
This paper focuses on the four districtwide efforts that CMSD has undertaken to improve student
social competence, behavior, and other outcomes. These efforts have included: (1) data-informed
planning that uses data on conditions for learning, (2) implementing the Promoting Alternative
Thinking Strategies (PATHS) social and emotional learning program in Prekindergarten to
Grade 5, (3) establishing student support teams to review student needs and connect students to
appropriate resources, and (4) opening planning centers as an alternative to in-school suspension
and to reduce escalation of negative student behavior as well as out-of-school suspension.
Analyses enable us to draw conclusions about the some of the effects of these efforts on safety,
order, and other conditions for learning and to determine the extent to which higher-quality
implementation of three of these interventions—PATHS, student support teams, planning centers
(which are described in more detail later in the paper)—is associated with improved discipline
and reduced suspensions, and related gender and racial/ethnic disparities. Specifically, the paper
addresses the following questions:
1. Overall, what changes in student attendance, behavior, and conditions for learning are
evident between 2008 and 2011?
Have conditions for learning become more positive?
Have suspendable behaviors decreased?
2. What changes in elementary students’ social and emotional competence, attention,
and aggression occurred between 2010 and 2012?
Avoid Simple Solutions and Quick Fixes: Lessons Learned from a Comprehensive Districtwide Approach to Improving Conditions for Learning
January 2, 2013 Page 3
3. Do these outcomes and perceptions vary by student characteristics (e.g.,
race/ethnicity, gender, disability status)?
4. To what extent are changes in student behavior and student reports of conditions for
learning associated with the quality of implementation of three interventions:
PATHS, student support teams, and planning centers?1
The analyses draw upon three years of data from surveys of student perceptions of conditions for
learning along with academic achievement, attendance, discipline, and safety data, which we
linked at the student level where possible.
Our analyses suggest both the value of implementing a three-tiered, data-driven public health
approach and the relationship between implementation quality and outcomes. We first provide an
overview of key literature and theory that underlies the significance of this work. We then
describe the Cleveland context more fully, including CMSD’s response to violence and
inadequate school discipline. This includes the research background for the use of conditions for
learning data in planning and for the overall approach to each of three interventions—PATHS,
student support teams, planning centers—that CMSD implemented districtwide to realize the
public health approach (Gordon, 2012). We then describe changes in student outcomes and
school conditions, along with more findings related to the effects of implementation quality, and
conclude the paper by exploring its implications for education policy and practice.
II. LITERATURE AND THEORY
The importance of safe, supportive schools and communities is particularly great for children
who experience the adversities of poverty (Gregory et al., 2010; Kendziora & Osher, 2009).
Schools, districts, and communities often struggle to address the needs of these students, and
many of these students attend schools where staff are overwhelmed by the unmet student needs
(Bryk, Sebring, Allensworth, Luppescu, & Easton, 2010; Kendziora & Osher, 2009) and where
neither staff nor students receive the supports necessary to meet high behavioral and academic
standards (Osher, Sandler, & Nelson, 2001). These schools sometimes have been characterized
as truly disadvantaged schools (Sebring, Allensworth, Bryk, Easton, & Luppescu, 2006). These
schools often experience poor conditions for learning and disproportionate levels of disciplinary
challenges and violence.
The typical responses to such problems are either suppression through punitive and exclusionary
strategies, which have little empirical support and have even been demonstrated to exacerbate
problems (Borum, et al, 2010; Sulzer-Azaroff & Mayer, 1991), or throwing interventions at
problems without a systematic plan. Examples of suppression include zero tolerance, which has
little evidence to support its effectiveness (American Psychological Association Zero Tolerance
Task Force, 2008; Cornell & Mayer, 2010; Gladden, 2002; Mayer & Leone, 2007), and the
repeated use of suspension from school, which has been shown to contribute to academic failure,
student disengagement from school, antisocial behaviors, and dropout (Gregory, et al, 2010;
1 The fourth intervention, districtwide data-informed school planning, is not included here because all schools
participated in this effort during regularly scheduled planning meetings with central office leadership.

Avoid Simple Solutions and Quick Fixes: Lessons Learned from a Comprehensive Districtwide Approach to Improving Conditions for Learning
January 2, 2013 Page 4
Harvard University, Civil Rights Project, 2000; U.S. Department of Education, National Center
for Education Statistics, 2006). Examples of throwing interventions at problems are the
proliferation of un- or under-aligned prevention programs, many of which lack a scientific base,
in schools (Gottfredson & Gottfredson, 2001). This contributes to “Christmas tree” schools and
districts (Bryk, Sebring, Kerbow, Rollow, & Easton, 1998; Fullan, 2001) with lots of
uncoordinated programs.
These same challenges can exist at a community level as well. Urban communities tend to have
high levels of poverty, which place children at risk for emotional and behavioral problems at
school and in the community. Cleveland’s estimated poverty rate for residents under 18 was
53.9% percent in 2011 (U.S. Census Bureau, 2011). Excessive lead exposure also places children
at risk for academic problems and anti-social behavior, and Cleveland’s rate at the time of AIR’s
audit was 17%, compared with 2% nationally (Center for Health Affairs, 2007; Osher et al.,
2008). Services in many communities are fragmented (Osher, 2002), which may contribute to a
reliance on punitive and reactive approaches to school discipline and safety that lack empirical
support (Osher, Quinn, Poirier, & Rutherford, 2003; U.S. Public Health Service, 2000).
III. CLEVELAND DISTRICT CONTEXT AND INTERVENTIONS
The Cleveland Metropolitan School District (CMSD) currently has 41,000 students, 68.0% of
whom are African American, 14.6% of whom are White, and 13.2% of whom are Latino
(Gordon, 2012). Unlike almost all other large urban districts, 100% of CMSD students receive
free or reduced price lunch, with 2,877 homeless students during the 2011–12 school year and
more than one third of students changing their school of enrollment during the school year due to
poverty-driven mobility (Gordon, 2012).
A 2008 study (Osher et al., 2008) documented risk factors for poor discipline and violence,
which make CMSD’s successes particularly relevant to those who say not work in their school,
district, or community, due to their school, district’s or community’s level of need. These risk
factors included:
Reactive, punitive, and inconsistent approaches to discipline at home and in school,
which set the stage for behavioral problems (Mayer, 2001; Mayer & Sulzer-Azaroff,
1991; Patterson, Reid, & Dishion, 1992; Strauss, 1991).
High levels of long-term poverty, which make adverse childhood experience more likely
and increase the likelihood that children will arrive at school with inadequate relationship
and self-regulatory skills.
High rates of lead poisoning and lead effect compared to other U.S. cities. These
toxicities place students at risk for academic problems and anti-social behavior
(Needleman, McFarland, Ness, Fienberg, & Tobin, 2002). The percentages in 2006 were
2% nationally, and between 17% and 21% in Cleveland (Center for Health Affairs, 2007;
Environmental Health Watch, n.d.).
Poor conditions for learning in schools. For example, compared to Chicago where the
same survey was administered, Cleveland students felt less safe, less supported by

Avoid Simple Solutions and Quick Fixes: Lessons Learned from a Comprehensive Districtwide Approach to Improving Conditions for Learning
January 2, 2013 Page 5
teachers, and viewed their fellow students as having poorer social and emotional
competencies (Osher et al., 2008).
Relatively high student engagement in risky behavior. According to CMSD’s 2004 Youth
Risk Behavior Survey (YRBS) of students in Grades 9–12, significantly more students
(43.7%) reported being in a physical fight during the 12 months prior to taking the survey
than was reported at the national level (33.0%); 22.5% of males and 13.1% of females
reported they carried a weapon to school during the 30 days prior to the survey. In
addition, according to CMSD’s 2008 YRBS of students in Grades 7 and 8, 10.8% of male
and 6.6% of female students carried a weapon to school during the 30 days prior to the
survey and 44.7% of males and 32.0% of females reported being in a physical fight on
school property at least once during the 12 months preceding the survey (Case Western
Reserve University, n.d.).
Many schools where the mental health needs of students overran the capacity of schools.
In these types of schools, the behavior of students with unaddressed mental health needs
drives staff attention so that staff members experience the school as being out of
control—the school focuses on fighting, rather than preventing, “fires” and on
punishment rather than on prevention (Kendziora & Osher, 2009; Osher et al., 2008;
Sebring, et al, 2006; Turnaround for Children, 2012).
Cleveland started to address these
concerns after a shooting when a student
suspended for fighting came to school
with a gun, shot two adults and two
students, and killed himself. This
shooting took place at a small high
school with a problem-based technology-
focused curriculum, funded by the Gates
Foundation. Cleveland’s first response
was a $3.4 million dollar investment in
metal detectors and a $3.7 million
investment in new security officers,
which in the words of a city council
member, “demonstrate[d] that the district
is finally getting tough on crime in the
schools”—what a blogger described as
“hallways full of students during classes,
instead of in class…. lots of disrespectful
students cursing and disrespecting
teachers in class” (Turner, 2007).
However, Cleveland did not stop there.
Its leadership distinguished between
“hardware” and “Humanware,”
Cleveland commissioned an audit conducted by AIR to assess the quality and sufficiency of
existing health and human services provided to CMSD students. Following a comprehensive
Box 1. Recommendations of AIR’s Audit
Build a climate for change and sustain it over multiple
years using data on a small number of metrics to refine
interventions and enhance the CMSD’s approaches to
improving student outcomes and well-being.
Use data for planning, monitoring and evaluation.
Employ a three-tiered approach to building conditions for
and capacities to learn and teach.
Avoid single solutions or unaligned multiple solutions for
complex, but interrelated problems.
Eliminate ineffective or counterproductive practices and
behaviors.
Align promotion and prevention, early intervention and
treatment in a manner that will both address immediate
needs as well as prevent the incidence and magnitude of
problems.
Support the ability of schools, agencies and staff to
systematically implement proven practices and programs
with quality.

Avoid Simple Solutions and Quick Fixes: Lessons Learned from a Comprehensive Districtwide Approach to Improving Conditions for Learning
January 2, 2013 Page 6
assessment, the audit made a number of key recommendations, which were grounded in
previously cited research (see Box 1; Osher et al., 2008).
Cleveland implemented many of the audit’s recommendations and sustained that implementation
through the “Great Recession,” loss of revenue and closing schools due to decreases in student
enrollment, staff layoffs, the implementation of a transformation plan (which incorporated
Humanware) and the retirement of the Chief Executive Officer (CEO). CMSD’s sustained effort
reflected high-level support from the district’s CEO, Cleveland’s mayor, Cleveland Teachers
Union (CTU), and a school board committed to the effort, which was also supported by an
influential local newspaper, the human services community, and the largest local philanthropy.
The Chief Academic Officer (CAO) was ultimately responsible for implementation and actively
involved in this work. He distributed leadership for this work to a Humanware Executive
Committee, which included managers of student support services, representatives of the chief of
security, who actively supported this work, and members of the CTU, who played an important
role in designing and operationalizing the interventions.
Cleveland chose to implement its activities systemically and universally from the beginning.
This garnered the attention of more of the district community, and may have led to the ability to
sustain and extend the effort through tough times. However, it also meant that variable
implementation quality ensued. Some schools and staff were innovators and early adopters,
embracing the new ideas and more readily understanding the underlying principles that framed
the new approaches. Others did not initially embrace or understand the underlying logic of the
new approaches, or passively resisted new expectations.
The current CMSD Academic Achievement Planning (AAP) model for improving student
achievement is directly influenced by broadly applied public health research (Dwyer & Osher,
2000; Vaughn, 2006; Venkatesh, 1997; Zenere & Lazarus, 2009) and employs a three-tier
framework (the public health triangle) for promotion and prevention (Figure 1). At the bottom
tier, the model focuses on universal promotion and prevention strategies designed to build a
schoolwide foundation of resources and supports planned for all learners. In the middle tier the
model focuses on early intervention strategies for learners who exhibit the need for additional
levels of assistance and support. The top tier focuses on providing intensive, coordinated, and
individualized interventions to those learners exhibiting the need for significant assistance and
support.
Within both the first and second tiers, the model specifically considers strategies and resources
associated with typical academic achievement planning (e.g., written curriculum, identified
instructional resources). Unlike academic improvement strategies typically employed by U.S.
school districts, however, the CMSD model also intentionally considers strategies and resources
that affect conditions for learning (e.g., levels of student support, social and emotional learning
skills, etc.) as well. CMSD’s AAP approach splits the public health triangle down the center,
with one side organized around academic interventions and supports and the other side organized
around the social and emotional conditions for learning. At the top tier, traditional academic
achievement planning and conditions for learning are integrated to facilitate individualized
supports for students with the greatest need.

Avoid Simple Solutions and Quick Fixes: Lessons Learned from a Comprehensive Districtwide Approach to Improving Conditions for Learning
January 2, 2013 Page 7
Figure 1. Cleveland Metropolitan School District Achievement Model
This model for academic improvement serves as a frame to unite many different stakeholders in
the quest to rapidly and significantly improve conditions for learning and academic achievement.
Members from various departments of the district’s organizational structure are able to quickly
unite their varied work using this model. Key elements in Cleveland’s Humanware
implementation were (and are):
1. Using conditions for learning student survey data to frame planning, monitoring, and
evaluation for all students and schools (universal).
2. Implementing a universal evidence-based SEL program (PATHS) in all elementary
schools (universal).
3. Building an early warning system and replacing in-school suspension with planning
centers (universal for students whose attendance and behavior indicates that they are at
are at risk).
4. Replacing ineffective special education-driven intervention teams with student support
teams (universal for students who are at risk and at elevated levels of risk).
These four elements were recently presented by CMSD’s CEO as part of a plenary presentation
at the U.S. Department of Education’s meeting on Building and Sustaining Capacity to Improve
Conditions for Learning (Gordon, 2012). The following is a brief description of schoolwide
planning, PATHS, student support teams, and planning centers. This descriptive information on
CMSD’s approach to these interventions, which we now present, is important as other policy and
decision makers think about their local efforts and more comprehensive efforts to address student
behavior and school safety.
Avoid Simple Solutions and Quick Fixes: Lessons Learned from a Comprehensive Districtwide Approach to Improving Conditions for Learning
January 2, 2013 Page 8
Data-Informed Schoolwide Planning That Included Data on Conditions for Learning
Schoolwide planning is important to identify needs and objectives, develop plans for addressing
the needs and realizing objectives, monitoring and evaluating results, and making continuous
improvement (Osher, et al., 2004). This process should be data informed and include data both
on academic outcomes and the factors necessary to realize these outcomes (Johnson, Kendziora,
& Osher, 2012). Failure to include metrics regarding how students experience the school
environment can lead schools to ignore those aspects of school climate that are particularly
important to engagement and learning. Conditions for learning are those aspects of the student’s
school-based experience and perception that, in interaction with student and teacher academic
and social-emotional competencies, affect motivation, engagement, learning, and achievement
(Durlak, Weissberg, Dymnicki, Taylor, & Schellinger, 2011; Fredricks, Blumenfeld, & Paris,
2005; Goodenow, 1993; McNeeley, Nonnemaker, & Blum, 2002; Osher & Kendziora, 2010;
Osher et al., in press; Osher, Coggshall, et al., 2012; Osher et al., 2007; Osterman, 2000; Wentzel
& Wigfield 1998). These conditions, which were developed in consultation with an expert panel
of researchers and practitioners, are:
The experience of physical and emotional safety.
The experience of connectedness and support.
The experience of challenge.
Peer social and emotional competence (Osher & Kendziora, 2010).
These conditions can be measured in an efficient, reliable, and valid manner through a relatively
short survey that students can complete in 15 minutes (Osher & Kendziora, 2010). School reports
for the survey are disaggregated to analyze data by gender, ethnicity, English Language Learner
(ELL) and special education status, and grade.
The Academic Achievement Planning (AAP) model is the Cleveland Metropolitan School
District’s (CMSD) planning approach, which values equally planning for social and emotional
conditions for learning and academic achievement. Cleveland’s AAP process incorporates the
disaggregated conditions for learning data2 in its school and district planning process, which is
implemented at the school level by a team that at minimum includes the principal, the CTU
chapter chair, and three teachers (Gordon, 2009). Although teams varied in how much attention
they gave to the data and, once they did, they also varied in their capacity to adapt interventions
to the data, the teams began orienting their planning to social and emotional data, and this led to
interventions such as mentoring, class meetings, and targeting of supports to student subgroups
who appeared to experience poor conditions for learning. For example, during the 2008–09
school year, some schools used the first round of conditions for learning data to address a lack of
student connectedness by adopting or adapting student and adult mentoring strategies. Over time,
the district enhanced its support for the data-informed schoolwide planning process, and this
2 These data included results by scale—Challenge, Peer Social-Emotional Climate, Safe and Respectful Climate,
Student Support—including the percentage of students whose responses indicated the school “needs improvement,”
is “adequate,” or is “excellent” on the given scale. Within each scale, data were disaggregated by grade level as well
as student characteristics (race/ethnicity, gender, English Language Learner status, disability status).

Avoid Simple Solutions and Quick Fixes: Lessons Learned from a Comprehensive Districtwide Approach to Improving Conditions for Learning
January 2, 2013 Page 9
enhanced the breadth and depth of use of the conditions for learning data.
Universal Social and Emotional Learning in Elementary Schools
Social and emotional learning (SEL) includes acquiring and mastering skills to recognize and
manage emotions, develop caring and concern for others, establish positive relationships, make
appropriate decisions, and handle challenging situations effectively (Elias et al., 1997). AIR’s
Humanware Audit recommended universal SEL in prekindergarten through Grade 12, to be
implemented beginning in the 2009–10 academic year. Cleveland chose to first implement SEL
at the primary school level due to limited resources, but also because an early intervention
approach to social-emotional and behavior approaches is considered a best practice. After a
planning process that involved teachers and the CTU as well as community agencies and pupil
services professionals, the CMSD selected Promoting Alternative Thinking Strategies (PATHS),
an empirically validated program that had been implemented successfully in schools that were
demographically similar to Cleveland (Wright, Lamont, Wandersman, & Osher, in press). The
PATHS curriculum, delivered by the classroom teacher, is divided into three separate units: self-
control, feelings and relationships, and interpersonal cognitive problem solving. Students learn to
understand, regulate, and express emotions. PATHS is used to teach students to recognize the
feelings of others, to relate the experiences of others to themselves, to develop empathy for
others, and to understand how the behaviors of others can affect their own emotions.
CMSD trained pre-K through Grade 2 teachers on PATHS to implement the program in 2009–
10, and did the same for with Grade 3–5 teachers in 2010–11. Coaching was an important part of
the implementation strategy, but Cleveland’s financial constraints limited the number of coaches
hired (7 rather than the 13 recommended by the developer), delayed their hiring, and prevented
their rehiring for 2011–12. Training was also challenged by logistical problems, exacerbated by
the rehiring of teachers during the course of the year. Still, PATHS became part of the education
of many elementary school students via a coherent districtwide implementation strategy.
Student Support Teams
The student support team model that CMSD implemented is a widely used planning model for
students who exhibit early warning signs. Intervention requires a referral process that can
respond to student needs in a timely, coordinated, and effective manner. The model was
recommended in Safeguarding Our Children: An Action Guide (Dwyer & Osher, 2000); which
was vetted by 26 national organizations and by the expert panel convened at the request of
President Clinton to address the warning signs of school violence (Dwyer, Osher, & Warger,
1998). In 2008–09, CMSD replaced a cumbersome special education planning process, which
focused on identification rather than on consultation and referral, with the student support team,
with one team in each school. The team meets weekly to discuss students’ academic problems
and problems such as tardiness, behavior issues, or difficulties blocking successful learning. The
student support team’s goal is to address students’ problems in a timely manner to address
warning signs and help them succeed and achieve in school.
Each student support team is made up of three staff: a building administrator, qualified teacher,
and assigned support staff member (e.g., school psychologist, school counselor or school social
worker). The team uses pre-referral interventions and coordinates with the Cleveland community

Avoid Simple Solutions and Quick Fixes: Lessons Learned from a Comprehensive Districtwide Approach to Improving Conditions for Learning
January 2, 2013 Page 10
agencies that provide intensive school-based, coordinated mental health services to students.
Student support team referrals can be made by a student’s teacher, school staff member, external
agency partner, parent, principal, or the student himself/herself. The referral is assigned to a
school staff member who has the most knowledge of the student’s functioning.
The student support team protocol for meetings has the following guidelines.
Assess the problem, review collected information, and identify and prioritize
referral concerns to develop appropriate intervention strategies.
Inventory and prioritize student strengths with the goal of employing a positive
approach that uses appropriate incentives to increase the likelihood that a student
accepts and engages with the intervention strategies.
Review baseline data related to the target behavior or difficulty and define the
concern in observable/measurable terms (e.g., days absent, instances tardy, analysis of
grades over time).
Set the goals and spell out the process for monitoring the student’s progress.
Design the intervention(s) and designate who will implement (e.g., bus aide, teacher)
— what is the intervention, where is it used, how often will the intervention take place,
and what is the target success rate or level; and provide the Intervention Tracking
Form to the individual implementing the intervention. This is to be completed
regularly while the intervention is implemented.
Establish a method for measuring and review by summarizing the case to ensure
that stakeholders are clear on individual roles and intervention plan, reviewing the
procedures for evaluating the intervention (method of determining success), and
selecting date for follow-up meeting, if necessary.
Implementation required coordination with community agencies and redeploying CMSD’s
existing mental health professionals to maximize their ability to support these school-based
teams. Challenges to implementation have included high levels of need at some schools which
contributed to backlogs in handling of student support team referrals. In addition, layoffs of
social workers diminished the number of professionals with mental health expertise. CMSD tried
to address this decreased capacity by producing training materials, providing training, and central
office efforts to monitor quality.
Planning Centers
CMSD replaced ineffective in-school suspension with planning centers that employ social and
emotional learning strategies. These strategies use the Promoting Alternative Thinking Strategies
(PATHS) concepts in schools with Grades K–8, and focus on student’s learning to self-manage.
The planning center model was first developed in Rhode Island and examined in a number of
qualitative studies (Quinn, Osher, Hoffman, & Hanley, 1998; Woodruff et al., 1999). The
planning center instructional aides (PCIA), who formally staffed in-school suspension rooms,
now provide support to students in the planning centers and assume the role of a supportive
resource instead of disciplinarian and gatekeeper. The planning centers were implemented in

Avoid Simple Solutions and Quick Fixes: Lessons Learned from a Comprehensive Districtwide Approach to Improving Conditions for Learning
January 2, 2013 Page 11
2010–11, with training of PCIAs that year. In September 2010, 135 PCIAs received training on
the planning center model, understanding behavior, de-escalation strategies, and their PCIA role.
In February 2012, principals and PCIAs participated in a presentation focusing on the transition
from in-school suspension to the planning center model, progress made as of that point, and data
on implementation quality.
The planning center represented a fundamental
reorientation of approaches to discipline from a
punitive and exclusionary one to a more learner-
centered one, by focusing on student needs,
providing a place to cool down, and using protocols
and resources to help students learn self-discipline.
The purpose of planning centers in CMSD is
described in the district’s planning centers brochure
for families and school staff, which is highlighted in
Box 2. As needed, students are referred to student
support teams for additional support. Students can
also refer themselves to planning centers, which
acknowledges that students may recognize the need
to appropriately “escape” a situation and go to a
safe, supportive environment. All PCIAs have the PATHS “problem solving sheet” and are
encouraged to use it as they work with students. Some high schools may also use PATHS
strategies and materials related to good decision making. The planning centers are a positive
alternative to inappropriate escalation of problem student behavior and disruption to the learning
environment.3
The district faced and addressed a number of challenges in implementing the planning center
model. In particular, the planning center model called for center staffing of a teacher, social
worker, school psychologist, or behavior specialist with several years of experience in behavioral
support programming. CMSD did not have the resources to do this. Instead the paraprofessionals
who had run in-school suspension rooms were retrained and redeployed to do this work with
intensive training from CMSD as well as support from clinical staff.
The PCIAs are the adults responsible for overseeing the planning centers and are expected to
take an interest in the students; express the belief that they are worthwhile; encourage them; and
treat them with empathy and respect, while remaining firm. The planning center is the last stop
before a student is removed from the building and the first stop when a student returns from
being suspended or involuntarily transferred. This may consist of a 15-minute assessment
between the PCIA and the student, which is an important part of transitioning students from
suspension or new enrollees to a school. By increasing acceptable behavior and decreasing
unacceptable behavior, PCIAs provide supports to students to ready them to return to their
classroom learning environment through use of de-escalation techniques and social problem
3 CMSD now also employs Ripple Effects, a computer-based social and emotional learning program, in its planning
centers. However, this tool, which was adapted to include the PATHS language, was not in place during the 2010–
11 school year.
Box 2. Information from CMSD Planning Center Brochure
The planning center provides support and
interventions for students, teachers and
families. These supports and interventions
will help prevent the escalation of
inappropriate student behaviors by
addressing academic, emotional, and/or
behavioral issues before they become crises.
The planning center will serve as an
alternative space within the school that
provides a temporary cooling down period as
well as provide intervention/alternative
coping strategies and resources for students.

Avoid Simple Solutions and Quick Fixes: Lessons Learned from a Comprehensive Districtwide Approach to Improving Conditions for Learning
January 2, 2013 Page 12
solving; teaching replacement behaviors, social skills, and anger management; applying safety
techniques and providing intensive interventions for aggressive behaviors; and working with
families.
Initially, some educators in some schools were not ready for this paradigm shift or lacked the
necessary capacity (e.g., knowledge), and treated the planning center as merely a renaming of in-
school suspension. Principals and teachers in some other schools expressed concern with the fact
that students could self-refer to the centers or sometimes came out smiling. Cleveland addressed
(and is still addressing) this through leadership of the chief executive officer and chief academic
officer, and the Humanware Executive Team and ongoing staff development.
IV. FINDINGS
The following analyses take into account CMSD’s efforts during the past four years to improve
students’ school experience, stemming from AIR’s 2008 districtwide audit to assess the district’s
needs regarding student connectedness, safety, student support, and other conditions for learning.
Building from baseline information on these conditions and examining implementation of the
aforementioned interventions put in place following the audit, we used analyses with multiple
years of data to answer the following core questions:
1. Overall, what changes in student attendance, behavior, and conditions for learning are
evident between 2008 and 2011?
Have conditions for learning become more positive?
Have suspendable behaviors decreased?
2. What changes in elementary students’ social and emotional competence, attention,
and aggression occurred between 2010 and 2012?
3. Do these outcomes and perceptions vary by student characteristics (e.g.,
race/ethnicity, gender, disability status)?
4. To what extent are changes in student behavior and student reports of conditions for
learning associated with the quality of implementation of three interventions:
PATHS, student support teams, and planning centers?4
Figure 2 displays the analytic model that guided the analyses.
4 Districtwide data-informed school planning is not included here because all schools participated in this effort
during regularly scheduled planning meetings with central office leadership.

Avoid Simple Solutions and Quick Fixes: Lessons Learned from a Comprehensive Districtwide Approach to Improving Conditions for Learning
January 2, 2013 Page 13
Figure 2. Analytic Model
This section begins with outcomes related to student attendance and behavior, followed by the
annual surveys of students that assess conditions for learning in CMSD schools. Next, we present
findings regarding elementary student social and emotional learning. We then present data on
variation of results by race, ethnicity, and gender. Finally, we examine the relationship between
some of these results and the implementation quality of PATHS, student support teams, and
planning centers. These data and analyses are backed by the technical notes that include tables
and supplementary detail for the analyses that follow.
Student Attendance and Behavior
Foremost, if we examine attendance and suspendable offenses, Cleveland’s efforts have been
fruitful, although results were tempered by the impacts of deficits, mandated budget cuts,
rightsizing the district, layoff, and labor-management conflict over the layoffs. For example:
The attendance rate district-wide increased 1.5 percentage points over the 3-year period.
The number of suspendable behavioral incidents reported by the schools in the district
declined from the 2008–09 school year (when the average number of incidents per school

Avoid Simple Solutions and Quick Fixes: Lessons Learned from a Comprehensive Districtwide Approach to Improving Conditions for Learning
January 2, 2013 Page 14
was 233.1) to the 2010–11 school year (when the average number of incidents per school
was only 132.4).5
There were statistically significant decreases in the district’s average number of reported
behavioral incidents per school in each of the following categories from 2008–09 to
2010–11:6
o Total incidents (233.1 in 2008–09 down to 132.4 in 2010–11).
o Disobedient/disruptive behavior (131.8 reduced to 73.9).
o Fighting/violence (54.5 reduced to 36.4).
o Harassment/intimidation (12.8 reduced to 5.6).
o Serious bodily injury (13.3 reduced to 5.8).
Incidents involving the combination of fighting, intimidation, and injury declined. The
median annual number of these types of incidents was 64 per school during the 2008–09
school year and only 38 per school two years later. We also saw changes at the extreme
ends of the distribution. During this same year, the 10th
percentile for the distribution of
violent incidents was 11 per school and the 90th
percentile was 189 per school. Two years
later, during the 2010–11 school year, the schools in the 10th
percentile had zero violent
incidents and those in the 90th
percentile had only 103 violent incidents.7
Out-of-school suspensions decreased 58.8% districtwide over the 3-year period from
21,119 during the 2008–09 school year to 8,694 in the 2010–11 school year.8
Analyses of subscales created from the Conditions for Learning Survey safe and respectful
climate scale suggest that students perceived the effects of these changes between the 2008–09
and 2010–11 school years:
When asked if they worried about violence in their schools and whether youth are bullied
and threatened in their school, students in Grades 5–8 reported lower levels of worrying
about violence and less bullying of students over the three-year period under examination
in this analysis. In contrast, students in Grades 2–4 and 9–12, particularly White and
female students, reported higher levels worrying about violence and more bullying of
students in their schools.9
When asked if they felt safe in school, students in Grades 5–8, particularly Black
students, reported more agreement with feeling safe over time. No significant differences
were found for students in Grades 9–12.10
5 See Tables 1 and 21 in the Technical Notes.
6 See Table 21 in the Technical Notes.
7 See Table 2 in the Technical Notes.
8 During the 2009–10 school year, the number of out-of-school suspensions was 11,752. Two years of data on
expulsions were available and showed little change (239 in 2008–09 and 249 in 2009–10). 9 See Tables 4, 5, and 8 in the Technical Notes.
10 See Tables 6 and 7 in the Technical Notes. We do not report results related to feeling safe at school for the Grade
2–4 Conditions for Learning Survey. The version of the survey for the younger students was shorter and did not
include all of the items for the subscale found on the surveys for the older students. When we examined the

Avoid Simple Solutions and Quick Fixes: Lessons Learned from a Comprehensive Districtwide Approach to Improving Conditions for Learning
January 2, 2013 Page 15
When students were asked whether students in the school were prepared to fight because
of arguments and insults, and whether there was a culture of putting other students down,
males reported significantly lower levels of agreement with statements that students in
the school were prepared to fight. This was particularly the case for males in Grades 5–8.
Students in Grades 9–12 also reported lower levels of agreement with statements that
students in the school were prepared to fight when faced with arguments and insults, but
the reductions over time were not statistically significant.11
Since CMSD’s enrollment decreased during the period, we conducted analyses to ensure that the
declines in disciplinary incidents were not simply a reflection of reductions in student
enrollment. We found that the distribution of school enrollment counts per school was rather
steady annually over the same three-year period.12
Also, we examined changes in enrollment and
changes in disciplinary incidents for individual schools, and we did not find a pattern that
suggests changes in enrollments drove changes in the prevalence of discipline problems. We
were as likely to find large decreases in incidents when there were small decreases in enrollment
as we were to find small decreases in the number of incidents in schools where there were large
decreases in enrollment.
Student Surveys of Conditions for Learning for Grades 5–12
The Conditions for Learning Survey has been administered annually since 2008 to students in
Grades 5 to 12. We analyzed these data from the 2008–09 to 2010–11 school years. Overall these
conditions improved over this period for students in Grades 5 to 12. As would be expected, there
was variation among schools and individual students. The following changes13
were evident.
Academic Challenge
26% of schools showed an increase in the percentage of students that reported “adequate”
or “excellent” academic challenge, compared to 15% that showed a decline.
Peer Social-Emotional Climate
33% of schools showed improvement in the percentage of students that reported
“adequate” or “excellent” peer social and emotional competence, compared to 28% that
showed decreases.
Safe and Respectful Climate
44% of schools reported an increase in the percentage of students that reported
“adequate” or “excellent” conditions on this scale, while only 23% reported a decline.
This is particularly evident for the students in Grades 5–8.
reliability for the subscale with some of the items related to feeling safe at school, we calculated a Cronbach’s Alpha
of only 0.55, so we decided to exclude this subscale from our analyses. 11
See Tables 7 and 10 in the Technical Notes. We do not report results related to being prepared to fight because of
arguments or insults for the Grade 2–4 Conditions for Learning Survey. The survey version for younger students
was shorter and did not include the items for the subscale. 12
See Table 3. 13
Changes are noted if there was difference of at least 5 percentage points.

Avoid Simple Solutions and Quick Fixes: Lessons Learned from a Comprehensive Districtwide Approach to Improving Conditions for Learning
January 2, 2013 Page 16
Student Support
59% of schools showed an increase in the percentage of students that reported “adequate”
or “excellent” student support, compared to 9% that showed a decline.
Conditions for learning also appear to have an important relationship with academics and
attendance. We found that higher survey scores were associated with higher results on the Ohio
Department of Education Performance Index (PI)14
for schools during the 2008–09, 2009–10,
and 2010–11 school years. A multi-linear regression examining the relationship between the
survey data for all four scales together (Challenge, Safe and Respectful Climate, Peer Social-
Emotional Climate, Student Support) and the PI revealed that survey scores accounted for
approximately 62% of the variance in the high school PI scores. Combined survey scores also
accounted for approximately 62% of the variance in high school attendance. At the K–8 level,
the conditions for learning scores accounted for approximately 30% of the variance in PI scores,
over the same time period. When attendance was included in the model, the combination of
conditions for learning scores and attendance accounted for 69% of the variance in PI scores at
the high school level and for 46% of the variance in PI scores at the K–8 level. Taking into
account attendance in addition to survey scores improved our ability to predict scores on the PI.
Furthermore, we were able to predict PI scores even more effectively at the high school level
than we were at the K–8 level.
Findings for Elementary Students’ Social Competence
An evaluation of Promoting Alternative Thinking Strategies (PATHS) in CMSD occurred during
the 2010–11 and 2011–12 school years (Faria, Kendziora, Brown, & Osher, 2012). Teachers in
Prekindergarten through Grade 5 were asked to complete surveys in the fall and spring of the
2010–11 and 2011–12 school years. These surveys asked teachers to rate the social and
emotional competence, attention, and aggression of a random sample of students in their
classrooms (6 students in the first year, 7 students in the second). Spring surveys asked
additional questions about PATHS implementation, as well as satisfaction with training and
overall teacher morale. Survey administration procedures varied (details are available in the
Faria et al. 2012 report). Response rates for the survey administrations were 24% and 42% in
2010–11 and 75% for each administration in in 2011–12.
The evaluation used different measures of change from fall to spring in 2010–11 and in 2011–12.
In Year 1, the aim was to produce a classroom-level estimate of outcome variables using six
randomly selected students; the investigators selected independent samples of students for the
fall and spring ratings and computed classroom-level estimates.15
In Year 2, the investigators
used a multi-level model to measure student change accounting for the clustering within schools.
In 2010–11, evaluators observed significant improvement from fall to spring for social
competence and attention, but did not see a significant change in aggression. In 2011–12, these
14
The PI provides an overall indication of how well students perform on the Ohio Achievement Tests in Grades 3
through 8 and the Ohio Graduation Test in Grade 10. 15
Using this method, the improvements for social competence and attention were both statistically significant (0.11
and 0.08 standard deviation units, respectively), but the increase in aggression (0.06 units) was not significant.

Avoid Simple Solutions and Quick Fixes: Lessons Learned from a Comprehensive Districtwide Approach to Improving Conditions for Learning
January 2, 2013 Page 17
findings were replicated, but in addition they saw a significant increase in aggression between
fall and spring. The findings for teacher-rated aggression were consistent with results from prior
studies documenting a normative increase from fall to spring. However, in classrooms with
better PATHS implementation, there was a smaller increase in aggression.
Subgroup Results
Analyses of subscales created from the Conditions for Learning Survey’s Safe and Respectful
Climate scale found significant difference for some student subgroups, between the 2008–09 and
2010–11 school years:
When asked if they worried about violence in their schools and whether youth are bullied
and threatened in their school, students reported less concern over time with significant
decreases among students in Grades 5–8, particularly male, Latino, and White students.16
Significant increases (representing more concern over time) were evident among students
in Grades 2–5 and high school students, particularly female and White students.17
When asked if they felt safe in school, students reported more agreement with feeling
safe over time, with significantly higher levels of agreement for male, female, and Black
students. There were significant increases among male, female, and Black students in
Grades 5–8, but no significant differences at the high school level.18
When students were asked whether students in the school were prepared to fight because
of arguments and insults, and whether there was a culture of putting other students down,
males in Grades 5–8 reported significantly lower levels of agreement with statements that
students in the school were prepared to fight.19
Analyses of the most currently available Office for Civil Rights disciplinary data provide more
specific details about behavioral outcomes and information on how student subgroups
experienced exclusionary school discipline during the 2009–10 school year—a halfway point for
most of our analyses. These data, which a scatter plot shows to be consistent with findings from
the other data we analyzed (see section C of the Technical Notes), suggest the continuation of
disparities in the implementation of exclusionary discipline for Black or Latino students. As we
move from less serious to more serious responses (i.e., in-school suspension, only one out-of-
school suspension, more than one out-of-school suspension), the overrepresentation of Black and
Latino students increases as the level of severity of response increases. These data, which are
presented in Tables 11–14 in the Technical Notes, show disparities in exclusionary school
discipline across racial and ethnic groups as well as difference between male and female
students. Three findings are most important here:
As we move from less serious to more serious responses the overrepresentation of Black
and Latino students increases as the level of severity of response increases (i.e., from in-
school suspension to only one out-of-school suspension, more than one out-of-school
suspension, and expulsion).
16
There were no significant decreases for Black students. 17
See Tables 4, 5, and 8 in the Technical Notes. 18
See Tables 6 and 9 in the Technical Notes. 19
See Tables 7 and 10 in the Technical Notes.
Avoid Simple Solutions and Quick Fixes: Lessons Learned from a Comprehensive Districtwide Approach to Improving Conditions for Learning
January 2, 2013 Page 18
The greatest disparities (in descending order and relative to White students in the
grouping) were for Black females with disabilities, Black females without disabilities,
Black males with disabilities, Black males without disabilities, Latinas with disabilities,
Latino males with disabilities, and Latino males without disabilities.
Among Black students with disabilities, the relative risk for males was still greater than
the relative risk for females. In most cases, this was also true for Black students with
disabilities and Latino students with or without disabilities.
Although these disparities are limited to the 2009–10 school year, they suggest a problem that
other studies have also identified. Specifically, race-neutral processes that reduce disciplinary
incidents may reduce base rates for disciplinary actions and the harms caused by suspension and
expulsion, but not disparities in discipline. Skiba, Horner, and colleagues’ study of PBIS (2011)
provides an example of this, as do studies of disparities in special education placement and other
areas that may be affected by implicit bias and lack of understanding of behaviors grounded in a
student’s cultural background (Artiles, Kozleski, Trent, Osher, & Ortiz, 2010; Osher, et al, 2012;
Pearson, Dovidio, & Gaertner, 2009).
Implementation Quality
How did variable implementation of the interventions vary with their intended outcomes?
Implementation quality is the key to determining whether evidence-based interventions improve
outcomes for students. Successful implementation depends not only on effective intervention
models with demonstrated positive outcomes, but also available technical support, including
training, coaching, and monitoring (Domitrovich & Greenberg, 2000; Durlak et al., 2011; Elliott
& Mihalic, 2004; Hall & Hord, 2011; Fox, Gottfredson, Kumpfer, & Beatty, 2004). Change is
hard, and most practitioners (e.g., teachers) do not commit to a new approach until they master it
and see and tangibly experience the outcomes. This is not easy when they lack the time or
support to make the new approach routine. Support includes leadership commitment, which was
available in CMSD at the highest levels, but not always from principals. This support must also
address factors that interfere with change, timely access to reliable and effective training and
ongoing coaching, quality improvement and assurance protocols and data to collect feedback for
course correction along the way, and reinforcement from colleagues and students (Wandersman,
Chien, & Katz, 2012). CMSD has moved forward in developing these components, but due to
organizational culture, the organizational structure, and economic constraints, they have only
developed slowly.
It is not surprising that implementation quality affected results, so it is important to understand
implementation quality when assessing intervention impact. As part of its quality improvement
efforts prior to AAP meetings, CMSD has asked principals to self-report their school’s progress
on implementing each of these interventions (low, medium, high). Using these data from the
2011–12 school year, we found an association between the decline in the number of incidents
and the quality of implementation of the Humanware strategies. The threshold appears to be with
those schools rated by their principals as “medium” or “high” implementation of Promoting
Alternative Thinking Strategies (PATHS), student support teams, and planning centers. For
schools rated as “medium” or “high” implementation, we found statistically significant decreases
from 2008–09 to 2010–11 in the number of behavioral incidents in each of five categories: (1)

Avoid Simple Solutions and Quick Fixes: Lessons Learned from a Comprehensive Districtwide Approach to Improving Conditions for Learning
January 2, 2013 Page 19
total incidents, (2) disobedient/disruptive behavior, (3) fighting/violence, (4) harassment/
intimidation, and (5) serious bodily injury. From 2008–09 to 2010–11, changes in disciplinary
incidents in schools with “medium” or “high” implementation of these three interventions as of
spring 2012 included the following:20
For “medium” or “high” PATHS implementation schools, the total number of
disciplinary incidents decreased, on average, 35.9%.21
For “medium” or “high” student support team implementation schools, the total number
of disciplinary incidents decreased, on average, 49.1%.22
For “medium” or “high” planning centers implementation schools in spring 2012, the
total number of disciplinary incidents decreased, on average, 51.4%.23
Similarly, when students were asked about their perception about whether the school is safe, we
found that, they reported increasingly higher perceptions of safety, and that pattern was
particularly evident where these three interventions were rated higher in terms of the quality of
their implementation. Furthermore, on the Conditions for Learning Survey scale where students
indicated whether peers in their school are often threatened, bullied, and teased, the lowest
ratings (i.e., more disagreement with the statements which indicate positive results) occurred
where planning centers implementation was rated “high,” where student support team
implementation was rated “medium” or “high,” and where PATHS implementation was rated
“medium” or “high.” As expected, we did not find these same results when the implementation
of these interventions was rated “low.”
Additional information on the relationship between implementation and outcomes comes from
an evaluation of PATHS (Faria et al., 2012, described earlier). Analyses that linked
implementation to student outcomes consistently found a positive and strong relationship
between higher levels of implementation (satisfaction with training, satisfaction with coaching,
overall levels of implementation, and teacher morale) and students’ social and emotional
competence and attention.
Satisfaction with training was significantly related to student social competence, attention, and
aggression in both years; satisfaction with coaching (applicable in 2010–11 only) was
significantly associated with both social competence and attention. An overall measure of
implementation was significantly associated with social competence and attention in both years,
but it was also related to aggression in 2011–12. In 2011–12, as teacher-rated implementation of
20
There is no statistically significant change in the numbers of incidents over the three-year period when the quality
of implementation is rated “low” in each of the three interventions. 21
See Tables 15, 18, 22, and 23 in the Technical Notes. Enrollment increased by 4.2% in these schools over the
same period. In schools rated as “low” PATHS implementation, the decrease in disciplinary incidents was 31.6%
with almost no change in enrollment. 22
See also Tables 16, 19, 24, and 25 in the Technical Notes. Enrollment increased by 0.2% in these schools over the
same period. In schools rated as “low” student support team implementation, disciplinary incidents decreased by
26.6% with a 5.9% increase in enrollment. 23
See also Tables 17, 20, 26, and 27 in the Technical Notes. Enrollment increased by 3.0% in these schools over the
same period. In schools rated as “low” planning centers implementation, disciplinary incidents decreased by 15.6%
with a 2.0% decrease in enrollment.

Avoid Simple Solutions and Quick Fixes: Lessons Learned from a Comprehensive Districtwide Approach to Improving Conditions for Learning
January 2, 2013 Page 20
PATHS increased, ratings of students’ aggression decreased. Teacher morale was significantly
associated with all three student outcomes in both years.
Dosage (number of PATHS lessons delivered) was related to students’ social competence in
2010–11, and both social competence and attention in 2011–12. The relatively weaker
relationship between dosage and student outcomes compared to the relationship of satisfaction
and student outcomes was consistent with prior findings (Conduct Problems Prevention Research
Group, 1999), in which the authors suggested that it may be less crucial how many lessons are
taught than the quality with which they were delivered
V. RECOMMENDATIONS
It is important to do the right things in the right way. Efficacious public policy should be rooted
in practice that is both evidence based, cost effective, and implemented with quality. It is
valuable to have a longer-term view that considers the prevention-related benefits of short-term
costs (Osher, Morrison, & Bailey, 2003; Quinn & Poirier, 2004). Based on the findings of this
study, as well as lessons learned from the larger body of research and professional literature and
our work with school districts and schools, we make the following six policy recommendations.
We propose that policy mandate, support, and incentivize—at both the state, school district, and
school levels—efforts to address the following recommendations.
It is important to immediately eliminate exclusionary discipline. The conditions contributing to
exclusionary discipline must be transformed with a sustained, multi-year effort (Johnson,
Kendziora, & Osher, 2012). Such efforts should begin with an understanding that a culture of
change, unlike “quick fixes” like metal detectors, requires an extended period of time to engage
stakeholders, cultivate their buy-in, and develop an effective plan.
Recommendation 1: Assess Factors Contributing to Disparities in School Safety and Discipline. There are ecological as well as individual warning signs of school violence
(Osher et al. 2004). Conducting and effectively using audits to identify assets as well as areas of
need and factors contributing to poor discipline and violence can facilitate more efficient use of
public resources. This can also potentially identify causes of discipline-related disparities (e.g.,
the most recent U.S. Department of Education Race to the Top grants require school districts to
conduct root cause analyses of these disparities). Audits should include an external, independent
perspective and a sound methodology. The CMSD audit (Osher et al., 2008), which was the basis
for CMSD’s Humanware efforts, provides an example of this.
Recommendation 2: Expand Collection and Use of Data on Non-Academic Conditions in Schools. Data on school conditions for learning—challenge, physical and
emotional safety, student social and emotional skills, student support—can effectively facilitate
continuous improvement, performance management, and accountability. Effective use of data
from valid, reliable, and properly administered student surveys, such as the instrument CMSD
has used, should be infused into the culture of districts and schools. These data should be
examined to understand general conditions in districts and schools as well as disaggregated by
student demographic subgroups to support data-informed decisions about interventions and

Avoid Simple Solutions and Quick Fixes: Lessons Learned from a Comprehensive Districtwide Approach to Improving Conditions for Learning
January 2, 2013 Page 21
strategies to address disparities and identified areas of need. Doing this on a voluntary basis was
included in a 2011 Senate bill for the reauthorization of the Elementary and Secondary Education
Act. Importantly, school staff should be equipped with the tools, time, training, and support to
effectively use data on non-academic conditions to plan, monitor, and refine interventions. The
Federally supported National Center on Safe and Supportive Learning Environments has
archived webinars on the use of school climate data. The logic of this approach is also described
in related literature (e.g., Osher et al., 2004; Osher & Kendziora, 2010; Wandersman, Chien, &
Katz, 2012).
As part of this effort, it is essential to collect and disaggregate data for student populations
known to experience disparities and disproportionalities. Particular groups of students may
experience these disparities so it is important that consider these groups as part of related efforts
to improve conditions for learning and discipline. This includes student demographic
characteristics including race/ethnicity, English Language Learner status, disability status, and
poverty. Furthermore, although we did not have data to data on students who are lesbian, gay,
bisexual, and transgender (LGBT), research increasingly documents the challenges they
experience in some school settings due to rejection, bias, and abuse related to their sexual
orientation and gender identity/expression (Poirier, 2012) as well as disparities in discipline due
to bias because of their LGBT identity (Majd, Marksamer, & Reyes, 2009). This may be
especially problematic for LGBT students of color due given what we know about the discipline-
related disparities that Black and Latino students encounter. It is critical that policymakers and
educators actively engage these voices and perspectives in efforts to improve school safety and
discipline, as well as collect and disaggregate data on these populations.
Recommendation 3: Apply Tiered Approaches to Prevention and Addressing Mental Health Challenges, Including Those Related to Trauma. Trauma and mental
health challenges and disorders can contribute to as well as be exacerbated by academic and
behavioral problems. Tiered approaches to preventing and addressing mental health disorders
can ensure that more concentrated supports are delivered to students who need them, while also
providing a foundation that minimizes problems and makes early intervention easier. Information
on the theoretical background for this (e.g., O’Connell, Boat, & Warner, 2009; Weisz, Sandler,
Durlak, & Anton, 2006) and models for implementing this approach (see Osher, et al., 2004) are
readily available. Interventions should be tiered, not students, who have strengths as well as
needs, and interventions should both build strengths as well as address needs.
Recommendation 4: Implement Evidence-Based Social and Emotional Learning. Self-discipline and prosocial habits are critical to creating safe learning environments (Osher et.
al, 2010) and effective social and emotional learning (SEL) can promote social competence
while reducing antisocial behavior (Durlak et al., 2011). Districts can address discipline-related
concerns more proactively by building adult and student social and emotional competence
through training and effective implementation of evidenced-based SEL. This may include SEL
standards as in the case of Illinois (Gordon, Ji, Mulhall, Shaw, & Weissberg, 2011) evidenced
based SEL programs that can be found in the Collaborative for Academic, Social, and Emotional
Learning 2013 Guide to SEL Programs (CASEL, 2012), and systemic SEL programing as being
implemented by Anchorage, Austin, Chicago, Cleveland, Nashville, Oakland, Sacramento, and

Avoid Simple Solutions and Quick Fixes: Lessons Learned from a Comprehensive Districtwide Approach to Improving Conditions for Learning
January 2, 2013 Page 22
Washoe as part of the Collaborating Districts Initiative (http://casel.org/collaborating-districts-
initiative/).
Recommendation 5: Broaden Investment in “Humanware” Student Support Activities. Provide incentives for Humanware investment that are equivalent to incentives for
investment in hardware and policing. Federal policy has supported hiring police in schools and
investments in hardware. It has not done the same for Humanware, other than through
competitive grant programs. Cleveland was able to spend $2.5 million on metal detectors from
its $3.3 million in state capital improvement funds. Humanware investments could be similarly
incentivized through social investment bonds, for example.
Recommendation 6: Support Development of Individual and Organizational Capacities to Reduce Disparities while Building Safe, Orderly Schools with Strong Conditions for Learning. Low-quality implementation and cultural disconnects
between students, families, and educators contribute to disparities. There is an increasing body of
research that suggest the importance of implementation quality and capacity (Durlak & DuPre,
2008; Myers, Durlak, & Wandersman, 2012) as well as of educator cultural competence (Osher,
Cartledge, Oswald, Artiles, & Coutinho, 2004; Osher et al, 2012; Poirier, 2012). Policy and
practice should support development of individual and organizational capacities to reduce
disparities while building safe, orderly schools that have strong conditions for learning.
VI. CONCLUSION
Children and youth require safe and supportive schools and communities if they are to succeed in
school and thrive. These needs are particularly great for children who struggle with the
adversities of poverty (Kendziora & Osher, 2009). The data presented here suggest that
Cleveland is starting to create those conditions for its students, the majority of whom are students
of color. For example, when students were asked about their perception about whether the school
is safe, we find that during this period, they are reporting increasingly higher perceptions of
safety, and this was particularly evident for a group who are usually at risk here, youth in the
middle school grades.
Schools with high levels of student social-emotional and other needs may lack the organizational
efficacy necessary to identify the right programs and use them efficiently. Educators and
community members in many of these schools and districts often believe that the challenges they
face are so hard that a proactive preventive approach cannot take place in their school or district.
Cleveland provides an example of what else is possible, even in hard times, and even under less
than perfect conditions for implementing student centered policies, which reduce school
removal, drop out, and the pipeline to prison (Gavazzi, Russell, & Khurana, 2009). Fortunately,
the promise for Cleveland is growing. The chief academic officer who led the Humanware
efforts is now the system’s chief executive officer. He, the mayor, and the Cleveland Teachers
Union president have succeeded in having the voters pass the first tax levy for education in 17
years, and Cleveland has secured support from the NoVo Foundation to support its Humanware
efforts.

Avoid Simple Solutions and Quick Fixes: Lessons Learned from a Comprehensive Districtwide Approach to Improving Conditions for Learning
January 2, 2013 Page 23
Cleveland continues to move forward in strengthening each of the four initiatives that we
discussed. For example, Cleveland is now surveying students about conditions for learning three
times a year so that its school planning teams can use the disaggregated data for continuous
quality improvement. Similarly, its Humanware efforts are being extended through
implementation of social and emotional learning standards; incorporation of a student-driven,
evidenced-based computer social and emotional learning program (Ripple Effects) in the
planning centers; and implementation of class meetings in high schools districtwide.

Avoid Simple Solutions and Quick Fixes: Lessons Learned from a Comprehensive Districtwide Approach to Improving Conditions for Learning
January 2, 2013 Page 24
REFERENCES
American Psychological Association Zero Tolerance Task Force. (2008). Are zero tolerance
policies effective in schools? An evidentiary review and recommendations. American
Psychologist, 63, 852–862.
Astor, R.A., Cornell, D.G., Espelage, D.L., Furlong, M.J., Jimerson, S.R., Mayer, M. .,
Nickerson, A.B., Osher, D. & Sugai, G. (2012). Position statement of the
interdisciplinary group on preventing school and community violence. Retrieved from
curry.virginia.edu/articles/sandyhookshooting
Borum, R., Cornell, D.G., Modzeleski, W., & Jimerson, S.R. (2010). What can be done about
school shootings? A review of the evidence. Educational Researcher, 39, 27–37.
Bryk, A.S., Sebring, P.B., Allensworth, E., Luppescu, S., & Easton, J. Q. (2010). Organizing
schools for improvement: Lessons from Chicago. Chicago: University of Chicago Press
Bryk, A., Sebring, P., Kerbow, D., Rollow, S., & Easton, J. (1998). Charting Chicago school
reform. Boulder, CO: Westview Press.
CASEL. (2012). 2013 CASEL guide: Effective social and emotional programs. Retrieved from
http://casel.org/wp-content/uploads/CASEL_Guide.pdf
Case Western Reserve University, Department of Family Medicine, Center for Adolescent
Health. (n.d.a). 2008 Cleveland Metropolitan School District Youth Risk Behavior Survey
Report: Grades 7–8. Retrieved from http://www.prchn.org/Downloads/
2008%20Cleveland%20Metropolitan%20School%20District%20Grades%207-
8%20YRBS%20Report.pdf
Case Western Reserve University, Department of Family Medicine, Center for Adolescent
Health. (n.d.b). 2004 Cuyahoga County Cleveland Metropolitan School District Youth
Risk Behavior Survey. Retrieved from http://www.prchn.org/Downloads/
2004%20CMSD%20YRBS%20Report.pdf
Center for Health Affairs. (2007). Summary: Community health needs analysis and assessment.
Cleveland, OH: Center for Community Solutions.
Conduct Problems Prevention Research Group. (1999). Initial impact of the Fast Track
prevention trial for conduct problems: II. Classroom effects. Journal of Consulting and
Clinical Psychology, 67, 648–657
Cornell, D.G., & Mayer, M.J. (2010). Why does school order and safety matter? Educational
Researcher, 39, 7–15.

Avoid Simple Solutions and Quick Fixes: Lessons Learned from a Comprehensive Districtwide Approach to Improving Conditions for Learning
January 2, 2013 Page 25
Domitrovich, C., & Greenberg, M.T. (2000). The study of implementation: Current finding from
effective programs for school-aged children. Journal of Educational and Psychological
Consultation, 11, 193–221.
Durlak, J.A., Weissberg, R.P., Dymnicki, A.B., Taylor, R.D., & Schellinger, K.B. (2011).
The impact of enhancing students’ social and emotional learning: A meta-analysis of
school-based universal interventions. Child Development, 82, 405–432.
Dwyer, K. & Osher, D. (2000). Safeguarding our children: An action guide. Washington, DC:
U.S. Departments of Education and Justice, American Institutes for Research.
Dwyer, K., Osher, D., & Warger, C. (1998). Early warning, timely response: A guide to safe
schools. Washington, DC: U.S. Department of Education.
Elias, M.J., Zins, J.E., Weissberg, R.P., Frey, K.S., Greenberg, M. T., Haynes, N. M., Kessler,
R., Schwab-Stone, M. E., & Shriver, T. P. (1997). Promoting social and emotional
learning: Guidelines for educators. Alexandria, VA: Association for Supervision and
Curriculum Development.
Elliott, D.S., & Mihalic, S. (2004). Issues in disseminating and replicating effective prevention
programs. Prevention Science, 5(1), 47–53.
Environmental Health Watch (n.d.). Cleveland/Cuyahoga county childhood lead poisoning rates.
Retrieved from http://www.ehw.org/healthy-green-housing/resources-for-a-green-
healthy-home/lead-poisoning/clevelandcuyahoga-county-childhood-lead-poisoning/.
Faria, A.M., Kendziora, K., Brown, L., & Osher, D. (2012). PATHS implementation and
outcome study in the Cleveland Metropolitan School District: Final report. Washington,
DC: American Institutes for Research
Fox, D., Gottfredson, D., Kumpfer, K., & Beatty, P. (2004). Challenges in disseminating model
programs: A qualitative analysis of the strengthening WDC families project. Clinical
Child and Family Psychology Review, 7(3), 165–176.
Fredricks, J.A. Blumenfeld, P., Friedel, J., & Paris A. (2005). School engagement. In K.A.
Moore & L.H. Lippman (Eds.), What do children need to flourish: Conceptualizing and
measuring indicators of positive development (pp. 305–321). New York, NY, US:
Springer Science + Business Media.
Fullan, M. (2001). Leading in a culture of change. New York, NY: John Wiley & Sons, Inc.
Furlong, M., Paige, L. Z. & Osher, D. (2003). The Safe School, Healthy Students Initiative:
Lessons Learned from Implementing Healthy Youth Development Programs, Psychology
in the Schools, 40(5), 447–456.
Avoid Simple Solutions and Quick Fixes: Lessons Learned from a Comprehensive Districtwide Approach to Improving Conditions for Learning
January 2, 2013 Page 26
Gagnon, J.C., & Leone, P.E. (2001). Alternative strategies for school violence prevention. New
Directions for Mental Health Services, 92, 101–125.
Gavazzi, S., Russell, C.M.. & Khurana, A. (2009). Predicting educational risks among court-
involved black males: Family, peers, and mental health issues. Negro Educational
Review, 60(1/4), 99–114.
Gladden, M. (2002). Reducing school violence: Strengthening student programs and addressing
the role of school organizations. Review of Research in Education, 26, 263–297.
Goodenow C. (1993). The psychological sense of school membership among adolescents: Scale
development and educational correlates. Psychology in the Schools, 30(1), 79–90.
Gordon, E. (2009). 2009–10 August Academic Achievement Planning Meeting,
Presentation, Cleveland, Ohio.
Gordon, E. (2012). Building and sustaining the capacity to improve conditions for learning.
Plenary Presentation at the U.S. Department of Education’s Meeting the Challenge:
Building & Sustaining Capacity to Improve Conditions for Learning, Washington, DC.
Gordon, G., Ji, P., Mulhall, P., Shaw, B., & Weissberg, R. (2011). Social and emotional learning
for Illinois students: Policy, practice, and progress. In Institute of Government and Public
Affairs, The Illinois Report 2011 (pp. 68–83). Chicago, Springfield, and Urbana-
Champaign, IL: Board of Trustees of the University of Illinois.
Gottfredson, G.D., & Gottfredson, D.C. (2001). What schools do to prevent problem behavior
and promote safe environments. Journal of Educational and Psychological Consultation,
12, 313–344.
Gregory, A., Skiba, R.J., & Noguera, P.A. (2010). The achievement gap and the discipline
gap: Two sides of the same coin? Educational Researcher, 39, 59–68.
Hall, G., & Hord, S. (2011). Implementing change: Patterns, principles, and potholes. Boston,
MA: Allyn and Bacon.
Harvard University Civil Rights Project. (2000). Opportunities suspended: The devastating
consequences of zero tolerance and school discipline policies. Cambridge MA: Author.
Johnson, Kendziora, & Osher. (2012). RTTD Guidance: Implementing performance metrics for
continuous improvement that support foundational conditions for personalized Learning.
Washington, DC: American Institutes for Research.
Kendziora, K., & Osher, D. (2009). Starting to turn schools around: The academic outcomes of
the Safe Schools, Successful Students Initiative. Washington, DC: American Institutes for
Research.

Avoid Simple Solutions and Quick Fixes: Lessons Learned from a Comprehensive Districtwide Approach to Improving Conditions for Learning
January 2, 2013 Page 27
Losen, D.J., & Skiba, R.J. (2010). Suspended education: Urban middle schools in crisis. Lose
Angeles, CA: The Civil Rights Project. Retrieved from http://civilrightsproject.ucla.edu/
research/k-12-education/school-discipline/suspended-education-urban-middle-schools-in-
crisis/Suspended-Education_FINAL-2.pdf
Majd, K., Marksamer, J., & Reyes, C. (2009). Hidden injustice: Lesbian, gay, bisexual, and
transgender youth in juvenile courts. National Juvenile Defender Center, National Center
for Lesbian Rights, Legal Services for Children. Retrieved from
http://www.equityproject.org/pdfs/hidden_injustice.pdf
Mayer, G.R. (2001). Antisocial behavior: Its causes and prevention within our schools.
Education and Treatment of Children, 24, 414–429.
Mayer, G.R., & Sulzer-Azaroff, B. (1991). Interventions for vandalism. In G. Stoner, M.R.
Shinn, & H.M. Walker (Eds.), Interventions for achievement and behavior problems (pp.
559–580). Bethesda, MD: National Association of School Psychologists.
Mayer, M.J. & Cornell, D.G (2010). Why do school order and safety matter? Educational
Researcher, 39(1), 7–15l
Mayer, M.J., & Leone, P.E. (2007). School violence and disruption revisited: Establishing
equity and safety in the school house. Focus on Exceptional Children, 40(1), 1–28.
McNeely, C.A., Nonnemaker, J.M., & Blum, R.W. (2002). Promoting school connectedness:
Evidence from the National Longitudinal Study of Adolescent Health. Journal of School
Health, 72(4), 138–146.
Needleman, H.L., McFarland, C., Ness, R.B., Fienberg, S. E., & Tobin, M.J. (2002). Bone lead
levels in adjudicated delinquents: A case control study. Neurotoxicology and Teratology,
24(6), 711–717.
O'Connell, M., Boat, T., & Warner, K E. (2009). Preventing mental, emotional, and behavioral
disorders among young people: Progress and possibilities. Washington, DC: National
Academies Press.
Osher, D. (2002). Creating comprehensive and collaborative systems. Journal of Child and
Family Studies, 11(1), 91–101.
Osher, D., Coggshall, J., Colombi, G., Woodrfuff, D., Francois, S., & Osher, T. (2012). Building
school and teacher capacity to eliminate the school-to-prison pipeline, Teacher Education
and Special Education, 35(4), 284–295.
Osher, D., Dwyer, K., & Jackson, S. (2004). Safe, supportive, and successful schools step by
step. Longmont, CO: Sopris West Educational Services.

Avoid Simple Solutions and Quick Fixes: Lessons Learned from a Comprehensive Districtwide Approach to Improving Conditions for Learning
January 2, 2013 Page 28
Osher, D., Dwyer, K.P., Jimerson, S.R., & Brown, J. (2012). Developing safe, supportive, and
effective schools: Facilitating student success to reduce school violence In S.R. Jimerson,
A.B. Nickerson, M.J. Mayer, & M.J. Furlong (Eds.), Handbook of school violence and
safety: International research and practice (2nd
ed., pp. 27–44). New York, NY: Taylor
& Francis.
Osher, D. & Kendziora, K. (2010). Building conditions for learning and healthy adolescent
development: Strategic approaches. In B. Doll, W. Pfohl, & J. Yoon (Eds.) Handbook of
youth prevention science. New York: Routledge.
Osher, D., & Kendziora, K., Spier, E., & Garibaldi, M. L. (in press). School influences on child
and youth development. In Z. Sloboda & H. Petras (Eds.). Advances in prevention
science volume 1: Defining prevention science. NY: Springer.
Osher, D., Morrison, G., & Bailey, W. (2003). Exploring the relationship between student
mobility and dropout among students with emotional and behavioral disorders. Journal of
Negro Education, 72(1), 79–96.
Osher, D., Poirier, J.M., Dwyer, K.P., Hicks, R., Brown, L.J., Lampron, S., & Rodriguez, C.
(2008). Cleveland Metropolitan School District human ware audit: Findings and
recommendations. Available online at http://www.air.org/files/AIR_Cleveland_8-20-
0821.pdf
Osher, D., Quinn, M.M., Poirier, J.M., & Rutherford, R. (2003). Deconstructing the pipeline:
Using efficacy and effectiveness data and cost-benefit analyses to reduce minority youth
incarceration, New Directions in Youth Development, 99, 91–120.
Osher, D., Sandler, S., & Nelson, C. (2001). The best approach to safety is to fix schools and
support children and staff. New Directions in Youth Development, 92, 127–154.
Osher, D., Sprague, J., Bear, G., & Doyle, W. (2010) How to improve school discipline.
Educational Researcher, 39(1), 48–58.
Osher, D., Sprague, J., Weissberg, R.P., Axelrod, J., Keenan, S., Kendziora, K., & Zins, J.E.
(2007). A comprehensive approach to promoting social, emotional, and academic growth
in contemporary schools. In J. Grimes & A. Thomas (Eds.) Best practices in school
psychology V (pp. 1263–1278). Bethesda, MD: National Association of School
Psychologists.
Osher, D., VanAker, R., Morrison, G., Gable, R., Dwyer, K., & Quinn, M., (2004). Warning
signs of problems in schools: Ecological perspectives and effective practices for
combating school aggression and violence. Journal of School Violence, 2/3, 13–37.
Osterman, K.F. (2000). Students’ need for belonging in the school community. Review of
Educational Research, 70, 323–367.

Avoid Simple Solutions and Quick Fixes: Lessons Learned from a Comprehensive Districtwide Approach to Improving Conditions for Learning
January 2, 2013 Page 29
Patterson, G.R., Reid, J.B., & Dishion, T.J. (1992). A social interactional approach: Vol. 4
antisocial boys. Eugene, OR: Castalia.
Poirier, J.M. (2012). Fostering safe, welcoming, and supportive schools for LGBT youth. In S.K.
Fisher, J.M. Poirier, & G.M. Blau (Eds.), Improving emotional & behavioral outcomes
for LGBT youth: A guide for professionals (pp. 159–172). Baltimore, MD: Brookes
Publishing Company.
Quinn, M.M., Osher, D., Hoffman, C.C., & Hanley, T.V. (1998). Safe, drug-free, and effective
schools for ALL students: What works! Washington, DC: Center for Effective
Collaboration and Practice, American Institutes for Research.
Quinn, M.M., & Poirier, J.M. (2004). Linking prevention research with policy: Examining the
costs and outcomes of the failure to prevent EBD. In R.B. Rutherford, M.M. Quinn, &
S.R. Mathur (Eds.), Handbook of research in emotional and behavioral disorders (pp.
78–97). New York: Guilford Press.
Sebring, P.B., Allensworth, E., Bryk, A.S., Easton, J.Q., & Luppescu, S. (2006). The essential
supports for school improvement. Chicago, IL: Consortium on Chicago School Research.
Straus, M.A. (1991). Discipline and deviance: Physical punishment of children and violence and
other crime in adulthood. Social Problems, 38(2), 133–154.
Turnaround for Children. (2012). Race to the top-district action brief: Establishing foundational
conditions for personalized learning. New York City: Turnaround for Children
Turner, K. (2007, October 19). Metal detectors approved for Cleveland schools, will cost $3.3
million. The Plain Dealer. Retrieved from
http://blog.cleveland.com/metro/2007/10/metal_detectors_approved_for_c.html
U.S. Census Bureau. (2011). Poverty status in the past 12 months: 2011 American Community
Survey 1-Year Estimates. Retrieved from http://factfinder2.census.gov/faces/
tableservices/jsf/pages/productview.xhtml?pid=ACS_11_1YR_S1701&prodType=table
U.S. Department of Health & Human Services. (1999).Mental health: A report of the surgeon
general. Washington, DC: Author
U.S. Public Health Service. (2000). Youth violence: A report of the surgeon general.
Washington, DC: Author.
Vaughn, B.J. (2006). SWPBS: Who is left behind? Research and Practice for Persons with
Severe Disabilities, 31(1), 66–69.
Venkatesh, S.A. (1997). The three-tier model: How helping occurs in urban, poor communities.
Social Service Review, 71, 574–606.

Avoid Simple Solutions and Quick Fixes: Lessons Learned from a Comprehensive Districtwide Approach to Improving Conditions for Learning
January 2, 2013 Page 30
Wandersman, A., Chien, H. & Katz, J. (2012). Toward an evidence-based system for innovation
support for implementing innovations with quality: Tools, training, technical assistance,
and quality assurance/quality improvement. American Journal of Community Psychology,
50(3-4), 445–459.
Weisz, J.R., Sandler, I.N., Durlak, J.A., & Anton, B.S. (2006). A proposal to unite two different
worlds of children's mental health. American Psychologist, 61(6), 644–645.
Wentzel, K.R., & Wigfield, A. (1998). Academic and social motivational influences on students'
academic performance. Educational Psychology Review, 10, 155–175.
Woodruff, D.W., Osher, D., Hoffman, C.C., Gruner, A., King, M., Snow, S., & McIntire, J.C.
(1999). The role of education in a system of care: Effectively serving children with
emotional or behavioral disorders. Washington, DC: Center for Effective Collaboration
and Practice, American Institutes for Research.
Wright, A., Lamont, A., Wandersman, A., & Osher, D. (in press). Accountability and social
emotional learning programs: The Getting To Outcomes approach. In J. Durlak, T.
Gullota, & R. Weissberg, EDS, Handbook of social emotional learning.
Zenere, F. J., & Lazarus, P. J. (2009). The sustained reduction of youth suicidal behavior in an
urban, multicultural school district. School Psychology Review, 38, 189–199.
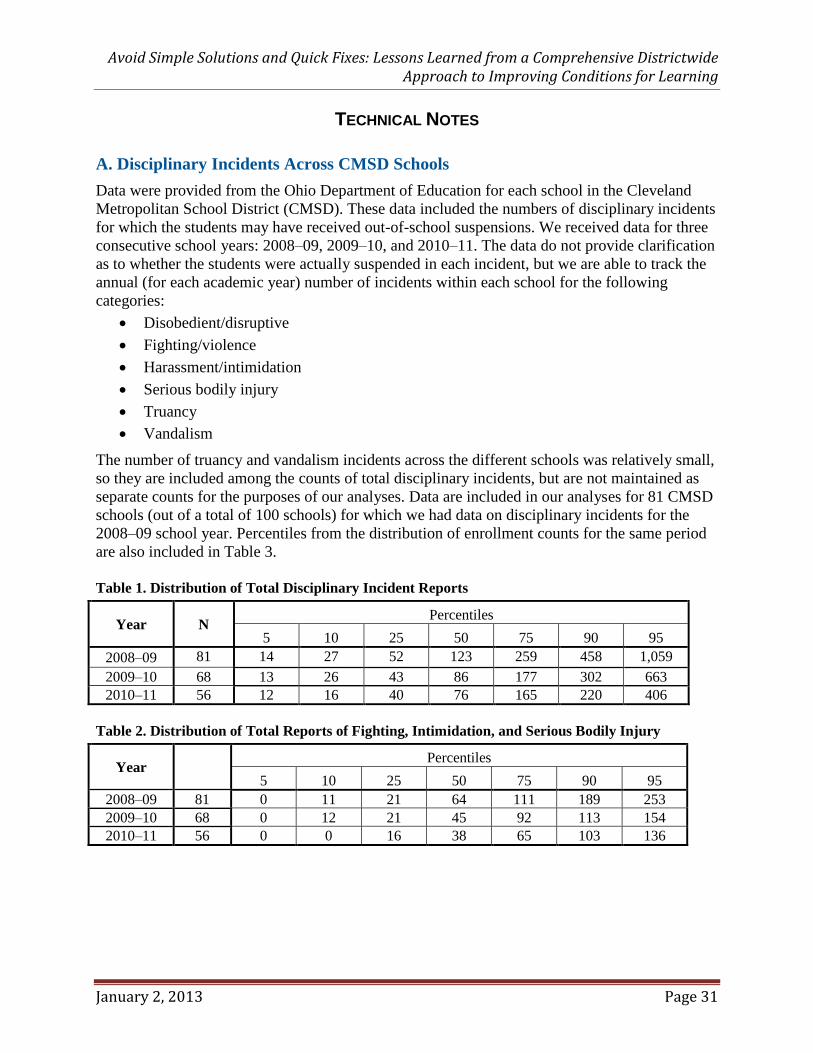
Avoid Simple Solutions and Quick Fixes: Lessons Learned from a Comprehensive Districtwide Approach to Improving Conditions for Learning
January 2, 2013 Page 31
TECHNICAL NOTES
A. Disciplinary Incidents Across CMSD Schools
Data were provided from the Ohio Department of Education for each school in the Cleveland
Metropolitan School District (CMSD). These data included the numbers of disciplinary incidents
for which the students may have received out-of-school suspensions. We received data for three
consecutive school years: 2008–09, 2009–10, and 2010–11. The data do not provide clarification
as to whether the students were actually suspended in each incident, but we are able to track the
annual (for each academic year) number of incidents within each school for the following
categories:
Disobedient/disruptive
Fighting/violence
Harassment/intimidation
Serious bodily injury
Truancy
Vandalism
The number of truancy and vandalism incidents across the different schools was relatively small,
so they are included among the counts of total disciplinary incidents, but are not maintained as
separate counts for the purposes of our analyses. Data are included in our analyses for 81 CMSD
schools (out of a total of 100 schools) for which we had data on disciplinary incidents for the
2008–09 school year. Percentiles from the distribution of enrollment counts for the same period
are also included in Table 3.
Table 1. Distribution of Total Disciplinary Incident Reports
Year N Percentiles
5 10 25 50 75 90 95
2008–09 81 14 27 52 123 259 458 1,059
2009–10 68 13 26 43 86 177 302 663
2010–11 56 12 16 40 76 165 220 406
Table 2. Distribution of Total Reports of Fighting, Intimidation, and Serious Bodily Injury
Year Percentiles
5 10 25 50 75 90 95
2008–09 81 0 11 21 64 111 189 253
2009–10 68 0 12 21 45 92 113 154
2010–11 56 0 0 16 38 65 103 136

Avoid Simple Solutions and Quick Fixes: Lessons Learned from a Comprehensive Districtwide Approach to Improving Conditions for Learning
January 2, 2013 Page 32
Table 3. Distribution of Enrollment Counts
Year N Percentiles
5 10 25 50 75 90 95
2008–09 86 129 198 308 409 552 785 1,140
2009–10 89 173 226 300 374 500 737 963
2010–11 95 140 192 276 386 487 712 975
B. Conditions for Learning Survey Subscale Analyses
Students were surveyed regarding the conditions for learning within their schools. Using factor
analysis, we created subscales from items identified from the larger survey that reflected three
characteristics of the school setting: whether students in that school are often threatened, bullied
or teased; whether the students reported feeling safe in and around the school building; and
whether students in the school were likely to resort to fighting and verbal aggression in response
to conflicts. We assessed the reliability of each of the new scales. Here we report Cronbach’s
alpha for the scale using data from the most recent year (alpha reliabilities are consistent in
previous years and are not reported in this paper). In Grades 2–4, where there are fewer items on
the survey instrument, we report only results for the scale assessing whether students in the
school are often threatened, bullied, or teased.
In addition, the following results include bivariate analyses assessing whether there is
improvement in these data over a four-year period in each of the three scales within gender and
racial subgroups. For these analyses, we have data for each of four consecutive school years:
2008–09, 2009–10, 2010–11, and 2011–12. We use bivariate correlations to assess whether the
trend is in the direction we would expect if the students were feeling safer within the school
setting over time. So for instance, as higher scores on the scale “Threatened, Bullied, and
Teased” reflect higher degrees of worrying or concern on the part of the students, over time we
would expect to see a reduction in scores if the school environment was perceived to be
improving or becoming safer. Such a trend would be reflected in a negative correlation.
B1. Results for Grades 2–4
Scale 1: Threatened, Bullied, and Teased (Cronbach's Alpha: 0.69)
Items:
Students at my school are often bullied.
Students at my school are teased, picked on, made fun of, or called names.
Table 4. Correlation of Scale Score to Years since Implementation within Gender and Race
Subgroups
Male Female Black Hispanic White
Trend 2009–12 0.18* 0.11* 0.09 0.13 0.18*
Note: Numbers reported in table are bivariate correlations for the subsamples defined by gender and race.
* Statistically significant at the 0.05 level.

Avoid Simple Solutions and Quick Fixes: Lessons Learned from a Comprehensive Districtwide Approach to Improving Conditions for Learning
January 2, 2013 Page 33
B2. Results for Grades 5–8
Scale 1: Threatened, Bullied, and Teased (Cronbach's Alpha: 0.79)
Items:
I worry about crime and violence in school.
Students at this school are often bullied.
Students at this school are often threatened.
Students at this school are often teased or picked on.
Students at this school are often bullied because of certain characteristics (for example,
their race, religion, or weight).
Table 5. Correlation of Scale Score to Years since Implementation within Gender and Race
Subgroups
Male Female Black Hispanic White
Trend 2009–12 -0.14* -0.04 -0.06 -0.14* -0.11*
Note: Numbers reported in table are bivariate correlations for the subsamples defined by gender and race.
* Statistically significant at the 0.05 level.
Scale 2: Feel Safe at School (Cronbach's Alpha: 0.68)
Items:
How safe do you feel in the hallways and bathrooms of the school?
How safe do you feel in your classes?
Table 6. Correlation of Scale Score to Years since Implementation within Gender and Race
Subgroups
Male Female Black Hispanic White
Trend 2009–12 0.06* 0.06* 0.12* -0.01 0.07
Note: Numbers reported in table are bivariate correlations for the subsamples defined by gender and race.
* Statistically significant at the 0.05 level.
Scale 3: Prepared to Fight (Cronbach's Alpha: 0.71)
Items:
Most students in my school like to put others down.
Most students in my school get into arguments when they disagree with people.
Most students in my school think it’s OK to fight if someone insults them.
Most students in my school say mean things to other students when they think the other
students deserve it.
Table 7. Correlation of Scale Score to Years since Implementation within Gender and Race
Subgroups
Male Female Black Hispanic White
Trend 2009–12 -0.06* 0.03 0.02 -0.05 -0.01
Note: Numbers reported in table are bivariate correlations for the subsamples defined by gender and race.
* Statistically significant at the 0.05 level.

Avoid Simple Solutions and Quick Fixes: Lessons Learned from a Comprehensive Districtwide Approach to Improving Conditions for Learning
January 2, 2013 Page 34
B3. Results for Grades 9–12
Scale 1: Threatened, Bullied, and Teased (Cronbach's Alpha: 0.86)
Items:
I worry about crime and violence in school.
Students at this school are often bullied.
Students at this school are often threatened.
Students at this school are often teased or picked on.
Students at this school are often bullied because of certain characteristics (for example,
their race, religion, or weight).
Table 8. Correlation of Scale Score to Years since Implementation within Gender and Race
Subgroups
Male Female Black Hispanic White
Trend 2009–12 -0.00 0.12* -0.00 0.12 0.14*
Note: Numbers reported in table are bivariate correlations for the subsamples defined by gender and race.
* Statistically significant at the 0.05 level.
Scale 2: Feel Safe at School (Cronbach's Alpha: 0.67)
Items:
How safe do you feel in the hallways and bathrooms of the school?
How safe do you feel in your classes?
Table 9. Correlation of Scale Score to Years since Implementation within Gender and Race
Subgroups
Male Female Black Hispanic White
Trend 2009–12 0.03 -0.01 -0.04 0.03 0.00
Note: Numbers reported in table are bivariate correlations for the subsamples defined by gender and race.
No statistically significant results.
Scale 3: Prepared to Fight (Cronbach's Alpha: 0.75)
Items:
Most students in my school like to put others down.
Most students in my school get into arguments when they disagree with people.
Most students in my school think it’s OK to fight if someone insults them.
Most students in my school say mean things to other students when they think the other
students deserve it.
Table 10. Correlation of Scale Score to Years since Implementation within Gender and Race
Subgroups
Male Female Black Hispanic White
Trend 2009–12 -0.05 -0.04 -0.08 0.03 -0.04
Note: Numbers reported in table are bivariate correlations for the subsamples defined by gender and race.
No statistically significant results.
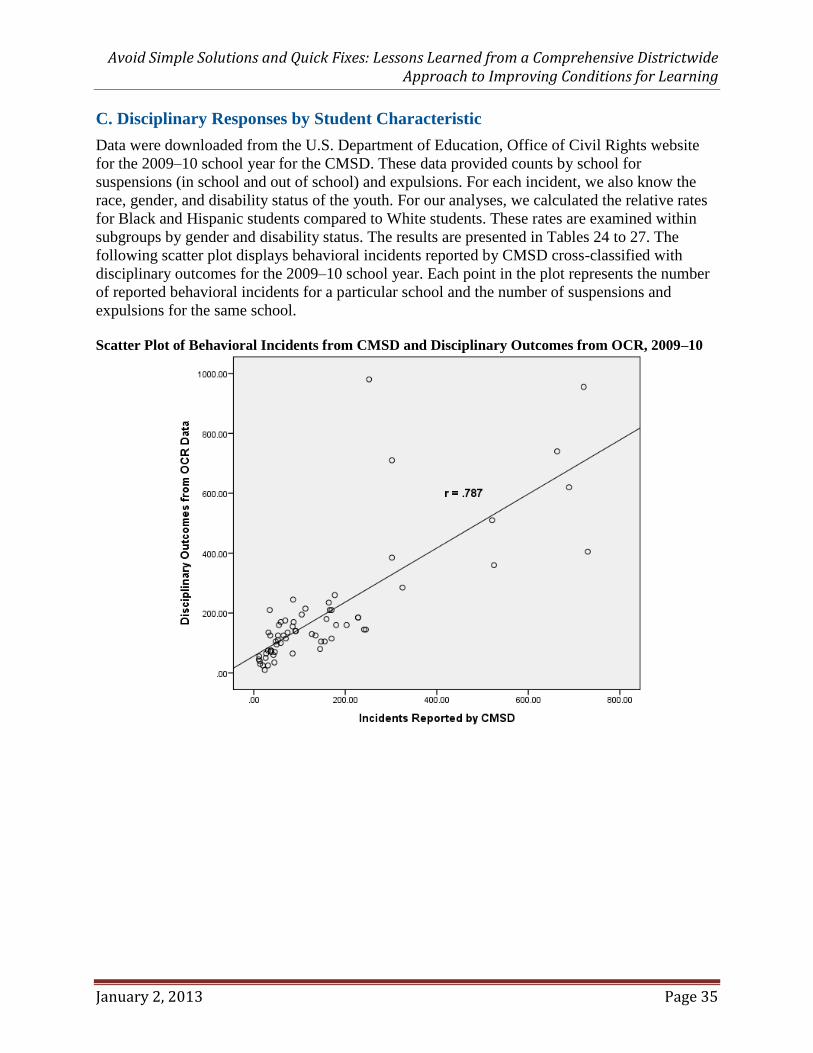
Avoid Simple Solutions and Quick Fixes: Lessons Learned from a Comprehensive Districtwide Approach to Improving Conditions for Learning
January 2, 2013 Page 35
C. Disciplinary Responses by Student Characteristic
Data were downloaded from the U.S. Department of Education, Office of Civil Rights website
for the 2009–10 school year for the CMSD. These data provided counts by school for
suspensions (in school and out of school) and expulsions. For each incident, we also know the
race, gender, and disability status of the youth. For our analyses, we calculated the relative rates
for Black and Hispanic students compared to White students. These rates are examined within
subgroups by gender and disability status. The results are presented in Tables 24 to 27. The
following scatter plot displays behavioral incidents reported by CMSD cross-classified with
disciplinary outcomes for the 2009–10 school year. Each point in the plot represents the number
of reported behavioral incidents for a particular school and the number of suspensions and
expulsions for the same school.
Scatter Plot of Behavioral Incidents from CMSD and Disciplinary Outcomes from OCR, 2009–10

Avoid Simple Solutions and Quick Fixes: Lessons Learned from a Comprehensive Districtwide Approach to Improving Conditions for Learning
January 2, 2013 Page 36
Table 11. Disciplinary Responses to Male Students with Disabilities, CMSD, 2009–10
Type of Disciplinary
Response
Black Hispanic White Relative
Rate for
Blacksb
Relative
Rate for
Hispanicsb Number Rate
a Number Rate
a Number Rate
a
Students receiving one or
more in-school
suspensions
985 50.8 145 42.2 175 41.9 1.2 1.0
Students receiving only
one out-of-school
suspension
595 30.7 60 17.5 45 10.8 2.9* 1.6*
Students receiving more
than one out-of-school
suspension
435 22.4 40 11.7 25 6.0 3.8* 2.0*
Expulsions under zero-
tolerance policies 0 - 0 - 0 - - -
Expulsions without
educational services 0 - 0 - 0 - - -
a Number per 1,000 students;
b Relative to rate for White students.
* Statistically significant at the 0.05 level.
Source: Office for Civil Rights, U.S. Department of Education, retrieved from: http://www.ed.gov/ocr.
Table 12. Disciplinary Responses to Male Students without Disabilities, CMSD, 2009–10
Type of Disciplinary
Response
Black Hispanic White Relative
Rate for
Blacksb
Relative
Rate for
Hispanicsb Number Rate
a Number Rate
a Number Rate
a
Students receiving one or
more in-school
suspensions
2,505 129.2 420 122.3 415 99.4 1.3* 1.2*
Students receiving only
one out-of-school
suspension
1,370 70.7 160 46.6 145 34.7 2.0* 1.3*
Students receiving more
than one out-of-school
suspension
990 51.1 80 23.3 65 15.6 3.3* 1.5*
Expulsions under zero-
tolerance policies 5 0.3 0 - 0 - - -
Expulsions without
educational services 135 7.0 5 1.5 5 1.2 5.8* 1.2
a Number per 1,000 students;
b Relative to rate for White students.
* Statistically significant at the 0.05 level.
Source: Office of Civil Rights, U.S. Department of Education, retrieved from: http://www.ed.gov/ocr.

Avoid Simple Solutions and Quick Fixes: Lessons Learned from a Comprehensive Districtwide Approach to Improving Conditions for Learning
January 2, 2013 Page 37
Table 13. Disciplinary Responses to Female Students with Disabilities, CMSD, 2009–10
Type of Disciplinary
Response
Black Hispanic White Relative
Rate for
Blacksb
Relative
Rate for
Hispanicsb Number Rate
a Number Rate
a Number Rate
a
Students receiving one or
more in-school suspensions 435 23.5 60 19.5 75 18.9 1.2 1.0
Students receiving only one
out-of-school suspension 225 12.2 15 4.9 15 3.8 3.2* 1.3
Students receiving more
than one out-of-school
suspension
95 5.1 10 3.3 5 1.3 4.1* 2.6
Expulsions under zero-
tolerance policies 0 - 0 - 0 - - -
Expulsions without
educational services 0 - 0 - 0 - - -
a Number per 1,000 students;
b Relative to rate for White students.
* Statistically significant at the 0.05 level.
Source: Office for Civil Rights, U.S. Department of Education, retrieved from: http://www.ed.gov/ocr.
Table 14. Disciplinary Responses to Female Students without Disabilities, CMSD, 2009–10
Type of Disciplinary
Response
Black Hispanic White Relative
Rate for
Blacksb
Relative
Rate for
Hispanicsb Number Rate
a Number Rate
a Number Rate
a
Students receiving one or
more in-school suspensions 2,230 120.6 350 114.0 305 76.9 1.6* 1.5*
Students receiving only one
out-of-school suspension 1,130 61.1 90 29.3 85 21.4 2.9* 1.4*
Students receiving more
than one out-of-school
suspension
540 29.2 50 16.3 25 6.3 4.6* 2.6*
Expulsions under zero-
tolerance policies 0 - 0 - 0 - - -
Expulsions without
educational services 55 3.0 0 - 0 - - -
a Number per 1,000 students;
b Relative to rate for White students.
* Statistically significant at the 0.05 level.
Source: Office for Civil Rights, U.S. Department of Education, retrieved from: http://www.ed.gov/ocr.
D. Disciplinary Incidents by Intervention Level of Implementation Across CMSD
Schools
School administrators reported on the progress they were making in implementing the
interventions in their schools beginning in the 2011–12 school year. For three of the
interventions—PATHS, student support teams, and planning centers—reports from school
administrators led to ratings on the quality of implementation for each intervention.
Implementation quality was rated “low,” “medium,” or “high.”

Avoid Simple Solutions and Quick Fixes: Lessons Learned from a Comprehensive Districtwide Approach to Improving Conditions for Learning
January 2, 2013 Page 38
Table 15. Distribution of Total Disciplinary Incident Reports, by Level of PATHS
Implementation as Reported During the 2011–12 School Year
Year Level of PATHS
Implementation N
Percentiles
5 10 25 50 75 90 95
2008–09 Low 17 11 52 92 223 259 332 333
Medium to High 31 14 33 51 99 162 273 368
2009–10 Low 13 31 31 59 170 203 245 245
Medium to High 27 12 36 43 69 127 159 166
2010–11 Low 14 29 29 90 99 191 220 220
Medium to High 24 11 11 38 72 148 181 189
Table 16. Distribution of Total Disciplinary Incident Reports, by Level of Student Support
Team Implementation as Reported During the 2011–12 School Year
Year
Level of
Implementation of
Student Support
Teams
N
Percentiles
5 10 25 50 75 90 95
2008–09 Low 9 12 12 37 259 368 411 458
Medium to High 39 14 43 70 122 214 273 332
2009–10 Low 8 38 38 50 155 195 241 325
Medium to High 32 14 31 43 74 135 177 203
2010–11 Low 8 52 52 93 154 189 219 220
Medium to High 30 11 12 38 72 148 181 194
Table 17. Distribution of Total Disciplinary Incident Reports, by Level of Planning Centers
Implementation as Reported During the 2011–12 School Year
Year
Level of
Implementation of
Planning Centers
N Percentiles
5 10 25 50 75 90 95
2008–09 Low 16 14 51 61 123 258 267 333
Medium to High 32 12 33 76 122 223 332 368
2009–10 Low 11 38 38 50 113 164 203 203
Medium to High 29 12 31 38 74 155 177 245
2010–11 Low 11 12 12 38 154 189 220 220
Medium to High 27 11 12 52 93 112 176 194

Avoid Simple Solutions and Quick Fixes: Lessons Learned from a Comprehensive Districtwide Approach to Improving Conditions for Learning
January 2, 2013 Page 39
Table 18. Distribution of Fighting, Intimidation, and Serious Bodily Injury, by Level of
PATHS Implementation as Reported During the 2011–12 School Year
Year Level of PATHS
Implementation N
Percentiles
5 10 25 50 75 90 95
2008–09 Low 17 11 15 31 72 122 163 189
Medium to High 31 10 14 22 61 90 138 151
2009–10 Low 13 0 0 21 83 113 143 143
Medium to High 27 12 13 22 31 58 93 100
2010–11 Low 14 0 0 27 55 67 111 111
Medium to High 24 0 0 19 35 70 103 108
Table 19. Distribution of Fighting, Intimidation, and Serious Bodily Injury, by Level of Student
Support Team Implementation as Reported During the 2011–12 School Year
Year
Level of Student
Support Team
Implementation
N Percentiles
5 10 25 50 75 90 95
2008–09 Low 9 0 0 16 111 151 195 217
Medium to High 39 11 15 31 63 86 138 163
2009–10 Low 8 13 13 29 83 98 105 172
Medium to High 32 12 12 21 31 64 100 113
2010–11 Low 8 13 13 51 91 108 136 154
Medium to High 30 0 0 19 35 59 74 82
Table 20. Distribution of Fighting, Intimidation, and Serious Bodily Injury, by Level of
Planning Centers Implementation as Reported During the 2011–12 School Year
Year
Level of
Implementation of
Planning Centers
N Percentiles
5 10 25 50 75 90 95
2008–09 Low 16 14 15 31 69 101 111 122
Medium to High 32 10 11 25 61 113 163 189
2009–10 Low 11 22 22 26 48 83 100 100
Medium to High 29 0 12 16 39 87 105 143
2010–11 Low 11 12 12 19 46 103 111 111
Medium to High 27 0 0 21 44 61 77 91

Avoid Simple Solutions and Quick Fixes: Lessons Learned from a Comprehensive Districtwide Approach to Improving Conditions for Learning
January 2, 2013 Page 40
Table 21. Differences in Mean Levels of Disciplinary Incident Reports from 2008–09 to
2010–11
Type of Incident Year N Mean Std.
Dev. t df
Sig. (2-
tailed)
Fighting/Violence 2008–09 81 54.5 45.1
2.80 135.0 0.01 2010–11 56 36.4 30.7
Disobedient/Disruptive
Behavior
2008–09 81 131.8 215.3
2.13 119.5 0.04 2010–11 56 73.9 98.0
Harassment/Intimidation 2008–09 81 12.8 19.1
2.91 124.8 0.00 2010–11 56 5.6 9.6
Serious Bodily Injury 2008–09 81 13.3 25.2
2.30 125.5 0.02 2010–11 56 5.8 12.8
Total Incidents 2008–09 81 233.1 321.7
2.43 123.7 0.02 2010–11 56 132.4 158.1
Table 22. Differences in Mean Levels of Disciplinary Incident Reports from 2008–09 to
2010–11, Schools with MEDIUM or HIGH Implementation of PATHS as Reported
During the 2011–12 School Year
Type of Incident Year N Mean Std.
Dev. t df
Sig. (2-
tailed)
Fighting/Violence 2008–09 31 54.4 46.6
1.20 53.0 0.24 2010–11 24 41.3 30.3
Disobedient/Disruptive
Behavior
2008–09 31 69.5 60.8
2.13 46.6 0.04 2010–11 24 42.6 30.9
Harassment/Intimidation 2008–09 31 8.9 11.3
2.21 49.1 0.03 2010–11 24 3.6 6.4
Serious Bodily Injury 2008–09 31 7.1 11.1
1.74 50.7 0.09 2010–11 24 2.9 6.8
Total Incidents 2008–09 31 141.7 116.3
2.06 48.5 0.05 2010–11 24 90.9 64.4

Avoid Simple Solutions and Quick Fixes: Lessons Learned from a Comprehensive Districtwide Approach to Improving Conditions for Learning
January 2, 2013 Page 41
Table 23. Differences in Mean Levels of Disciplinary Incident Reports from 2008–09 to
2010–11, Schools with LOW Implementation of PATHS as Reported During the 2011–12
School Year
Type of Incident Year N Mean Std.
Dev. t df
Sig. (2-
tailed)
Fighting/Violence 2008–09 18 64.5 48.0
1.14 30.0 0.26 2010–11 14 47.1 34.2
Disobedient/Disruptive
Behavior
2008–09 18 100.6 72.4
1.28 30.0 0.21 2010–11 14 71.9 47.9
Harassment/Intimidation 2008–09 18 11.3 9.8
2.09 30.0 0.05 2010–11 14 4.6 8.0
Serious Bodily Injury 2008–09 18 9.9 10.7
2.25 28.0 0.03 2010–11 14 3.1 6.3
Total Incidents 2008–09 18 190.4 121.5
1.77 28.0 0.09 2010–11 14 130.3 68.8
Table 24. Differences in Mean Levels of Disciplinary Incident Reports from 2008–09 to
2010–11, Schools with MEDIUM or HIGH Implementation of Student Support Teams as
Reported During the 2011–12 School Year
Type of Incident Year N Mean Std.
Dev. t df
Sig. (2-
tailed)
Fighting/Violence 2008–09 47 55.4 46.8
2.80 76.5 0.01 2010–11 39 32.6 27.7
Disobedient/Disruptive
Behavior
2008–09 47 147.9 238.9
1.78 66.7 0.08 2010–11 39 78.8 108.4
Harassment/Intimidation 2008–09 47 13.6 18.9
2.82 69.1 0.01 2010–11 39 4.8 9.2
Serious Bodily Injury 2008–09 47 14.3 28.6
2.24 59.2 0.03 2010–11 39 4.3 10.1
Total Incidents 2008–09 47 248.7 341.6
2.22 64.8 0.03 2010–11 39 126.5 146.5
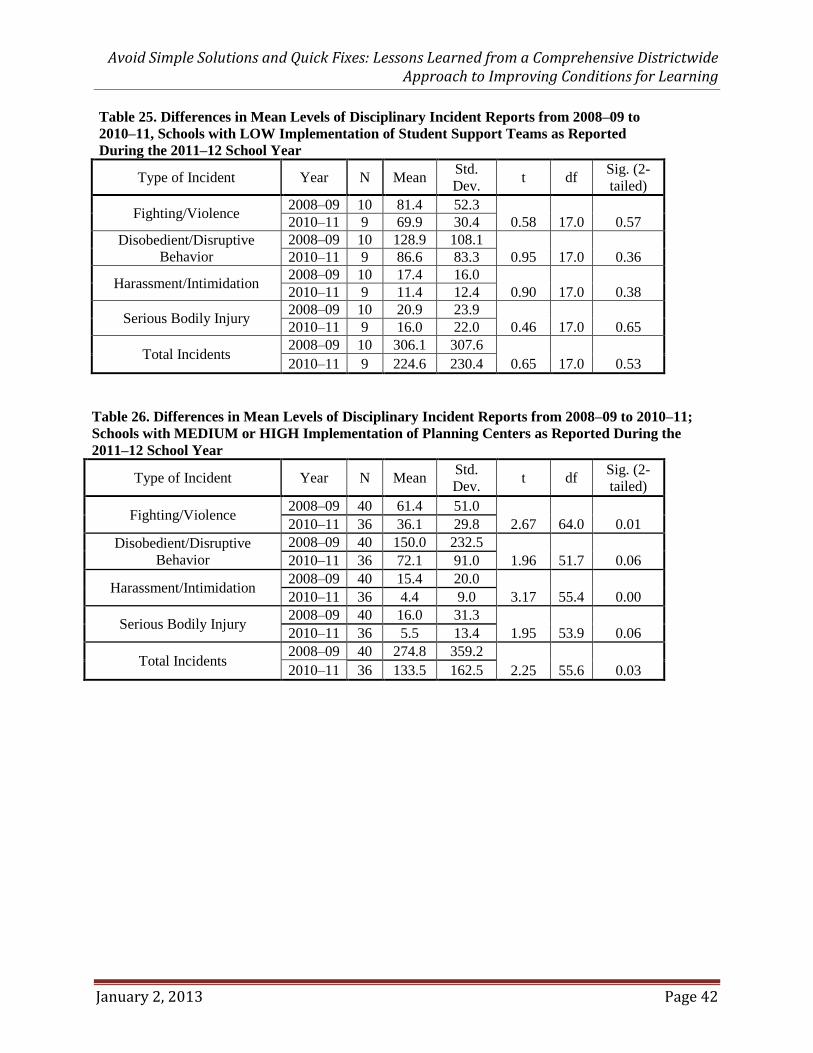
Avoid Simple Solutions and Quick Fixes: Lessons Learned from a Comprehensive Districtwide Approach to Improving Conditions for Learning
January 2, 2013 Page 42
Table 25. Differences in Mean Levels of Disciplinary Incident Reports from 2008–09 to
2010–11, Schools with LOW Implementation of Student Support Teams as Reported
During the 2011–12 School Year
Type of Incident Year N Mean Std.
Dev. t df
Sig. (2-
tailed)
Fighting/Violence 2008–09 10 81.4 52.3
0.58 17.0 0.57 2010–11 9 69.9 30.4
Disobedient/Disruptive
Behavior
2008–09 10 128.9 108.1
0.95 17.0 0.36 2010–11 9 86.6 83.3
Harassment/Intimidation 2008–09 10 17.4 16.0
0.90 17.0 0.38 2010–11 9 11.4 12.4
Serious Bodily Injury 2008–09 10 20.9 23.9
0.46 17.0 0.65 2010–11 9 16.0 22.0
Total Incidents 2008–09 10 306.1 307.6
0.65 17.0 0.53 2010–11 9 224.6 230.4
Table 26. Differences in Mean Levels of Disciplinary Incident Reports from 2008–09 to 2010–11;
Schools with MEDIUM or HIGH Implementation of Planning Centers as Reported During the
2011–12 School Year
Type of Incident Year N Mean Std.
Dev. t df
Sig. (2-
tailed)
Fighting/Violence 2008–09 40 61.4 51.0
2.67 64.0 0.01 2010–11 36 36.1 29.8
Disobedient/Disruptive
Behavior
2008–09 40 150.0 232.5
1.96 51.7 0.06 2010–11 36 72.1 91.0
Harassment/Intimidation 2008–09 40 15.4 20.0
3.17 55.4 0.00 2010–11 36 4.4 9.0
Serious Bodily Injury 2008–09 40 16.0 31.3
1.95 53.9 0.06 2010–11 36 5.5 13.4
Total Incidents 2008–09 40 274.8 359.2
2.25 55.6 0.03 2010–11 36 133.5 162.5

Avoid Simple Solutions and Quick Fixes: Lessons Learned from a Comprehensive Districtwide Approach to Improving Conditions for Learning
January 2, 2013 Page 43
Table 27. Differences in Mean Levels of Disciplinary Incident Reports from 2008–09 to
2010–11, Schools with LOW Implementation of Planning Centers as Reported During the
2011–12 School Year
Type of Incident Year N Mean Std.
Dev. t df
Sig. (2-
tailed)
Fighting/Violence 2008–09 18 55.2 41.9
0.35 28.0 0.73 2010–11 12 50.1 35.3
Disobedient/Disruptive
Behavior
2008–09 18 125.8 193.0
0.33 28.0 0.75 2010–11 12 104.7 135.8
Harassment/Intimidation 2008–09 18 11.4 1357
0.09 28.0 0.93 2010–11 12 11.0 11.7
Serious Bodily Injury 2008–09 18 13.4 17.5
0.63 28.0 0.53 2010–11 12 9.6 14.7
Total Incidents 2008–09 18 212.4 265.8
0.38 28.0 0.71 2010–11 12 179.3 182.7