AVIVA INVESTORS G7 FIXED INCOME FUNDpolitics.leics.gov.uk/documents/s78839/Presentation by...
52
AVIVA INVESTORS G7 FIXED INCOME FUND Prepared for professional clients and /or qualified investors only. It is not to be viewed by or used with retail clients April 2013
Transcript of AVIVA INVESTORS G7 FIXED INCOME FUNDpolitics.leics.gov.uk/documents/s78839/Presentation by...

AVIVA INVESTORS G7 FIXED INCOME FUND
Prepared for professional clients and /or qualified investors only. It is not to be viewed by or used with retail clients
April 2013

IMPORTANT INFORMATION
NOT FOR PUBLIC DISTRIBUTION
The distribution and offering of shares may be restricted by law in certain jurisdictions. The content of thisdocument should not be viewed as an offer or solicitation to subscribe for shares of the fund by anyone in anyjurisdiction in which such an offer or solicitation is not lawful or in which the person making such offer orsolicitation is not qualified to do so or to anyone to whom it is unlawful to make such an offer or solicitation.
This presentation is for information purposes only and is not intended for and may not, without the express consent ofAviva Investors, be distributed to, and may not be relied upon by, any other party, including, without limitation, anyadvisory or other client of the recipient.
The Aviva Investors G7 Fixed Income Fund is a Cell of Aviva Investors Alternative Funds PCC Limited, a protected cellinvestment company incorporated in Guernsey.
This presentation is not available for general distribution in, from or into the United Kingdom because the Aviva InvestorsG7 Fixed Income Fund is an unregulated collective investment scheme whose promotion is restricted by sections 238 and240 of the Financial Services and Markets Act 2000. When distributed in, from or into the United Kingdom, this documentis only intended for persons having professional experience of investing in unregulated schemes, high net worthcompanies, partnerships, associations or trusts and personnel of any of the foregoing having professional experience ofinvesting in unregulated schemes (each within the Financial Services and Markets Act 2000 (Promotion of CollectiveInvestment Schemes) (Exemptions) Order 2001), persons outside the European Economic Area receiving it electronically,persons outside the United Kingdom receiving it non-electronically and any other persons to whom it may becommunicated lawfully. No other person should act or rely on it.
2
G7 Fixed Income Fund

1 Performance review
2 Investment philosophy and process
3 What are we focusing on?
4 Risk management
Appendix 1: The capability
Appendix 2: Key terms and investor breakdowns
Appendix 3: Trade examples
Appendix 4: Biographies
Appendix 5: Introduction to Aviva Investors
Appendix 6: GIPS performance & disclosures
AGENDA
G7 Fixed Income Fund

1. PERFORMANCE REVIEW
4
G7 Fixed Income Fund

Source: Aviva Investors as at 28 February 2013. *Annualised returns. Returns are reported in GBP, net of fees. Past performance is not a guide to future performance. Inception date: 3 February 2003
Annualised volatility of monthly returns: 2.7% since inception
As at 28 February 20131 month (%)
3 months (%)
6 months(%)
1 year (%)
3 years (%)*
5 years (%)*
Since inception (%)*
G7 Fixed Income Fund (GBP- tranche I ) 0.65 0.27 0.23 1.49 3.41 6.48 9.39
1 month GBP LIBOR 0.04 0.12 0.25 0.58 0.61 1.45 3.11
-1
0
1
2
3
4
5
6
7
8
9
10
1 month 3 months 6 months 1 year 3 years 5 years Since inception(%)*
G7 Fixed Income 1 month GBP LIBOR
G7 FIXED INCOME FUND PERFORMANCEGBP TRANCHE 1
5
G7 Fixed Income Fund
%
PORTFOLIO RETURNS SO FAR…
G7 Fixed Income Fund
6
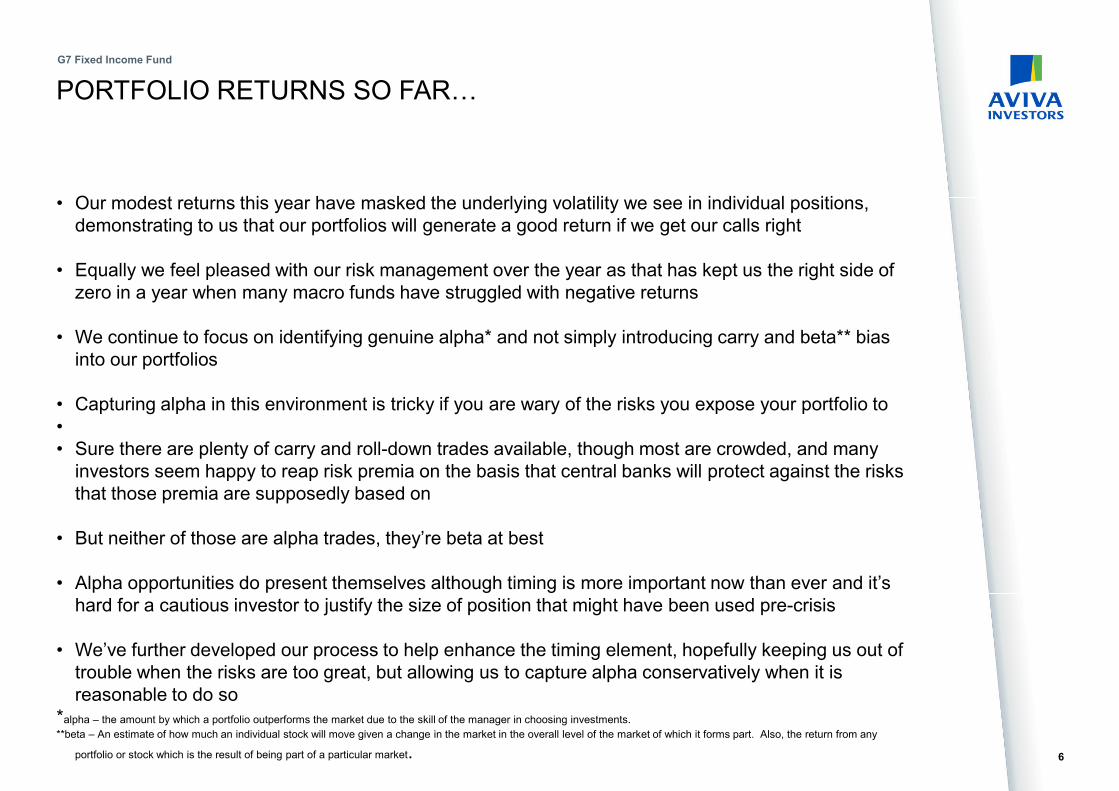
• Our modest returns this year have masked the underlying volatility we see in individual positions,
demonstrating to us that our portfolios will generate a good return if we get our calls right
• Equally we feel pleased with our risk management over the year as that has kept us the right side of
zero in a year when many macro funds have struggled with negative returns
• We continue to focus on identifying genuine alpha* and not simply introducing carry and beta** bias
into our portfolios
• Capturing alpha in this environment is tricky if you are wary of the risks you expose your portfolio to
•
• Sure there are plenty of carry and roll-down trades available, though most are crowded, and many
investors seem happy to reap risk premia on the basis that central banks will protect against the risks
that those premia are supposedly based on
• But neither of those are alpha trades, they’re beta at best
• Alpha opportunities do present themselves although timing is more important now than ever and it’s
hard for a cautious investor to justify the size of position that might have been used pre-crisis
• We’ve further developed our process to help enhance the timing element, hopefully keeping us out of
trouble when the risks are too great, but allowing us to capture alpha conservatively when it is
reasonable to do so
*alpha – the amount by which a portfolio outperforms the market due to the skill of the manager in choosing investments.
**beta – An estimate of how much an individual stock will move given a change in the market in the overall level of the market of which it forms part. Also, the return from any
portfolio or stock which is the result of being part of a particular market.
RISKS SIMILARITIES POST 2008 VERSUS NOW
2008
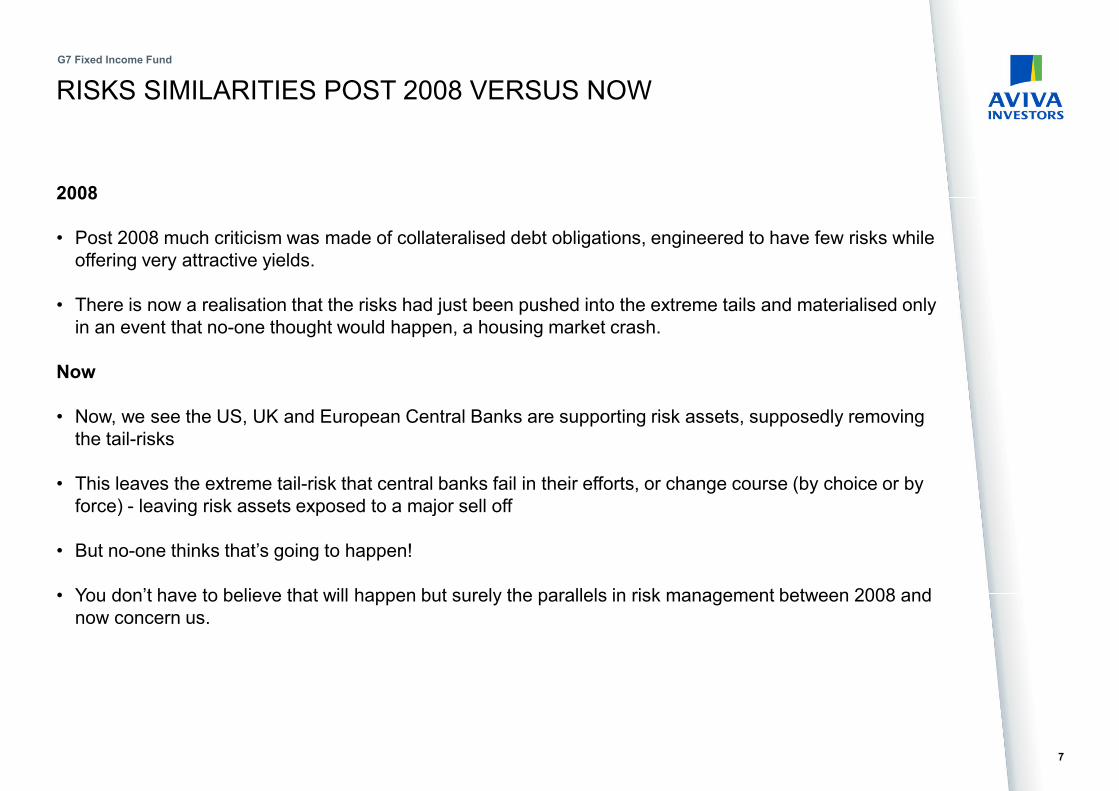
• Post 2008 much criticism was made of collateralised debt obligations, engineered to have few risks while
offering very attractive yields.
• There is now a realisation that the risks had just been pushed into the extreme tails and materialised only
in an event that no-one thought would happen, a housing market crash.
Now
• Now, we see the US, UK and European Central Banks are supporting risk assets, supposedly removing
the tail-risks
• This leaves the extreme tail-risk that central banks fail in their efforts, or change course (by choice or by
force) - leaving risk assets exposed to a major sell off
• But no-one thinks that’s going to happen!
• You don’t have to believe that will happen but surely the parallels in risk management between 2008 and
now concern us.
7
G7 Fixed Income Fund

GOING FORWARD…
G7 Fixed Income Fund
8
• We are starting to find attractively priced medium to longer term volatility positions in some markets
and are looking to implement more tail hedges and blow-up trades
• Asset swap behaviour is returning to normal, being driven more by supply and demand than
dominated by risk-on, risk-off sentiment
• Allows us to exploit opportunities in this space more assertively as we won’t simply be adding risk to
our big macro call that we are expressing elsewhere in our book
• Another theme we see developing is the structural deterioration in Japan.
• While this is a call that has been made previously and not worked, we see the change in the current
account balance as being a key difference this time
• The recent current account deficit may be a short-term one-off but we doubt Japan will return to
running a significant surplus anytime soon
• There is also plenty of government issuance to come this year which will continue to provide an
opportunity set for us, and we expect more genuine macro plays to occur over next year as well
• We feel that the success of central banks this year in forestalling any build up in market concerns was
fortuitous and will be a tough act to repeat next year
• So we remain cautiously optimistic of our return prospects in the near future, if pretty pessimistic still
on the likelihood of policy makers getting to grips with solving the problems western economies are
facing

2. INVESTMENT PHILOSOPHY AND PROCESS
9
G7 Fixed Income Fund

OUR INVESTMENT PHILOSOPHY
We believe that most trading opportunities arise from major economic themes and market dislocations
A deep understanding of economic drivers and market dynamics enables investors to earn excess
returns by exploiting these opportunities. To do this well requires:
Ability to identify trends and exploit the markets’ tendency to overreact
Disciplined management of downside risks
Diversified sources of added value
10
G7 Fixed Income Fund

INVESTMENT UNIVERSE
Macro directional trends and corrections Relative value & pricing anomalies
Seeking returns from a variety of sources
Higher volatility
Higher market
correlation
Lower volatility
Lower market
correlation
Asset allocation
Cross market trades
Currency trades
Directional rates
Short end positioning
Yield curve positioning
Swap spread positioning
Supply/demand
Futures basis trading
30% 70%
11
G7 Fixed Income Fund

FOUR-STEP INVESTMENT PROCESS
Process based on rigorous analysis
Step One Step Two Step Three Step Four
Implementation
– Trade sizes
– Stop losses
– Profit targets
Idea generation
Asset allocation
Directional rates
Relative value
– Macro view
– Central investment themes
Portfolio Construction
– Risk budgeting
– Security
selection
Developing a “big picture”
Formulating high conviction themes
Allocating risk across themes and trades
Rigorous risk controls
12
G7 Fixed Income Fund

STEP ONE: IDEA GENERATIONLAYER ONE: FIXED INCOME ASSET ALLOCATION (QUALITATIVE ANALYSIS)
A thorough understanding of the macro environment provides the framework for qualitative discussion
Phase 2
Phase 3 Phase 4
Phase 1
Outperform
OutperformUnderperform
Low volatility High volatility
Non-
trending
Trending
Outperform
1
GDP cycle analysis Trading environment
Tracking GDP over cycles enables us
to identify where we are in the cycle..
Identify the performance of asset classes,
based on the cyclicality of capital and income …and to identify the trading environment
P1 P2 P3 P4
Global Cash
Global 2Y
Global 10Y
Global IG Credit
Global High Yield
Emerging Market Debt
Emerging Local Currency
Developed Inflation Linked
Emerging Inflation Linked
Global Equities
Global Emerging Equities
OutperformUnderperformNo clear
pattern
Asset allocation flows
13
G7 Fixed Income Fund
STEP ONE: IDEA GENERATIONLAYER TWO: DIRECTIONAL ANALYSIS (QUANTITATIVE ANALYSIS)
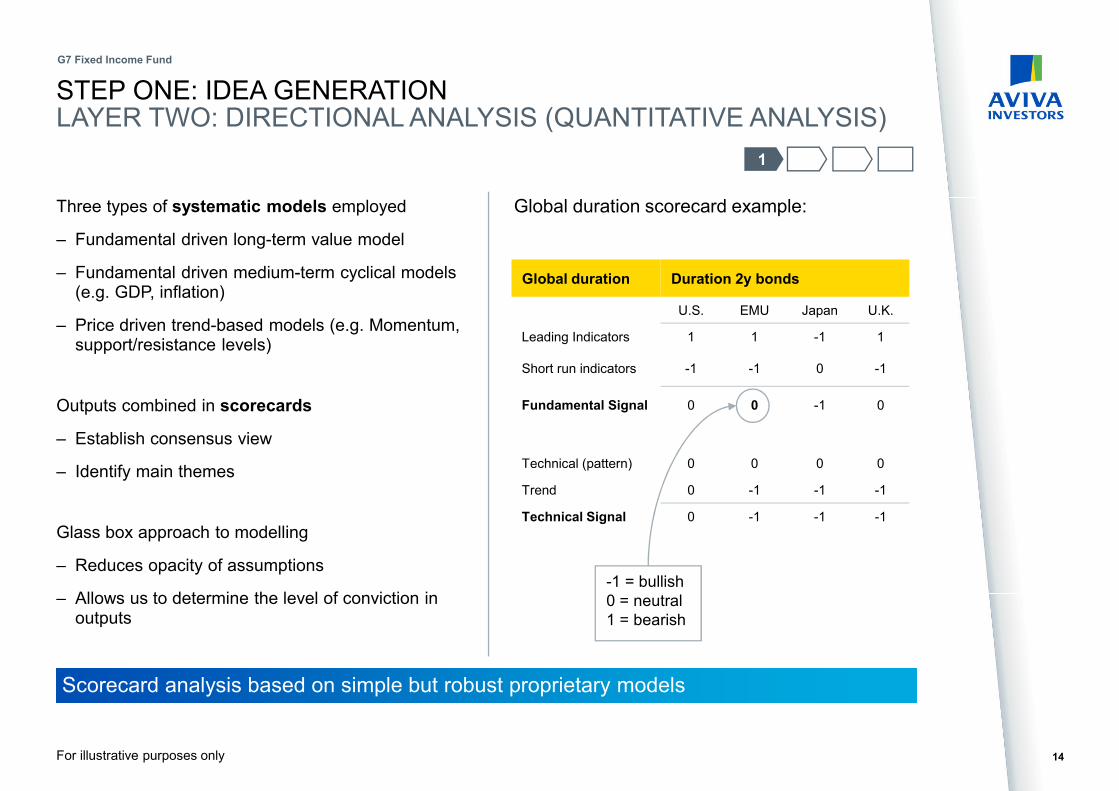
Three types of systematic models employed
– Fundamental driven long-term value model
– Fundamental driven medium-term cyclical models (e.g. GDP, inflation)
– Price driven trend-based models (e.g. Momentum, support/resistance levels)
Outputs combined in scorecards
– Establish consensus view
– Identify main themes
Glass box approach to modelling
– Reduces opacity of assumptions
– Allows us to determine the level of conviction in outputs
For illustrative purposes only
Global duration scorecard example:
Scorecard analysis based on simple but robust proprietary models
-1 = bullish
0 = neutral
1 = bearish
1
Global duration Duration 2y bonds
U.S. EMU Japan U.K.
Leading Indicators 1 1 -1 1
Short run indicators -1 -1 0 -1
Fundamental Signal 0 0 -1 0
Technical (pattern) 0 0 0 0
Trend 0 -1 -1 -1
Technical Signal 0 -1 -1 -1
14
G7 Fixed Income Fund

STEP ONE: IDEA GENERATIONLAYER THREE: RELATIVE VALUE(TECHNICAL ANALYSIS)
Source: Bloomberg, Screenshots taken in March 2010 for illustrative purposes only and do not reflect current market conditions
Deep understanding of market dynamics
Technical analysis Relative value analysis Fundamental analysis
UK 10yr gilt moving averages
– Example: 10yr rates moving
average convergence/
divergence
– Momentum, support and
resistance levels to inform trade
timing and profit target/stop loss
setting
UK gilts relative value
– Example: UK Gilt 2.25% Mar ‘14
vs. Gilt 5% Sep ’14
Jan-06
Apr-06
Jul-06
Oct-06
Jan-07
Apr-07
Jul-07
Oct-07
Jan-08
Apr-08
Jul-08
Oct-08
Jan-09
Apr-09
Jul-09
Oct-09
Jan-10-60
-40
-20
0
20
40
60
10yr30yr vs. 5yr10yr curve
– Example: 10yr30yr vs. 5yr10yr
– Looking for tactical curve trading
opportunities
1
15
G7 Fixed Income Fund

STEP TWO: CENTRAL INVESTMENT THEMES
Source: Aviva Investors sovereign absolute return investment team. March 2013
– Analytical process culminates in the identification of a set of investment themes with relatively low correlation
– Each theme will be expressed via approximately five trading strategies at any one time
– Thematic approach is applied to all funds
2
Theme 2
Active trading
around
government
bond supply
Theme 3
Long volatility
bias
Theme 5
Long the USD
currency
Theme 4
Bank funding to
remain under
pressure
Macroeconomic view“Economic growth rolling over”
Theme 1
Tail hedges
16
G7 Fixed Income Fund
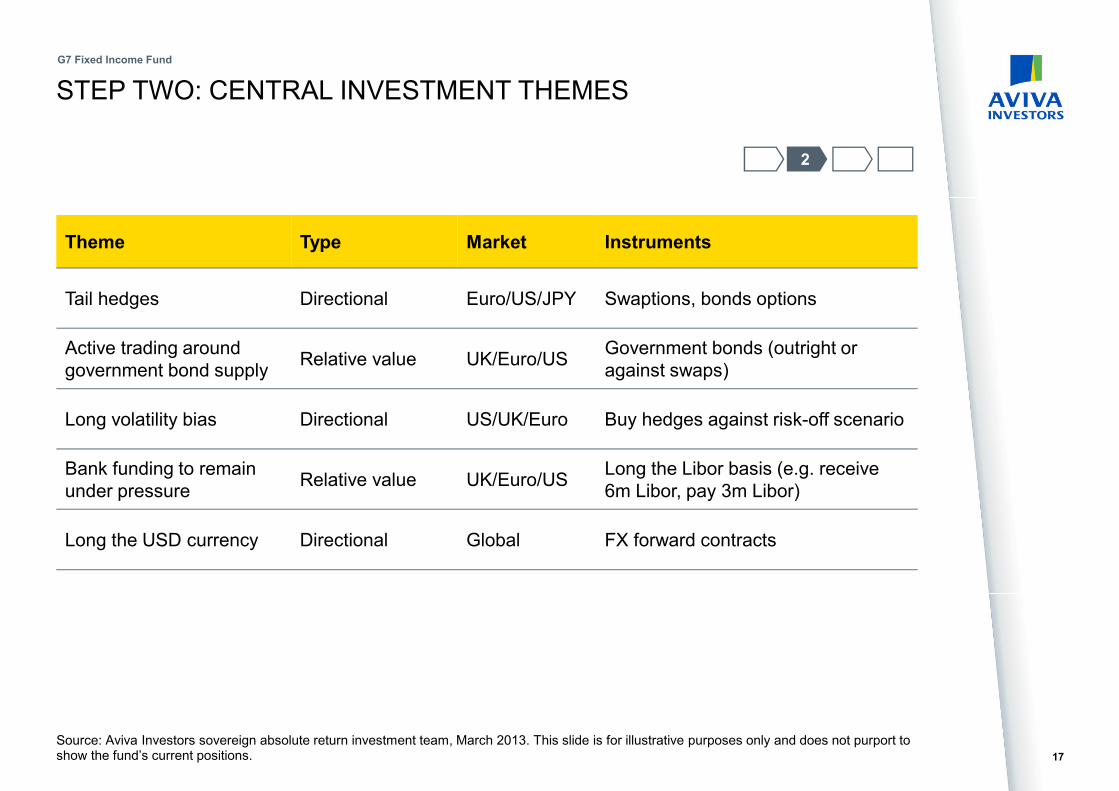
STEP TWO: CENTRAL INVESTMENT THEMES
Source: Aviva Investors sovereign absolute return investment team, March 2013. This slide is for illustrative purposes only and does not purport to show the fund’s current positions.
2
Theme Type Market Instruments
Tail hedges Directional Euro/US/JPY Swaptions, bonds options
Active trading around
government bond supplyRelative value UK/Euro/US
Government bonds (outright or
against swaps)
Long volatility bias Directional US/UK/Euro Buy hedges against risk-off scenario
Bank funding to remain
under pressureRelative value UK/Euro/US
Long the Libor basis (e.g. receive
6m Libor, pay 3m Libor)
Long the USD currency Directional Global FX forward contracts
17
G7 Fixed Income Fund

STEP THREE: PORTFOLIO CONSTRUCTION
Theme 4
Target 6% p.a. (net of fees) at portfolio level i.e. 0.5% per month
Theme 3 Theme 5
Aim to deliver 0.10% per month
Aim to deliver 0.10% per month
Aim to deliver 0.10% per month
Aim to deliver 0.10% per month
Aim to deliver 0.10% per month
The number of trades within a theme
depends on the conviction level
On average the portfolio runs about 25
trades
Theme 2Theme 1
3
Trade 1
Trade 2
Trade 3
Trade 4
Trade 5
Target for internal fund management purposes only and is not a guarantee or indication of future returns 18
G7 Fixed Income Fund
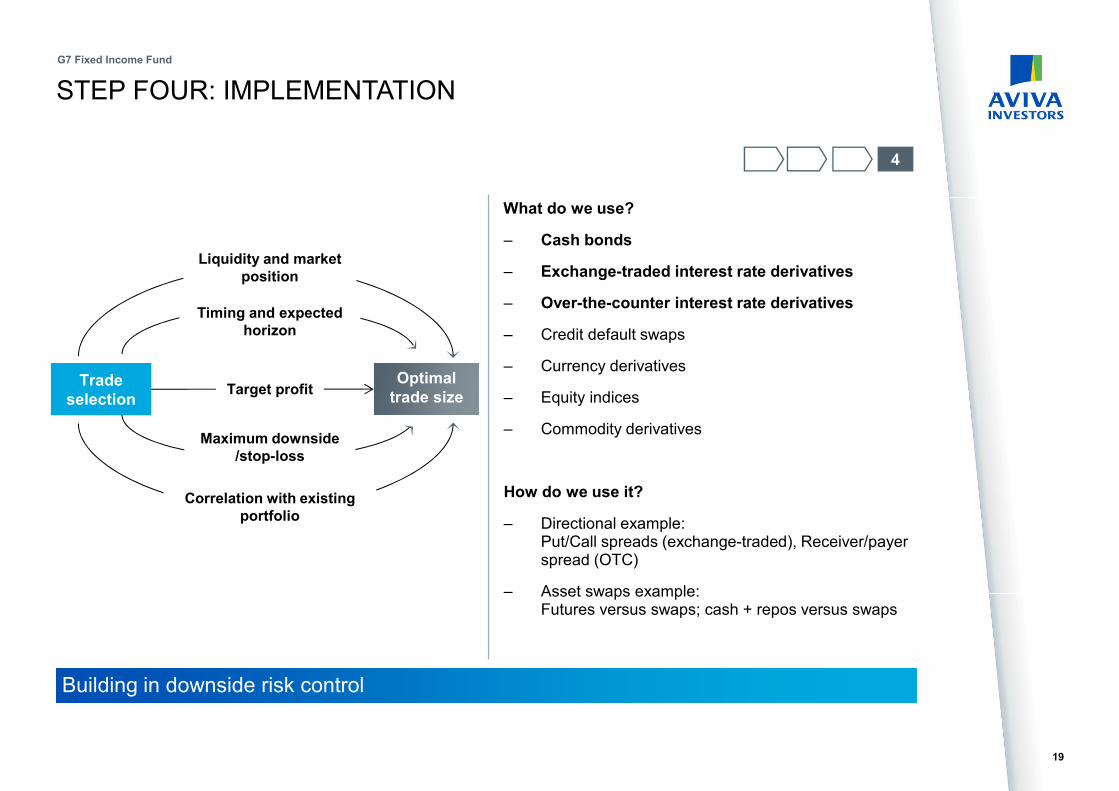
STEP FOUR: IMPLEMENTATION
What do we use?
– Cash bonds
– Exchange-traded interest rate derivatives
– Over-the-counter interest rate derivatives
– Credit default swaps
– Currency derivatives
– Equity indices
– Commodity derivatives
How do we use it?
– Directional example:Put/Call spreads (exchange-traded), Receiver/payer spread (OTC)
– Asset swaps example:Futures versus swaps; cash + repos versus swaps
Building in downside risk control
Trade selection
Optimal trade size
Liquidity and market position
Maximum downside/stop-loss
Timing and expected horizon
Correlation with existing portfolio
Target profit
4
19
G7 Fixed Income Fund

3. WHAT ARE WE FOCUSING ON?
20
G7 Fixed Income Fund
OUR INVESTMENT PROCESS
21
G7 Fixed Income Fund
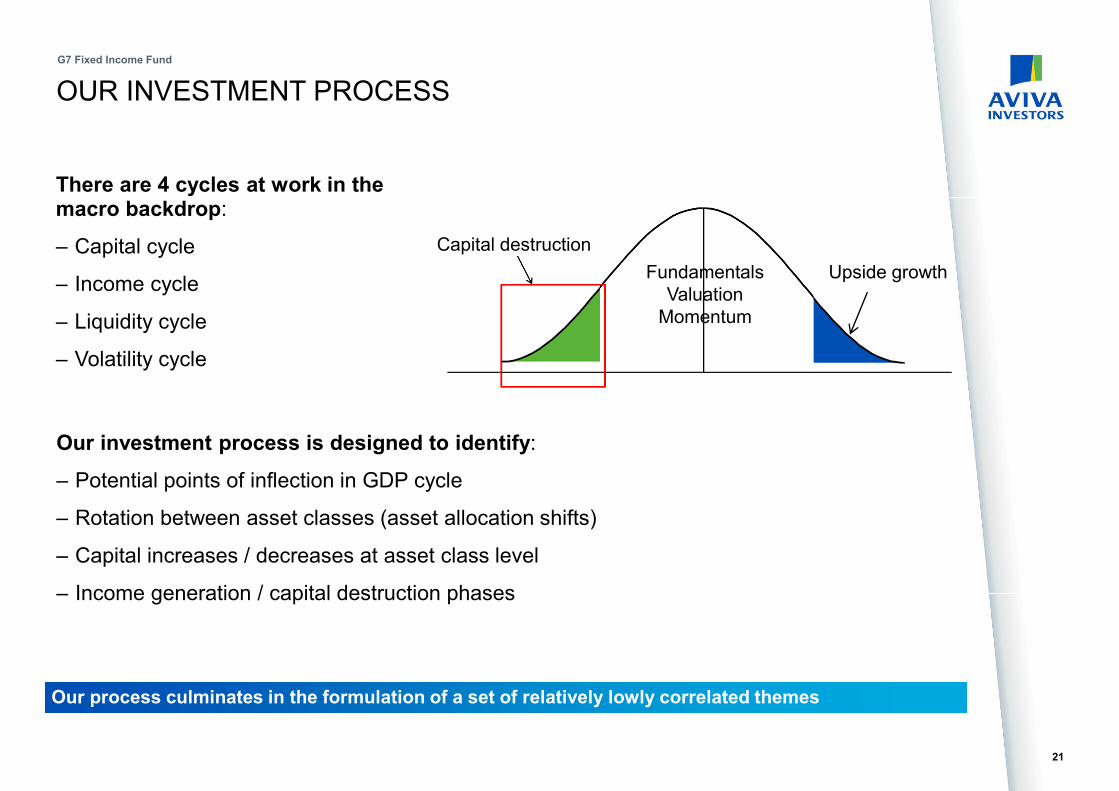
Our process culminates in the formulation of a set of relatively lowly correlated themes
Our investment process is designed to identify:
– Potential points of inflection in GDP cycle
– Rotation between asset classes (asset allocation shifts)
– Capital increases / decreases at asset class level
– Income generation / capital destruction phases
There are 4 cycles at work in the macro backdrop:
– Capital cycle
– Income cycle
– Liquidity cycle
– Volatility cycle
Capital destruction
Upside growthFundamentals
Valuation
Momentum

OUR CENTRAL INVESTMENT THEMES
Source: Aviva Investors sovereign absolute return investment team, February 2013
Theme 2
Relative value
active trading
Theme 3
Long volatility
bias
Theme 5
Long the USD
currency
Theme 4
Bank funding to
remain under
pressure
Macroeconomic view“Economic growth rolling over”
Theme 1
Yields rising
theme
22
G7 Fixed Income Fund
These themes apply across our strategies

ARE YIELDS SET TO RISE FURTHER?
G7 Fixed Income Fund
23
0.05
0.06
0.07
0.08
0.09
02 Jan2013
11 Jan2013
22 Jan2013
31 Jan2013
11 Feb2013
20 Feb2013
Ind
ex r
ate
(%
)
EONIA – Euro overnight interest rate (%) 5 year swap rates (%)
0.85
0.90
0.95
1.00
1.05
1.10
1.15
1.20
1.25
02 Jan2013
11 Jan2013
22 Jan2013
31 Jan2013
11 Feb2013
20 Feb2013
Sw
ap
ra
te (
%)
Source: Bloomberg as at 21 February 2012
• One of the major market moves in 2013 has been the unwind of 2012’s carry trade at the front end of
Europe
• With a fiscal cliff resolution, a hawkish ECB meeting in January and a larger than expected 1st LTRO
repayment
• Crowded positioning meant a 35bps sell off in 5y rates as the carry trade was unwound with stops
being triggered and short positions been initiated
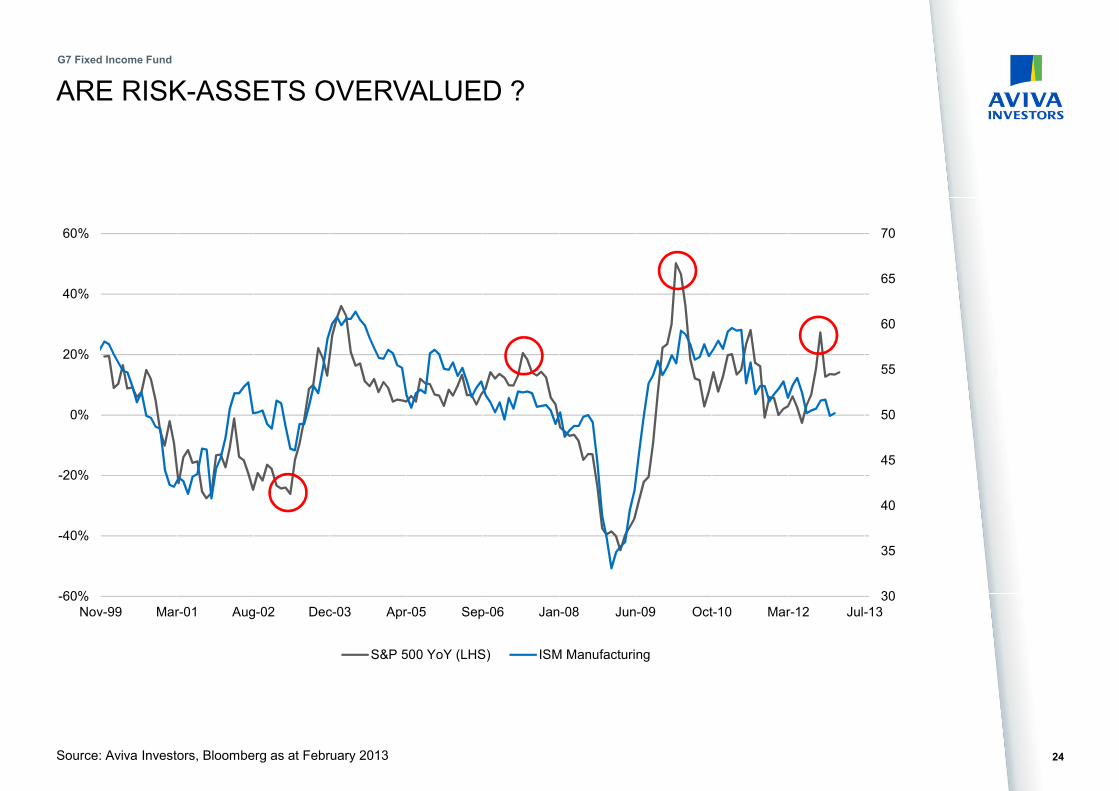
ARE RISK-ASSETS OVERVALUED ?
G7 Fixed Income Fund
24Source: Aviva Investors, Bloomberg as at February 2013
30
35
40
45
50
55
60
65
70
-60%
-40%
-20%
0%
20%
40%
60%
Nov-99 Mar-01 Aug-02 Dec-03 Apr-05 Sep-06 Jan-08 Jun-09 Oct-10 Mar-12 Jul-13
S&P 500 YoY (LHS) ISM Manufacturing

BEWARE OF GEOPOLITICAL RISKEMBED TAIL HEDGES INTO PORTFOLIOS
G7 Fixed Income Fund
Source: Bloomberg, 2 October 2012
– Implied volatility hedges have an inherent cost of carry, making systematic buy and hold strategies
expensive over time. Performance can be enhanced by adding to hedges at times of anticipated near
term market stress.
– ‘Green lights’ include:
– Upcoming macro events not fully reflected in option prices
– Changes in implied volatility term structure
– Changes in the volatility of implied volatility
– Trend changes in implied volatility levels
Option market based tail risk monitor
25
Long volatility strategy P&L using a combination of ‘green lights’ to time hedges
Increase
volatility
hedges when
option market
shows
increasing
signs of stress
Decrease
volatility
hedges when
option market
indicates a
more benign
environment
Ind
ex le
ve
l
Ind
ex le
ve
l
600
800
1000
1200
1400
1600
1800
0
100
200
300
400
500
600
700
800
Dec 2005 Apr 2007 Aug 2008 Dec 2009 Apr 2011 Aug 2012
Long vol strategy P&L (LHS) S&P Index (RHS)

Zahra Sachak (6,2)Client portfolio
manager
FIXED INCOME TEAM
Shahid Ikram (23,23)Chief Investment Officer
and Head of Fixed Income
Figures indicate (years of industry experience, years at Aviva Investors) as at 31 December 2012
Steve Ryder (8,6)Sovereign portfolio
analyst
Sovereign absolute return team
James Kenney (11,8)Portfolio derivatives
manager
Catherine Smith (5,4)Portfolio analyst
Mo Miah (13,12)Investment analyst
Trevor Welsh (29,14)Fund manager
Ed Hutchings, CFA (11,9)Fund manager
Absolute returns UK and Global Inflation Global bonds Emerging market debt
Dan JamesGabriela Schneider, CFAAnthony David, CFAAnthony PhilipsDaniel Klusmann
Jerry BrewinValentina Chen, CFA, CAIAAlex ParrAaron Grehan, CFADaniel Klusmann
Raphaelle Moysan, CFA (15,3) Client
portfolio manager
Fixed Income quantitative team
Long only fixed income teams
Paul Abberley (32,4)Interim Chief Executive
Officer
Upkar Kambo, CFA (20,9)Head of fixed income
quantitative analysis
Stuart Ritson (13,6)Quantitative analyst
Chris Garcia, CFA (12,7)Quantitative analyst
Miguel Ancona-Navarrete (12,4)Quantitative analyst
Ben Maynard, CFA (17,4)Derivatives analyst
Credit
16 credit analysts3 portfolio analysts2 traders7 fund managers
Convertible bonds
David Clott, CFAShawn Mato, CFAJustin Craib-Cox, CFABrendan Ryan, CFA
Benjamin Carter (<1,<1) Client portfolio
manager - associate
Hassan Nabi(6,3) Client relationship
manager
26
G7 Fixed Income Fund

4. RISK MANAGEMENT
27
G7 Fixed Income Fund

RISK MANAGEMENT FRAMEWORK
Type of risk Official fund restrictions Desk guidelines Independent oversight
Market risk
• Main drivers: interest
rates and currencies
• Typically increased
through use of leverage
5 day, 95% confidence interval: 2% soft limit (5 business day
rectification period), 3% hard limit (immediate rectification)
Stop loss set at 6% NAV (automatic liquidation of portfolio)
Max 40% NAV in a single collective investment vehicle, (20%
in vehicle which invests mainly in other collective vehicles)
Max 20% GAV in corporate debt
Max 20% GAV in equities (not directly)
Max 10% GAV in commodities (not directly)
Max loss on unhedged short position is 100% of value of
position at time of investment.
Risk budgeting integral to process of
trade selection / timing
Target profit and stop-losses put in
place at theme and trade level –
themes/trades closed out as soon as
possible once these levels are reached
Independent portfolio risk
team:
Daily monitoring of VaR and
daily risk analysis available
Monthly formal risk analysis
dissecting the portfolio risk by
currency, strategy and
interest rate sensitivities as
well as stress-testing under
various theoretical and
historical scenarios.
Credit risk
• Principally derives from
exposure to trading
counterparties & issuers
of securities held by the
fund
Individual counterparty, issuer and OTC exposure limits
applied as per the fund prospectus
Minimum credit rating of sovereign/corporate issuers for
long-term debt: BBB-/Baa3
Availability of 23 ISDA lines with daily
collateral posting
Counterparty sign-off and
monitoring by Aviva Investors
Credit Committee
Max. exposure to any one
counterparty (excluding PB):
20% gross assets
Liquidity risk
• Suspension or restriction
of trading on exchange
• Available liquidity from
OTC counterparties
Aim to hold minimum of 50%
unencumbered cash
Over 75% of portfolio able to be
liquidated within 3 business days
Operational risk Independent fund administrator: State Street (Guernsey) Ltd Robust operational model
Quarterly oversight by
independent board
Annual SAS 70 reviews of
investment manager
28
G7 Fixed Income Fund
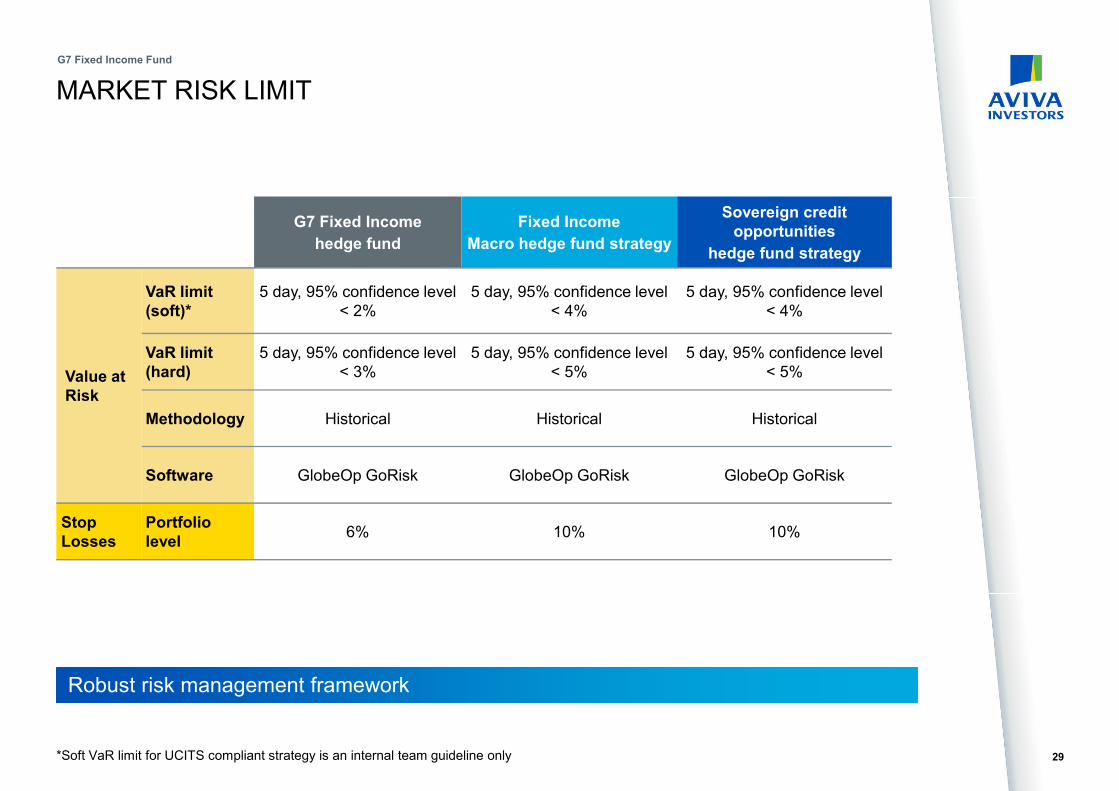
MARKET RISK LIMIT
*Soft VaR limit for UCITS compliant strategy is an internal team guideline only
Robust risk management framework
29
G7 Fixed Income Fund
G7 Fixed Income
hedge fund
Fixed Income
Macro hedge fund strategy
Sovereign credit opportunities
hedge fund strategy
Value at Risk
VaR limit (soft)*
5 day, 95% confidence level
< 2%
5 day, 95% confidence level
< 4%
5 day, 95% confidence level
< 4%
VaR limit (hard)
5 day, 95% confidence level
< 3%
5 day, 95% confidence level
< 5%
5 day, 95% confidence level
< 5%
Methodology Historical Historical Historical
Software GlobeOp GoRisk GlobeOp GoRisk GlobeOp GoRisk
Stop Losses
Portfolio level
6% 10% 10%

MARKET RISK METRICSValue at Risk
Stress testing
Sensitivity analysis
Value at Risk (5 day, 95% confidence interval) is the
primary risk metric…Key sensitivities are closely monitored, overall and by
main currency
…as are range of stress and scenario tests
Source: Aviva Investors Risk Management Team as at 28 February 2013 30
G7 Fixed Income Fund
VaR Summary 95% 99%
5-days (%) 0.34 0.53
30-days (%) 0.57 0.86
-2.00%
-1.50%
-1.00%
-0.50%
0.00%
0.50%
1.00%
1.50%
Feb
-12
Ma
r-1
2
Ap
r-1
2
Ma
y-1
2
Jun
-12
Jul-
12
Au
g-1
2
Sep
-12
Oct-
12
No
v-1
2
De
c-1
2
Jan
-13
Feb
-13
1 Year Weekly Return vs Weekly VaR
Weekly Returns Weekly VaR
Contribution to VaR by Currency
Currency Incremental VaR Volatility WorstLoss
AUD -2.49% 0.02% 0.02%
CAD 0.54% 0.00% 0.01%
CHF -0.07% 0.01% 0.03%
DKK 1.72% 0.01% 0.02%
EUR 37.80% 0.21% 0.85%
GBP 6.48% 0.08% 0.29%
JPY 23.83% 0.07% 0.18%
NZD -1.10% 0.00% 0.01%
SEK 0.86% 0.01% 0.03%
USD 24.69% 0.05% 0.16%
KRW 8.10% 0.07% 0.07%
NOK -0.37% 0.01% 0.04%
-60,000
-50,000
-40,000
-30,000
-20,000
-10,000
0
10,000
AUD CAD CHF CNY DKK EUR GBP JPY KRW NOK NZD SEK USD
dv01(£)
BEAR_FLATTENING IR_DOWN_100BP IR_UP_100BP STANDARD_RISK USD_UP_6P
Total P&L 4,249,929 2,442,269 7,240,733 -647,358 2,965,150
Percentage P&L 0.91% 0.52% 1.54% -0.14% 0.63%
EUR_STANDARD04_Russian_Crisis_L
TCM_31Aug98H_10SEP2001_21SEP2001
H_SUBPRIME_04MAR08_1
7MAR08H_LEHMAN_15SEP08_25SEP08
Total P&L 1,882,083 3,409,765 3,021,769 849,557 902,433
Percentage P&L 0.40% 0.73% 0.64% 0.18% 0.19%

Paul Abberley
Interim Chief Executive Officer
Patrick Neville
Chief Financial Officer
Ross
Maclean
Head of Compliance
Gabrielle Dixey
Global General Counsel
Richard Field
Global Chief Risk Officer
UK Director of Investment Risk
Aviva Investors Executive committee
level
Regional risk departments
John Lister
Aviva Group Chief Risk Officer
Other legal functions
Head of Investment Risk – Aviva Investors
London
Fixed Income Team
2 risk analysts
1 data analyst
Head of investment risk – GIS
Equities Team
1 risk analyst
2 data analysts
Alternatives Team
1 risk manager
1 risk analyst
RISK AND COMPLIANCE OVERSIGHT
Business risk department
Shahid Ikram
Chief Investment Officer & Head of Fixed Income
Investment team Head of Investment Risk – Strategy
31
Regulatory risk
department
Source: Aviva Investors as at March 2013
G7 Fixed Income Fund
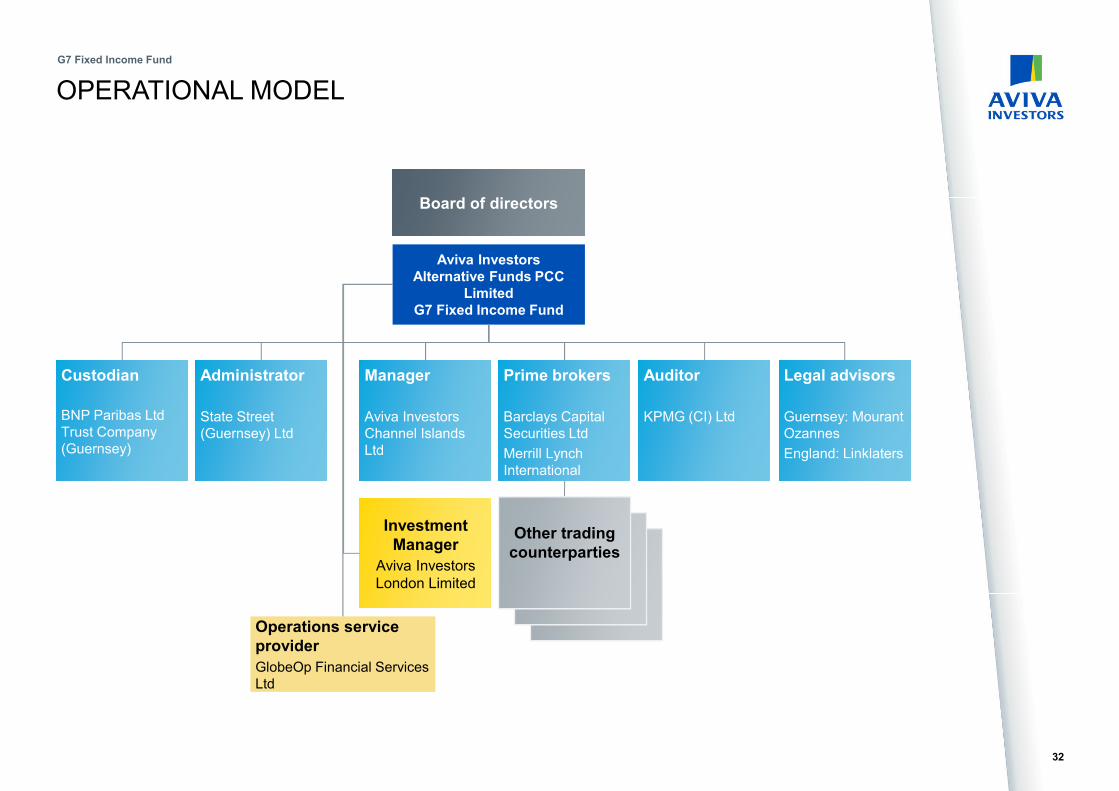
Board of directors
Aviva Investors Alternative Funds PCC
LimitedG7 Fixed Income Fund
Investment Manager
Aviva Investors
London Limited
Prime brokers
Barclays Capital
Securities Ltd
Merrill Lynch
International
Auditor
KPMG (CI) Ltd
Administrator
State Street
(Guernsey) Ltd
Custodian
BNP Paribas Ltd
Trust Company
(Guernsey)
Legal advisors
Guernsey: Mourant
Ozannes
England: Linklaters
Operations service provider
GlobeOp Financial Services
Ltd
Manager
Aviva Investors
Channel Islands
Ltd
OPERATIONAL MODEL
Other trading counterparties
32
G7 Fixed Income Fund

APPENDIX 1: THE CAPABILITY
33
G7 Fixed Income Fund

WHY THE G7 FIXED INCOME FUND?
* The correlation between G7 and the Merrill Lynch Global Corporate Index (excess returns above government bonds)
since inception of the fund is -0.26
** The correlation between G7 and the MSCI World Index (GBP) since inception is -0.19
*** The correlation between G7 and the DJCS Hedge Fund Index since inception of the fund is -0.20. The correlation
between G7 and the DJCS Fixed Income Arbitrage Index since inception of the fund is -0.16. The correlation between G7
and the DJCS Global Macro Index since inception of the fund is 0.08.
Source: Aviva Investors / Dow Jones Credit Suisse Hedge Index LLC, as at 28 February 2013.
G7 Fixed Income Fund inception date: 3 February 2003. All data sourced from Bloomberg/Aviva Investors as at 28 February 2013. Past performance is not a guide to future performance
Diversification from bond market and risky asset class exposures
– Low correlation with credit markets*
– Low correlation with equity markets**
– Low correlation with hedge fund indices***
– Search for pure alpha in sovereign markets throughout the economic cycle
Focus on capital preservation
– Managing downside risk prudently and targeting low volatility, stable returns are Aviva Investors top priorities
– Long, established track record of Aviva Investors using sophisticated techniques for asset liability management and
for alpha generation
– Strong credit ratings and insurance background of Aviva provide clients with financial reassurance
Compelling risk return proposition
– medium to low volatility: 2.7% (since inception to 28 February 2012)
– attractive Sharpe ratio: 2.5 (since inception to 28 February 2012)
34
G7 Fixed Income Fund

PRODUCT SUITE OVERVIEW
*Assets under management as at 28 February 2013** Target for internal fund management purposes only and is not a guarantee or indication of future returns*** Broad indication only
Sovereign relative value hedge fund
Fixed income macro hedge fund
Sovereign credit opportunities hedge fund
Description Relative value focused hedge fund Macro focused hedge fund Credit focused hedge fund
Legal structure Offshore Guernsey cell Offshore Guernsey cell Offshore Guernsey cell
Inception 31 January 2003 25 July 2008 23 September 2009
AuM* USD 715 million USD 352 million USD 34 million
Target return** 1 month £ Libor + 6% (net) 1 month £ Libor + 10% (net) 1 month £ Libor + 5-10% (net)
Liquidity Monthly Monthly Monthly
Relative value trades*** 70% 30% 50%
Directional trades*** 30% 70% 50%
More than USD 1.1 billion in sovereign absolute return strategies
35
G7 Fixed Income Fund

APPENDIX 2: INVESTOR BREAKDOWNS
36
G7 Fixed Income Fund

Aviva Affiliate, 43%
Non Affiliate, 57%
INVESTOR BREAKDOWNG7 FIXED INCOME FUND
G7 Fixed Income Fund
37Source: Aviva investors as at 19 February 2013
Institutional, 86%
HFoF Institutional, 9%
Wealth Management, 3%
Family Office, 1%
High Net Worth, 1%
By investor type
By investor type
UK, 83%
Europe, 9%
US, 2%
Asia, 6%
By geographic location
Investor concentration
0%
10%
20%
30%
40%
50%
60%
70%
80%
90%
100%
Top 2,
43%
Top 5,
71%
Other,
28%
APPENDIX 3: TRADE EXAMPLES
38
G7 Fixed Income Fund

RELATIVE VALUE TRADE EXAMPLELONG UK GILT 2042 VS. SHORT UK GILT 2046
Source: Aviva Investors Fixed Income Sovereign Absolute Return Team, Bloomberg.*Calculated as £3,751,799.34 - £3,657,339.36 = £94,459.98 / £444,294,974
• UK Gilt 4.5% 2042 was due to become the next 30 year benchmark bond
• We expected the bond price to increase as the market slowly switched from surrounding
bonds into the new benchmark bond
Net profit on the position* = 0.02%
39
G7 Fixed Income Fund
1.05
1.10
1.15
1.20
1.25
1.30
1.35
1.40
1.45
1.50
28-Feb-12 29-Feb-12 01-Mar-12 02-Mar-12 03-Mar-12 04-Mar-12 05-Mar-12 06-Mar-12
Yie
ld d
iffe
rence b
ps
Spread trade: long UK Gilt 4.5% 2042 & short UK Gilt 4.25% 2046
Opened the trade on 28/02/2012:
• Long: UK Gilt 2042
35m @ 125.60 = -£44,341,948.38
• Short: UK Gilt 2046
33m @ 122.23 = £40,684,609.02
• Net position= -£3,657,339.36
Closed the trade on 02/03/2012:
• Short: UK Gilt 2042
33m @ 124.02 = £43,797,198.36
• Long: UK Gilt 2046
35m @ 120.29 = -£40,045,399.02
• Net position = £3,751,799.34
Net profit on position = +£94,459.98

DIRECTIONAL TRADE EXAMPLEEUR 10 YR/10 YR RECEIVER SWAPTION BUTTERFLY
EUR 10 yr/10 yr Swap Rate
Source: Aviva Investors Fixed Income Sovereign Absolute Return Team. *net profit/fund assets under management = €447,534 / €612,043,007
• A “risk on” 2010 – central macro view: risk bullish. A
number of receiver swaptions were implemented to
tail hedge the downside risk to our view
• This position would make money in the situation
when yields fall - structured to give a high payout
ratio
• Long dated swaptions (rather than shorter dated)
were traded to minimise theta decay
• Out of the money (rather than at the money)
swaptions were struck to ensure a low cost hedge
• Our other themes were positioned for rising yields.
• Given the moves seen in July 2011 we decided it
was prudent to lock in profits at a 2:1 ratio approx
(33:18.5)
• The trade captured the large macro economic shift
while maintaining a long volatility bias
Net profit on position* = 0.07%
2.4
2.6
2.8
3.0
3.2
3.4
3.6
3.8
4.0
4.2
4.4
4.6
4.8
5.0
No
v-1
0
De
c-1
0
Ja
n-1
1
Fe
b-1
1
Ma
r-11
Ap
r-11
Ma
y-1
1
Ju
n-1
1
Ju
l-11
Au
g-1
1
Se
p-1
1
10
yr/
10
yr
Eu
ro S
wa
p R
ate
(%
)
6 December 2010 – we
implemented a receiver
swaption butterfly at a
reference 10 yr/10 yr swap
rate of 4.2%. How?
• Bought 3.0% strike swaption
• Sold 2.3% strike swaption
• Bought 1.5% strike swaption
• Net payment = 18.5 cents
11 August 2011 - took profits at
a swap rate of
3.9%. Closed
out at 33 cents.
Concerns
surrounding
the Euro
crisis
increased,
yields fell
and the delta
of the
swaptions
increased.
The
position
became
much
closer to
at the
money.
40
G7 Fixed Income Fund

APPENDIX 4: BIOGRAPHIES
41
G7 Fixed Income Fund

BIOGRAPHIES
James Kenney, MA, FIAPortfolio Derivatives Manager
Joined investment industry in 2001
Main Responsibilities Responsible for the development, approvaland execution of derivatives strategies ininvestment management.
Experience & qualificationsJames joined Aviva Investors originally as a
derivatives analyst. He then progressed to
portfolio derivatives manager for the sovereign
team in August 2006. Prior to joining Aviva
Investors, James worked as an investment
analyst at Mercer Investment Consulting whilst
studying for the Actuarial qualification.
James holds an MA in mathematics from
Trinity College, Cambridge University. He also
holds the investment management certificate,
the Institute of Actuaries’ certificate in
derivatives and advanced certificate in
derivatives. James is a fellow of the Institute of
Actuaries.
Shahid IkramChief Investment Officer, Head of Fixed Income, Aviva Investors London
Joined investment industry in 1990
Main Responsibilities Control of investment processes, managing engagementwith global capital markets and management of fixedincome investment staff. Shahid also oversees thedevelopment of sovereign products with a particular focuson hedge funds.
Experience & qualificationsShahid joined the firm in 1990 as a gilt fund manager,becoming head of global sovereign debt and absolutereturns. He has managed Aviva Investors’ first hedge fund,a sovereign relative value fund, since its launch in 2003.In 2009, Shahid became deputy CIO for Fixed Income andin 2012 he was appointed CIO in London, overseeing awide range of capabilities including hedge funds, emergingmarket debt, global bonds, UK sovereign, credit, liquidityand convertible bonds. He is also the chair of the AvivaInvestors London Desk Heads College, an internal group ofsenior investment professionals overseeing strategy andrisk across all active asset classes.
Shahid holds a BSc (Hons) in mathematics, statistics andcomputing from Greenwich University and is an associatemember of the Institute of Investment Management andResearch (IIMR).
Paul AbberleyInterim Chief Executive Officer, Aviva Investors Joined investment industry in 1981
Main Responsibilities Paul joined Aviva Investors as ChiefExecutive Aviva Investors London,adding Global Investment Solutions in2011. He was appointed interim CEOin May 2012 and is responsible for theleadership and governance of thecompany. As CEO he continues todeliver the business strategy whilemaintaining close relationships withGroup counterparties and clients.Growth of external sales is a toppriority.
Experience & qualificationsHe was previously at ABN Amro AssetManagement for eight years where heworked in a series of fixed income rolesand as CEO for London.
Paul has also worked as a global headof fixed income at Lombard Odier. Paulholds an MA in Philosophy, Politics andEconomics from Keble College, Oxford.
42
G7 Fixed Income Fund

BIOGRAPHIES
Trevor WelshSenior Fund Manager
Joined investment industry in 1984
Main Responsibilities Trevor has primary responsibility for multi assetliability managed portfolios, cash plus portfolios,and also specialises in the actively managedUK and global inflation funds.
Experience & qualificationsTrevor joined the firm in 1998. At AvivaInvestors he has progressed from portfoliomanagement strategist to Senior FundManager in the UK Sovereign team. InFebruary 2003 he was involved with the launchof our sovereign relative value hedge fundstrategy. Trevor previously worked for Philipsand Drew/UBS from 1984 – 1998 as executivedirector for European fixed income exchangetraded derivatives where he specialised in thefutures market.
Trevor holds a BA (Hons) in Economics,Financial Management and Accounting fromSheffield University.
Upkar Kambo, CFAHead of Quantitative Strategies
Joined investment industry in 1992
Main Responsibilities Co-ordination of range of internal and externalquantitative inputs. Maintaining, enhancing, anddeveloping new models for use in the fixed incomeprocess - e.g. forecasting (econometric andotherwise), valuation, technical. Liaise with risk teamto develop more comprehensive risk analytics forfixed income needs, and contribute to their integrationin the investment process.
Experience & qualificationsPrior to joining Aviva Investors, Upkar spent 11 yearsat UBS Asset Management as a quantitative analystand strategist, the last seven years of this role wasspent specialising in fixed income.
He holds a BEng (Hons) in engineering from ImperialCollege, London University, an MPhil in managementstudies (finance) from Queens’ College, CambridgeUniversity and an MBA from the London BusinessSchool. Upkar is a CFA charterholder and is amember of the Institution of Investment Managementand Research (IIMR).
Ben Maynard, CFADerivatives Analyst
Joined investment industry in 1996
Main Responsibilities Managing the derivative strategy andportfolio analytics team.
Experience & qualificationsBefore joining Aviva in 2008, Ben workedat Henderson Global Investors for fiveyears as a derivative specialist and headof the equity derivative trading desk. Priorto this he worked at AMP AssetManagement (NZ) as a client servicemanager and at NCL Investments as anequity trader.
Ben is a full CFA charter holder holds andalso holds an MA (Hons) in archaeologyfrom University of Edinburgh.
43
G7 Fixed Income Fund

BIOGRAPHIES
44
G7 Fixed Income Fund
Raphaelle Moysan, CFAClient Portfolio Manager – Fixed Income
Joined investment industry in 1998
Main ResponsibilitiesRaphaelle joined Aviva Investors as a clientportfolio manager to cover the sovereignabsolute return capability.
Experience & qualificationsRaphaelle joined Aviva Investors in 2010.She previously worked in fixed incomederivatives structuring and trading atGoldman Sachs, Merrill Lynch and JPMorgan and in single hedge funds.
Raphaelle holds a Bachelor’s degree inFinance from Ecole Supérieure de Commercede Paris. She is also a CFA charterholder.
Zahra SachakClient Portfolio Manager – Fixed Income, Absolute Returns
Joined investment industry in 2006
Main Responsibilities Interface between the investment team andgeneralist sales force focusing on thesovereign absolute return capability.
Experience & qualificationsZahra joined Aviva Investors in 2010. Prior tothis, Zahra joined Schroder InvestmentManagement as a graduate trainee working asa Product Specialist – Fixed Income focusingon UK & European Fixed Income.
Zahra holds a BSc (Hons) in Mathematics fromRoyal Holloway – University of London. Sheholds the IMC qualification and has recentlypassed CFA Level 2.

APPENDIX 5: INTRODUCTION TO AVIVA INVESTORS
45
G7 Fixed Income Fund

INTRODUCING AVIVA INVESTORS
Owned by Aviva plc, the UK’s largest insurer* and one of Europe’s leading providers of life and general insurance
• Listed on the London and New York stock exchanges
• Standard & Poor’s A+ rating (strong), with a stable outlook
• Aviva Investors operates around the world
• Local market insight, supported by full range of global services
• Over 1,200 employees in 15 countries and 20 locations
Financial stability and a wealth of experience and resources
*Based on aggregate FY10 UK life and pension sales (PVNBP) and general insurance gross written premiums.All data as at 31 December 2012. Source: Aviva Investors and Aviva plc
46
G7 Fixed Income Fund
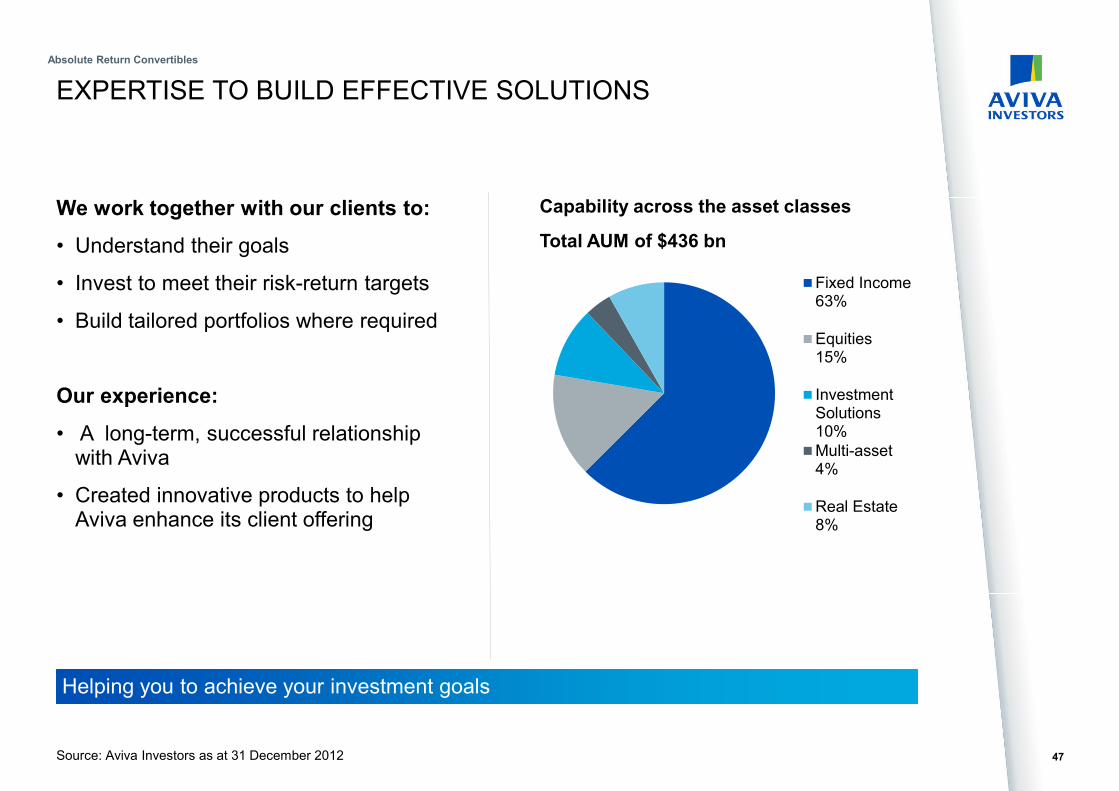
EXPERTISE TO BUILD EFFECTIVE SOLUTIONS
Source: Aviva Investors as at 31 December 2012
Fixed Income63%
Equities15%
InvestmentSolutions10%
Multi-asset4%
Real Estate8%
Capability across the asset classes
Total AUM of $436 bn
We work together with our clients to:
• Understand their goals
• Invest to meet their risk-return targets
• Build tailored portfolios where required
Our experience:
• A long-term, successful relationship with Aviva
• Created innovative products to help Aviva enhance its client offering
Helping you to achieve your investment goals
Absolute Return Convertibles
47

OUR STRATEGYA GLOBALLY INTEGRATED ASSET MANAGER
Source: Aviva Investors as at 31 December 2012.
NORTH AMERICA and CANADA
Boston Massachusetts
Chicago Illinois
Des Moines Iowa
Louisville Kentucky
New York New York
Toronto Canada
ASIA PACIFIC
Singapore
Melbourne, Sydney Australia
Taipei Taiwan
EUROPE
Dublin Ireland
Frankfurt Germany
London United Kingdom
Luxembourg
Paris France
Stockholm Sweden
Utrecht Netherlands
Warsaw Poland
Zurich Switzerland
MIDDLE EAST
Dubai (DIFC) UAE
Investment strategiesthat aim to balance risk
and reward, drawing from
expertise across global
markets
Broad rangeof clients including large
corporations, institutional
investors and wealth
managers
• More than 1,200employees
• Based in 20 locations
• Across 15 countries
Absolute Return Convertibles
48

PROVEN AND SUCCESSFUL INVESTMENT STRATEGIES
Specialist teams provide in-depth knowledge and expertise in local markets
Fixed income
• Liquidity
• Sovereign UK & Euro
• Global aggregate
• Credit
• High Yield
• Emerging market debt
• Convertible bonds
• Active LDI
• Global inflation
Real estate
• Global real estate
• Local real estate in UK,
Europe and Asia
• Multi-manager
• Real estate securities
• Specialist funds
Equities
• UK
• European
• Asia
• US
• Quantitative
49
G7 Fixed Income Fund
Absolute Returns
• Fixed income macro
& relative value
hedge funds
• Convertible arbitrage
hedge fund & absolute
return
• Credit absolute return
• Global markets alpha
Global business development –
sales, marketing, client servicing and product development
Global investment solutions –
managing assets that benefit from scale and consistency
Source: Aviva Investors as at 31 December 2012

APPENDIX 6: GIPS PERFORMANCE AND DISCLOSURES
50
G7 Fixed Income Fund

G7 FIXED INTEREST ABSOLUTE RETURN COMPOSITE & DISCLOSURES
YearComposite Return
Benchmark Return
Number of Portfolios (*throughout period)
DispersionMarket Value at end of Period
Percentage of Firm Assets
Total Firm Assets
Quarter To Date 0.09% 0.08% 1 (1) N/A 471,793,106 - -
Year To Date 0.09% 0.08% 1 (1) N/A 471,793,106 - -
Month To Date 0.65% 0.04% 1 (1) N/A 471,793,106 - -
2012 1.52% 0.64% 1 (1) N/A 470,088,917 - -
2011 4.26% 0.64% 1 (1) N/A 456,099,205 0.32% 143,217,403,309
2010 6.21% 0.55% 1 (1) N/A 514,584,281 0.36% 142,387,532,805
2009 7.82% 0.89% 1 (1) N/A 530,462,435 0.37% 141,904,207,047
2008 16.29% 5.57% 2 (2) N/A 489,853,134 0.36% 135,300,370,333
2007 12.09% 5.96% 2 (2) N/A 383,163,218 0.22% 174,529,956,735
2006 13.54% 4.82% 2 (1) N/A 294,630,570 0.18% 160,574,480,692
2005 6.12% 4.80% 1 (1) N/A 126,198,632 0.08% 155,130,806,273
2004 10.79% 4.67% 1 (1) N/A 252,787,597 0.18% 141,067,787,874
2003 (Mar) 12.91% 3.14% 1 (1) N/A 48,623,777 0.04% 116,525,244,219
Aviva Investors Global Services claims compliance with the Global Investment Performance Standards (GIPS®) and has prepared and presented this report incompliance with the GIPS Standards. Aviva Investors Global Services has been independently verified for the periods 1st January 1998 to 31st December 2010.The verification reports are available upon request. Verification assesses whether (1) the firm has complied with all the composite construction requirements of theGIPS standards on a firm-wide basis and (2) the firm's policies and procedures are designed to calculate and present performance in compliance with the GIPSstandards. Verification does not ensure the accuracy of any specific composite presentation. The firm is defined as Aviva Investors Global Services, whichincludes all managed assets, excluding closed ended direct real estate investments. The firm was redefined as of 31 December 2010, when the direct closed endassets were removed from the firm. Following a restructure within the Aviva Group, the assets managed by Aviva Investors Ireland Limited were transferred toAviva Investors Global Services in May 2010. The requirements and provisions for Performance Record Portability have been met and these assets continue to beincluded in their original composites. Further details are available upon request. This composite includes funds investing in global fixed income assets withabsolute return target. Leverage and short positions are an integral part of the composite strategy and may magnify losses and gains to the extent that leverage isdeployed. The portfolios within this composite may leverage up to 210% of the Net Asset Value of the fund. This composite was created on 31/12/2004. With astart date of 28/02/2003. Returns are presented net of management fees and other expenses. For unitised funds, gross returns are calculated by adding back theAnnual Management Charge (AMC), or part thereof, to the net return. Actual fees charged are dependent on the mandate and value of client assets. The fee scalefor pooled clients ranges from 0.2% p.a. to 1.8% p.a. and for segregated mandates the fee scale starts at 0.5% p.a. All income is taken gross of tax, but net ofirrecoverable taxes. Further information is available upon request. Aviva Investors Global Services has the ability to use leverage as part of its investmentmanagement process depending on the investment management agreement. If the client management agreement permits the discretionary use of options and orfutures, AIGSL will employ these strategies if the manager believes an opportunity exists to add value to the portfolio or minimise risk. AIGSL is permitted to useEfficient Portfolio Management (EPM) techniques as defined in the FSA Handbook. For Unit Linked Life funds a capital gains tax accrual is embedded in the unitprice. Composite dispersion is calculated using the asset-weighted standard deviation of all portfolios that were included in the composite for the entire year. If thecomposite includes less than 5 portfolios for the full year no measure of dispersion is shown. Additional information regarding policies for valuing portfolios/funds,and calculating and reporting returns is available upon request. A list and description of all composites is available upon request. This composite is benchmarkedagainst the 1mth LIBOR which is based on rates that contributor banks in London offer each other for inter-bank deposits. Past performance is not a guide tofuture performance. All figures are in GBP, gross of fees.
As at 28 February 2013 (Code on StatPro: GBLHdgeFi+NUIM) 51
G7 Fixed Income Fund

IMPORTANT INFORMATION
Except where stated as otherwise, the source of all information is Aviva Investors Global Services Limited (Aviva Investors) as at 31 March 2013.
The content of this document does not purport to be representational or provide warranties above and beyond those contained in the Prospectus and subscription documentation of the Fund. The Prospectus and the subscription document contain the full terms, conditions, representations and warranties in respect of the Fund. Nothing in this document shall be construed as forming any part of those terms, conditions, representations or warranties.
Any opinions expressed are based on the internal forecasts of Aviva Investors and they should not be relied upon as indicating any guarantee of return from an investment managed by Aviva Investors. No part of this document is intended to constitute advice orrecommendations of any nature.
The value of an investment in the fund can go down as well as up and investors may not get back the original amount invested. Past performance is not a guide to the future.
The distribution and offering of shares may be restricted by law in certain jurisdictions. This document should not be taken as a recommendation or offer by anyone in any jurisdiction in which such an offer is not authorised or to any person to whom it is unlawful to make such an offer or solicitation.
Aviva Investors Global Services Limited, registered in England No. 1151805. Registered Office: No. 1 Poultry, London EC2R 8EJ. Authorised and regulated in the UK by the Financial Services Authority and a member of the Investment Management Association.
Contact us at Aviva Investors Global Services Limited, No. 1 Poultry, London EC2R 8EJ.
Compliance ref: 13/0334/30062013
52
G7 Fixed Income Fund