Aviation Strategy · fuelled by a huge increase in the Air Berlin fleet - it currently comprises 58...
24
Aviation Economics James House, 1st Floor 22/24 Corsham Street London N1 6DR Tel: +44 (0) 20 7490 5215 Fax: +44 (0) 20 7490 5218 e-mail: [email protected] Issue No: 111 Jan/Feb 2007 Aviation Strategy Analysis Alitalia: Expressions of interest 1 German restructuring: • Air Berlin and dba • HLX and Hapagfly • LTU International • germanwings • Condor 2-9 Boeing vs. Airbus 2006 10-11 S&P on airline credit ratings 12-13 Briefing Allegiant Air: Las Vegas-based niche carrier 14-19 Databases 20-23 Airline traffic and financials Aircraft available Regional trends Orders CONTENTS PUBLISHER www.aviationeconomics.com Amazing AZ T he Italian government probably feels more than a little relieved that it received 11 expressions of interest in buying at least 30% of Alitalia, including such illustrious private equity names as Texas Pacific Group and Cerberus Capital Management. There were also interesting bids among the 11 - from Porcellano Castello, a consortium of 70 families from the Bologna region whose idea is to turn Alitalia into a 5-star luxury airline, and from a Roman schoolteacher who is apparently a dis- gruntled Alitalia customer. There was, as expected, no bid from SkyTeam partner Air France/KLM. The resignation of Jean-Cyril Spinetta, the Air France CEO, from the Alitalia Board has left it inquorate, and the Alitalia CEO Giancarlo Cimoli is reported to be leaving as well. The second Italian carrier, Air One, did however put in a bid, through a vehicle called AP Holding. The valuation of Alitalia has been widely reported as being around the €2bn mark. But could the airline possibly be worth almost as much as, say, 25% of Ryanair? Its stockmarket share price, buoyed by bid speculation, indicates a value of €1.2bn. Moreover, the airline's recent financial performance has deterio- rated again - losses for 2006 are likely to be around €400m, dou- ble those of 2005. This brings Alitalia's accumulated losses since 2000 to €3bn, about 9% of turnover. The airline's net debt is about €1.2bn, plus another €1.2bn in capitalised lease commitments. The situation poses some tricky questions for private equity investors: • Banks considering leveraging a deal will have to take into account the existing level of debt as well as the capex that will be required to replace the ageing MD80 fleet, some €3bn; presum- ably state guarantees for loans are out of the question • Selling off assets or downsizing will likely be fiercely resisted by the unions, management and politicians; adding to Alitalia's regu- lar strike-days will allow competitors, especially the LCCs, to fur- ther increase their growing share of the Italian market • Designing a new turn-around strategy is perfectly feasible but implementing it is another matter; it appears that there are too many vested interests determined to preserve the status quo at the flag-carrier and procrastinate until the government or the relevant government minister changes • Bringing in an airline partner would be the most politically accept- able way to provide a catalyst for turn-around; this idea dates back to Alitalia's wooing of SAS in the late 80s, was almost consummat- ed with KLM in the late 90s but ended acrimoniously, and has now been rejected by Air France Perhaps we are being too cynical and there actually is an effec- tive refinancing and restructuring strategy for Alitalia - the binding bid stage of the process may unveil an unexpected solution.
Transcript of Aviation Strategy · fuelled by a huge increase in the Air Berlin fleet - it currently comprises 58...

Aviation EconomicsJames House, 1st Floor 22/24 Corsham Street
London N1 6DRTel: +44 (0) 20 7490 5215Fax: +44 (0) 20 7490 5218e-mail: [email protected]
Issue No: 111 Jan/Feb 2007
Aviation Strategy
Analysis
Alitalia: Expressionsof interest 1
German restructuring:
• Air Berlin and dba• HLX and Hapagfly• LTU International• germanwings• Condor 2-9
Boeing vs. Airbus 2006 10-11
S&P on airline credit ratings12-13
Briefing
Allegiant Air: Las Vegas-basedniche carrier
14-19
Databases 20-23
Airline traffic and financials
Aircraft available
Regional trends
Orders
CONTENTS
PUBLISHER
www.aviationeconomics.com
Amazing AZThe Italian government probably feels more than a little
relieved that it received 11 expressions of interest in buying atleast 30% of Alitalia, including such illustrious private equitynames as Texas Pacific Group and Cerberus CapitalManagement. There were also interesting bids among the 11 -from Porcellano Castello, a consortium of 70 families from theBologna region whose idea is to turn Alitalia into a 5-star luxuryairline, and from a Roman schoolteacher who is apparently a dis-gruntled Alitalia customer.
There was, as expected, no bid from SkyTeam partner AirFrance/KLM. The resignation of Jean-Cyril Spinetta, the AirFrance CEO, from the Alitalia Board has left it inquorate, and theAlitalia CEO Giancarlo Cimoli is reported to be leaving as well.The second Italian carrier, Air One, did however put in a bid,through a vehicle called AP Holding.
The valuation of Alitalia has been widely reported as beingaround the €2bn mark. But could the airline possibly be worthalmost as much as, say, 25% of Ryanair? Its stockmarket shareprice, buoyed by bid speculation, indicates a value of €1.2bn.Moreover, the airline's recent financial performance has deterio-rated again - losses for 2006 are likely to be around €400m, dou-ble those of 2005. This brings Alitalia's accumulated losses since2000 to €3bn, about 9% of turnover. The airline's net debt is about€1.2bn, plus another €1.2bn in capitalised lease commitments.
The situation poses some tricky questions for private equityinvestors:• Banks considering leveraging a deal will have to take intoaccount the existing level of debt as well as the capex that will berequired to replace the ageing MD80 fleet, some €3bn; presum-ably state guarantees for loans are out of the question• Selling off assets or downsizing will likely be fiercely resisted bythe unions, management and politicians; adding to Alitalia's regu-lar strike-days will allow competitors, especially the LCCs, to fur-ther increase their growing share of the Italian market• Designing a new turn-around strategy is perfectly feasible butimplementing it is another matter; it appears that there are toomany vested interests determined to preserve the status quo at theflag-carrier and procrastinate until the government or the relevantgovernment minister changes• Bringing in an airline partner would be the most politically accept-able way to provide a catalyst for turn-around; this idea dates backto Alitalia's wooing of SAS in the late 80s, was almost consummat-ed with KLM in the late 90s but ended acrimoniously, and has nowbeen rejected by Air France
Perhaps we are being too cynical and there actually is an effec-tive refinancing and restructuring strategy for Alitalia - the bindingbid stage of the process may unveil an unexpected solution.

Aviation StrategyAnalysis
2
Aviation Strategyis published 10 times a yearby Aviation Economics
Editor:Keith McMullan
Contributing Editor:Heini Nuutinen
Sub-editor: Julian Longin
Subscriptions:[email protected]
Tel: +44 (0)20 7490 5215
Copyright:Aviation Economics
All rights reserved
Aviation EconomicsRegistered No: 2967706
(England)
Registered Office:James House, 1st Floor
22/24 Corsham St London N1 6DR
VAT No: 701780947
ISSN 1463-9254
The opinions expressed in this publica-tion do not necessarily reflect the opin-
ions of the editors, publisher or contribu-tors. Every effort is made to ensure thatthe information contained in this publica-tion is accurate, but no legal reponsibilityis accepted for any errors or omissions.
The contents of this publication, either inwhole or in part, may not be copied,
stored or reproduced in any format, print-ed or electronic, without the written con-
sent of the publisher.
Jan/Feb 2007
With demand for traditional package toursfalling fast, German airlines that still
have large amounts of charter business arefrantically trying to convert themselves intofully-fledged scheduled operators, usuallywith a city-to-city LCC business model. Buteven this may not be sustainable, as AirBerlin's acquisition of dba in 2006 has put fur-ther pressure on the other players inGermany to either merge or to find a secureparent with very deep pockets. Talks - formaland informal - have been and are being heldbetween virtually everyone in the Germanaviation industry.
Air Berlin and dba
Air Berlin is the third-largest LCC aftereasyJet and Ryanair, and the second largestairline in Germany, but after a troubled IPO inMay 2006 (see Aviation Strategy, May 2006)the carrier cemented its position through buy-ing rival dba in August for a price that was inthe "mid-two figure millions" [€250m], accord-ing to Joachim Hunold, CEO of Air Berlin. dbawas acquired from various shareholdersincluding Intro Verwaltungsgesellschaft(59.9%) - a holding company for business-man Hans Rudolf Wohrl that boughtDeutsche BA from British Airways back in2003 - and from Aton (25.1%), a companycontrolled by businessman Lutz Helmig.
The acquisition was approved byBundeskartellamt - the German competitionregular - in September last year on thegrounds that there was little overlap betweenthe domestic network of dba (although it alsooperates some international routes and char-ter flights) and the scheduled European net-work of Air Berlin (it started low-fare city ser-vices back in 2002), and that the deal wouldprovide better competition to the dominationof Lufthansa
From Air Berlin's point of view, the deal isa good match, giving Air Berlin access to
valuable dba slots at Dusseldorf and Munich.The first joint schedule will operate from thissummer's timetable (starting in April), withdba aircraft being used on Air Berlin routes toleisure destinations during the summer dip indomestic business travel, with larger AirBerlin aircraft already being used on thebusier domestic dba routes over the winterseason.
Following the acquisition, Munich-baseddba is continuing to operate as an indepen-dent company according to Air Berlin,although it is now being marketed as AirBerlin "powered by dba". dba has a fleet of 30737 and F100 aircraft, the latter arriving afterdba bought and incorporated LCC GermaniaExpress into its operations in early 2005(although the Germania Express brand stillexists).
The deal also gives Air Berlin access tomore than 70 corporate clients of dba, whomare valuable given Air Berlin's focus on thebusiness travel market and its desire for pas-senger growth of 10%-15% per annum for thenext few years. That planned growth will befuelled by a huge increase in the Air Berlinfleet - it currently comprises 58 A320 family,737 and F100 aircraft, but there are 50 aircrafton firm order and another 42 on option, whilean order for another 60 aircraft is imminent.
After previously being a loyal Boeing cus-tomer, in 2004 Air Berlin decided to lessen itsdependence on one manufacturer by placingan order for 70 aircraft in partnership with Niki(in which it owns 24%), of which 15 A319sand 35 A320s are outstanding. Air Berlin alsohas options for another 40 A320s, and a deci-sion is expected to be made on these some-time this year. This order came about partlybecause Airbus was very aggressive with itspricing, but in late November 2006 Boeingappears to have struck back after Air Berlinannounced an intended order for 60 737-800s for delivery over 2007-2014, which at listprices are worth $5.7bn - although, inevitably,the German LCC will receive a substantial
Germany: Restructuringor just juggling?

discount (40-50%?) on that when the firmorder is agreed.
Although the Boeing aircraft will partlyreplace the current 42-strong 737 fleet (manyof which are leased), some will be used forgrowth - yet the news of the impending orderwas received poorly by the German stockmarket, with the airline's shares dropping by13% on the day the news was announced(from €16.24 to just above €14.00; the shareprice as at the end of January was around the€16.00 level), even though at the same timethe airline released encouraging third quarter2006 results. In the July-September 2006period (in which dba results were included forSeptember only) Air Berlin reported a 26.5%rise in net profit to €38.7m, based on a 28%rise in turnover, to €510m, with a 1Q-3Q netprofit of €37.7m, compared with a €12.5m netloss in January-September 2005.
However, at the same time as theseresults were issued Air Berlin's earnings fore-cast for the full year was reduced slightly (to€40m), due to higher than expected costs forthe IPO and to the effect of the terroristattacks in London and Turkey during the year.As Air Berlin only turned ongoing operatinglosses into profits through the second andthird quarters of 2006 (after the introduction ofa series of efficiency measures in 2005 and2006), analysts remain cautious about thefuture, particularly given the substantialplanned increase in capacity. In addition, AirBerlin will also have the use of 25 737-700sthat are on firm order for dba, which brings to85 the total of 737s that Air Berlin will receiveover the period to 2014, once the November2006 "order" is formally placed.
Part of the reason for Air Berlin's aggres-
sive ordering is the difficulty it has had in leas-ing aircraft at anything other than very highrates, and so it has made a strategic decisionto own its fleet going forward, rather thanbeing at the mercy of market lease rates. Butthough this may be logical, the size of theorders also means that Air Berlin will be plac-ing a large amount of new capacity (aroundan extra 10% a year over the next eightyears) into a market where competition isfierce.
The combined Air Berlin/dba already car-ried 19.7m passengers in 2006, 12.6% up on2005, with Air Berlin carrying 15.2m and dba4.5m (compared with Air Berlin's 13.5m anddba's 4.0m in 2005). Load factor for the yearwas 75.3%, up slightly on the 75.2% of thecombined airlines' totals for 2005.
The acceleration in Air Berlin capacityincreases is already starting to appear, andthis summer there will be a rise in capacity toMajorca of around 20%. Flights to Palmaalready account for 5m passengers - almostone-third of the total passengers that AirBerlin carried in 2006 - with a hub in Palmaconnecting flights from Germany through todestinations in the rest of Spain and Portugal.In November Air Berlin also launched a huboperation at Zurich, with feeder flights fromGermany and Austria connecting onto routesto leisure destinations in the Canary Islands.
Eastern Europe is another target for AirBerlin. The airline entered the Russian marketfor the first time in December last year withroutes from Nuremberg to Moscow and St.Petersburg, both of which are up againstcompetition out of Germany from german-wings. Yet the biggest challenge to Air Berlincontinues to come from Ryanair and easyJet.
Aviation StrategyAnalysis
Jan/Feb 20073
Lufthansa
TUI (Tour operator)
AirBerlin
49%effective
ownership ofGermanwings
TUIFly
WHAT’S HAPPENING IN GERMANY
has bought dbafrom Intro
Intro has bought 60%of LTU from VBE(ex Swissair fund)
merging HLX and Hapagfly plusThomsonfly, Corsair,
Arkefly, Jetairfly and TUIfly Nordic
Selling its 50% Thomas Cookstake to former partner
KarstadtQuelle, planningmerger with MyTravel (UK)
In effect reducing ownership ofCondor from 50% to 25% but retains
purchase option on other 75%

Last year Air Berlin and theFederation of German Airlines(BDF) took Ryanair to courtover subsidies paid by Lubeckairport to Ryanair, which AirBerlin claimed allowedRyanair to offer passengers"dumping fares", thereby forc-ing it to close a route toLondon out of nearbyHamburg airport. As a result, acourt in Kiel ruled that the sub-sidies were "unreasonable",and that the airport had to dis-close the terms of its deal withRyanair. But this is more of amoral victory than anythingelse since Lubeck is now in
private hands, and Air Berlin's real defenceagainst the bigger LCCs is to develop scale inits own markets and routes.
As expansion continues Air Berlin maystart running into union troubles. Air Berlin isincreasing salaries by just 3% this year,although it expects operating profit toincrease by at least 30% in 2007, ahead of a15% forecast rise in turnover. That is believedto be causing unease among some of its staff,particularly as the carrier does not recogniseunions - although Vereinigung Cockpit andothers are attempting to change the situation.
These worries aside, Air Berlin is undoubt-edly the strongest of any German airline afterLufthansa, and it looks certain to play anacquisitive role in the German aviation indus-try over the next few years - as long as theGerman regulator will allow it.
Following the co-ordination of flight sched-ules between Air Berlin and Hapagfly for thelast two years, speculation persists about apossible Air Berlin/TUI alliance - although thishas been denied by Hunold, who insists thatno merger talks have been held recently. Thatmay be so, but informal negotiations wereheld in late 2006 between Air Berlin and theTUI group about potential co-operationbetween dba and Hapag-Lloyd Express(TUI's budget airline, which is now being inte-grated into TUIfly - see below). While AirBerlin and Hapagfly already codeshare onselected holiday routes, an extension intopartnering on low-fare city routes operated by
dba and Hapag-Lloyd Express may makestrategic sense, although it's unlikely toevolve into anything more permanent in theshort- and medium-term.
With 61.5% of Air Berlin now on free float- with the remainder being held by individualinvestors including Hans Joachim Knieps(9.1%), Joachim Hunold (3.5%), JohannesZurnieden (1.7%), Rudolf Schulte (4.5%),Severin Schulte (4.6%) and Werner Huehn(5.5%) - pressure from shareholders for AirBerlin to be constantly dynamic may encour-age the airline to be aggressive in terms ofacquisitions over the next few years. If that'sthe case, Air Berlin will have plenty of targetsto choose from if it wants to buy German.
HLX and Hapagfly
Hapag-Lloyd Express (HLX) is based atHannover-Langenhagen airport and operates16 737s aircraft on scheduled routes to 30European destinations, while Hapagfly, alsobased in Hannover, uses 34 (mostly Boeing)aircraft for primarily charter flights on a net-work of around 40 leisure destinations (withsome scheduled routes).
Both airlines are subsidiaries of giantGerman tour operator TUI, but although HLXwas launched in 2002 as a standalone lowfare, low cost carrier that would help compen-sate for the trend away from package holi-days, the airline has proved to be insufficientin stemming the continuing troubles at TUI'stourism operations.
Over the past decade TUI has refocusedfrom being an industrial conglomerate intobecoming a specialist tourism and air trans-port company, but in 2005 the group expand-ed its small shipping business into a secondbusiness division. However, TUI's core is stillwhat it calls its tourism business (whichincludes everything from its multitude of touroperators to no less than seven airline opera-tions), and it's this business that has facedincreasing problems. The tourism division hasundergone deep cost-cutting and more than6,000 job losses in the last few years, with thegroup trying to reduce volumes and increasemargins - a policy that most major tour oper-ators are already following across Europe
Aviation StrategyAnalysis
Jan/Feb 20074
FleetOrders
(options) Air Berlin
A319 4 15 A320 10 35 (40)
737-400 1 737-700 5 737-800 35 (2)
F100 3 Total 58 50 (42)
dba 737-300 14 737-500 1 737-700 25
F100 15 Total 30 25
Air Berlin/dba total 88 75 (42)
AIR BERLIN/DBA FLEETS

However, it wasn't until after a strategicreview carried in early 2006 that TUI groupcame to the conclusion that the traditionalcharter market is falling away in favour of self-assembled holidays, with LCCs picking up anever increasing share of the flight part ofthese self-assembled trips.
In August last year, alongside severalchanges in senior management, TUI took thedecision to dispense with its confusing portfo-lio of airlines and brands, merging them allinto one airline that would gain most of its rev-enue from seat-only, scheduled flights. Thefirst stage of this process is the merger ofHapagfly and Hapag-Lloyd Express this yearinto a new airline, to be called TUIfly, and tobe run as a low cost operation with an empha-sis on low fares in its marketing.
In 2008 the five other airlines that TUIowns - Thomsonfly in the UK (with a fleet of47 737s, 757s and 767), Corsair in France(10 A330s and 747s), ArkeFly in theNetherlands (five 737s and 767s), Jetairfly inBelgium (eight 737s, 767s and F100s) andTUIfly Nordic (five 737s and 757s) - will berolled into TUIfly, with the cost standardsadopted at HLX being the model for all airlineoperations in the new TUIfly. In the summer of2006 pilot union Vereinigung Cockpit agreeda unified pay scale for its members atHapagfly and HLX, under a deal that lastsuntil 2008, and this agreement is to bepushed by management as the basis for allfuture TUIfly pilot contracts.
Once the seven airlines are merged andre-branded, TUI expects the move to boostnet profits by at least €60m in 2008, with thecombined fleet operating at least 120 aircraftand carrying around 25m passengers a year.But as the combined totals of the seven air-lines that will make up TUIfly now amounts to159 aircraft, this means that up to 39 aircraftwill be disposed off, and these are most likelyto be the larger aircraft currently used forshort- and long-haul tour operator flights,which are not seen as being appropriate forthe refocus on a city-to-city network. Betweenthem, the seven constituent airlines of TUIflyown or lease 75 737s (of which 53 are -700and -800 models), and these will be the coreof the fleet going forwards.
In addition, in December 2006 the TUI
group ordered 41 Boeing air-craft for delivery over 2010-2013 (with models yet to bespecified, but likely to be737s, with potentially a hand-ful of 787s), which with 24 air-craft already on order bringtotal outstanding orders to 65.All of these aircraft willreplace aircraft currently onleases, although TUI is con-sidering establishing a jointventure with an establishedleasing company in order tomanage and finance the aircraft.
While a TUIfly.com internet site waslaunched this January, the first part of theprocess, the merger of charter carrierHapagfly and low fare airline Hapag-LloydExpress, will occur with the summer 2007schedule, and this will create an airline with afleet of 56 aircraft that will carry an estimated13.5m passengers in 2007 (up from 11.5m in2006). This summer TUIfly - which will bebased at Hannover airport - will operate to 75destinations in 17 countries, and TUI groupsays that the "marketing strength" of HLX willbe the key to its success.
However, this initial merger will alsoinclude the cutting of 200 jobs (that will all be"administrative", according to TUI), which withother savings will reduce costs by €40m ayear. The staff reduction will be part of anoverall cut of another 3,500 to 4,000 positionsat the tourism division of TUI, most of whichare coming from TUI's tourism concerns out-side of Germany.
The reaction to the airline merger fromanalysts is mixed - many welcome the movebut some are critical, with Merrill Lynch tellingclients that although the merger may bringsome reduction in costs, there was no signthat the airlines were going to undertake "sig-nificant capacity cuts", which the bank saidwas necessary for improvement at TUI's air-lines.
Indeed it's difficult to see how the newTUIfly will seriously affect the troubles at thetourism division as a whole, given the trendaway from the traditional package holiday notjust in Germany but in the whole of westernEurope. While HLX is believed to have made
Aviation StrategyAnalysis
Jan/Feb 20075
FleetOrders
(options) Hapagfly
A300 1 A310 1
737-700 1 737-800 32 3 (2)
Total 34 4 (2) Hapag-Lloyd Express
737-500 5 737-700 8 737-800 3
Total 16TUIfly total 50 4 (2)
TUIFLY’S FLEET

a profit in 2005 and 2006, TUI's tourism divi-sion saw operating losses increase throughthe first half of 2006, which led to a profitwarning being issued by the group in August2006. (TUI's 2006 results will not be availableuntil the end of March).
And while the new TUIfly will be run on a"low cost" business model, it will still have toserve both the leisure and scheduled mar-kets, as most of Hapagfly's charter seats aresold to TUI's various tour operator brands andthat need for charter capacity at TUI will stillexist for some considerable time, even if themarket is declining.
TUI Group says that the mergedHapagfly/Hapag-Lloyd Express operationexpects to get 60% of its revenue from lowfare, point-to-point traffic and 40% from thetour operator business, and to achieve thisthere will be a substantial rise in the amountof scheduled business; the summer 2007schedule, for example, is 25% up on the com-bined capacity of the two airlines as of lastsummer.
But while the merged operation will allowaircraft to increased daily utilisation rates toabove 12 hours per day, many aircraft willoperate both city-pair flights and charterflights on the same day, and this may presentproblems in terms of continual changes to theproduct needed for different flights. TUIadmits that its charter passengers will notaccept a "no-frills" onboard service, andhence the onboard product will have tochange flight by flight.
This mixed functionality makes the futurefor the TUIfly even more uncertain. At thesame time as the merger announcement, TUIgroup appointed board member PeterRothwell to head up all tourism operations,including the aviation units that are beingmerged into TUIfly, and TUI group now saysthat it is examining "strategic options" for itsairlines.
Once TUI's airlines are merged, manyanalysts believe a sale of TUIfly is inevitable,and some believe it will come sooner ratherthan later in order to get rid of fixed costs thatthe group would rather not have (particularlygiven that the TUI group is keen to reduce itsdebts of around €3bn). And while the tourismdivision will still need access to cheap seats
for its package holiday products, this couldeasily be achieved via a long-term contractwith whomever TUIfly is sold to. Of coursethis would not be a problem if TUI everdecides that the pressure on the tour operat-ing market will just get worse, and that"tourism" is a business it no longer wants tobe part of. Although there is no firm evidencethat TUI may go down this path at themoment, at the same time as TUI consideredextending its existing codesharing with AirBerlin from charters to city-to-city flights latelast year, unconfirmed reports suggestedinformal "side talks" held at the time alsoexplored the possibility of TUI withdrawingfrom air transport altogether (reports that TUIfirmly denies).
So if - or when - TUIfly is sold, who are itspotential acquirer/partners? A TUI/Condoralliance is often talked about in the Germanpress, and indeed a merger with Condor wasone of the options recommended to TUI byRoland Berger, the consulting firm the grouphired in 2006 to explore its options, accordingto reports in the German press. But there mayalso be potential buyers outside of Germany,although until TUIfly completes the integrationof seven diverse airline operations and clearsaway the mish-mash of aircraft models, itsunlikely that any serious moves will be madeto sell TUIfly until 2008 at the earliest.
LTU International Airways
LTU International Airways is based atDusseldorf airport and operates to more than80 destinations around the world, both onshort- and long-haul. Previously a charterspecialist, LTU became part of the Swissairempire when a 49% stake was bought. It ineffect went bankrupt when Swissair collapsedand was rescued through a ‘state aid’ loanprovided by the state of NordRein-Westphalia. After a restructuring programme,in 2005 LTU began low fare services onselected city routes after its short-haul charterroutes came under intense pressure fromLCCs. LTU also began to build up long-haulroutes, and in several markets (e.g. toThailand) it started flying all year-round,rather than in just the peak holiday season.
Aviation StrategyAnalysis
Jan/Feb 20076

Today the airline considers itself to be alow fare (but not low-frills) airline, with all buta handful of LTU's flights being operated asscheduled services - although much of itscapacity is still sold to German tour operatorsthat include TUI, ITS, Tjaereborg and JahnReisen.
Following a €200m recapitalisation struc-tured by Deutsche Bank (which cleared thestate aid loan), Intro Verwaltungsgesellschaftbought a 60% stake in LTU in early 2006(buying the 49.9% stake previously held bySwissair (and since 2001 held in a specialfund) and 10.1% owned by CKA, a Germanfinance company that is owned by bankinggroup Sal. Oppenheim). Later that year, Introsold 24% of its shares to Marbach Beteiligungund Consulting, a holding company forJurgen Marbach, the LTU CEO, and thenbought the 40% stake held by Rewe. Thisincreased Intro's share to 76%, before it soldanother 21% to Marbach, thus bringing theshareholding as it currently stands to 55% forIntro and 45% to Marbach.
Intro's intention for LTU is to repeat thesuccess it had with its investment in dba,which after a restructuring was subsequentlysold. LTU therefore began a year-longrestructuring programme in August 2006aimed at returning the airline to profitability in2007. Key to the restructuring is the belief ofHans Rudolf Wohrl, the owner of Intro (andchairman of LTU), that LTU was slow in spot-ting the trend to seat-only sales booked viathe internet, and that the focus has to switchmore quickly from tour operators to seat-onlydirect bookings (as practised by Air Berlin andCondor). Last summer LTU revamped itsinternet site in order to allow more flexibility inbooking flights, and this May the airline islaunching routes from Dusseldorf to LosAngeles and Las Vegas, to add to existingroutes to New York, Miami and Fort Myers.
After losses in both 2004 and 2005, LTU isbelieved to have made a loss in the region of€15m-€20m in 2006, but following restructur-ing Wohrl expects the airline to get back intoprofitability during 2007, with LTU fully reposi-tioning itself as a scheduled airline.
After that, the future of LTU will depend onwho is interested in acquiring it. Formerowner Rewe had been looking to offload its
stake for some time, but found fewinterested buyers at the time - thoughpost-restructuring, LTU should bemore attractive. Prior to Air Berlin'sacquisition of dba, LTU had particular-ly close links with dba, but Marbachhas stated that Condor would be thebest merger partner for LTU, as "ourbusiness model is almost identical",with many potential synergies. Introtoo is thought to consider Condor as the bestbet for LTU in the long-term, but anLTU/Condor merger would be problematicalfor the German regulatory authorities as thiswould mean there would be just one airlineleft that catered for the inclusive tour market.
Intriguingly, LTU briefly contemplated buy-ing collapsed Spanish airline Air Madrid inJanuary, although it quickly because apparentthat this was not a viable option. However,LTU's interest attracted approaches form sev-eral parties (including San Jose, a Spanishconstruction group) over the possibility oflaunching a new long-haul airline out ofMadrid that would operate of some of theroutes that Air Madrid did. Potentially thiscould have reemployed up to half of the for-mer Air Madrid' staff as well as taking oversome of the aircraft lease contracts held byAir Madrid, but as at end of January nothingdefinite had developed, and the idea looks tohave died.
germanwings
Essentially a business-oriented airline witha lower cost base rather than a genuine LCC,germanwings operates a fleet of 24 A319sand A320s to more than 50 destinations out ofits home base of Cologne/Bonn airport, aswell as from Stuttgart, Berlin and Hamburg.The airline is a subsidiary of Eurowings,which is owned 49% by Lufthansa and50.02% by businessman Dr Albrecht Knauf,who is also chairman of Eurowings.Lufthansa has operational control of german-wings, which (in contrast to the importance ofCondor) is a key part of Lufthansa group strat-egy to fight the challenge of Air Berlin,Ryanair and easyJet (see Aviation Strategy,July/August 2006).
Aviation StrategyAnalysis
Jan/Feb 20077
FleetOrders
(options) A320 10 A321 4
A330-200 8 1 A330-300 3 BAe 146 1
Total 26 1
LTU’S FLEET

germanwings plans to expand operationsconsiderably over the next few years, as thefirst of 18 A319s on order arrived in 2006 andthe fleet is scheduled to rise to 40 aircraft bythe end of 2009, with five A319s arriving in2007, seven in 2008 and four in 2009.Another 12 aircraft are on option.
That expansion has already begun, andlast year germanwings added six destina-tions out of Cologne/Bonn - to Alicante,Jerez, Anatalya, Heraklion, Göteborg andDanzig - while Stuttgart-Anatalya and Berlin-Ibiza were also launched during the year.Further routes were added in the winter2006/07 timetable, but another major expan-sion will come in the summer 2007 season,with two extra aircraft stationed atCologne/Bonn providing capacity for eightnew destinations out of the airport - Burgas(Bulgaria), Sarajevo, Sofia, Zadar (Croatia),Varna (Bulgaria), Alghero (Sardinia); Kavala(Greece), and Bucharest. There will also bean extra aircraft at Stuttgart, with a new routeto Corsica, while a Hamburg-Mallorca ser-vice is starting and another A319 at Berlin-Schonefeld will be used to increase flights by30% over the summer, with new routes toMykonos, Burgas, Varna and Balaton(Hungary).
Berlin-Schonefeld is regarded by german-wings as having substantial potential forgrowth, with the airport being promoted as analternative to Tegel for both business andleisure passengers. germanwings will stationthree aircraft at Schonefeld this year, serving16 destinations, and the airline is targeting1.8m passengers out of the airport in 2007(compared with 0.3m in its first year of oper-ation - 2002). Management expects its shareof passengers there to keep rising from thecurrent 20%, despite competition from AirBerlin, easyJet, Condor Berlin andNorwegian Air Shuttle.
More than half of the routes being addedover the summer are to easternEuropean destinations, includingBulgaria, Macedonia, Romania andCroatia, and germanwings believesthere is still much potential for growthinto these countries, particularly onroutes not currently served by flag car-riers or LCCs. Apparently the majority
of profits made by germanwings in 2006 wasgenerated by the longer routes to Moscow (aHamburg-Moscow service was launched inOctober, bringing routes to the Russian cap-ital up to four) and to St Petersburg, and theairline wants to add more higher marginroutes to eastern Europe rather than lowermargin routes down to the Mediterranean,whether there is more direct competition,
In 2006 germanwings reported a 39% risein revenue to €560m, based on a 31% rise inpassengers carried, to 7.1m. This is slightlyless than originally targeted (€570m revenueand 7.5m passengers), although the airlinebelieves this is good result given the increas-ing competition in the German aviation mar-ket. Although a net profit figure was notreleased, company sources indicate the prof-it levels were the highest ever since the air-line was launched in 2002.
germanwings is looking to increase rev-enue by 15% in 2007, based on an increasein passengers flown to 8m, but with 16 moreaircraft arriving over the next few years theairline is looking to expand not just its routesbut also its number of bases. Currently 12aircraft are stationed at Cologne/Bonn, withsix at Stuttgart, two each at Berlin andHamburg, and the other two being "spares".By 2009, 18 aircraft will be based atCologne/Bonn, but expansion potential out ofthere and at the other bases (other thanSchonefeld) is thought to be limited in thelong-term. Therefore a fifth base is likely tobe open sometime this year, and potentiallythis could be outside of Germany, with ger-manwing's analysts looking at a number ofoptions in east Europe and theMediterranean region.
germanwings' expansion over the nextfew years is being driven by ThomasWinkelman, managing director of the airlinesince his predecessor, Andreas Bierwirth,became marketing director at Lufthansa inSeptember 2006. He will also increase ger-manwing's drive into the business market,Last year the airline launched an FFP calledthe "Boomerang Club", - claimed to be firstFFP for an LCC in Europe - and it alreadyhas more than 50,000 members, with partici-pants acquiring rewards not just for german-wings flights but also for bookings with car
Aviation StrategyAnalysis
Jan/Feb 20078
FleetOrders
(options) A319 21 16 (12) A320 3
Total 24 16 (12)
GERMANWINGS’FLEET

rental and hotel partners. germanwings looksset to be part of Lufthansa's empire for theforeseeable future, and that position will onlychange if Lufthansa group manages toimpose an LCC-type cost basis onto itsEconomy Budget operations in the mainlineLufthansa - a scenario that appears highlyunlikely.
Condor
Frankfurt-based Condor is undergoinganother change of ownership as by the endof the first quarter of 2007 KarstadtQuelle,the German retail and mail order group, willcomplete a previously-announced deal toincrease its stake in tour operator groupThomas Cook to 100%, by paying €800m forthe 50% stake held by Lufthansa.
Condor operates to more than 60 leisureand city destinations across the globe with afleet of 22 757s and 767s, while subsidiaryCondor Berlin operates charter flights out ofSchonefeld airport with 14 A320s.
In an attempt to diversify away fromreliance on the traditional holiday markets tothe Mediterranean and northern Africa, aswell on long-haul holiday flights to Asia,Africa and the Americas, in 2004 Condorintroduced seat-only sales (using Air Berlinas a "benchmark"). These grew rapidly toaccount for a third of all revenue within just12 months, and in 2005 diversification con-tinued with the launch of city-to-city servicesout of Munich to 10 foreign destinations, sixof which were in Italy. In addition, Condorunderwent restructuring in 2005 and 2006that knocked €160m off the annual costbase, half of which came from fewer staff andbetter productivity. Condor expects 2006 netprofits to fall compared with the €20m netprofit of 2005, thanks mainly to higher fuelcosts, although it is aiming to increase profitsto at least €80m by 2008.
The aforementioned KarstadtQuelle dealhas yet to be approved by the relevant regu-latory authorities, but the flag carrier is des-perate to sell its Thomas Cook stake (after atentative plan to carry out an IPO provedimpossible) as part of its refocus on corebusiness - and because Thomas Cook has
been draggingdown Lufthansagroup results.
As part ofthe deal,Lufthansa willacquire the 50%held by Condorin SunExpress,a Turkish scheduled and charter airline thatoperates a fleet of 12 737-800s and 757-200s out of Anatalya (Turkish Airlines ownsthe other 50%). But crucially, while ThomasCook Airlines UK (which has a fleet of 23A320s, A330s and 757s) and Thomas CookAirlines Belgium (six A320s) will remain partof Thomas Cook, and hence be transferredto KarstadtQuelle's ownership, the Condorsituation is more complicated.
Again as part of the overall deal,Lufthansa is to increase its stake in Condorfrom 10% to 24.9% by acquiring 14.9% ofKarstadtQuelle's current 90% stake for €20m- but the deal reportedly will include a calloption for KarstadtQuelle to repurchase theshares after a two year period, as well as aput option in which Lufthansa can requireKarstadtQuelle to buy its shares at the samedate. If neither option is exercised, Lufthansathen has the option to acquire the 75.1% heldby the German retailer.
For the staff at Condor, this uncertaintyover who will own the airline in a couple ofyears is "bewildering", according to one pilot.In December last year industrial action wascarried out briefly at Condor Berlin before acollective pay deal was agreed betweenmanagement and 240 flight attendants repre-sented by the Verdi union, and sources sug-gest that the workforce is uneasy over theairline's medium-term future.
Although both a Condor/TUI andCondor/LTU link has been rumoured, muchwill depend on how KarstadtQuelle evolvesThomas Cook, and whether it needs its ownin-house airline or prefers to buy in seatcapacity from others. The likelihood is thatLufthansa will not want to keep Condor in thelong-term, given that it is not considered partof its core assets.
Aviation StrategyAnalysis
Jan/Feb 20079
FleetOrders
(options) 757-300 13
767-300ER 9 Total 22
Condor Berlin A320 14
Condor/Condor Berlin total 37 0
CONDOR’S FLEET

In 2006 Boeing recorded 1,044 net orders,42 more than 2005 and, crucially, 254
more net orders than Airbus, which recorded790 net orders.
Boeing's record 2006 performance washeavily supported by 737 orders, whichaccounted for almost 70% of the manufac-turer's net orders. Widebody sales included157 orders for the yet-to-be-launched 787series aircraft, 76 orders for the 777, and ten767 orders. As Richard Aboulafia, Teal
Group analyst, puts it " [Boeing] have gonefrom uncertain future and second place tounquestioned dominance".
Boeing and Airbus have sold more com-mercial jets in the past two years than at anytime in aviation history. Orders placed inAsia, and in particular China, were veryrobust. Boeing recorded 284 orders in Asia,with a 2:1 narrowbody to widebody ratio.Airbus fared better, recording 344 orders,with CASGC ordering 150 A320 family air-
Aviation StrategyAnalysis
Jan/Feb 200710
Airbus/Boeing - competitivepositions reversed
737 747 767 777 787 TotalAir Berlin 75 75
Air France 1 1Air Europa 16 16
Cargolux Airlines 2 2First Choice Airways 2 2
Futura 3 3Icelandair 2 2
KLM Royal Dutch 9 1 10Lufthansa 20 20
Monarch Airlines 6 6Ryanair 42 42
Sky Airlines 3 3SkyEurope 5 5
Travel Service 2 2European Total 155 22 0 2 10 189
AirTran 25 25Alaska Airlines 13 13
Atlas Air 12 12Aviation Capital Group 14 14
Boeing Business Jet 14 4 5 23CIT Leasing Corp. 5 5
Continental Airlines 26 13 39Delta Air Lines 10 10
Fedex 15 15GECAS 30 30
Guggenheim Av. Partners 4 3 7ILFC 6 2 2 10
Nakash Group 2 2Pegasus Airlines 6 6
Pegasus Av. Finance 2 2Southwest 82 82
WestJet 3 3N.American Total 229 20 0 20 29 298
Aeromexico 16 2 18Copa Airlines 1 1
Gol Airlines 22 22LAN Airlines 3 3
L. American Total 39 0 3 0 2 44
BOEING ORDERS 2006 737 747 767 777 787 TotalAir China 25 25
Air Pacific 5 5Cathay Pacific 6 2 8
China Eastern Airlines 16 16China Southern Airlines 10 10
Hainan Airlines 19 19Jet Airways 10 10Korean Air 4 5 15 24
Lion Air 30 30Nippon Cargo Airlines 2 2
Qantas 5 45 50SALE 10 10
Shandong Airlines 12 12Shanghai Airlines 8 8Shenzen Airlines 5 5
Singapore Airlines 20 20SpiceJet 10 10
Virgin Blue Airlines 9 9Xiamen Airlines 11 11
Asian Total 174 13 0 17 80 284
Air Sahara 10 10Buraq Air 1 1Egyptair 6 6
Emirates 10 10Kenya Airways 9 9LoadAir Cargo 2 2Qatar Airways 22 22
Africa/M.East Total 17 12 0 22 9 60
Unidentified Total 119 5 5 16 30 175Gross Total 733 72 8 77 160 1050
Changes -4 - 2 -1 -3 -62006 Net Total 1044
Source: Boeing

craft. Other significant orders in2006 included an 82 737 orderfrom Southwest, Air Berlin ordered75 and Ryanair 42 of the samemodel. Apart from CASGC, mainorderers of Airbus were the LCCseasyJet and AirAsia, with US lowcost start-up Skybus ordering 65A319s.
The sales performance atAirbus reflects its high-profile prob-lems last year. Wiring problemsplagued production of the A380,delaying delivery slots by twoyears and costing Airbus at least$3.6bn. Airbus has booked ordersfor 166 A380s, but only took under20 orders in 2006, with a notableten-plane cancellation from Fedex.Airbus indecision over theA350XWB, as well as potentialcustomer concerns that it did notmeasure up to the 787, created amajor advantage for the 787,which now has 448 orders bookedto date. Notwithstanding its prob-lems, Airbus has performed well inthe final quarter of 2006 to finishwith a 43% overall net order share,against a mid-2006 position of lessthan 20%.
In developments likely to figurein the orderbook battle, Airbusannounced the industrial launch ofthe A330F, creating new competi-tion in the midsized freighter mar-ket where Boeing has prevailedwith virtually no competition in thepast. The A330F will go up againstthe older 767 and newer 777freighters and will be more capa-ble than the 767 and cheaper thanthe 777, according to Airbus.
On the production side, bothcompanies are predicting 440-450deliveries for 2007. The industry'sall-time peak of 900 aircraftshipped in 1999 looks set to beequalled. A repeated combinedtotal of around 900 units indicatesanother all-round record year is instore for 2007.
Aviation StrategyAnalysis
Jan/Feb 200711
A318 A319 A320 A321 A300 A330 A340 A350 A380 TotalAegean 3 3Aercap 20 20
Aer Lingus 2 2 4Air One 5 5
Blue Wings 16 4 20Boutsen Aviation 2 2Czech Republic 2 2
easyJet 52 52Finnair 3 9 12
Grupo Marsans 12 12Jetalliance 1 1 2Lufthansa 5 10 15 5 7 42
NIKI 1 1RBS Aerospace 4 6 10
Stumpf Group 1 1Wizz Air 20 20
European Total 1 67 63 19 0 39 10 9 0 208
CIT 5 4 10 19Frontier Airlines 6 6
GECAS 1 2 3ILFC 3 3 3 4 13
Pegasus Aviation 6 2 8Skybus 65 65
US Airways 7 7N.American Total 0 74 15 7 0 19 0 6 0 121
Air Caraibes 1 1InterJet 10 10
TAM Linhas Aereas 12 16 3 6 37Latin American Total 0 12 26 3 0 7 0 0 0 48
Air Asia 40 40Air Blue 6 6
Air China 9 9CASGC 40 60 50 150
Go Air 10 10Indian Airlines 19 4 20 43
Kingfisher Airlines 5 5SALE 20 20
Silk Air 4 7 11Singapore Airlines 19 9 28
Tiger Airways 8 8Qantas 6 8 14
Asian Total 0 72 155 70 0 25 5 0 17 344
Afriqiyah Airways 3 6 3 12Air Mauritius 1 1
Alafco 6 6Middle East Airlines 4 4 8
National Air Services 2 2Tunis Air 1 1
Africa/M.East Total 2 8 12 0 0 8 0 0 0 30
Private Customer 1 8 2 0 0 1 0 0 0 12Unidentified Total 12 39 5 0 5 0 0 0 61
Gross Total 4 253 312 104 0 104 15 15 17 824Cancellations -34
Net Total 790
AIRBUS ORDERS 2006
Source: Airbus

Why exactly are airlines such as Qantas andBA considered less risky, as indicated by their
superior corporate credit ratings, than the likes ofAmerican and JAL? A recent comparative analysisby Standard & Poor's* identifies the main differenti-ating credit factors for the world's top airlines.
The rating agency looked at both what it called"business risk" (industry characteristics, competi-tive position, etc) and "financial risk" (debt leverage,cash flow, liquidity, etc). The comparison, carriedout in mid-December 2006 and based on statisticsfrom 2005 or 2005/2006 financial years, plus quali-tative analysis, included two airlines each fromNorth America, Europe and Asia-Pacific: AMR,UAL, BA, Lufthansa, JAL and Qantas.
S&P concluded that the six airlines had broadlysimilar industry risk characteristics and that all had"quite good" market positions. The variation in busi-ness risk scores - BA, Lufthansa and Qantas wererated "satisfactory" while AMR, JAL and UAL werejudged "weak" - was mainly due to differences in2005 operating profitability (after adjustments fordepreciation, operating leases and retiree expens-es).
But the analysis found dramatic differences incash flow generation and debt burdens betweenthe six airlines. As a result, the financial risk scoresranged from Qantas' and Lufthansa's "intermedi-ate" (or solid by airline standards), to BA's "aggres-sive" and AMR's, JAL's and UAL's "highly lever-aged".
Industry risk/market positionThe report contained some interesting observa-
tions about regional differences in the regulatoryenvironment, degree of competition and other fac-tors. S&P considers the "highly concentrated"Japanese and Australian domestic markets and themany rapidly growing Asian markets the least risky.JAL and Qantas are well-positioned in that respect,since they earn 53% and 73% of their revenuesdomestically (the latter figure includes NewZealand).
The US and Canadian domestic markets areclearly the riskiest, due to competition and relative-ly low barriers to entry. AMR and UAL are heavilyexposed since they generate more than 60% oftheir revenues in the US domestic market.
European markets fall between the twoextremes, though S&P noted that both BA andLufthansa earn the bulk of their revenues (81% and51%, respectively) from intercontinental operations,which are generally less risky than intra-Europeanoperations.
The report suggested that Lufthansa, JAL andUnited have the most regionally diversified routenetworks. BA and JAL have the best home hubs(London Heathrow and Tokyo Narita). But S&P feltthat Lufthansa's and Qantas' home hubs (Frankfurtand Sydney), which serve smaller metropolitanareas, may lose some connecting business trafficwith the increasing use of medium-sized, long-range aircraft such as the 787.
S&P rated Qantas' home market position thestrongest among the six global carriers, despite thefact that its main competitor is an LCC. While JAL,BA and Qantas are the largest single operatorsfrom their home countries, those airlines (andLufthansa) account for less than 50% of total trafficat their main hubs because those airports areserved by a large number of international carriers.
By contrast, American and United dominatemost of their major hubs, which handle large num-bers of domestic passengers. They have largeshares of each local market, which tends to gener-ate higher-yield traffic, but they also face intensecompetition from LCCs either at the hubs or nearbyairports.
The US-Europe unit passenger revenue differ-entials seem as wide as ever. AMR and UALachieved less than 6 US cents per ASK in 2005,reflecting both low fares in the competitive USdomestic market and a lesser reliance on interna-tional premium-fare passengers. BA and Lufthansa,which have mostly international operations anddevote more space to premium classes, had unitrevenues of 9.4 and 9.7 cents, respectively. Qantasand JAL were in the middle, with RASK of 8.4 centsand 7.7 cents, respectively - JAL's has declinedbecause, following its 2002 acquisition of Japan AirSystem, it has a more equal blend of domestic andinternational flying. (The analysis did not includecargo and ancillary revenues, which can be signifi-cant contributors.)
The US airlines also had the lowest unit costs -around 6.5 cents per ASK (excluding restructuringcosts) in 2005, compared to Lufthansa's 9.6, BA's
Aviation StrategyAnalysis
Jan/Feb 2007
S&P explains credit ratings
12

8.9, Qantas' 8.2 and JAL's 7.9. The differencesreflect a combination of actual cost competitivenessand traffic mix. The multibillion dollar cost cutsimplemented by AMR and UAL in recent yearshave helped maintain their CASK lead.
Financial risk: vivid differencesThe report noted that AMR, JAL and UAL carry
significantly higher debt loads and have weakerfinancial ratios than the other three airlines, reflect-ing post-September 11 borrowings to maintain ade-quate liquidity and finance capital expenditures, aswell as overall weaker profitability and cash flowgeneration.
Qantas has the healthiest financial profile - sofar. The report noted that its relatively light debt bur-den was one reason it caught the attention of pri-vate equity firms, which are looking to add consid-erable leverage. S&P cautioned that Qantas' debtburden was set to rise anyway due to substantialplanned capital spending to modernise and expandits fleet, and that airlines generally are subject to awide variety of potential stresses - reasons why astrong financial profile and ample liquidity areimportant.
The fully-adjusted debt-to-capital ratios (thestandard leverage measure) at the end of 2005 or2005/06 financial years, ranged from Qantas' 49%to AMR's 110% (or UAL's negative 305%, thoughthis improved to positive 90% when the companyexited bankruptcy in early 2006). Lufthansa was thesecond-best with a ratio of 74%, followed by BAwith 79% and JAL with 91%. In terms of fully-adjust-ed net debt as percentage of revenues, which mea-sures solely an airline's debt burden relative to itssize, the range was from Qantas' conservative 21%to AMR's elevated 110%. The figures for Lufthansa,BA, JAL and UAL were 37%, 51%, 90% and 100%.
But why did UAL not get its debt-to-capital ratiobelow 90% despite all the Chapter 11 restructuring?Because, in S&P's words, "airlines, whose financial
obligations mostly take the form of secured debtand leases, have less scope to deliever in bank-ruptcy than does a typical industrial company".
The report noted that each of the six airlinesexcept JAL maintains a substantial unrestrictedcash cushion. At the end of 2005 or 2005/06 finan-cial years, BA's was the best at 29% of annual rev-enues, followed by Qantas' 21% and Lufthansa's20%. AMR and UAL are now also in the 21% range,after significantly improving their cash reserves in2006. Although JAL's equity offering in July 2006more than tripled its cash reserves to US$1.6bn,this higher figure still amounted to only 9% of 2005revenues.
Regarding what S&P called the "final liquidityline of defence", Lufthansa and Qantas have most-ly unencumbered fleets. BA has some unencum-bered aircraft. UAL's, AMR's and JAL's fleets arealmost entirely encumbered, but the latter two havesome other assets, such as AMR's FFP, that couldbe monetised.
Of the six airlines, Qantas has the highest cred-it rating with S&P - an investment-grade BBB+.However, the airline is on "creditwatch negative",meaning a downgrade is possible if the A$11.1bntakeover bid by a private equity consortium led byMacquarie Bank and Texas Pacific goes through,depending on how the transaction is financed.(According to the latest reports, the consortium haspledged to keep A$2bn of cash on Qantas' balancesheet to address airline industry risks, but thatwould be less than the A$2.9bn cash held at theend of June 2006.)
Lufthansa has the next-best credit rating(BBB), followed by BA (BB+), JAL (B+) and AMRand UAL (B). BA is the only one in the group thatcould secure an upgrade from S&P in the nearterm, thanks to steadily improving earnings and agradual reduction in debt. Although AMR's andUAL's earnings improved dramatically in 2006, theirhigh debt burdens mean that near-term credit ratingupgrades are unlikely.
Aviation StrategyAnalysis
Jan/Feb 200713
* "For Global Airlines, SimilarMarket Positions But Widely
Different Financial Profiles" byPhilip Baggaley, Standard &Poor's (18 December 2006)
Airline Qantas Lufthansa BA JAL AMR UALRating BBB+/Watch Neg BBB/Stable BB+/Positive B=/Negative B/Stable B/Stable
Business Risk Score Satisfactory Satisfactory Satisfactory Weak Weak WeakFinancial Risk Score Intermediate Intermediate Aggressive Highly leveraged Highly leveraged Highly leveraged
Revenues* $9.9bn $22.4bn $14.8bn $18.7bn $20.7bn $17.4bnFully adjusted debt/capital ratio** 48.7% 73.5% 78.8% 91.1% 109.8% 90%***
Fully adjusted net debt/revenues** 21% 37% 51% 90% 110% 100%
Notes: * In 2005 or 2005/06 fiscal year, ** At the end of 2005 or 2005/06 fiscal year, ***=Upon emergence from Chapter 11 in early 2006Source: Standard & Poor’s
HOW THE AIRLINES COMPARE
Allegiant Air: The bets are on this LCC
The diverse US LCC sector has gainedyet another variant of the low-cost
model: operating cheap, fuel-guzzling MD-80s in low-frequency service between smallcities and popular leisure destinations anddeploying Ryanair-style revenue strategies.Allegiant Air, a Las Vegas-based niche carri-er, has staged an amazing comeback withthe help of this model since emerging fromChapter 11 bankruptcy in 2002. The airlinehas grown at a dizzying pace, is achievingindustry-leading profit margins and recentlycompleted an IPO. But will Allegiant be ableto replicate the successful Las Vegas formu-la in the Florida markets?
The hitherto very low-profile "hometownAmerica" airline became better known in thecontext of its parent Allegiant TravelCompany's hugely successful IPO onDecember 7. The offering priced aboveexpectations, raised $94.5m in net proceedsfor growth and gave the company a listing onNasdaq. Post-IPO, the share price hasalmost doubled, from $18 to $35 as ofFebruary 2.
The key selling points were Allegiant'sfour-year record of profitable growth,extremely low operating costs, strong bal-ance sheet and experienced managementand financial sponsors. Investors liked themany innovative strategies, including afocus on ancillary revenues and avoidingcompetitive markets. With 50-plus potentialnew cities identified by the management,Allegiant was viewed as a promising growthstory.
But the IPO was also perfectly timed,launched in the wake of a sharp decline infuel prices in the autumn months. Allegiant'sMD-80 fleet would have made the companya tough sell at $70 oil.
Allegiant has been well received by WallStreet. By mid-January at least four analystshad initiated coverage of the company,though three of them were from financialinstitutions that were underwriters on the
IPO. There are two "buy" and two "neutral"recommendations - the latter are mainly dueto valuation.
But Allegiant's longer-term prospects areuncertain because some of its strategiesmay not be sustainable. How long can it relyon an aircraft type that is no longer in pro-duction? How long can it avoid competitionin the US domestic market?
Many in the industry remain undecidedabout Allegiant because its model goesagainst the accepted wisdom that modernfuel-efficient aircraft, high aircraft utilisationand reasonably large markets are critical foran LCC's success in the post-2001 environ-ment. To add to the unease, Allegiant's strat-egy invokes memories of what US LCCsused to be like in the pre-JetBlue days, whenthey typically operated old aircraft and manystruggled, and eventually disappeared,because they could not find large enoughmarkets.
The key thing to bear in mind is thatAllegiant is a niche carrier, not a mainstreamLCC. This type of model is not going to besignificant in the US.
But, with around 50 cities already servedacross the nation and 50-plus more planned,Allegiant is going to be rather large for aniche carrier. The interesting question is: willthe innovative revenue and other strategiesenable Allegiant to stick to its current formu-la, or will it have to become like the otherLCCs (new aircraft, larger markets)?
Allegiant's background
Allegiant has a little more controversy orcolour in its history than the typical US LCC.It has been through Chapter 11. Its twolargest investors - CEO Maurice Gallagherand Robert Priddy - were the founders andthe leadership at ValuJet, the hugely suc-cessful early 1990s LCC start-up that wasgrounded on safety grounds following its
Aviation StrategyBriefing
Jan/Feb 200714

DC-9 crash in 1996. (That said, the execu-tives were not directly blamed, and Priddyoversaw ValuJet's successful transformationinto AirTran and remained its CEO for manyyears).
Gallagher was one of Allegiant Air’s orig-inal backers when it was founded in 1997,but he did not become involved in manage-ment until 2002. The airline operated ad hoccharters and a small network of high-fre-quency scheduled service focusing on thebusiness traveller in the West, utilising DC-9s in a two-class configuration. The strategywas unsuccessful and the company filed forChapter 11 bankruptcy in December 2000.As part of the reorganisation, Gallagher'sdebt was restructured and he injected addi-tional capital, becoming the majority ownerand a board director (he took over as CEO inAugust 2003). A new management team wasinstalled in June 2001, and Allegiantemerged from Chapter 11 with a new strate-gy in March 2002.
In the subsequent years, Allegiant soldequity to four of its senior officers andbrought in additional investors through pri-vate placements. The present holding com-pany structure was created in May 2004. Allof that plus the IPO led to the company look-ing very strong in terms of its management,financial sponsor line-up and balance sheet.
The management team, led byGallagher, have been together for years,going back to the 1980s in certain instances.Many previously worked together at ValuJetor WestAir, a commuter carrier thatGallagher founded and led in 1983-1992.
In addition to Priddy, Allegiant's investorsinclude ex-Ryanair/Tiger Airways executiveDeclan Ryan and PAR Investment Partners(a US institutional investor with holdings inAMR, US Airways, Alaska, Southwest andRepublic). PAR acquired its 4-5% stakethrough a private sale in conjunction with theIPO.
While Gallagher's stake in Allegiant hasdeclined from 80% in August 2003 to about23% after the IPO, the board and manage-ment (including Gallagher) still hold about56% of the stock. Gallagher has never takena salary and does not have stock options.
As a result of the IPO, Allegiant has one
of the industry's strongest balance sheets.Year-end cash reserves were $136.1m - anexceptional 56% of last year's revenues. Thecompany had total assets of $305.7m, totaldebt of $72.8m and shareholders' equity of$153.5m. It had a net cash position, which israre for airlines. The lease-adjusted debt-to-capital ratio was only 41% - similar toSouthwest's. All of this puts Allegiant in astrong position to grow the business andweather any setbacks.
Strong profitable growth
Allegiant has grown its capacity at a com-pound annual growth rate of 89.6% since2002. In August 2003 it operated just sixMD-80s, serving six cities; now the fleettotals 26 MD-80s (as of January 31), servingabout 50 cities.
Revenue growth has been just as strong,from $22.2m in 2002 to $132.5m in 2006, a
Aviation StrategyBriefing
Jan/Feb 200715
0
100,000
200,000
300,000
400,000
2002 2003 2004 2005 2006 2007F
-5,000
0
5,000
10,000
15,000
20,000
25,000
30,000
2002 2003 2004 2005 2006 2007F
ALLEGIANT’S REVENUES..$000s
..AND FINANCIAL RESULTS$000s
Op.result
Netresult
Notes: 2006 net profit of $15.2m is before a one-time tax accrual (includingthat, the profit was $8.7m). 2007 net profit forecast is the midpoint of the con-sensus range of $25-27m.

CAGR of 82%. After small operating and netlosses in 2002, Allegiant has earned profitsin each of the past four years despite theincrease in fuel prices. Last year, its operat-ing profit almost tripled to $22.6m, repre-senting 9.3% of revenues, while net profitmore than doubled to $15.2m (before a one-time tax accrual of $7.3m). Revenue surgedby 84% to $243.3m in 2006.
Allegiant's 11.7% operating margin in thefourth quarter was the best among the USlegacies and LCCs. According to MerrillLynch, in terms of pretax margin, Allegiantshared the lead position with Southwest(both 7%). This compared with JetBlue's andUS Airways' 4% and breakeven or worse forother airlines.
Unusual niche and MD-80 strategy
Allegiant targets leisure travellers in smallunder-served cities that otherwise have fewoptions to travel to what the company calls"world class leisure destinations", such asLas Vegas, Orlando and Tampa/StPetersburg (the three currently on the air-line's route map).
Las Vegas and Orlando are two of thelargest and most popular leisure destina-tions in the US. Las Vegas, where Allegiantis headquartered, offers gaming, shows andother attractions, as well as conventions,and has seen strong and consistent visitor
growth in the past 25 years. Orlando is oneof America's top family destinations, offeringvarious theme parks and attractions, whileTampa/St.Petersburg is a popular beachvacation destination.
The markets targeted by Allegiant aretypically too small for non-stop service bylegacies or traditional LCCs, which require atleast 2-3 daily frequencies, or they are solow-yield that they are not a priority for othercarriers. While some of the markets might besuitable for RJs, Allegiant's CASM is signifi-cantly lower and its 150-seat aircraft offer acomfortable alternative to the RJs that sec-ondary market travellers are accustomed toflying.
Consequently, in roughly 90% of its mar-kets, Allegiant is the only carrier providingnonstop service; of the 70 routes it plans toserve at the end of the current quarter, onlysix routes have existing or announced ser-vice by other airlines. By being the only car-rier to offer non-stop service and by makinglow fares available, Allegiant typically stimu-lates new traffic and quickly becomes themarket share leader for O&D passengers. Inother words, the airline has found a prof-itable niche - something that has historicallybeen a challenge for LCCs.
But the "small cities, big destinations"niche is only possible because of a uniquefleet and operating strategy. Profitable oper-ation of 150-seat aircraft in the small leisuremarkets calls for very limited frequencies.Allegiant typically operates only 2-4 flightsper week on a route; currently there are nodaily flights.
This gives Allegiant very low averagedaily aircraft utilisation - just 6.7 hours in2006, compared to 11-13 hours typical forLCCs. But the airline compensates for thatby buying or leasing used MD-80s at pricesthat can be 80% below what other LCCs payfor new 150-seaters. The cost of acquiringand introducing to service an MD-80 aver-ages less than $6m for the airline. In otherwords, Allegiant benefits from extremely lowaircraft ownership costs. Fixed costsaccount for only about half of its total CASM,compared to an industry average of around70%.
The low fixed costs give the airline
Aviation StrategyBriefing
Jan/Feb 200716
12.912.1
11.4 11.2 11.1
6.8
6
8
10
12
14
jetBlue
Fronti
er
Southw
est
AirTran
Alaska
Allegia
nt
DAILY AIRCRAFT UTILISATIONJANUARY-SEPTEMBER 2006Hours
Source: Raymond James research

exceptional flexibility - a particularly valuableattribute in an era of volatile fuel prices. First,Allegiant can better tailor flight frequenciesto the needs of the market on a daily andseasonal basis. Second, it can more easilyenter or exit markets to limit unprofitable fly-ing and maximise profitability.
The downside of operating older MD-80s,of course, is that they are very fuel-inefficientand more expensive to maintain. RaymondJames’ analysts suggested in a mid-Januaryreport that, at current fuel prices, the MD-80ownership, fuel and maintenance costslargely offset one another. However, theypointed out that Allegiant also successfullyemploys other aspects of the LCC model,which makes it one of the lowest-cost USairlines.
The MD-80 maintenance economics areexpected to remain fairly constant. Althoughthe fleet averages 16 years in age (the old-est in the US), it is relatively young in termsof cycles (takeoffs and landings). The fleetaverages 25,000 cycles, and no aircraft hasflown in excess of 43,000 cycles. With eachaircraft adding roughly 1,000 cycles annual-ly, it will be many years before the aircraftreach the 60,000-cycle mark, where mainte-nance requirements increase sharply due toageing aircraft airworthiness directives.
Low operating costs
With scheduled service CASM of 7.69cents in 2006, or 4.15 cents excluding fuel,and an average stage length of 966 miles,Allegiant is clearly one of the industry'slowest-cost producers. In Merrill Lynch'sestimates for the first nine months of 2006,Allegiant's CASM (7.73 cents) was 29%below the average legacy CASM (10.91cents) and 14% below the average forAirTran, Frontier, JetBlue and Southwest(8.96 cents). Excluding fuel, Allegiant'sCASM was 46% below the legacies' and32% below the four LCCs'.
Raymond James analysts calculatedthat, on a stage-length adjusted basis,Allegiant was the third lowest-cost airlinein the US in the third quarter of 2006. At1,000-mile stage length, it had CASM of
8.3 cents, which was higher thanSouthwest's 6.9 cents and AirTran's 7.6cents but lower than JetBlue's 8.6 centsand Frontier's 9.0 cents.
Allegiant's low cost structure stemsfrom a highly productive workforce,extremely low aircraft ownership costs, asimple product, a cost-driven scheduleand low distribution costs.
The non-union workforce is among themost productive in the industry, averagingjust 37 full-time equivalent employees(FTEs) per aircraft, compared to 60-90 atother airlines. The high productivity stemsfrom fleet commonality, fewer unproduc-tive work rules, cost-driven scheduling,automation and the effective use of part-time employees.
The cost-driven schedule is an interest-ing concept. The airline designs its flightschedule so that most aircraft return to thethree leisure destinations (effectivelybases) at night, thereby reducing mainte-nance and flight crew overnight costs andproviding a "quality of life" benefit toemployees. The strategy is possiblebecause leisure travellers tend to be lessconcerned about departure and arrivaltimes.
The "return to base" strategy is evenpart of the route evaluation process. Thetwo key initial criteria that a prospectivenew city must meet are that the catchmentarea population must support at least two
Aviation StrategyBriefing
Jan/Feb 200717
6.97.6
8.3 8.6 9.0
10.3 10.711.3
12.4 12.813.2
6
8
10
12
14
Southw
est
AirTran
Allegia
nt
jetBlue
Fronti
er
US Airw
ays
Northw
est
Delta
America
n
Contin
ental
Unit
ed
UNIT COST COMPARISONS - 3Q 2006(Stage length adjusted)Cents
permile
Source: Raymond James research

weekly flights and that the city is not morethan eight hours' roundtrip flight time fromthe destination. The eight-hour limit per-mits one flight crew to perform the mis-sion.
Having a simple product is critical tokeeping costs low. Allegiant does not offerconnections, codeshares, FFPs, airportlounges or free catered items. Distributioncosts are kept low by not selling throughoutside channels such as travel web sitesor GDSs. All sales are direct through thecompany, via the website, call centres orairport ticket counters. Internet bookingsrepresent almost 90% of scheduled ser-vice sales - the highest among US airlines.
Allegiant also benefits from low airportcosts. This results from the use of sec-ondary airports at Orlando and Tampa/St.Petersburg, as well as special incentives,such as reduced landing fees and market-ing support, provided by small cities eagerto attract new air service.
Diversified revenue strategy
Allegiant's revenue strategy differsfrom those adopted by other US LCCs.First, its revenue structure is more diversi-fied, with fixed-fee contracts with touroperators and ancillary revenues account-ing for as much as 26.7% of total revenuesin 2006 (the remaining 73.3% came fromscheduled services). Second, Allegianthas taken the so-called "unbundling" strat-egy, which was pioneered by Ryanair inEurope, the furthest among US airlines. InGallagher's words, Allegiant is "more thanan airline"; it is a "leisure travel companythat happens to use aircraft".
The fixed-fee contract revenues,though helpful, are basically a relic fromthe pre-2002 business and are not expect-ed to grow. While scheduled service rev-enues are the fastest-growing component,ancillary revenues (12.8% of total rev-enues in 2006) also offer much potential.Ancillary revenues are the highest-marginbusiness; Merrill Lynch estimates that thepretax margin is in excess of 75%.
There are basically three types of ancil-
lary revenues. First, there are the extratravel-related products that passengersmay want to buy: hotels, car rentals, showtickets, night club packages and otherattractions. The bulk of Allegiant's ancillaryrevenues come from the sale of hotelrooms packaged with air travel. The airlinehas agreements with some 90 hotels in thedestination cities and around 28% of itspassengers book a hotel room.
Second, there are the flight-relateditems, some of which airlines have alwayscharged for (excess baggage fees, on-board sales of products, etc) and some ofwhich were traditionally included in the airticket price but are now offered for anadditional fee by some airlines. InAllegiant's case, the latter include on-board food and drinks and advance seatassignments ($11 per flight, includes prior-ity boarding).
Third, there are the items that one ana-lyst called "nothing more than stealth fareincreases", such as checked bag fees ($2)and fees for using Allegiant's website orcall centres to buy tickets.
The basic idea is to be able to marketan attractive low fare and then sell thoseadditional services that each passengervalues. In the fourth quarter of 2006, ancil-lary revenues boosted Allegiant's averagescheduled fare of $88 by $19 to $107. Theairline plans to grow its ancillary revenuesby further unbundling its product anddeveloping new and expanding existingpartnerships with hotels, entertainmentcompanies and attraction providers.
Allegiant offers a "simple, affordable"scheduled service product, with norequirement for Saturday night stay orround trip purchase. The fare structureconsists of six buckets, with prices gener-ally increasing as travel dates get nearer.Prices in the highest bucket are typicallyless than three times those in the lowestbucket. The highest one-way fare was$239 in December. All fares are non-refundable but may be changed for a $50fee.
The airline uses yield management tomaximise revenues. It continues to paycommission to travel agents for vacation
Aviation StrategyBriefing
Jan/Feb 200718
packages (but not for flights), becausetravel agencies tend to have more influ-ence in small cities.
Growth plans and prospects
Allegiant anticipates growing its fleet by5-7 aircraft per year in the next few years.After the exceptional initial four-yeargrowth spurt, ASM growth is expected toslow to the 30%-range in 2007 and aver-age 20% annually over the next five years.
The airline has identified "at least 52"more small cities in the US and Canadaand "several" popular vacation destina-tions in the US, Mexico and the Caribbeanthat it could potentially serve. Analystshave suggested Miami, Cancun and PalmSprings (California) as possible destina-tions. In addition, the airline expects toincrease frequencies in existing markets.
The current year's focus will be ondeveloping the markets to Orlando andTampa/St Petersburg, which were onlyadded in May 2005 and November 2006,respectively, and currently represent 30%of total revenues (Las Vegas accounts for70%). Orlando was slow to take off,though that was partly because of the dif-ficult 2005 hurricane season. The keychallenge - and in many ways a test of theexpandability of the business model - ismaking Florida as successful as LasVegas.
Even though small cities generally mayrepresent a large untapped market forleisure travel, a small city also poses agreater risk that the demand is not there. ButAllegiant claims to have a 90% "hit rate" andit quickly pulls out of the 10% of cities thatfail to generate "consistent after-tax returns".
The flexible business model allowsAllegiant to enter and exit new marketsquickly and inexpensively - something thatwill come in handy as the airline will almostcertainly face more competition as it grows.This dynamic was seen in January whenAllegiant pulled out of Newburgh (New York),which it had served for two years, after bothAirTran and JetBlue announced daily non-stop service from Newburgh to Allegiant's
Florida destinations.One drawback of the Allegiant model is
that it may not be possible to generate muchrepeat business, which would help facilitatefrequency increases. After a weekend in LasVegas and a vacation in Orlando, the leisurecustomer will probably want to go some-where different. However, Allegiant's man-agement feels that Las Vegas demand hasnot yet peaked, while the Florida market hasa different dynamic (many second-homeowners and Midwesterners looking for theirfun in the sun).
Allegiant does not expect to face anynear-term gate or facility constraints, thoughthe gate situation at Las Vegas couldbecome a problem in 5-7 years.
The consensus opinion is that MD-80availability is not likely to constrainAllegiant's growth for the foreseeable future.Current availability is good, and the futurereplacement programmes of airlines such asAmerican, which has over 300 MD-80s,should ensure an adequate supply of high-quality MD-80s at favourable prices.However, potential future FAA regulationslimiting the age of aircraft in the US couldresult in Allegiant needing a newer aircrafttype sooner than anticipated.
Allegiant is expected to continue postingstrong earnings growth for the next couple ofyears. The current consensus forecast for2007, which the company is comfortablewith, is a net profit of $1.20-$1.30 per share,or $25-27m, which would represent a 35-46% increase over last year's 89 cents pershare (before the one-time charge).Operating margins are expected to rise tothe 12-15% range in 2007-2009 (Gallaghersaid at Raymond James' growth airlinesconference in January that Allegiant aims tobe the highest-margin carrier in the US).
But all of that assumes that Allegiant willbe able to replicate the successful LasVegas formula in the Florida markets. Inaddition to the market and growth-relatedrisks, the MD-80 strategy and the focus onleisure travellers make Allegiant more vul-nerable than other airlines to any futureincreases in fuel prices or economic slow-down.
Aviation StrategyBriefing
Jan/Feb 200719
By Heini [email protected]
Aviation StrategyDatabases
Jan/Feb 200720
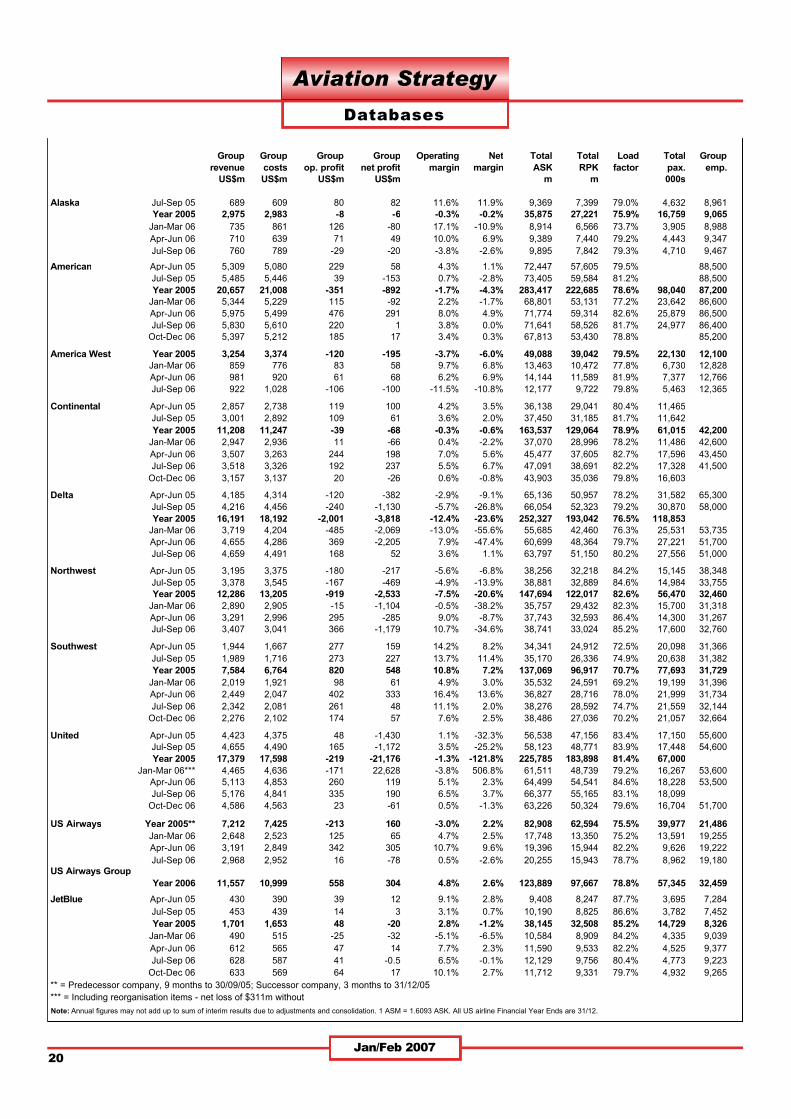
Group Group Group Group Operating Net Total Total Load Total Grouprevenue costs op. profit net profit margin margin ASK RPK factor pax. emp.
US$m US$m US$m US$m m m 000s
Alaska Jul-Sep 05 689 609 80 82 11.6% 11.9% 9,369 7,399 79.0% 4,632 8,961Year 2005 2,975 2,983 -8 -6 -0.3% -0.2% 35,875 27,221 75.9% 16,759 9,065
Jan-Mar 06 735 861 126 -80 17.1% -10.9% 8,914 6,566 73.7% 3,905 8,988Apr-Jun 06 710 639 71 49 10.0% 6.9% 9,389 7,440 79.2% 4,443 9,347Jul-Sep 06 760 789 -29 -20 -3.8% -2.6% 9,895 7,842 79.3% 4,710 9,467
American Apr-Jun 05 5,309 5,080 229 58 4.3% 1.1% 72,447 57,605 79.5% 88,500Jul-Sep 05 5,485 5,446 39 -153 0.7% -2.8% 73,405 59,584 81.2% 88,500Year 2005 20,657 21,008 -351 -892 -1.7% -4.3% 283,417 222,685 78.6% 98,040 87,200
Jan-Mar 06 5,344 5,229 115 -92 2.2% -1.7% 68,801 53,131 77.2% 23,642 86,600Apr-Jun 06 5,975 5,499 476 291 8.0% 4.9% 71,774 59,314 82.6% 25,879 86,500Jul-Sep 06 5,830 5,610 220 1 3.8% 0.0% 71,641 58,526 81.7% 24,977 86,400
Oct-Dec 06 5,397 5,212 185 17 3.4% 0.3% 67,813 53,430 78.8% 85,200
America West Year 2005 3,254 3,374 -120 -195 -3.7% -6.0% 49,088 39,042 79.5% 22,130 12,100Jan-Mar 06 859 776 83 58 9.7% 6.8% 13,463 10,472 77.8% 6,730 12,828Apr-Jun 06 981 920 61 68 6.2% 6.9% 14,144 11,589 81.9% 7,377 12,766Jul-Sep 06 922 1,028 -106 -100 -11.5% -10.8% 12,177 9,722 79.8% 5,463 12,365
Continental Apr-Jun 05 2,857 2,738 119 100 4.2% 3.5% 36,138 29,041 80.4% 11,465Jul-Sep 05 3,001 2,892 109 61 3.6% 2.0% 37,450 31,185 81.7% 11,642Year 2005 11,208 11,247 -39 -68 -0.3% -0.6% 163,537 129,064 78.9% 61,015 42,200
Jan-Mar 06 2,947 2,936 11 -66 0.4% -2.2% 37,070 28,996 78.2% 11,486 42,600Apr-Jun 06 3,507 3,263 244 198 7.0% 5.6% 45,477 37,605 82.7% 17,596 43,450Jul-Sep 06 3,518 3,326 192 237 5.5% 6.7% 47,091 38,691 82.2% 17,328 41,500
Oct-Dec 06 3,157 3,137 20 -26 0.6% -0.8% 43,903 35,036 79.8% 16,603
Delta Apr-Jun 05 4,185 4,314 -120 -382 -2.9% -9.1% 65,136 50,957 78.2% 31,582 65,300Jul-Sep 05 4,216 4,456 -240 -1,130 -5.7% -26.8% 66,054 52,323 79.2% 30,870 58,000Year 2005 16,191 18,192 -2,001 -3,818 -12.4% -23.6% 252,327 193,042 76.5% 118,853
Jan-Mar 06 3,719 4,204 -485 -2,069 -13.0% -55.6% 55,685 42,460 76.3% 25,531 53,735Apr-Jun 06 4,655 4,286 369 -2,205 7.9% -47.4% 60,699 48,364 79.7% 27,221 51,700Jul-Sep 06 4,659 4,491 168 52 3.6% 1.1% 63,797 51,150 80.2% 27,556 51,000
Northwest Apr-Jun 05 3,195 3,375 -180 -217 -5.6% -6.8% 38,256 32,218 84.2% 15,145 38,348Jul-Sep 05 3,378 3,545 -167 -469 -4.9% -13.9% 38,881 32,889 84.6% 14,984 33,755Year 2005 12,286 13,205 -919 -2,533 -7.5% -20.6% 147,694 122,017 82.6% 56,470 32,460
Jan-Mar 06 2,890 2,905 -15 -1,104 -0.5% -38.2% 35,757 29,432 82.3% 15,700 31,318Apr-Jun 06 3,291 2,996 295 -285 9.0% -8.7% 37,743 32,593 86.4% 14,300 31,267Jul-Sep 06 3,407 3,041 366 -1,179 10.7% -34.6% 38,741 33,024 85.2% 17,600 32,760
Southwest Apr-Jun 05 1,944 1,667 277 159 14.2% 8.2% 34,341 24,912 72.5% 20,098 31,366Jul-Sep 05 1,989 1,716 273 227 13.7% 11.4% 35,170 26,336 74.9% 20,638 31,382Year 2005 7,584 6,764 820 548 10.8% 7.2% 137,069 96,917 70.7% 77,693 31,729
Jan-Mar 06 2,019 1,921 98 61 4.9% 3.0% 35,532 24,591 69.2% 19,199 31,396Apr-Jun 06 2,449 2,047 402 333 16.4% 13.6% 36,827 28,716 78.0% 21,999 31,734Jul-Sep 06 2,342 2,081 261 48 11.1% 2.0% 38,276 28,592 74.7% 21,559 32,144
Oct-Dec 06 2,276 2,102 174 57 7.6% 2.5% 38,486 27,036 70.2% 21,057 32,664
United Apr-Jun 05 4,423 4,375 48 -1,430 1.1% -32.3% 56,538 47,156 83.4% 17,150 55,600Jul-Sep 05 4,655 4,490 165 -1,172 3.5% -25.2% 58,123 48,771 83.9% 17,448 54,600Year 2005 17,379 17,598 -219 -21,176 -1.3% -121.8% 225,785 183,898 81.4% 67,000
Jan-Mar 06*** 4,465 4,636 -171 22,628 -3.8% 506.8% 61,511 48,739 79.2% 16,267 53,600Apr-Jun 06 5,113 4,853 260 119 5.1% 2.3% 64,499 54,541 84.6% 18,228 53,500Jul-Sep 06 5,176 4,841 335 190 6.5% 3.7% 66,377 55,165 83.1% 18,099
Oct-Dec 06 4,586 4,563 23 -61 0.5% -1.3% 63,226 50,324 79.6% 16,704 51,700
US Airways Year 2005** 7,212 7,425 -213 160 -3.0% 2.2% 82,908 62,594 75.5% 39,977 21,486Jan-Mar 06 2,648 2,523 125 65 4.7% 2.5% 17,748 13,350 75.2% 13,591 19,255Apr-Jun 06 3,191 2,849 342 305 10.7% 9.6% 19,396 15,944 82.2% 9,626 19,222Jul-Sep 06 2,968 2,952 16 -78 0.5% -2.6% 20,255 15,943 78.7% 8,962 19,180
US Airways GroupYear 2006 11,557 10,999 558 304 4.8% 2.6% 123,889 97,667 78.8% 57,345 32,459
JetBlue Apr-Jun 05 430 390 39 12 9.1% 2.8% 9,408 8,247 87.7% 3,695 7,284Jul-Sep 05 453 439 14 3 3.1% 0.7% 10,190 8,825 86.6% 3,782 7,452Year 2005 1,701 1,653 48 -20 2.8% -1.2% 38,145 32,508 85.2% 14,729 8,326
Jan-Mar 06 490 515 -25 -32 -5.1% -6.5% 10,584 8,909 84.2% 4,335 9,039Apr-Jun 06 612 565 47 14 7.7% 2.3% 11,590 9,533 82.2% 4,525 9,377Jul-Sep 06 628 587 41 -0.5 6.5% -0.1% 12,129 9,756 80.4% 4,773 9,223
Oct-Dec 06 633 569 64 17 10.1% 2.7% 11,712 9,331 79.7% 4,932 9,265** = Predecessor company, 9 months to 30/09/05; Successor company, 3 months to 31/12/05*** = Including reorganisation items - net loss of $311m withoutNote: Annual figures may not add up to sum of interim results due to adjustments and consolidation. 1 ASM = 1.6093 ASK. All US airline Financial Year Ends are 31/12.

Aviation StrategyDatabases
Jan/Feb 200721
Group Group Group Group Operating Net Total Total Load Total Grouprevenue costs op. profit net profit margin margin ASK RPK factor pax. employees
US$m US$m US$m US$m m m 000s
Air France/ Oct-Dec 04 6,628 5,745 883 83 13.3% 1.3% 54,144 42,042 77.6% 15,934KLM Group Year 2004/05 24,641 21,744 641 453 2.6% 1.8% 214,606 168,998 78.7% 64,075 102,077YE 31/03 Apr-Jun 05 6,257 5,982 275 135 4.4% 2.2% 57,936 46,041 79.5% 17,948 101,886
Jul-Sep 05 6,790 6,154 636 864 9.4% 12.7% 60,472 50,961 84.2% 18,705Oct-Dec 05 6,430 6,205 225 91 3.5% 1.4% 58,266 46,644 80.0% 17,120 102,291
Year 2005/06 25,901 24,771 1,136 1108 4.4% 4.3% 234,669 189,253 80.6% 70,020 102,422Apr-Jun 06 7,282 6,766 516 306 7.1% 4.2% 60,839 49,596 81.5% 19,049Jul-Sep 06 7,779 7,058 721 475 9.3% 6.1% 63,616 53,611 84.2% 19,600
BA Year 2004/05 14,681 13,666 1,015 472 6.9% 3.2% 144,189 107,892 74.8% 35,717 46,065YE 31/03 Apr-Jun 05 3,716 3,398 318 162 8.6% 4.4% 36,706 27,768 75.6% 9,177 46,079
Jul-Sep 05 3,887 3,427 460 301 11.8% 7.7% 37,452 29,812 79.6% 9,767 46,144Oct-Dec 05 3,664 3,362 301 212 8.2% 5.8% 37,119 27,499 74.1% 8,530 45,624Jan-Mar 06 3,692 3,530 162 144 4.4% 3.9% 36,657 26,780 73.1% 8,160 45,171
Year 2005/06 14,813 13,588 1,227 812 8.3% 5.5% 147,934 111,859 75.6% 35,634 47,012Apr-Jun 06 4,208 3,825 383 280 9.1% 6.7% 38,222 29,909 78.3% 9,569 45,100Jul-Sep 06 4,331 4,080 251 315 5.8% 7.3% 38,727 30,872 79.7% 9,935 45,058
Oct-Dec 06 4,051 3,798 253 210 6.2% 5.2% 36,563 27,073 74.0% 7,878 42,197
Iberia Year 2004 5,895 5,663 232 230 3.9% 3.9% 61,058 45,924 75.2% 26,692 24,993YE 31/12 Jan-Mar 05 1,531 1,571 -40 -21 -2.6% -1.4% 15,261 11,421 74.8% 6,181 24,044
Apr-Jun 05 1,466 1,392 74 54 5.0% 3.7% 15,843 11,939 75.4% 7,242 24,435Jul-Sep 05 1,439 1,368 71 53 4.9% 3.7% 16,659 13,619 81.8% 7,656 25,069
Oct-Dec 05 1,451 1,504 -53 -7 -3.7% -0.5% 15,864 12,082 76.2% 6,596 23,845Year 2005 5,808 5,712 96 608 1.7% 10.5% 63,628 49,060 77.1% 27,675 24,160
Jan-Mar 06 1,457 1,536 -79 -54 -5.4% -3.7% 15,689 11,876 75.7% 6,300 23,772Apr-Jun 06 1,816 1,753 63 44 3.5% 2.4% 16,809 13,420 79.8% 7,461 24,109Jul-Sep 06 1,825 1,700 125 96 6.8% 5.3% 16,846 14,065 83.5% 7,354 22,721
Lufthansa Jul-Sep 04 5,511 5,164 347 154 6.3% 2.8% 38,115 28,883 75.8% 14,053YE 31/12 Year 2004 25,655 24,285 1370 551 5.3% 2.1% 140,648 104,064 74.0% 50,300 34,700
Jan-Mar 05 5,041 5,079 -38 -150 -0.8% -3.0% 32,477 23,793 73.3% 11,190Apr-Jun 05 5,487 5,138 349 140 6.4% 2.6% 37,700 28,178 74.7% 13,583Jul-Sep 05 5,798 5,411 387 501 6.7% 8.6% 38,967 30,466 78.2% 14,203Year 2005 21,397 20,545 852 725 4.0% 3.4% 144,182 108,185 75.0% 51,260 37,042
Jan-Mar 06 5,369 5,460 -91 -118 -1.7% -2.2% 33,494 24,044 71.8% 11,442Apr-Jun 06 6,529 6,203 326 142 5.0% 2.2% 37,797 28,603 75.7% 14,106Jul-Sep 06 6,765 6,188 577 461 8.5% 6.8% 39,225 30,627 78.1% 14,781
SAS Year 2004 8,830 8,967 -137 -283 -1.6% -3.2% 43,077 28,576 64.0% 32,354 32,481YE 31/12 Jan-Mar 05 1,842 1,990 -148 -137 -8.0% -7.4% 12,465 7,342 58.9% 7,299 31,797
Apr-Jun 05 2,046 1,925 121 64 5.9% 3.1% 13,810 9,259 67.0% 9,357 32,285Jul-Sep 05 2,140 2,036 104 68 4.9% 3.2% 13,599 9,838 72.3% 9,325
Oct-Dec 05 2,050 1,966 84 25 4.1% 1.2% 12,880 8,646 67.1% 8,945Year 2005 7,789 7,717 173 32 2.2% 0.4% 38,454 26,487 68.9% 23,799 32,363
Jan-Mar 06 1,078 1,064 -150 -137 -13.9% -12.7% 12,275 8,179 66.6% 8,532 31,528Apr-Jun 06 2,439 2,319 120 75 4.9% 3.1% 14,005 10,325 74.0% 10,325 32,622Jul-Sep 06 2,476 2,318 158 83 6.4% 3.4% 14,086 10,745 76.3% 10,141 32,772
Ryanair Year 2004/05 1,727 1,301 426 345 24.7% 20.0% 36,611 31,205 84.0% 27,593YE 31/03 Apr-Jun 05 488 392 96 84 19.7% 17.2% 83.4% 8,500 2,764
Jul-Sep 05 652 409 244 208 37.4% 31.9% 9,500 2,987Oct-Dec 05 439 381 58 44 13.2% 10.0% 83.0% 8,600 2,963
Year 2005/06 2,045 1,598 447 371 21.9% 18.1% 83.0% 34,768 3,063Apr-Jun 06 711 539 172 146 24.2% 20.5% 10,700Jul-Sep 06 864 553 313 268 36.2% 31.0% 11,481 3,881
Oct-Dec 06 651 575 76 63 11.7% 9.7% 82.0% 10,300 4,209
easyJet Year 2003/04 1,963 1,871 92 74 4.7% 3.8% 25,448 21,566 84.5% 24,300 3,727YE 31/03 Oct-Mar 05 1,039 1,116 -77 -41 -7.4% -3.9% 14,526 12,150 83.8% 13,500
Year 2004/05 2,364 2,278 86 76 3.6% 3.2% 32,141 27,448 85.2% 29,600 4,152Oct-Mar 06 1,095 1,177 -82 -50 -7.5% -4.6% 16,672 13,642 81.8% 14,900
Year 2005/06 3,034 2,813 221 176 7.3% 5.8% 37,088 31,621 84.8% 33,000 4,859
Note: Annual figures may not add up to sum of interim results due to adjustments and consolidation.

Aviation StrategyDatabases
22Jan/Feb 2007
Group Group Group Group Operating Net Total Total Load Total Grouprevenue costs op. profit net profit margin margin ASK RPK factor pax. employees
US$m US$m US$m US$m m m 000sANAYE 31/03 Year 2003/04 11,529 11,204 325 234 2.8% 2.0% 87,772 55,807 63.6% 44,800 28,870
Year 2004/05 12,024 11,301 723 251 6.0% 2.1% 85,838 55,807 65.0% 48,860 29,098Year 2005/06 12,040 11,259 781 235 6.5% 2.0% 86,933 58,949 67.8% 49,920 22,170
Cathay PacificYE 31/12 Year 2003 3,810 3,523 287 168 7.5% 4.4% 59,280 42,774 72.2% 12,322 14,673
Jan-Jun 04 2,331 2,046 285 233 12.2% 10.0% 35,250 26,825 76.1% 6,404Year 2004 5,024 4,350 674 581 13.4% 11.6% 74,062 57,283 77.3% 13,664 15,054
Jan-Jun 05 3,074 2,799 275 225 8.9% 7.3% 39,535 30,877 78.1% 7,333 15,400Year 2005 6,548 6,015 533 424 8.1% 6.5% 82,766 65,110 78.7% 15,440 15,447
Jan-Jun 06 3,473 3,201 272 225 7.8% 6.5% 43,814 34,657 79.1% 8,144
JALYE 31/03 Year 2003/04 18,398 19,042 -644 -844 -3.5% -4.6% 145,900 93,847 64.3% 58,241 21,197
Year 2004/05 19,905 19,381 524 281 2.6% 1.4% 151,902 102,354 67.4% 59,448 53,962Year 2005/06 19,346 19,582 -236 -416 -1.2% -2.2% 148,591 100,345 67.5% 58,040 53,010
Korean AirYE 31/12 Year 2003 5,172 4,911 261 -202 5.0% -3.9% 59,074 40,507 68.6% 21,811 15,352
Year 2004 6,332 5,994 338 414 5.3% 6.5% 64,533 45,879 71.1% 21,280 14,994Year 2005 7,439 7,016 423 198 5.7% 2.7% 66,658 49,046 71.4% 21,710 17,573
MalaysianYE 31/03 Year 2003/04 2,308 2,258 50 121 2.2% 5.2% 55,692 37,659 67.6% 15,375 20,789
Year 2004/05 2,882 2,798 84 86 2.9% 3.0% 64,115 44,226 69.0% 17,536 22,513Year 2005/06 3,141 3,555 -414 -421 -13.2% -13.4% 65,099 46,122 70.8% 17,910 20,324
QantasYE 30/06 Year 2002/03 7,588 7,217 335 231 4.4% 3.0% 99,509 77,225 77.6% 28,884 34,872
Jul-Dec 03 4,348 3,898 450 269 10.3% 6.2% 50,685 40,419 79.7% 15,107 33,552Year 2003/04 7,838 7,079 759 448 9.7% 5.7% 104,200 81,276 78.0% 30,076 33,862
Jul-Dec 04 5,017 4,493 524 358 10.4% 7.1% 57,402 43,907 76.5% 16,548 35,310Year 2004/05 9,524 8,679 845 575 8.9% 6.0% 114,003 86,986 76.3% 32,660 35,520
Jul-Dec 05 4,999 4,626 373 258 7.5% 5.2% 59,074 45,794 77.5% 17,260 35,158Year 2005/06 10,186 8,711 1,475 542 14.5% 5.3% 118,070 90,899 77.0% 34,080 34,832
SingaporeYE 31/03 Year 2003/04 5,732 5,332 400 525 7.0% 9.2% 88,253 64,685 73.3% 13,278 14,010
Year 2004/05 7,276 6,455 821 841 11.3% 11.6% 104,662 77,594 74.1% 15,944 13,572Year 2005/06 6,201 5,809 392 449 6.3% 7.2% 109,484 82,742 75.6% 17,000 13,729
Air ChinaYE 31/03 Year 2004 4,050 3,508 542 288 13.4% 7.1% 64,894 46,644 71.9% 24,500 29,133
Year 2005 4,681 4,232 449 294 9.6% 6.3% 70,670 52,453 74.2% 27,690 18,447
China SouthernYE 31/03 Year 2004 2,897 2,787 110 19 3.8% 0.7% 53,769 37,196 69.2% 28,210 18,221
Year 2005 4,682 4,842 -160 -226 -3.4% -4.8% 88,361 61,923 70.1% 44,120 34,417
China EasternYE 31/03 Year 2004 2,584 2,524 60 39 2.3% 1.5% 41,599 27,581 66.3% 17,710 20,817
Year 2005 3,356 3,372 -16 -57 -0.5% -1.7% 52,428 36,381 69.4% 24,290 29,746
Note: Annual figures may not add up to sum of interim results due to adjustments and consolidation. 1 ASM = 1.6093 ASK

Aviation StrategyDatabases
23Jan/Feb 2007
Domestic North Atlantic Pacific Latin America Total Int'lASK RPK LF ASK RPK LF ASK RPK LF ASK RPK LF ASK RPK LF
bn bn % bn bn % bn bn % bn bn % bn bn %1998 960.8 678.8 70.7 150.5 117.8 78.3 112.7 82.5 73.2 83.5 52.4 62.8 346.7 252.7 72.91999 1,007.3 707.5 70.2 164.2 128.2 78.1 113.2 84.7 74.8 81.3 54.3 66.8 358.7 267.2 74.52000 1,033.5 740.1 71.6 178.9 141.4 79.0 127.7 97.7 76.5 83.0 57.6 69.4 380.9 289.9 76.12001 1,025.4 712.2 69.5 173.7 128.8 74.2 120.1 88.0 73.3 83.4 56.9 68.2 377.2 273.7 72.62002 990.0 701.6 70.9 159.0 125.7 67.2 103.0 83.0 80.5 84.1 56.8 67.5 346.1 265.5 76.72003 963.1 706.6 73.4 148.3 117.6 79.3 94.8 74.0 80.5 84.2 59.3 70.5 327.2 251.0 76.72004 1,014.5 763.6 75.3 164.2 134.4 81.8 105.1 87.6 83.4 96.4 68.0 70.5 365.6 289.8 79.32005 1,004.4 783.7 78.0 174.6 143.3 82.1 116.8 96.0 82.2 105.0 76.6 72.9 396.4 315.9 79.7
Nov 06 78.9 62.2 78.9 14.0 11.0 78.3 9.5 7.7 81.6 8.4 6.3 75.4 31.9 25.1 78.5Ann change -0.8% 1.4% 1.7 8.4% 6.4% -1.4 1.0% 3.3% 1.8 3.5% 12.7% 6.2 4.8% 7.0% 1.6Jan-Nov 06 897.1 718.2 80.1 174.8 141.6 81.0 108.3 90.1 83.2 97.6 74.1 75.9 380.7 305.8 80.3Ann change -2.7% -0.3% 1.9 8.5% 6.8% -1.3 1.2% 2.4% 0.9 2.3% 6.6% 3.1 4.7% 5.4% 0.50.4
Note: US Majors = Aloha, Alaska, American, Am. West, American Transair, Continental, Cont. Micronesia, Delta, HawaiianJetBlue, MidWest Express, Northwest,Southwest, United and US Airways Source: ATA
US MAJORS’ SCHEDULED TRAFFIC
Intra-Europe North Atlantic Europe-Far East Total long-haul Total Int'lASK RPK LF ASK RPK LF ASK RPK LF ASK RPK LF ASK RPK LF
bn bn % bn bn % bn bn % bn bn % bn bn %1998 188.3 120.3 63.9 194.2 149.7 77.1 135.4 100.6 74.3 453.6 344.2 75.9 673.2 484.8 721999 200.0 124.9 62.5 218.9 166.5 76.1 134.5 103.1 76.7 492.3 371.0 75.4 727.2 519.5 71.42000 208.2 132.8 63.8 229.9 179.4 78.1 137.8 108.0 78.3 508.9 396.5 77.9 755.0 555.2 73.52001 212.9 133.4 62.7 217.6 161.3 74.1 131.7 100.9 76.6 492.2 372.6 75.7 743.3 530.5 71.42002 197.2 129.3 65.6 181.0 144.4 79.8 129.1 104.4 80.9 447.8 355.1 79.3 679.2 507.7 74.72003 210.7 136.7 64.9 215.0 171.3 79.7 131.7 101.2 76.8 497.2 390.8 78.6 742.6 551.3 74.22004 220.6 144.2 65.4 224.0 182.9 81.6 153.6 119.9 78.0 535.2 428.7 80.1 795.7 600.7 75.52005 309.3 207.7 67.2 225.9 186.6 82.6 168.6 134.4 79.7 562.6 456.4 81.1 830.8 639.3 76.9
Nov-06 26.5 16.8 63.4 17.0 13.3 78.2 15.2 12.2 80.0 47.2 37.6 79.6 70.2 52.3 74.5 Ann. change 5.0% 6.0% 0.6 3.6% 0.3% -2.6 4.4% 6.7% 1.7 4.8% 4.9% 0.0 5.5% 5.6% 0.1
Jan-Nov 06 303.8 210.0 69.1 212.7 174.0 81.8 167.4 135.5 80.9 539.0 439.2 81.5 802.4 623.2 77.7Ann. Change 3.3% 5.7% 1.6 1.9% 0.6% -1.1 8.9% 10.3% 1.0 4.6% 4.8% 0.2 4.8% 5.4% 0.5Source: AEA
EUROPEAN SCHEDULED TRAFFIC
Date Buyer Order Delivery Other information/engines
Boeing 22 Jan GECAS 15 x 777, 24 x 737 2008-10 “unidentified” order in 200608 Jan SALE 20 x 737-800 2009-11 exercised options02 Jan Jet Airways 10 x 787-800 201129 Dec Korean Air 10 x 777-300ER, 5 x 747-800F plus 8 mixed options
5 x 777F, 5 x 737NG21 Dec KLM 3 x 737-800 2008 exercised options
1 x 777-300ER17 Dec Kenya A/W 3 x 787-80017 Dec Qatar A/W 2 x 777F12 Dec Guggenheim 3 x 777F 2009 plus 1 option
Airbus 09 Feb Air One 10 x A32018 Jan Guggenheim Av. 6 x A330-200F 201008 Jan Air Asia 50 x A320 plus 50 options08 Jan SALE 20 x A320 plus 10 options04 Jan Pegasus Av. Co. 2 x A350XWB, 6 x A330-20028 Dec Grupo Marsans 12 x A330-200 plus 10 options21 Dec Qantas 8 x A38020 Dec SIA 9 x A380 plus 6 options20 Dec SilkAir 11 x A320 plus 9 options15 Dec AerCap 20 x A330-20007 Dec Lufthansa 7 x A340-600 2008 onwards
Embraer 18 Dec Air Caraibes 1 x E190 4Q 2007 plus 1 option05 Dec Sirte Oil Co. 1 x E170 03/2007
Bombardier 27 Nov Brit Air 3 x CRJ700
JET ORDERS
Note: Only firm orders from identifiable airlines/lessors are included. Source: Manufacturers

The Principals and Associates of Aviation Economics apply a problem-solving, creative and pragmatic approach to commercial aviation projects.
Our expertise is in strategic and financial consulting in Europe, the Americas, Asia, Africa and the Middle East, covering:
• Start-up business plans • Turnaround strategies • State aid applications
• Antitrust investigations • Merger/takeover proposals • Competitor analyses
• Credit analysis • Corporate strategy reviews • Market forecasts
• Privatisation projects • IPO prospectuses • Cash flow forecasts
• Asset valuations • E&M processes • Distribution policy
For further information please contact:Tim Coombs or Keith McMullan
Aviation EconomicsJames House, 1st Floor, 22/24 Corsham Street, London N1 6DR
Tel: + 44 (0)20 7490 5215 Fax: +44 (0)20 7490 5218e-mail:[email protected]
PLEASE RETURN THIS FORM TO:Aviation Economics
James House, 1st Floor22/24 Corsham Street
London N1 6DRFax: +44 (0)20 7490 5218
Delivery addressName
Position
Company
Address
Country Postcode
Tel Fax
I enclose a Sterling, Euro or US Dollarcheque, made payable to:Aviation Economics
Please invoice me
Please charge my AMEX/Mastercard/Visacredit card the sum of £390Card numberName on card Expiry date
I am sending a direct bank transfer of£390 net of all charges to AviationEconomics’ account: HSBC BankSort code: 40 04 37 Account no: 91256904
Aviation Economics
Please enter my Aviation Strategysubscription for:1 year (10 issues-Jan/Feb, Jul/Augcombined) @ £390 / €625 / US$650,
starting with the issue
DATA PROTECTION ACTThe information you provide will be held on our database and may beused to keep you informed of our products and services or for selectedthird party mailings
Invoice address (if different from delivery address)
Name
Position
Company
Address
Country Postcode
SUBSCRIPTION FORM