Aviation Strategy · A3XX. This year Airbus had announced 22 firm orders (provided it proceeded...
24
Aviation Economics James House, LG, 22/24 Corsham Street London N1 6DR Tel: +44 (0) 20 7490 5215 Fax: +44 (0) 20 7490 5218 e-mail: [email protected] Issue No: 36 October 2000 Aviation Strategy Impasse for Euro-mergers T he KLM/BA deal did not go through, which is very unfortunate for KLM whose share price subsequently collapsed. But it was the outcome we pointed to in the conclusion to our recent KLM Briefing (July 2000). It is clear that BA for the moment is not willing to contemplate giving up Bermuda 2 for an open skies agreement with the US. And this attitude in effect precludes any merger between BA and a European carrier that oper- ates intercontinental services. The US authorities will not agree to any merged airline that tries to operate one part of its services under a liberal agreement and other bits under a restricted agreement. For BA the ending of the talks with KLM probably has come as a relief. It can now concentrate on tackling its core problem - the deep unprofitabil- ity of its intra-European services. Under Rod Eddington, one can expect BA to adopt a very pragmatic approach, eschewing grand strategies. This means culling intrinsically loss-making routes, rationalising the unwieldy franchise network and deciding what to do with go. BA has created a lower- cost carrier that is competing with its parent and cannibalising traffic; the only solution now might be to sell it off and realise a capital gain. KLM has yet again failed to consummate a merger, and now it looks as if it has run out of possibilities. KLM's extensive hub operation is vital to feed its joint transatlantic ser- vices with Northwest, but the low yields that this system produces are not commensurate with its cost structure. The only way that KLM can see to get its unit costs down through economies of scale as the result of a merg- er or a virtual merger. There is one airline in Europe with a large passenger base which is also desperately looking for a partner. Unfortunately that airline is Alitalia, cal- lously discarded by KLM a few months ago. Recent financial results at Alitalia (a net loss of $180m in the first half of 2000) tend to confirm KLM's decision, but just possibly the Dutch are having a few regrets about that abrupt move. Is then resurgent Air France is possible purchaser? The problem is that Schiphol and CDG are just too close. Even if the two carriers managed to obtain regulatory approval for a merger, the sheer strength of CDG would undermine the Schiphol operation. To draw a parallel, Austrian has devalued its main asset - the Vienna hub - by entering the Lufthansa-dominated Star alliance, which has more powerful gateways to eastern Europe at Munich and Frankfurt. Air France's attention in Europe seems to be focused on building links with the large Mediterranean carriers - Iberia, whose IPO is still officially slated for later this year, and Alitalia, whose dispute with the EC over Malpensa looks as if it may be coming to a resolution. SAir is not a likely candidate for investing in Alitalia. Apart from regula- tory issues (it already has control of the Italian charter sector), SAir has more than enough problems with its current Qualiflyer partners (see pages 10-13) without buying some more from Alitalia. Analysis Repercussions of BA/KLM failure 1 Reasons to be bullish about Boeing 2-3 Fuel - what sort of crisis? 4-5 Olympic - what possibly can be done? 5-7 Ground-handling - new dynamics 8-9 Briefings SAir Group - how many turn-arounds can it cope with? 10-13 Northwest - Asian rebound behind profit recovery 14-18 Online Internet version of newsletter 19 Macro-trends 20-21 Micro-trends 22-23 CONTENTS PUBLISHER www.aviationeconomics.com
-
Upload
nguyencong -
Category
Documents
-
view
216 -
download
0
Transcript of Aviation Strategy · A3XX. This year Airbus had announced 22 firm orders (provided it proceeded...

Aviation EconomicsJames House, LG,
22/24 Corsham StreetLondon N1 6DR
Tel: +44 (0) 20 7490 5215Fax: +44 (0) 20 7490 5218e-mail: [email protected]
Issue No: 36 October 2000
Aviation Strategy
Impasse for Euro-mergersThe KLM/BA deal did not go through, which is very unfortunate for KLM
whose share price subsequently collapsed. But it was the outcome wepointed to in the conclusion to our recent KLM Briefing (July 2000).
It is clear that BA for the moment is not willing to contemplate giving upBermuda 2 for an open skies agreement with the US. And this attitude ineffect precludes any merger between BA and a European carrier that oper-ates intercontinental services. The US authorities will not agree to anymerged airline that tries to operate one part of its services under a liberalagreement and other bits under a restricted agreement.
For BA the ending of the talks with KLM probably has come as a relief.It can now concentrate on tackling its core problem - the deep unprofitabil-ity of its intra-European services. Under Rod Eddington, one can expect BAto adopt a very pragmatic approach, eschewing grand strategies. Thismeans culling intrinsically loss-making routes, rationalising the unwieldyfranchise network and deciding what to do with go. BA has created a lower-cost carrier that is competing with its parent and cannibalising traffic; theonly solution now might be to sell it off and realise a capital gain.
KLM has yet again failed to consummate a merger, and now it looks asif it has run out of possibilities.
KLM's extensive hub operation is vital to feed its joint transatlantic ser-vices with Northwest, but the low yields that this system produces are notcommensurate with its cost structure. The only way that KLM can see toget its unit costs down through economies of scale as the result of a merg-er or a virtual merger.
There is one airline in Europe with a large passenger base which is alsodesperately looking for a partner. Unfortunately that airline is Alitalia, cal-lously discarded by KLM a few months ago. Recent financial results atAlitalia (a net loss of $180m in the first half of 2000) tend to confirm KLM'sdecision, but just possibly the Dutch are having a few regrets about thatabrupt move.
Is then resurgent Air France is possible purchaser? The problem is thatSchiphol and CDG are just too close. Even if the two carriers managed toobtain regulatory approval for a merger, the sheer strength of CDG wouldundermine the Schiphol operation.
To draw a parallel, Austrian has devalued its main asset - the Viennahub - by entering the Lufthansa-dominated Star alliance, which has morepowerful gateways to eastern Europe at Munich and Frankfurt.
Air France's attention in Europe seems to be focused on building linkswith the large Mediterranean carriers - Iberia, whose IPO is still officiallyslated for later this year, and Alitalia, whose dispute with the EC overMalpensa looks as if it may be coming to a resolution.
SAir is not a likely candidate for investing in Alitalia. Apart from regula-tory issues (it already has control of the Italian charter sector), SAir hasmore than enough problems with its current Qualiflyer partners (see pages10-13) without buying some more from Alitalia.
Analysis
Repercussions ofBA/KLM failure 1
Reasons to be bullish about Boeing 2-3
Fuel - what sort of crisis? 4-5
Olympic - what possibly canbe done? 5-7
Ground-handling -new dynamics 8-9
Briefings
SAir Group - how manyturn-arounds can itcope with? 10-13
Northwest - Asian reboundbehind profit recovery 14-18
Online
Internet versionof newsletter 19
Macro-trends 20-21
Micro-trends 22-23
CONTENTS
PUBLISHER
www.aviationeconomics.com

Aviation StrategyAnalysis
Not all that long ago Boeing chairman PhilCondit was warning his senior man-
agers that with the share price languishing inthe low 30s, the company was a takeovertarget. Its net asset value was lower than itsmarket capitalisation. No longer. Boeing'sstock is up around $60, higher than its previ-ous peak just before completion of the merg-er with McDonnell Douglas.
The merger seems to have gone quitewell, with Boeing's management able to dis-cern new opportunities from the combina-tion. The bringing together of the defenceaerospace business of McDonnell Douglas,coupled with the space business of NorthAmerican Rockwell plus the arrival ofHughes satellite business produces a groupthat can offer a wide range of products andservices. The whole may be greater than thesum of the parts.
But this is not really what is driving thestock up in the short term. Boeing's factoriesare full and order intake is healthy. Boeinghas managed to avoid the problems thatafflicted it in 1998 when production linesbecame overloaded. The company eventu-ally had to pay out nearly $3bn in extra pay-ments to cover delays and expensive re-working of aircraft finished without someparts which the supply chain could not pro-vide. Everything is much calmer this time,even though production rates on all mainmodels are being ramped up.
747 production is going up to 2.5 aircrafta month, after long periods when it wasbarely one. Boeing has received nine ordersso far this year and hopes for another 20before the end of the year. Production of the777 is going up from four to five a month, asa result of 36 orders so far this year. Boeingis raising the production rate of 737s to 28 amonth from 24 - almost as fast as Airbus isconstructing A320s.
Overall, by mid-September Boeing hadlanded 386 firms orders so far this year com-pared with 262 for Airbus. Thus, the order
intake was looking more favourable than itwas last year when Airbus claimed some55% of the market.
The big cloud on the horizon remains theA3XX. This year Airbus had announced 22firm orders (provided it proceeded with anindustrial launch of the aircraft, by earlySeptember). The big prize being sought byAirbus, however, was Singapore Airlines.
SIA triumph for Airbusand the Seattle spin
SIA (plus Virgin Atlantic) first expressedinterest in acquiring A3XXs back in March,then both airlines went rather quiet. Behindthe scenes Boeing waged a mighty cam-paign to keep SIA with the 747 by offeringcut-price deals on the re-vamped 747X tostave off an Airbus order.
Then SIA on September 29 announced anorder for up to 25 A3XXs, without also order-ing some 747Xs, as widely expected. This willensure that the A3XX is launched with ahealthier order book than any other big airlin-er in recent history, according to John Leahy,marketing director of Airbus.
EADS, which depends on Airbus for halfits sales and profits, will receive a majorboost. But it is not necessarily terrible newsfor Boeing in the short term, and shouldhave minimal impact on Boeing's shareprice.
Seattle will spin the announcement bysaying that it was not prepared to sell 747Xsat a loss just to block the arrival of the A3XX.For intercontinental airlines this is a dreamscenario: they have the new A3XX whichcould be an exciting business-grower forearly customers; meanwhile they have a re-vamped, improved 747X (which is bound tobe launched before long) available at lesscost. They now have the means to preventeither Boeing and Airbus from exploiting amonopoly position.
Beyond such issues, Boeing has other
October 2000
AviationStrategy
is published 12times a year by
AviationEconomicson the first of each month
Editor:Keith McMullan
Associate Editor:Heini Nuutinen
Subscriptionenquiries:
Keith McMullanTel: +44 (0) 20
7490 5215
Copyright:Aviation
EconomicsAll rights reserved
AviationEconomics
Registered No:2967706 (England)
Registered Office:James House, LG22/24 Corsham StLondon N1 6DR
VAT No: 701780947
ISSN 1463-9254
The opinions expressed inthis publication do not nec-essarily reflect the opinionsof the editors, publisher orcontributors. Every effort is
made to ensure that theinformation contained in thispublication is accurate, but
no legal reponsibility isaccepted for any errors or
omissions.
The contents of this publica-tion, either in whole or inpart, may not be copied,
stored or reproduced in anyformat, printed or electronic,without the written consent
of the publisher.
Reasons to be bullish about Boeing

reasons to be bullish. Not only is the civil air-craft market proving more resilient than hadbeen foreseen, but also the industry is set-tling into a more stable pricing pattern (A3XXand 747X aside) that might be expected of aduopoly.
Also, the US defence aerospace marketis showing signs of recovering - appropria-tions are set to rise for the first time in eightyears. Boeing will probably win most of themega-contracts for the joint strike aircraft,even if the Pentagon has dropped its for-mer "winner-take-all" deal, in favour of ashare-out of work from the lead contractorto the runner-up. So the expectation is thatBoeing will walk away with the big deal, butpass on much of the work of LockheedMartin, as well as to its consortium partnersin the bid.
The move into servicesMoreover, Boeing is hoping to grow its
earnings by movingsteadily into the aviationservices business,where it thinks its post-merger strengths areinvincible. The strategyis to take the knowledgeof airliners and civil air-craft from the BoeingCommercial arm, marryit to the satellite exper-tise of Hughes satellitebusiness, and come upwith services such asConnexion by Boeing,which aims to deliver
satellite TV and widebandcommunication to airliners.EADS is moving into thesame market, but Boeing isconvinced that it is wellahead.
Beyond that, there is themore humble business ofservicing aircraft. Just asLufthansa sees itself increas-ingly as an aviation servicescompany which owns an air-line, Boeing sees itself as a
provider of aviation services as well as air-craft.
It is, for instance, quite comfortable com-peting with its customers in providing aircraftservicing and back-up. Phil Condit's view isthat the margins are too good to ignore andthat Boeing can provide a competitive prod-uct because it knows the market intimately(its aircraft comprise two thirds of the mar-ket).
Add to basic aircraft servicing and sup-port new products such as GPS satellite-based air traffic control and one gets a pic-ture of where the new service-orientedBoeing is headed. It is likely to join consortiabidding for air traffic control privatisations asthey occur in Europe, beginning with Britain.
As the battle with Airbus settles downinto a more stable, and duller phase (Airbuscan no longer be shot down) so Boeing ismoving on to a new way of generating prof-its growth to replace the top-end monopoly itknew it had to lose one day.
Aviation StrategyAnalysis
October 2000
20
30
40
50
60
70 BOEING SHARE PRICE$
1998 20001999
0
50
100
150
200
250
300
1999 2009 Est
$bnBOEING’S FORECAST OF DEMAND FOR
COMMERCIAL AIRCRAFT ANDSUPPORT SERVICES
New aircraft
Supportservices
Informationservices

Spot jet fuel prices passed the $1/gallonmark in September, the highest level
since the Gulf war and twice the level of ayear ago. What sort of crisis are airlines real-ly facing?
Unfortunately, there is little sign that theupward price trend will reverse this year.Even though crude prices will probably soft-en, as some OPEC countries increase out-put and the US release more of its strategicreserves, demand for all of the middle distil-lates - which comprise heating oil and dieselas well as jet kerosene - is strong and stocksare comparatively low.
This implies that jet fuel prices will stay atcurrent levels or edge up during the winter.
For the longer term, however, we main-tain our view that prices will not stay on ahigh plateau but will descend to, say, mid 99levels. This view is based simply on observ-ing how the oil market has evolved over thepast 30 years - prices have spiked whenOPEC has managed to cut or hold output inthe face of rising demand and when industri-alised countries have panicked about theirstock levels. But the peaks have alwaysbeen followed by long periods of pricedecline in actual and real terms.
One of the major differences between
this oil price surge and that of the early 90sis that today almost all the leadingeconomies are vibrant whereas then therewas a severe recession, which resulted in aslump in air traffic. With continuing strongtraffic demand, airlines have been able to layoff most of the fuel impact onto passengers,though that has not stopped their vociferouscomplaints about their added costs. Forexample, in the US domestic market unitrevenues (per ASM) increased by 7.9% onan annual basis, continuing a pricing trendthat has been evident for most of 2000.
Hedging activity has also increased.Again using the US market as an example,Majors such as American, Delta, Southwestand United have 50-100% of their require-ment for the rest of the year hedged at theequivalent of less than $30/barrel of crude(currently $38). It should be noted, however,that reports of airline fuel hedging tend tosuggest that the cost saving will be greaterthan it actually turns out to be because theydisregard the expense associated with anyhedging operation. Lufthansa, for example,hedged 90%of this year's fuel requirementbut its first-half fuel costs still rose by 65%.
It is interesting to look at the jet fuel mar-ket from the perspective of the oil compa-
Aviation StrategyAnalysis
October 2000
Total Narrow Wide Total Narrow Wide Total Narrow WideSwissair 4.2 3.7 4.9 Southwest 8.5 8.5 na SIA 5.4 na 5.4EasyJet 4.9 4.9 na Continental 9.0 7.9 16.7 Cathay 5.9 na 5.9Lufthansa 8.1 8.1 8.1 AmWest 10.2 10.2 na MAS 6.1 6.8 5.5BA 8.8 10.5 7.1 United 10.4 10.9 9.0 Thai 6.5 6.0 6.5Air France 9.1 8.4 10.1 Air Canada 10.5 10.6 10.1 PAL 6.9 7.5 6.6KLM 9.2 9.0 9.4 American 11.3 11.7 9.9 China AL 7.6 1.6 9.1Alitalia 9.9 9.0 14.1 TWA 11.6 11.6 11.5 ANA 8.3 5.8 9.0SAS 10.4 10.5 10.0 Delta 12.5 13.0 11.2 Garuda 9.3 4.3 13.9Ryanair 13.1 13.1 na US Airways 13.4 13.7 7.8 Qantas 10.1 10.1 10.1Iberia 13.2 13.2 13.4 Northwest 20.0 20.0 20.1 JAL 11.7 3.0 12.0Total 9.4 9.7 8.9 Total 12.1 12.2 11.8 Total 8.1 7.3 8.6
AVERAGE FLEET AGES
Source: ACAS Note: Average ages as at August 2000
Fuel: crisis, what crisis?

nies. Consolidation in that industry has led tosix suppliers (Exxon-Mobil, Shell, BP-Amoco-Arco, Chevron, Total-Fina-Elf andTexaco) controlling just over 60% of globaljet fuel supply, with the first three conglom-erates having 42%. However, oil marketanalysts believe that whatever additionalselling power this consolidation has generat-ed has been negated by increased purchas-ing strength on the part of the main airlines.
They observe that at the spring round oftender negotiation airlines pooled their pur-chases using alliance structures, and alsointroduced electronic B2B buying techniquesfor the first time. The new battle tactics inthe commercial war between airlinealliances and the oil giants will be furtherhoned at the upcoming autumn tenderingnegotiations.
The oil crisis of course does not affect allairlines equally. Indeed, in a strong pricingenvironment it the more fuel-efficient carriersshould be able to exploit this advantage. Asthe table above shows, there is a wide vari-ation in the fuel efficiency between thenewer and older jets.
Below is a summary of the average fleetage of the ten key airlines in each main avi-ation region. Some observations:• Despite retrenchment during the financialcrisis, the oldest of the Asian airline fleets
are still below the North American average;• In Europe Swissair should be very wellpositioned with its ultra-modern fleet, but stillit blames fuel for its current problems (seepages 14-17);• Ryanair, whose fleet still comprises mostlyelderly 737-200s should have been in trou-ble as a result of fuel price escalation buthas apparently hedged all its fuel purchases;• Southwest, as normal, heads the US rank-ing while Northwest (see pages 18-22) isvery exposed.
Aviation StrategyAnalysis
October 2000
Olympic: what can possibly be done?Credit Suisse First Boston is the latest
investment bank to be charged withfinding a trade investor for OlympicsAirways, and in theory it has to start up theroad-shows within the next month or so.How can one go about selling an airlinewhich is not only consistently unprofitablebut also apparently totally resistant toreform?
Last year Olympic was reported to havemade a net loss of Dr19bn ($50m) on rev-enues of Dr345bn ($910m), though there isalways considerable doubt about the validityof Olympic's financial numbers. In any casethe airline is performing extremely poorly
and its short recovery after being recapi-talised in 1994/95 is now seen as just anoth-er false dawn. That recapitalisation involvedstate aid of Dr544bn (nearly $2bn at thetime). So outside observers might be won-dering where all this money went.
In fact, Dr 491m ($1.65bn) was allocatedto write off debt to Greek state-owned banksand corporations (like the oil refining compa-ny and the CAA). Olympic didn't receivedirect funding from the state but was allowedto run up overdrafts and unpaid bills, thenthe Greek government applied penalty inter-est rates to these amounts - the equivalentof 3% per month or well over 50% per year.
Narrowbodies Widebodies737-800 100 767-300 100A320 103 777-200 100737-400 105 A340 101MD-90 106 767-200 107757-200 106 747-400 118737-700 107 DC-10 124737-300 117 MD-11 125MD-80 126 747-200 126A319 127737-500 128737-200 137DC-9 142727 163
INDEX OF FUEL CONSUMPTIONPER BLOCK HOUR PER SEAT
Note: Based on US airlines’average fuel consumption perblock hour and average seatingin 1999Source: ESG/US DoT

Even if the airline managed to break even.its debt continued to grow exponentially.
The other Dr53bn ($175m) was newequity to be paid in three tranches if the car-rier met its turn-around plan targets.Permission for the third tranche has beenrefused by the EC following an implausibleplan and forecast submitted by Olympic dur-ing BA Speedwing's brief and ineffectualperiod in control.
Consequently, the airline risks runningout of cash in the winter (traffic to/fromGreece is highly seasonal). Already state-owned suppliers are being asked for extend-ed credit. In Athens, there is little hope of anairline solution, following BA's refusal to take20% in the carrier, but there is a vagueexpectation that one of the many successfulGreek entrepreneurs, who understand thecomplex politics of Olympic, will step for-ward.
Leading contenders include: shipownerSpyros Latsis; Thomas Liakounakos, ownerof the most successful of the new Greekindependent airlines, Axon; PericlesPanagopoulos, president and major share-holder of quoted ferry holding company,Attica Enterprises; and industrialist,Constantinos Aggelopoulos, who has familyinterests in the organisation of the 2004Athens Olympic Games.
The fundamental problem with Olympic isnot airline economics but Greco-Balkan pol-itics. Ever since Aristotle Onassis sold hisairline to the Greek state in 1974, Olympic
has been at the mercy of politicians; it hashad to fulfill many roles but none of themhave had a commercial aim.
The average tenure of chief executivesover the past 25 years has been less than 12months, and the reasons for their departure orindeed appointment are usually obscure.Similarly, the Shareholders Board (the onlyshareholder is the Ministry of Finance) con-stantly changes its membership, and it hasproven incapable of attracting and retainingsuccessful businessmen to this vital role.
Managers, some of whom well qualifiedand talented, are generally unwilling to makeany decision on their own, realising that theywill receive no credit if things go right and willbe scapegoated if things go wrong. On theother hand, senior managers who fall out offavour are rarely sacked, but are "fridged",allocated to a non-existent jobs on full pay.
The unions, particularly the pilots' union,represent the permanent force in theOlympic power structure, in effect controllingmany of the airline's functions. At the samethey will resort to strike action whenevertheir position is threatened. They have alsotraditionally represented a voter power basefor PASOK, the Pan-Hellenic SocialistMovement, the party currently in power(though it must be added that PASOK is nowa very different animal from anti-capitalism,anti-EU, pro-cronyism party of the 80s andearly 90s - it has made effective moves tomodernise the Greek economy).
Changing the Olympic ethos is basicallya matter of political will plus charisma on thepart of one of the potential Greek entrepre-neurs who might bravely take up the chal-lenge. After all, Onassis is still a hero atOlympic. It is not something that can be suc-cessfully tackled by investment banks or air-line consultants.
A reconstructed Olympic 2000But, abstracting for a moment from the pol-
itics, what could Olympic - or a new Athens-based airline called, for example, Olympic2000 - offer an investor? What we are lookingat here is not selling Olympic as an ongoingentity, but the potential for reconstructingOlympic 2000 from elements of the old carrier.
Spata, the brand-new airport outside
Aviation StrategyAnalysis
October 2000
727-200 4737-200 11 Chapter 2737-300 1737-400 13737-700 11 On order via GECAS;
status uncertain737-800 8747-200 1A300-600 3A340-300 4Total 37 19
OLYMPIC’S FLEET PLANS
Note: Olympic Aviation operates two 717-200s plus 17turboprops

Athens is the most obvious asset. With tworunways and capacity for 16m passengers ayear the airport, which has been constructedby the German company Hochtief (whichowns about 45%, the other 55% is owned bythe government), will open on schedule inMarch 2001 (sadly the same cannot be saidfor the road links between Spata andAthens). Olympic will be the incumbent at abrand new, totally uncongested airport withthe potential for hub operations.
Ground handling has been Olympic'smost profitable activity, but its monopoly isnow being broken with a new handling con-sortium, Goldair, competing strongly atAthens. Selling off this asset or entering in ajoint venture with one of the independenthandlers would appear logical. The sameapplies to the airline's relatively successfulcatering subsidiary.
Olympic's domestic monopoly in a mar-ket of about 2m passengers a year was offi-cially ended by the EC in 1997. With thegrowth of the new entrants such as Aegean,Cronus and Axon, its overall market sharehas been significantly eroded. Still, Olympicretains a dominant position on key trunkroutes like Athens-Salonika. Consolidatingthese routes while entering into code-shar-ing/franchising agreements with the inde-pendents would seem to be a way forward.
The European network needs a completerevamp including culling intrinsically unprof-itable routes and rationalising the distributionsystem which is still based on high-commis-sion ethnic travel agents and very expensiveairline shops. A major loss making area isGermany, partly because flights from Athensare scheduled through the northern city ofSalonika, diluting yields and adding costs.Salonika could be developed as a hub in itsown right preferably using Olympic's low-cost subsidiary Macedonian Airlines.
Olympic fails miserably to capture thesmall business component in the internation-al market which is leisure and VFR dominat-ed. Yet in terms of hard spec the businesscabin on A300-600 flights to London,Frankfurt and Paris is the best intra-European product of all. Improve the softspec and try to come to a deal on FFP mileswith non-competing airlines, and Olympicjust might find a profitable niche.
In terms of developing a proper hub oper-ation, there is genuine potential in connect-ing the Eastern Mediterranean (Lebanon,Syria, Israel and Egypt) with WesternEurope and beyond. The problem is theexcessively low yields of this sixth freedomtraffic, which might be mitigated by enteringinto joint ventures with the national carriersof these countries (and with SAA on theJohannesburg route).
The long-haul dilemmaThe long-hauls to Australia and the USA
are by far Olympic's biggest financialheadache, producing losses that dwarfthose of the rest of the network.Characterised by high seasonality, highcosts in terms of flight crew and distribution(some of the commissions Olympic incursare extraordinary), and low yields becauseof the VFR and leisure nature of the traffic,these routes are not financially viable underthe current Olympic set-up. The change fromelderly 747-200s to A340s hasn't mademuch difference to the economics becausethe potential operational cost savings arebalanced by much higher capital costs andlower revenues per flight.
Yet to suggest closing or selling the long-haul operation causes political apoplexy as aGreek link to the diaspora is regarded asessential. A radical solution for Olympicwould be for this operation to be sold off at aminimal price to the long-haul pilots whowould then have the challenge of runningthese routes on a commercial basis.
It must be said that union enthusiasm forany form of equity participation in Olympichas so far been non-existent. But it isrumoured that the long-haul pilots have verynicely over-funded pension schemes, whichwere originally set up by Onassis, and theseschemes would pay out considerable lumpsums if Olympic were to be wound up, soproviding a potential source of operatingcapital for a new venture.
So there could be a future for a restruc-tured Olympic 2000 but it means dismantlingthe old Olympic first, which means coura-geous political decision-taking. The alterna-tive - the first official bankruptcy of aEuropean flag-carrier.
Aviation StrategyAnalysis
October 2000

The ground handling business in Europeis changing rapidly, changes triggered by
the 1996 EC Directive aimed at liberalisingground handling opportunities at EU air-ports. What has resulted is a rapid interna-tional growth of ground handling brandssuch as Swissport and Globeground, plusindependent Servisair. A spate of corporateactivity was capped in July by the purchaseof Ogden Aviation by the Menzies AviationGroup (MAG) transforming this relativelyminor player into a global operator.
The EC Directive imposed a progres-sive opening up of the ground handlingmarket. Since January 1999 airports witha throughput of over 3m passengers ayears of 75,000 tonnes of freight have hadto permit third-party handling. However,the Directive did allow airports to apply fortwo-year extensions, before the legislationwas fully applied, with the result that someimportant airports, such as FrankfurtAirport, which was the classic target of thelegislation in the first place, have beenable to delay opening up their markets.From January 2001, the Directive willapply to any airport located in the EU withpassenger volumes of over 2m or freightvolumes of over 50,000 tonnes.
In the good old days, the ground handlingbusiness was very simple: the flag-carriersprovided handling services to foreign coun-terparts almost as a favour, in order that thatresources would not have to be reproducedand duplicated.
Over time, the handling function devel-oped as a business opportunity for theincumbent airlines and a source of monopolyprofits for some, notably Olympic, Iberia andAer Lingus. This situation led to some vocif-erous complaints to the EC and eventually tothe Ground Handling Directive.
The explicit aim of the Directive was toincrease the number of competing groundhandlers. In fact, the evolution of the marketis being characterised by a drive for market
share and global reach on the part of theground handlers. Size or rather network isall-important. What is at stake is a largeinternational business based on a whole raftof support services to airlines from executivelounge provision to aircraft cleaning, pas-senger services to ramp services.
The independent sector has struggled toachieve this global status simply becausethese specialist companies do not have thetype of a ready-made international networkthat a major international airline possesses.Two of the key leading groups - Swissportand Globeground - are airline-owned sub-sidiaries.
Value of ground handling According to Swissport, the ground han-
dling arm of the SAir Group, the value(meaning annual revenues) of the groundhandling market geographically is: NorthAmerica, $7.5bn; Europe, $6.4bn; Africa,$1.2bn; and Latin America, $1bn.
Globeground, the Lufthansa subsidiary,has analysed the world market by competi-tive characteristics. It estimates that groundhandling monopolies account for 30% of themarket (mainly in Europe) while the fully lib-eralised ground handling markets, as atHeathrow or Amsterdam, account for 15%.In between is the 55% of the market thatoffers some degree of freedom for self- andthird-party handling.
This is what interests the major interna-tional ground handlers as it representspotential the future business, if only theycan convince major airlines to out-sourcetheir base and hub operations to indepen-dent experts.
Interestingly, ground handling operatorshave been highly localised despite the factthat the aviation business increasinglydemands global solutions from most servicesuppliers. Until very recently there were onlya handful of European ground handlers with
Aviation StrategyAnalysis
October 2000
By Nick [email protected]
European ground handling:new competitive dynamics

operations in more than two countries.
The alliance factor at SchipholIndependent ground handlers now have
to contend with the genuine threat ofalliance-based standardised purchasing atmajor European hubs
Recent developments at AmsterdamSchiphol give an indication of how alliancesmay shape the future ground handling mar-ket. SAir's Qualiflyer Group tendered as analliance for their handling needs at the air-port, and the winner of this contract, for 125flights a week, was a joint-venture betweenSwissport and Cargo Services Centre, theDutch specialist air cargo handler. This wasa marriage of convenience utilising thestrength of CSC, which accounts for 25% ofthe cargo handling market at Schiphol andhas 75 bases worldwide, and Swissport, theglobal alliance partner for the Qualiflyergroup. Both parties have now signed a mar-keting agreement to further develop theirbusiness relationship on projects worldwide.
Another major tender, covering 210flights per week, was for the oneworld air-lines (BA, Iberia, Cathay Pacific andFinnair). This contract was won byAviapartners, the Belgium-based indepen-dent ground handler. It is interesting to notethat oneworld does not have a majorEuropean ground-handling partner, since BAwithdrew from third party handling work atHeathrow in 1997.
The unanswered question is which han-dler will win the Star Alliance business (over100 Lufthansa and SAS flights a week)?The two main handlers without a majoralliance contract are Ogden Aviation andAero Groundservices.
As Aero Groundservices was bought byGlobeground in July, it should be thefavourite. However, the situation is compli-cated by the fact that Ogden has now beenpurchased by Menzies, and in the UK,Menzies and Globeground operate as aground handling joint-venture and havemerged their cargo businesses to formMenzies World Cargo.
Aviation StrategyAnalysis
October 2000
GROUND HANDLER PROFILES
Swissport (SAirServices) is a prime example of the new brand-ledground-handlers with a focus on 'quality systems' and global presence. • Wholly owned subsidiary of SAir Group• Operates in 115 airports in 20 countries with 15,000 employees• Major recent purchases - Dynair of the USA • Overall market position - can now offer meaningful network benefitsto airlines worldwide, specifically those that Swissair has invested in • Major strength - good financial results and financial independencemeans that Swissport can act independently and buy market share• Major weakness - dependent on financial strength or otherwise ofparent, SAir - investors may demand sale of subsidiaries likeSwissport and Gategourmet etc.
Globeground has developed a strong brand in the ground handlingmarket since its formation more than 10 years ago.• Wholly owned subsidiary of Lufthansa Commercial Holdings with 46subsidiaries globally employing 17,000 in 23 countries at 85 airports• Major recent purchase - US-based Hudson General • Overall financial position is less clear than Swissport as the operationis still dependent on the relationship with the airline and is lessaccountable for its actions• Major strength - clear focus on quality management systems. • Major weakness - perceived over-reliance on the Lufthansa relation-ship
Menzies Aviation Group The purchase of US-based Ogden GroundServices by Menzies Aviation Group (MAG) for $118m is the most sig-nificant recent development in the battle for ground handling domi-nance.• Combined group with operations at 57 airports in 20 countries andinvolves air cargo, passenger and ramp handling. • Owned by the John Menzies Group (major UK PLC companyfocussed on distribution with £1.3bn turnover)• Overall market position - Menzies name is associated with air cargoand distribution services and there would appear to be an interestingopportunity for Menzies to become a 'virtual' integrator, using the belly-hold cargo capacity of the scheduled airlines· Its partnership in the UKwith Globeground is supposed to evolve further • Major strength - unrivalled focus on UK air cargo operations • Major weakness - little awareness of MAG in the wider ground han-dling world
Servisair Plc UK-based specialist ground handler, which was recentlyacquired by the French Group Penauille. • Operations in 99 airports and 11 countries with 10,000 employees• Major recent purchase - US-based Global Group• Market position - Servisair has spread its net intelligently in Europeand the US but has not reaped the reward it expected from the liberali-sation of European ground handling• Major strength - the UK coverage of Servisair means that they canoffer a complete UK handling solution to any airline• Major weakness - Servisair have a difficult situation to handle asMAG develops its UK business

There has been a subtle change in theSAir Group strategy following the
announcement of disappointing first-halfresults. Previously SAir proclaimed that itwanted to be a "market orientated, networkminded and quality driven" company. Now ithas announced a simpler and clearerapproach.
There are two basic elements to the strat-egy. One, consolidate the Qualiflyer Groupand deepen the intercontinental alliances.Two, grow organically the airline-relatedbusinesses. This would suggest that thebuying sprees are over - no more minorityand stakes or purchases of ground-handlingor catering businesses to fit into the threenon-airline divisions.
The SAir Group is split into four compa-nies:• SAirLines, comprising Swissair and associ-ates;• SAirServices which holds the Group's inter-ests in aircraft maintenance, ground han-dling and information technology;• SAirLogistics, covering freight forwardingand cargo; and • SairRelations, encompassing in-flightcatering and sales.
The broad thinking behind the structure isthat SAir is not just an airline. It is a traveland transportation company within which
benefits can be generated through "globalnetworks" and "team spirit" plus carefulbrand management.
In practice, SAir has concentrated oncross-selling its different services, and hasused its alliance strategy to open up newmarkets. As well as the standard networkbenefits that can be achieved through code-sharing, joint frequent flier programmes etc.,an airline entering an alliance with Swissairis also expected to buy into other SAir Groupactivities such as ground handling (throughSwissport), catering (through Gategourmet)and duty-free (through Nuance).
SAir has up until now it has taken an equi-ty-based approach to its Qualiflyer alliance. Itmay be that SAir has had no other choicegiven that the Swissair itself is ranked a longway behind Europe's big three (Lufthansa, AirFrance and BA) in terms of scale. So insteadSAir has used its balance sheet to "buy" itspartners, often outbidding the "big three" inthe process (see Aviation Strategy,September 1999). SAir's argument is thatbecause it can extract synergies across abroad spectrum of businesses it can afford topay a higher price for the equity.
Good in theory, but has it worked? TheSAir Group share price performance indi-cates the stockmarket's view on the strategy.
The headline operating profit figure forthe SAir Group for the first half of 2000 wasSFr 143 ($84m) but SAirLines alone man-aged to post an operating loss of SFr155m($92m) loss versus a SFr 84m profit in thefirst half of 1999. Of the SFr155 loss,Crossair contributed SFr 6m its first half yeardeficit since 1992, and Swissair and Balair afurther SFr 76m loss. Minority holdings inSabena, LOT, Volare, Air Littoral, AOM andSouth African Airways contributed furtherlosses to the tune of SFr 74m.
The first half results for 2000 also sawSAir taking a SFr 360m ($207m) charge tocover restructuring costs associated with itsFrench airline interests and a SFr 347m
Aviation StrategyBriefing
October 2000
SAir Group: how many turn-aroundscan it cope with?
250
300
350
400
450
500SAIR SHARE PRICESFr
1998 20001999

($200m charge) associated with the restruc-turing of LTU.
Because of ownership restrictions, SAirhas been limited to a minority stake in itspartner airlines, which greatly weakens itsmanagerial control. And even if full controlwere politically possible, SAir probably nolonger has the funds available to make fur-ther investments. As at the middle of theyear the Group's net debt totalled SFr4.53bn against SFr 3.93bn of equity, and thebalance sheet contains SFr1.8bn of intangi-ble assets related to goodwill in the compa-nies it has bought into.
The SAirLines part of the SAir Group isnow faced with pulling off a large number ofturn-around strategies at the same time.Whether Swissair has the managementresources to achieve this is in question; forinstance, Paul Reutlinger, who achievedsuccess at Sabena, has had to be switchedto dealing with the very challenging task ofintegrating SAir's three French associatesand Jeff Katz, the former chief executive,has defected to Orbitz, the e-distributionstart-up.
SAir now has so many codenames for itsvarious turn-around projects that it is difficultto keep track. The following summarises thecurrent situation.Swissair
Swissair itself if finding that its unit costare growing more quickly than its unit rev-enues - a trend which it blames largely onthe increase in fuel prices.
Project "Clean Slate" has set a costreduction target of SFr 225m by 2002, whichseems quite modest given the scale of theairline's recent losses. The AirlineManagement Partnership (AMP) withSabena includes integration of the salesforces worldwide, capturing network syner-gies from operating one network but with twohubs, and reducing distribution costs.Crossair
Having recorded its first first half-yearloss since 1992, the Swiss regional carrierhas been awarded an "improvement" pro-ject, code-named "Columbus". Improvementsof SFr 50m have already been identified pri-
marily through reduced growth, network opti-misation and cost savings.LOT
SAir outbid both BA and Lufthansa for a38% stake in LOT, but the airline is currentlyoperating in the red. First half 2000 losseswere the equivalent of $16m, though the car-rier expects to recover this in the secondhalf. SAir has set a target of $100m inimprovements over three years. Priorities forLOT are building the Warsaw hub, increas-ing revenues and home market share, andsystems redesign.Sabena
At present the Belgian Governmentretains a 50.5% stake in Sabena, theremainder being held by the SAir Group,which intends to increase its stake to 85%but can only do so after ratification of a treatybetween Switzerland and the EU.
It is not clear as to whether SAir's ambi-tions to take majority ownership of Sabenaremain intact. Fresh concerns overSabena's viability have arisen following theannouncement of its six-month results whichshowed a sixfold rise in net losses to €83.6m($75.6m) despite an 11% rise in passengernumbers. Sabena last made a profit in1998,and in 1999 recorded a net losses of€14.1m.
Sabena's new Chief Executive, ChristophMuller (ex-Lufthansa) in September warnedthat if Sabena was "not making significantprogress by the end of the winter" he wouldbe forced "to question the raison d'être of thecompany".
He went onto to say that if the company
Aviation StrategyBriefing
October 2000
SAIRGROUP CONSOLIDATED BALANCE SHEET(SFr m)
June 00 Dec 99 ChangeOperating net working capital -431 -360 -19.8%Intangible fixed assets 1,806 1,767 2.2%Tangible fixed assets 7,395 6,844 8.1%Operating investments 1,035 1,169 -11.5%Operating provisions -1,733 -1,059 63.6%Net invested capital 8,071 8,360 -3.5%Financial assets 1,564 1,379 13.4%Financial liabilities -958 -909 -5.4%Net debts -4,534 -4,268 -6.2%Minorities -190 -212 -10.4%Equity 3,953 4,181 -9.1%
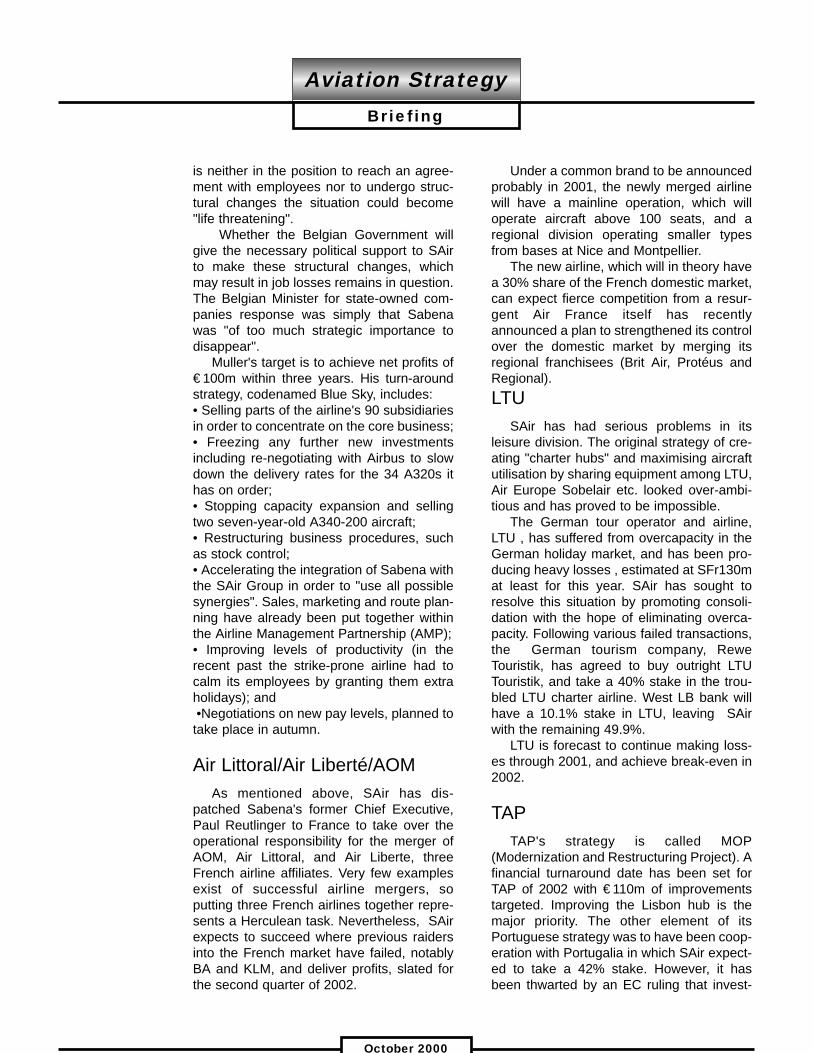
is neither in the position to reach an agree-ment with employees nor to undergo struc-tural changes the situation could become"life threatening".
Whether the Belgian Government willgive the necessary political support to SAirto make these structural changes, whichmay result in job losses remains in question.The Belgian Minister for state-owned com-panies response was simply that Sabenawas "of too much strategic importance todisappear".
Muller's target is to achieve net profits of€100m within three years. His turn-aroundstrategy, codenamed Blue Sky, includes:• Selling parts of the airline's 90 subsidiariesin order to concentrate on the core business;• Freezing any further new investmentsincluding re-negotiating with Airbus to slowdown the delivery rates for the 34 A320s ithas on order;• Stopping capacity expansion and sellingtwo seven-year-old A340-200 aircraft;• Restructuring business procedures, suchas stock control;• Accelerating the integration of Sabena withthe SAir Group in order to "use all possiblesynergies". Sales, marketing and route plan-ning have already been put together withinthe Airline Management Partnership (AMP); • Improving levels of productivity (in therecent past the strike-prone airline had tocalm its employees by granting them extraholidays); and•Negotiations on new pay levels, planned totake place in autumn.
Air Littoral/Air Liberté/AOMAs mentioned above, SAir has dis-
patched Sabena's former Chief Executive,Paul Reutlinger to France to take over theoperational responsibility for the merger ofAOM, Air Littoral, and Air Liberte, threeFrench airline affiliates. Very few examplesexist of successful airline mergers, soputting three French airlines together repre-sents a Herculean task. Nevertheless, SAirexpects to succeed where previous raidersinto the French market have failed, notablyBA and KLM, and deliver profits, slated forthe second quarter of 2002.
Under a common brand to be announcedprobably in 2001, the newly merged airlinewill have a mainline operation, which willoperate aircraft above 100 seats, and aregional division operating smaller typesfrom bases at Nice and Montpellier.
The new airline, which will in theory havea 30% share of the French domestic market,can expect fierce competition from a resur-gent Air France itself has recentlyannounced a plan to strengthened its controlover the domestic market by merging itsregional franchisees (Brit Air, Protéus andRegional). LTU
SAir has had serious problems in itsleisure division. The original strategy of cre-ating "charter hubs" and maximising aircraftutilisation by sharing equipment among LTU,Air Europe Sobelair etc. looked over-ambi-tious and has proved to be impossible.
The German tour operator and airline,LTU , has suffered from overcapacity in theGerman holiday market, and has been pro-ducing heavy losses , estimated at SFr130mat least for this year. SAir has sought toresolve this situation by promoting consoli-dation with the hope of eliminating overca-pacity. Following various failed transactions,the German tourism company, ReweTouristik, has agreed to buy outright LTUTouristik, and take a 40% stake in the trou-bled LTU charter airline. West LB bank willhave a 10.1% stake in LTU, leaving SAirwith the remaining 49.9%.
LTU is forecast to continue making loss-es through 2001, and achieve break-even in2002.
TAPTAP's strategy is called MOP
(Modernization and Restructuring Project). Afinancial turnaround date has been set forTAP of 2002 with €110m of improvementstargeted. Improving the Lisbon hub is themajor priority. The other element of itsPortuguese strategy was to have been coop-eration with Portugalia in which SAir expect-ed to take a 42% stake. However, it hasbeen thwarted by an EC ruling that invest-
Aviation StrategyBriefing
October 2000

ments in both the main Portuguese carrierswould be anti-competitive.
Volare and Air EuropeIt is unlikely that SAir will emerge as a
serious partner for Alitalia, but it has tied upthe Italian charter sector through purchasingstakes in the leading long-haul charter, AirEurope, and short-haul charter Volare, bothof which are loss-making.
The two airlines are to be brought underone holding company, the newly brandedVolare Group, which will form Italy's secondlargest airline. Although there are some pos-sibilities for developing scheduled routes,this remains essentially a charter operationwhile AirOne, in which SAir tried but failed tobuy a stake, provides the main domesticscheduled competition to Alitalia.
THYTHY Turkish Airlines now describes itself
as a "dormant member" of the QualiflyerAlliance. At one point it looked likely that SAirwould participate in its privatisation, plannedfor next year, but this is now improbable. SAA
SAA is the most profitable of SAir'sinvestments, and provides a good exampleof the cross-selling strategy. GATXFlightlease, the joint venture between GATXCapital and the SAir Group, has placed eightSAir-owned 737-800s with SAA, andFlightlease is in its own right supplying anadditional eight 737-800 aircraft. In returnSAA is trading seven A320s into the GATXFlightlease. However, SAA, despite SAir's20% stake, remains in the Star alliance.
The American allianceThe defection of former partner Delta to
Air France has been quickly made up for bythe substitution of American Airlines. Thefact that Switzerland and Belgium have"Open Skies" agreements with the US hasallowed both Swissair and Sabena to devel-op a range of codeshare flights withAmerican. Sabena codeshares to 81 US
cities beyond its US gateways, and Swissairto 74 US cities.
American of course remains in oneworld,and BA may well now attempt to restore fullrelation with the US carriers in the wake ofthe ending of the KLM negotiations.
The whole groupThe other three pillars of the SAir Group
fared much better in the first half of 2000.SAirServices had an operating margin of6.0% and contributed SFr 91m in operatingprofits. SR Technics has been re-brandedSR Technics Group in order to help push fora "global presence" and now encompassesregional operations in Switzerland, Franceand the US. The maintenance company isalso finalising joint ventures in South Africawith SAA and is hoping to form a componentoverhaul business in Hong Kong withCathay Pacific. Swissport (ground handling)is now the largest ground handler in theworld thanks to the acquisition of Dynair.
SAirRelations enjoyed an operating mar-gin of 4.1% for the first half of 2000 and con-tributed operating profit of SFr 120m. GateGourmet is now ranked number two globallyfollowing the acquisition of the Dobbs Group.
SAirLogistics provided the strongestresult of the four divisions in the first halfcontributing operating profits of SFr 60mwith an operating margin of 7.8%.
The two key questions about the SAirstrategy are: is the sum of the parts trulyreflected in the share price and are the ben-fits generated by the ancillary services justi-fied by the airline investments. If theanswers are no, pressure will be exerted byshareholders to break the group up.
Aviation StrategyBriefing
October 2000
SAIRGROUP OPERATING RESULTS BY DIVISION,JAN-JUN 2000 (SFr m)
SAir SAir SAir SAir SAirLines Services Logistics Relations Group
Revenue 3,315 1,506 769 2,941 7,512EBITDAR 345 181 62 253 873EBITDAR margin 10.4% 12.0% 8.1% 8.6% 11.6%EBIT -155 91 60 120 143EBIT margin -4.7% 6.1% 7.8% 4.1% 1.9%Net invested capital 3,039 1,504 132 3,004 8,071ROIC -10.2% 12.0% 91.0% 8.0% 3.5%Headcount 11,281 18,288 1,421 41,436 72,617

AMR's interest in Northwest Airlines thispast summer drew much attention to the
fourth largest US carrier's formidable arrayof strategic assets - an extensive Pacific net-work, a lucrative transatlantic alliance withKLM, strong domestic hubs and a controllingstake in Continental. But Northwest has stillnot returned to the profitability levelsachieved before its 1998 labour troubles.What strategies will it employ to make themost of those assets?
The $300m net profit reported for 1999was well below the $597m posted on similarrevenues for 1997.The latest results, anoperating profit of $252m and a net profit of$115m for the June quarter, represent 8.6%and 3.9% of revenues. Those margins areperfectly acceptable at a time when fuelprices are at a record high, but competitorslike Continental, United, Delta and Americanstill achieved operating margins of over10%.
Since the strike Northwest's unit rev-enues have rebounded strongly, reflecting aswift and complete recovery of leisure trafficand continued improvements in Pacific mar-kets. Non-fuel costs have remained undercontrol despite expensive new labour agree-ments and the need to spend on restoringimage. In the June quarter Northwest's costsper ASM excluding fuel rose by just 0.4%.
But the important high-yield traffic seg-ment has still not recovered fully from the1998 events. Debacles like the January1999 snowstorm in Detroit, when passen-gers were forced to remain on an aircraft onthe ground for eight hours, have not helped.Even though surveys suggest thatNorthwest's customer service and opera-tional performance are now excellent, therehave evidently been lingering problems withcustomer relations.
Over the past year or so Northwest hascome at or near the top in the DoT's domes-tic on-time performance, flight completionand baggage delivery rankings. This should
help it recapture fully its former business traf-fic share and restore its yield and profit mar-gins (to the extent permitted by fuel prices) inthe remainder of this year and in 2001.
Northwest is expected to report essential-ly flat earnings for the quarter endedSeptember 30, which would be in line withthe industry trend. Strong revenue perfor-mance, helped by United's troubles, was off-set by higher fuel prices - the carrier bore thefull brunt as it was completely unhedged inthe latest quarter. But the fourth quarter maysee a profit improvement because Northwesthas 75% of its fuel requirements for that peri-od hedged at around $19 a barrel.
The current First Call/Thomson Financialconsensus forecast for 2000 is net earningsbefore special items of $3.26 per share. Thiswould be exactly the same as last year'sreported figure or 12.8% higher than the$2.89 reported before special items. Therange of 11 analysts' estimates, from $2.70to $3.62, is rather wide.
Longer-term earnings outlook is relative-ly bright in light of the fuel hedges that willkick in, expected full recovery of businesstraffic and continued strengthening of Pacificdemand and unit revenues. The current con-sensus estimate for 2001 is $4.10 per shareor around $377m - still well below the 1996and 1997 peaks.
Northwest's cash reserves, which halvedto $480m in the six months to December 31,1998, have now recovered to their formerstrength - $1.1bn at the end of June. Totalliquidity was $2.4bn. However, long termdebt has risen from $2.8bn at the end of1997 to around $3.7bn at present, andstockholders' equity was just $122m at theend of June.
The favourable financial trends have hadlittle impact on the company's share price,which fell to a low of $16 in March, afterplummeting from $65 to around $25 in thesix months leading up to the strike.Speculation about a merger with American
Aviation StrategyBriefing
October 2000
Northwest: Asian resurgencebehind profit recovery

temporarily lifted the stock to $39 in earlyJuly, but since then the price has fallen backto the mid/high 20s. With a P/E ratio of just7.6 in late September, the stock continues tobe recommended as a "buy" or "strong buy"by most analysts.
Rising labour costsIn the mid-1990s Northwest benefited
from an $886m three-year package of wageconcessions secured from all of its unions inAugust 1993. In the second half of 1996 thewages snapped back to the pre-concessionlevels. The net impact of that on the profitand loss account was not that detrimental(because the company was able to stopissuing stock to employees), but the subse-quent inability to secure new contracts led tolabour actions and a strike in 1998 that costthe company far more than what it saved in1994-96.
The strike was settled when the pilotssigned a four-year contract, which repre-sented a straightforward compromise -among other things, 3% annual pay rises inreturn for some productivity concessions.This made possible a new phase in man-agement-pilot relations and subsequentmatters, such as pay rates on the A319,were settled quickly.
Since then Northwest has concluded newcontracts with seven other unions. The latestof those, a five-year agreement ratified bythe flight attendants in May, was particularlywelcome because it brought to a close apainful three-year negotiating process. Lastyear flight attendants rejected an earlier ten-tative deal and staged a "sickout", which ledto the company filing a lawsuit against theunion (dropped when the contract wassigned).
Just one more contract needs to besecured to complete the "1996 round" - withAircraft Mechanics Fraternal Association(AMFA), which represents 9,400 mechanics,cleaners and custodians who voted to get outof IAM two years ago. But those talks appearto be just as tough going as the previousones. While non-economic issues have beenresolved, the two sides reportedly remain farapart on the issue of compensation.
Northwest estimated in a recent SEC fil-ing that the new flight attendant contract willcost it $75m in 2000. The deal provides forretroactive pay from August 1996 at 3.5% ofannual salaries and will bring pay rates toindustry-leading levels. In combination, thenew contracts mean substantial annualincreases in labour costs. However, thisshould not lead to much of a competitive dis-advantage because many other major carri-ers in the US now face similar cost pres-sures.
If the AMFA deal is concluded this year,as was earlier hoped, Northwest will have atwo-year breathing space before the pilots'contract becomes amendable in September2002. The fact that the new contracts arestaged will make the next negotiating roundeasier to manage.
Asian recoveryNorthwest has the highest Asian revenue
exposure among the US carriers. Itstranspacific and intra-Asian servicesaccounted for 23% of its total revenues lastyear (down from 30% in the mid-1990s),compared to 15% for United, the numbertwo US carrier in that region. Consequently,
Aviation StrategyBriefing
October 2000
-400-200
0200
400600
8001,000
1,200
93 94 95 96 97 98 99 00* 01*
NORTHWEST’S FINANCIAL RESULTS$m
Operating profit
Net profit
Note: *Before special items - First Call/Thomson Financialconsensus estimates.
8,000
9,000
10,000
11,000
93 94 95 96 97 98 99
NORTHWEST’S OPERATING REVENUE$m

the Asian crisis had a devastating financialimpact. After earning $94-97m annual oper-ating profits in Asia in 1995 and 1996,Northwest posted a small $10.5m loss in1997 and a massive $465.7m loss in 1998.The 1998 Asian loss far exceeded the com-bined $336.4m operating profit earned indomestic and Atlantic operations.
The carrier contained the crisis by sus-pending the worst performing routes, cuttingcapacity and restructuring its network exten-sively in favour of more nonstop service inbusiness-oriented markets. This and the startof a gradual recovery in Asia (though not inJapan) about 18 months ago helped reducethe Asian operating loss to $135.1m in 1999.
The slump in Japan bottomed out abouta year ago. Northwest's Pacific division hasbeen recording RPM growth and yieldimprovements since the third quarter of1999. In the past three quarters, revenuegrowth has been running at around 20% andunit revenue growth at 13-19%. The Junequarter saw a record 83.1% average loadfactor in the Pacific division (up 3.1 points).The carrier said recently that while leisuretraffic to and from Japan has recovered well,business traffic has been slow to return.
All of this indicates that Northwest isapproaching breakeven and may evenreturn to marginal profitability in Asia thisyear. It is well-positioned to capitalise on theregion's recovery and new opportunities.
Two new market developments are wor-thy of note. First, Northwest is expandingaggressively on promising new businessroutes like Detroit-Nagoya, which was intro-duced in 1998 and will see daily 747-400flights from next April. Second, it has been
expanding service in the Detroit-Shanghaimarket and is bidding for some of the tennew weekly frequencies available to US car-riers next year (with obviously no guaranteeof getting any - there are seven carriers inthe race).
Like many of its competitors, Northwesthas been fortunate to experience healthy orimproved conditions simultaneously in all ofits regions this year. North American trafficand yields have been extremely strong,while the transatlantic market has staged asurprising recovery. After a long decline,Northwest's unit revenues there rose by3.5% and 5.3% in the March and June quar-ters respectively, and passenger revenuesurged by 24% in the latest period.
Benefits from freightNorthwest is the only US passenger air-
line to operate 747 freighters - there are nowten in service after the addition of two lastyear. Freight has been a strong growth areathis year, recording a 25% surge in revenuesin the June quarter to account for 7.2% oftotal revenues.
The reason is the recovery of Asianeconomies. Northwest's freighter operationscover Tokyo, Osaka, Hong Kong, Shanghai,Taipei, Bangkok, Singapore, Guam andManila, while the domestic points served areNew York, Chicago, Los Angeles, SanFrancisco, Seattle and Anchorage. TheChina freighter service, linking Detroit andShanghai and complementing the passen-ger service, was introduced in October 1999.
The latest developments include thelaunch of the Northwest/JAL cargo code-sharing alliance last month (September), ini-tially on the US-Japan routes. Also,Northwest has just acquired two more "late-model", ex-United 747-200s, which it is con-verting from passenger configuration tofreighters and expects to place into servicein the first half of next year.
Further hub strengtheningNorthwest's hubs - Detroit, Minneapolis
and Memphis in the US, Narita in Japan andAmsterdam in Europe - are among its great-
Aviation StrategyBriefing
October 2000
8
9
10
11NORTHWEST’S QUARTERLY UNIT REVENUES AND COSTS
Operating revenue per ASM
Cents
Operating cost per ASM
1997 200019991998

est assets and continue to be the focus ofexpansion and improvement efforts.
Most significantly, Detroit, whereNorthwest has been growth-constrained fora number of years, will get a new terminal inlate 2001 (apparently on time and on bud-get). The new facility will raise the number ofgates from 64 to 99 and will be able to han-dle 14 widebodies and ten internationalflights at the same time. The addition of afourth runway in 2002 will further enhanceDetroit's value as a domestic hub.
The other major building project at pre-sent is Satellite 3 at Tokyo Narita, whereNorthwest will move when it is completed(hopefully) in late 2004 or early 2005. The"absolute state of the art facility" has beendesigned to facilitate Northwest's hub-typeoperation, which is unique among the for-eign operators serving Tokyo.
In June Northwest undertook what itcalled its largest-ever single service expan-sion when it launched a fourth bank of flightsto fill a late afternoon void at its smallest hub,Memphis. Together with its commuter affili-ate Northwest Airlink, the carrier added 47new flights, representing a 25% increase,mostly to cities already served throughoutsouthern US.
Northwest was able to score valuablepoints in another of summer characterisedby flight delays when FAA statistics for 21major hub airports showed that Minneapolis,Detroit and Memphis were among the beston-time performers in the June quarter.
Predatory complaintsNorthwest was previously lucky in that its
route system had minimal exposure to low-cost new entrants. That changed when carri-ers like Spirit, Sun Country, AccessAir andPro Air discovered Minneapolis and Detroit.But none of that has posed any threatbecause of the extent that Northwest domi-nates its hubs. AccessAir filed for bankruptcyprotection in November 1999, while Pro Airhas struggled financially and has just beengrounded by the FAA for safety violations.
But Northwest now faces a lawsuit filedby Spirit alleging anti-competitive behaviour,partly due to gate dominance, at Detroit.
This is a serious matter that dampensNorthwest's otherwise bright prospects.
To make things worse, Minneapolis-based Sun Country has just released astudy, prepared by airline competition expertDr. Paul Stephen Dempsey, that outlines"the history of predatory and monopolisticpractices of Northwest Airlines that have dri-ven low-fare carriers from the marketplaceand resulted in higher fares". The carrier hascalled for action from Twin Cities' businessleaders and the government.
Fleet plansNorthwest is in the process of gradually
simplifying and modernising its fleet, whichwill include the retirement of its 727s, DC-10-40s and, eventually, the DC-9s (the MD-80s have already been eliminated). The car-rier continues to take delivery of regional
Aviation StrategyBriefing
October 2000
-3
-2
-1
0
1
2
NORTHWEST’S QUARTERLYEARNINGS PER SHARE
$ EPS
19991998 2000
Note: 3Q & 4Q 2000 figures are before special items - First Call/ThomsonFinancial consensus estimates.
In operation On order727-200 31757-200 48 25747-200 23747-200F 10747-400 14A319 16 53A320 70 12A330 16DC-9 171MD-80 8DC-10 45Total 436 106
NORTHWEST’S FLEET
Source:ACAS

jets, A319s and 757s for expansion.Previously the intention was to retire the
727-200s in 2002 and 2003 (before their agecheck), but the process will now start in mid-2001 following a July agreement with Boeingto accelerate deliveries of five 757-200sfrom 2004 to 2001 and five A320/319s from2002 to 2001. This will lead to substantialoperating cost savings, given the continuedescalation of fuel prices.
The A319, which was introduced lastyear, is also considered to be a goodreplacement for the DC-9-50. At the otherextreme, RJs are also expected to replacesome of the DC-9s. Northwest recently tookdelivery of the last three of 36 ordered AVRORJ85s and the first of three CRJ-200s due toarrive this year.
This strategy means that the current 171-strong DC-9 fleet may have shrunk to 100-125 by the time those aircraft will have to beretired, which will be when they start nearingthe end of their certified life of 105,000cycles. But Northwest will still need areplacement 100-seater.
The 747s are utilised mainly on thePacific, though some fly transatlantic sectorsbetween Pacific runs. The long-term plan isto transfer the transatlantic DC-10-30s to thedomestic market, and Northwest is currentlyevaluating possible replacements.
Alliance considerationsOne of Northwest's greatest strengths is
its longstanding relationship with KLM. Itwas the first to secure antitrust immunity inthe US and it is much more advanced interms of the extent and depth of coordinationthan any of the other international alliances.
However, efforts to expand the Wingsalliance have not been very successful,which has raised questions about where theNorthwest/KLM partnership is really head-ing. The setbacks include the recentbreakup of the KLM/Alitalia relationship,after the three-airline combine had alreadysecured antitrust immunity in the US. Whatwill now happen to Northwest's highly prof-itable codeshares with Alitalia?
Northwest has continued to expandcodesharing with Continental, in which it
holds a 13.5% stake and 50% voting inter-est. The carrier says that the alliance gener-ated $30m in additional benefits in the Junequarter. But Continental now wants to buyback the stake, and the DoJ lawsuit chal-lenging the 1998 purchase is expected to goto court sometime over the next 12 months.
Northwest's president and CEO JohnDasburg provided some interesting insightsinto the company's strategy and the workingsof the Northwest/KLM relationship at a MerrillLynch conference held in June. Dasburgexplained that the two carriers linked up orig-inally because they both found themselvessimilarly disadvantaged by their medium sizeand then divided the responsibility of "findinga solution" in their own regions.
KLM will have the final say aboutNorthwest's codeshares with Alitalia because"KLM has the final say in Europe and wehave the final say in North America".Dasburg said that KLM would obviously takeinto account the fact that the healthy profitsfrom the deal go into the joint venture and"will tell us what they'd like us to do with that"before the initial one-year deal comes up forrenewal.
The Northwest/KLM agreement has tenmore years to run and the airlines are "totallyintegrated", so Dasburg believes that thealliance will survive any new relationships thatthe two develop in their respective regions.
Did Northwest ever seriously considerAMR's proposals? It reportedly turned downAmerican's final offer of up to $65 a share asinadequate, demanding at least $100 pershare. Dasburg pointed out that while thecompany is by law obligated to considerattractive offers, embarking on a right strate-gy (a reference to the KLM alliance) isanother way to maximise shareholder value.
Northwest is anxiously waiting for theDoJ's response to the proposed UAL/USAirways merger, because it is a much moreintegrated transaction than the blockingrights Northwest secured in Continental. Ifthe UAL/US Airways deal is allowed,Northwest believes that the DoJ will with-draw its objection to Northwest/Continentaland the two could then apply for and obtainantitrust immunity. Otherwise, Northwest isprepared to defend its strategy in court.
Aviation StrategyBriefing
October 2000
By Heini Nuutinen

Aviation StrategyOnline
June 2000
CUSTOMISED AIRLINE AND MARKET BRIEFINGS
If you are interested in a briefing on a particular airline or industry sector or market, Aviation Economics is able to produce in-depth
reports customised to your requirements.
Contact: Tim Coombs or Keith McMullan +44 (0)20 7490 5215 [email protected]
THE INTERNET VERSION OFAVIATION STRATEGY
In early October the internet version of Aviation Strategy will arrive.Subscribers will be able to:• Receive their current copy of the newsletter electronically, which should be alot faster than snail mail • Access all the back issues of the newsletter, either through browsing throughthe back titles or using a key word search facility, so making your life easierand your filing cabinets less cluttered
To find the electronic version, simply go to our website - www.aviationeconomics.com - follow the leads to Aviation Strategy, enter your username and password, then click on whatever issues or articles youare looking for. The relevant newsletter will then be downloaded via AdobeReader (this is a free facility) and you can read on screen, print off or cut andpaste to other files.
To request your user-name and password please email us at [email protected]. Please note that the passwords will only beallocated to paid-up subscribers, that they are personal and they must not beused by non-subscribers. Subscription packages for readers at the samecompany address are available - please contact us for details.
Meanwhile, the hard copy version will continue to be published as normal.

Aviation StrategyMacro-trends
October 2000
EUROPEAN SCHEDULED TRAFFICIntra-Europe North Atlantic Europe-Far East Total long-haul Total international
ASK RPK LF ASK RPK LF ASK RPK LF ASK RPK LF ASK RPK LFbn bn % bn bn % bn bn % bn bn % bn bn %
1992 129.6 73.5 56.7 134.5 95.0 70.6 89.4 61.6 68.9 296.8 207.1 69.8 445.8 293.4 65.81993 137.8 79.8 57.9 145.1 102.0 70.3 96.3 68.1 70.7 319.1 223.7 70.1 479.7 318.0 66.31994 144.7 87.7 60.6 150.3 108.8 72.4 102.8 76.1 74.0 334.0 243.6 72.9 503.7 346.7 68.81995 154.8 94.9 61.3 154.1 117.6 76.3 111.1 81.1 73.0 362.6 269.5 74.3 532.8 373.7 70.11996 165.1 100.8 61.1 163.9 126.4 77.1 121.1 88.8 73.3 391.9 292.8 74.7 583.5 410.9 70.41997 174.8 110.9 63.4 176.5 138.2 78.3 130.4 96.9 74.3 419.0 320.5 76.5 621.9 450.2 72.41998 188.3 120.3 63.9 194.2 149.7 77.1 135.4 100.6 74.3 453.6 344.2 75.9 673.2 484.8 72.01999 200.0 124.9 62.5 218.9 166.5 76.1 134.5 103.1 76.7 492.3 371.0 75.4 727.2 519.5 71.4
July 00 18.8 13.5 71.6 21.1 18.2 86.0 11.8 9.8 83.0 45.2 38.0 84.1 67.5 54.0 80.0Ann. chng 4.6% 8.8% 2.8 2.5% 7.5% 4.0 2.0% 5.4% 2.6 1.9% 7.0% 4.0 3.0% 7.7% 3.5Jan-Jul 00 120.2 75.8 63.1 132.0 103.4 78.4 80.3 62.2 77.5 294.6 228.3 77.5 436.8 319.2 73.1Ann. chng 6.1% 8.2% 1.2 6.5% 9.6% 2.2 3.0% 5.8% 2.1 4.3% 8.4% 2.9 5.1% 8.7% 2.4Source: AEA.US MAJORS’ SCHEDULED TRAFFIC
Domestic North Atlantic Pacific Latin America Total internationalASK RPK LF ASK RPK LF ASK RPK LF ASK RPK LF ASK RPK LFbn bn % bn bn % bn bn % bn bn % bn bn %
1992 857.8 536.9 62.6 134.4 92.4 68.7 123.1 85.0 69.0 48.0 27.4 57.0 305.4 204.7 67.01993 867.7 538.5 62.1 140.3 97.0 69.2 112.5 79.7 70.8 55.8 32.5 58.2 308.7 209.2 67.81994 886.9 575.6 64.9 136.1 99.5 73.0 107.3 78.2 72.9 56.8 35.2 62.0 300.3 212.9 70.91995 900.4 591.4 65.7 130.4 98.5 75.6 114.3 83.7 73.2 62.1 39.1 63.0 306.7 221.3 72.11996 925.7 634.4 68.5 132.6 101.9 76.8 118.0 89.2 75.6 66.1 42.3 64.0 316.7 233.3 73.71997 953.3 663.7 69.6 138.1 108.9 78.9 122.0 91.2 74.7 71.3 46.4 65.1 331.2 246.5 74.41998 960.8 678.8 70.7 150.5 117.8 78.3 112.7 82.5 73.2 83.5 52.4 62.8 346.7 252.7 72.919991,007.3 707.5 70.2 164.2 128.2 78.1 113.2 84.7 74.8 81.3 54.3 66.8 358.7 267.2 74.5
July 00 89.4 70.3 78.6 34.5 28.6 82.8Ann. chng 1.6% 4.2% 2.0 6.3% 10.6% 3.2Jan-Jul 00 600.8 436.1 72.6 218.0 167.2 76.7Ann. chng 3.8% 6.0% 1.5 5.6% 9.4% 2.7Note: US Majors = American, Alaska, Am. West, Continental, Delta, NWA, Southwest, TWA, United, USAir. Source: Airlines, ESG.
ICAO WORLD TRAFFIC AND ESG FORECASTDomestic International Total Domestic International Total
growth rate growth rate growth rateASK RPK LF ASK RPK LF ASK RPK LF ASK RPK ASK RPK ASK RPKbn bn % bn bn % bn bn % % % % % % %
1993 1,349 855 63.3 1,785 1,205 67.5 3,135 2,060 65.7 3.4 2.0 4.4 4.8 3.9 3.61994 1,410 922 65.3 1,909 1,320 69.1 3,318 2,240 67.5 4.6 7.9 6.9 9.4 5.9 8.81995 1,468 970 66.1 2,070 1,444 69.8 3,537 2,414 68.3 4.1 5.4 8.5 9.4 6.6 7.81996 1,540 1,043 67.7 2,211 1,559 70.5 3,751 2,602 79.4 4.9 7.4 6.8 8.0 6.0 7.81997 1,584 1,089 68.8 2,346 1,672 71.3 3,930 2,763 70.3 2.9 4.5 6.1 7.2 4.8 6.11998 1,638 1,147 70.0 2,428 1,709 70.4 4,067 2,856 70.3 3.4 5.2 3.5 2.2 3.4 3.41999 1,911 1,297 67.9 2,600 1,858 71.5 4,512 3,157 70.0 5.4 5.0 5.7 7.4 5.6 6.4
*2000 2,004 1,392 69.4 2,745 1,969 71.8 4,750 3,361 70.8 4.9 7.2 5.6 6.0 5.3 6.5*2001 2,100 1,440 68.5 2,907 2,063 70.9 5,009 3,503 69.9 4.7 3.5 5.9 4.7 5.4 4.2*2002 2,161 1,463 67.7 3,022 2,119 70.1 5,182 3,582 69.1 2.8 1.6 3.9 2.7 3.5 2.2*2003 2,233 1,533 68.7 3,170 2,253 71.1 5,403 3,788 70.1 3.4 4.9 4.9 6.3 4.3 5.8*2004 2,317 1,607 69.4 3,332 2,393 71.8 5,651 4,000 70.8 3.7 4.8 5.2 6.2 4.6 5.6
Note: * = Forecast; ICAO traffic includes charters. Source: Airline Monitor, July 2000.
DEMAND TRENDS (1990=100)Real GDP Real exports Real imports
US UK Germany France Japan US UK GermanyFrance Japan US UK Germany France Japan1992 102 98 102 102 105 113 103 112 109 110 107 101 115 104 961993 105 100 100 101 105 117 107 106 109 112 117 104 108 101 961994 109 103 103 104 106 126 117 115 115 117 131 110 117 107 1041995 111 106 105 106 107 137 126 122 123 123 141 115 124 113 1191996 114 108 107 107 111 152 135 128 128 126 155 124 127 116 1321997 118 112 110 109 112 172 146 142 142 138 177 135 136 123 1321998 122 115 113 112 109 173 150 152 150 135 196 144 147 133 1211999 127 117 114 115 111 179 150 155 153 135 220 151 152 136 122
*2000 131 120 117 118 112 191 156 164 162 142 239 158 159 143 126Note: * = Forecast; Real = inflation adjusted. Source: OECD Economic Outlook, December 1999.

FINANCIAL TRENDS (1990=100)Inflation (1990=100) Exchange rates (against US$) LIBOR
US UK Germany France Japan UK Germ. France Switz. Euro** Japan 6 month Euro-$1991 104 106 104 103 103 1991 0.567 1.659 5.641 1.434 0.809 134.5 5.91%1992 107 107 109 106 105 1992 0.570 1.562 5.294 1.406 0.773 126.7 3.84%1993 111 109 114 108 106 1993 0.666 1.653 5.662 1.477 0.854 111.2 3.36%1994 113 109 117 110 107 1994 0.653 1.623 5.552 1.367 0.843 102.2 5.06%1995 117 112 119 112 107 1995 0.634 1.433 4.991 1.182 0.765 94.1 6.12%1996 120 114 121 113 107 1996 0.641 1.505 5.116 1.236 0.788 108.8 4.48%1997 122 117 123 114 108 1997 0.611 1.734 5.836 1.451 0.884 121.1 5.85%1998 123 120 124 115 109 1998 0.603 1.759 5.898 1.450 0.896 130.8 5.51%***1999 125 122 126 116 108 1999 0.621 1.938 6.498 1.587 1.010 103.3 5.92%***
*2000 127 126 127 117 108 Sep 2000 0.687 2.222 7.453 1.730 0.880 107.5 6.59%***Note: * = Forecast. Source: OECD Economic Outlook, December 1999. **Euro rate quoted from January 1999 onwards.1990-1998 historical rates quote ECU. *** = $ LIBOR BBA London interbank fixing six month rate.
JET OPERATING COSTS ($/block hour)
JET AND TURBOPROP ORDERSDate Buyer Order Price Delivery Other information/engines
Boeing Sep 29 Singapore Airlines 10 A3XXs 2006+ Plus 15 optionsSep 25 Ryanair 3 737-800s 2Q 2002+
Sep 8 Air France 4 777-200ERs 2002 Conversion of options/GE 90-94BBombardier Sep 21 Lufthansa CityLine 10 CRJ-700s 1Q 2001 Conversion of options
Note: Prices in US$. Only firm orders from identifiable airlines/lessors are included. MoUs/LoIs are excluded.Source: Manufacturers.
Aviation StrategyMacro-trends
October 2000
Narrowbodies Widebodies727 2629 DC-9 1802 747-200 7193737-200 1991 MD-80 2140 747-400 6454737-300 1958 MD-90 3978 767-200 3168737-400 2111 767-300 3342737-500 1880 Regional jets 777-200 3803737-700 1396 CRJ 1090 DC-10 4975737-800 1665 Emb 145 1012 L-1011 5398757-200 2576 MD-11 4607A319 2254A320 2306
Source: Airline Monitor Note: Based on 1999 US carriers’ returns: Operating costs = Labour, fuel, main-tenance (inc. maintenance burden), depreciation and rentals.

Group Group Group Group Total Total Load Group Group Total Total Total Load Grouprevenue costs operating net ASK RPK factor rev. per costs per pax. ATK RTK factor employees
profit profit total ASK total ASKUS$m US$m US$m US$m m m % Cents Cents 000s m m %
American*Oct-Dec 98 4,152 3,857 295 182 64,317.3 43,811.6 68.1 6.46 6.00 19,805 9,526.7 5,060.1 53.1 90,460Jan-Mar 99 3,991 3,954 37 158 62,624.3 41,835.4 66.8 6.37 6.31Apr-Jun 99 4,528 4,120 408 268 67,313.8 47,945.9 71.2 6.73 6.12Jul-Sep 99 4,629 4,603 547 279 67,972.2 48,792.9 71.8 6.88 6.26Oct-Dec 99 4,477 4,206 271 280 65,751.2 44,328.2 67.4 6.81 6.41 98,700Jan-Mar 00 4,577 4,365 212 132 64,392.8 43,478.4 67.5 7.11 6.78 104,500Apr-Jun 00 5,011 4,494 517 321 67,000.4 50,538.7 75.4 7.48 6.71 105,900
America WestOct-Dec 98 507 470 37 20 10,037.2 6,491.9 64.7 5.05 4.68 4,335 1,261.2 688.1 54.6 11,687Jan-Mar 99 520 469 51 26 10,135.4 6,485.5 64.0 5.13 4.63 4,263Apr-Jun 99 570 494 76 42 10,446.0 7,204.8 69.0 5.46 4.73 4,724Jul-Sep 99 553 511 41 22 10,522.9 7,502.8 71.3 5.26 4.86 4,896Oct-Dec 99 569 532 37 29 10,594.0 7,307.8 69.0 5.37 5.02 4,822 11,575Jan-Mar 00 563 552 11 15 10,440.8 6,960.5 66.7 5.39 5.29 4,612 12,024Apr-Jun 00 618 570 48 33 10,979.8 8,091.7 73.7 5.63 5.19 5,206 12,158
ContinentalOct-Dec 98 1,945 1,817 128 66 30,557.4 21,273.3 69.6 6.37 5.95 10,637 3,664.5 2,339.0 63.8 41,118Jan-Mar 99 2,056 1,896 160 84 30,938.8 22,107.0 71.5 6.65 6.13 12,174Apr-Jun 99 2,198 1,942 256 137 32,448.3 24,009.1 74.0 6.77 5.98 11,493Jul-Sep 99 2,283 2,071 21 110 34,711.0 26,380.3 76.0 6.58 5.97 11,922Oct-Dec 99 2,158 2,073 85 33 33,771.2 24,094.4 71.3 6.39 6.14 11,347Jan-Mar 00 2,277 2,223 54 14 33,710.2 24,143.0 71.6 6.75 6.59 11,201Apr-Jun 00 2,571 2,292 279 149 34,406.9 26,534.0 77.1 7.47 6.66 12,084
DeltaOct-Dec 98 3,448 3,128 320 194 57,810.9 39,947.7 69.1 5.96 5.41 25,531 8,244.1 4,699.3 57.0 76,649Jan-Mar 99 3,504 3,148 356 216 56,050.3 39,163.9 69.9 6.25 5.62Apr-Jun 99 3,957 3,315 642 364 57,957.3 43,422.1 74.9 6.83 5.72 27,438Jul-Sep 99 3,877 3,527 350 352 60,710.8 45,528.3 75.0 6.39 5.81 27,183 5,258.2 72,300Oct-Dec 99 3,713 3,705 8 352 58,265.1 40,495.3 69.5 6.37 6.36 25,739Jan-Mar 00 3,960 3,605 355 223 57,093.8 39,404.4 69.0 6.94 6.31 25,093 72,300Apr-Jun 00 4,439 3,863 606 460 59,753.4 46,509.8 77.8 7.48 6.46 28,333 73,800
NorthwestOct-Dec 98 2,212 2,404 -192 -181 37,947.0 26,534.3 69.9 5.83 6.34 12,962 6,125.2 3,588.9 58.6 50,503Jan-Mar 99 2,281 2,295 -14 -29 37,041.3 26,271.8 70.9 6.16 6.20Apr-Jun 99 2,597 2,333 264 120 40,541.5 30,900.2 76.2 6.41 5.75Jul-Sep 99 2,843 2,472 370 180 43,194.5 33,562.1 77.7 6.58 5.73Oct-Dec 99 2,555 2,461 94 29 39,228.3 28,618.2 73.0 6.51 6.27Jan-Mar 00 2,570 2,573 -3 3 39,486.0 28,627.4 72.5 6.51 6.52Apr-Jun 00 2,927 2,675 252 115 42,049.6 33,523.5 79.7 6.96 6.36
SouthwestOct-Dec 98 1,047 888 159 100 19,763.0 12,603.4 63.8 5.30 4.49 13,291 2,504.1 1,317.4 52.6 26,296Jan-Mar 99 1,076 909 167 96 19,944.0 12,949.2 64.9 5.40 4.56 12,934Apr-Jun 99 1,220 966 254 158 20,836.9 15,241.7 73.1 5.85 4.64 14,817Jul-Sep 99 1,235 1,029 206 127 21,903.8 15,464.0 70.6 5.64 4.70 14,932Oct-Dec 99 1,204 1,050 154 94 22,360.7 15,047.8 67.3 5.38 4.70 14,818 27,653Jan-Mar 00 1,243 1,057 155 74 22,773.8 15,210.2 66.8 5.46 4.77 14,389 27,911Apr-Jun 00 1,461 1,146 315 191 23,724.3 17,624.9 74.3 6.16 4.83 16,501
TWAOct-Dec 98 747 813 -66 -79 13,452.4 8,731.6 64.9 5.55 6.04 5,574 1,863.7 982.8 52.7 21,321Jan-Mar 99 764 802 -38 -22 13,352.4 9,205.2 68.9 5.72 6.01Apr-Jun 99 866 848 18 -6 14,274.4 11,130.9 78.0 6.07 5.94Jul-Sep 99 876 935 -59 -54 15,188.0 11,524.3 75.9 5.76 6.16 6,928 1,957.0 1,248.6 63.8 20,982Oct-Dec 99 809 913 -104 -76 14,501.6 9,687.1 66.8 5.58 6.30 6,038Jan-Mar 00 954 939 15 -4 15,465.4 11,607.0 75.1 6.17 6.07 7,020Apr-Jun 00
UnitedOct-Dec 98 4,281 4,090 191 54 70,620.9 49,484.4 70.1 6.06 5.79 21,616 10,774.4 6,182.8 57.4 94,903Jan-Mar 99 4,160 4,014 146 78 67,994.5 46,899.8 69.0 6.12 5.90Apr-Jun 99 4,541 4,108 433 669 71,573.6 50,198.9 70.1 6.34 5.74Jul-Sep 99 4,845 4,226 619 359 74,043.0 55,628.0 75.1 6.54 5.71 23,765 96,700Oct-Dec 99 4,480 4,286 194 129 70,715.9 49,172.2 69.5 6.34 6.06 21,536 96,600Jan-Mar 00 4,546 4,294 252 -99 68,421.1 46,683.5 68.2 6.64 6.28 20,141 96,100Apr-Jun 00 5,109 4,504 605 408 70,913.5 53,624.8 75.6 7.20 6.35 22,412 98,300
US AirwaysOct-Dec 98 2,121 1,943 178 104 23,318.8 16,112.3 69.1 9.10 8.33 14,202 3,171.1 1,754.5 55.3 40,664Jan-Mar 99 2,072 1,983 89 46 22,745.8 15,405.8 67.7 9.11 8.72Apr-Jun 99 2,286 2,007 279 317 23,891.7 17,557.5 73.5 9.57 8.40Jul-Sep 99 2,102 2,213 -111 -85 23,006.6 17,205.6 71.7 8.76 9.22 13,984 40,613Oct-Dec 99 2,135 2,256 -121 -81 24,705.9 16,714.2 67.6 8.64 9.13 14,075 41,636Jan-Mar 00 2,098 2,237 -139 -218 24,250.3 15,568.7 64.2 8.65 9.22 12,804 42,727Apr-Jun 00 2,433 2,265 168 80 26,171.9 19,557.4 74.7 9.30 8.65 15,554 42,653
ANAOct-Dec 98Jan-Mar 99Apr-Jun 99 SIX MONTH FIGURESJul-Sep 99 4,541 4,329 212 146 44,156.0 29,032.0 65.7 10.28 9.80 21,970Oct-Dec 99 SIX MONTH FIGURESJan-Mar 00 5,591 5,842 -251 6 49,646.9 31,844.9 64.1 11.26 11.77 27,430Apr-Jun 00
Cathay PacificOct-Dec 98 1,769 1,713 56 -45 31,367.0 21,173.0 67.5 5.64 5.46 5,649.0 3,847.0 68.1Jan-Mar 99 SIX MONTH FIGURESApr-Jun 99 1,695 1,664 31 17 28,801.0 19,325.5 67.1 5.89 5.78 5,267.0 3,581.6 68.0Jul-Sep 99 SIX MONTH FIGURESOct-Dec 99 1,989 1,658 331 133 29,313.0 22,167.9 75.6 6.79 5.66 5,600.0Jan-Mar 00 SIX MONTH FIGURESApr-Jun 00 2,070 1,765 305 285 29,839.0 22,588.1 75.7 6.94 5.92 5,483.0
JALOct-Dec 98 TWELVE MONTH FIGURESJan-Mar 99 14,555 14,249 305 249 123,097.8 84,092.9 68.3 11.82 11.58 35,492 18,405.3 11,890.4 64.6Apr-Jun 99Jul-Sep 99Oct-Dec 99 TWELVE MONTH FIGURESJan-Mar 00 14,665 14,254 411 181 126,282.4 88,478.5 70.1 11.61 11.29 37,247 18,856.7 12,738.0 67.6Apr-Jun 00
Aviation StrategyMicro-trends
October 2000
Note: Figures may not add up due to rounding. 1 ASM = 1.6093 ASK. *Airline group only.

Group Group Group Group Total Total Load Group Group Total Total Total Load Grouprevenue costs operating net profit ASK RPK factor rev. per costs per pax. ATK RTK factor employees
profit total ASK total ASKUS$m US$m US$m US$m m m % Cents Cents 000s m m %
Korean AirOct-Dec 98 4,109 3,834 275 266 47,931.0 32,276.0 67.0 8.57 8.00 19,714 6,682 5,225 76.6Jan-Mar 99Apr-Jun 99Jul-Sep 99 TWELVE MONTH FIGURESOct-Dec 99 4,340 4,177 163 232 49,516.0 36,693.0 74.0 8.76 8.44 20,564 7,827 5,995 78.2Jan-Mar 00Apr-Jun 00
MalaysianOct-Dec 98 TWELVE MONTH FIGURES Jan-Mar 99 1,966 1,556 410 -183 45,442.3 30,592.9 67.3 4.33 4.97 13,709 6,649.0 4,030.0 60.6Apr-Jun 99Jul-Sep 99Oct-Dec 99 TWELVE MONTH FIGURESJan-Mar 00 2,148 1,652 496 -67 48,906.0 34,930.0 71.4 4.39 3.38 7,531.5 4,853.4 64.4Apr-Jun 00
SingaporeOct-Dec 98 SIX MONTH FIGURESJan-Mar 99 2,421 2,130 291 341 41,725.5 30,843.7 74.9 5.80 5.10 6,537 7,958.5 5,540.3 69.6Apr-Jun 99 SIX MONTH FIGURESJul-Sep 99 2,577 2,259 317 346 43,145.7 32,288.3 74.8 5.97 5.24 6,752 8,251.9 5,852.7 70.9Oct-Dec 99 SIX MONTH FIGURESJan-Mar 00 2,459 2,203 256 439 44,582.6 33,430.1 75.0 5.51 4.94 7,030 8,665.8 6,185.7 71.4Apr-Jun 00
Thai AirwaysOct-Dec 98Jan-Mar 99Apr-Jun 99 TWELVE MONTH FIGURESJul-Sep 99 2,858 2,695 163 136 51,788.0 37,642.0 72.7 5.52 5.20 16,331 7,309.0 5,097.0 69.7Oct-Dec 99Jan-Mar 00Apr-Jun 00
Air FranceOct-Dec 98 SIX MONTH FIGURESJan-Mar 99 5,550 5,552 -2 56 51,394.0 38,242.0 74.4 10.80 10.80Apr-Jun 99 SIX MONTH FIGURESJul-Sep 99 5,249 4,889 360 316 56,934.0 43,896.0 77.1 9.22 8.59 20,600Oct-Dec 99 SIX MONTH FIGURESJan-Mar 00 4,831 4,430 401 41 55,508.0 41,650.0 75.0 8.70 7.98 19,200Apr-Jun 00
AlitaliaOct-Dec 98 5,152 4,432 720 235 51,638.4 35,427.2 68.8 9.98 6.86 24,103 18,825Jan-Mar 99 SIX MONTH FIGURESApr-Jun 99 2,074 2,132 -58 -14Jul-Sep 99Oct-Dec 99Jan-Mar 00Apr-Jun 00
BAOct-Dec 98 3,585 3,431 154 -114 44,454.0 29,736.0 66.9 8.06 7.72 10,747 6,277.0 4,111.0 65.5 64,608Jan-Mar 99 3,343 3,481 -138 -119 43,544.0 29,537.8 67.8 7.68 7.99 10,285 6,130.0 3,933.0 64.2 64,366Apr-Jun 99 3,527 3,378 149 302 45,813.0 32,032.0 69.9 7.70 7.37 11,733 6,437.0 4,215.0 65.5 65,179Jul-Sep 99 3,933 3,742 191 49 47,465.0 35,873.0 75.6 8.29 7.88 12,983 6,690.0 4,689.0 70.1 65,607Oct-Dec 99 3,473 3,476 -3 -112 45,347.0 30,192.0 66.6 7.66 7.67 11,084 6,469.0 4,270.0 66.1 65.800Jan-Mar 00 3,097 3,281 -184 -247 44,533.0 29,328.0 65.9 6.95 7.37 10,778 6,253.0 4,041.0 64.6 64,874Apr-Jun 00 3,488 3,342 146 -85 44,826.0 32,295.0 72.0 7.78 7.46 11,633 6,475.0 4,407.0 68.1 61,411
IberiaOct-Dec 98 4,451 4,100 351 356 45,041.6 32,520.0 72.2 9.88 9.10 21,753 3,740.0 22,065Jan-Mar 99Apr-Jun 99Jul-Sep 99 TWELVE MONTH FIGURESOct-Dec 99 3,712 3,659 53 179 50,227.6 34,606.8 68.9 7.39 7.28 21,877Jan-Mar 00Apr-Jun 00
KLMOct-Dec 98 1,673 1,661 12 -15 18,476.0 13,767.0 74.5 9.05 8.99 3,214.0 2,415.0 75.1 33,761Jan-Mar 99 1,550 1,670 -120 -45 17,716.0 13,294.0 75.0 8.75 9.43 3,088.0 2,284.0 74.0 33,892Apr-Jun 99 1,626 1,547 79 37 18,778.0 14,302.0 76.2 8.66 8.24 3,253.0 2,427.0 74.6 34,980Jul-Sep 99 1,731 1,596 135 32 19,630.0 16,083.0 81.9 8.81 8.13 3,352.0 2,640.0 78.8 35,226Oct-Dec 99 1,450 1,479 -29 -17 19,014.0 14,434.0 75.9 7.63 7.78 3,280.0 2,550.0 77.7 35,128Jan-Mar 00 1,361 1,436 -75 -142 18,627.0 14,084.0 75.6 7.31 7.71 3,238.0 2,453.0 75.8 35,348Apr-Jun 00 1,600 1,509 91 39 18,730.0 15,149.0 80.9 8.54 8.06 3,276.0 2,549.0 77.8 27,267
Lufthansa***Oct-Dec 98 2,929 2,106 823 96 25,530.0 18,259.0 71.5 11.47 8.25 9,819 5,204.0 3,676.0 70.6 55,368Jan-Mar 99 3,301 3,210 91 64 25,445.0 17,942.0 70.5 12.97 12.62 9,658 4,972.0 3,435.0 69.1 56,420Apr-Jun 99 3,322 3,012 310 97 30,500.0 22,279.0 73.0 10.89 9.86 11,444 5,626.0 3,993 71.0 53,854Jul-Sep 99 4,049 3,677 382 184 31,335.0 23,866.0 76.2 12.92 11.73 11,891 5,699.0 4,142.0 72.7Oct-Dec 99 3,398 2,964 434 378 29,120.0 20,313.0 69.8 11.67 10.18 10,807 5,503.0 3,930.0 71.4 66,207Jan-Mar 00 2,831 2,742 89 11 28,599.0 19,781.0 69.2 9.90 9.59 10,355 5,422.0 3,751.0 69.2Apr-Jun 00 4,159 3,935 223 400 31,865.0 24,405.0 76.6 13.05 12.35 12,249 5,988.0 4,338.0 72.4
SASOct-Dec 98 1,368 1,266 102 46* 8,116.0 5,089.0 62.7 16.86 15.60 5,431 27,071Jan-Mar 99 1,203 1,227 -24 -3* 8,062.0 4,713.0 58.5 14.92 15.22 5,017 27,110Apr-Jun 99 1,357 1,294 63 60* 8,466.0 5,571.0 65.8 16.03 15.28 5,580 27,706Jul-Sep 99 1,173 1,150 23 12* 8,450.0 5,667.0 67.1 13.88 13.61 5,589 27,589Oct-Dec 99 1,210 1,083 127 138* 8,227.0 5,210.0 63.3 14.71 13.16 5,536Jan-Mar 00 1,145 1,179 -34 -33* 8,253.0 4,992.0 60.5 13.87 14.24 5,314 28,060Apr-Jun 00 1,289 1,176 113 112* 8,492.0 70.7 15.18 13.85 13.85 6,236 28,295
Swissair**Oct-Dec 98 2,187 2,070 117 165 20,476.8 15,391.3 75.2 10.68 10.11 5,277 10,396Jan-Mar 99 SIX MONTH FIGURESApr-Jun 99 1,932 1,877 55 57 23,411.0 16,130.0 68.9 8.25 8.02 7,784 10,715Jul-Sep 99 SIX MONTH FIGURESOct-Dec 99 2,344 2,272 72 125 21,934.0 16,839.0 76.8 10.69 10.36 6,081Jan-Mar 00 SIX MONTH FIGURESApr-Jun 00 1,916 2,006 -90 2 25,476.0 18,241.0 71.6 7.52 7.87 9,162 3,972.8 2,719.6 68.5
Aviation StrategyMicro-trends
October 2000
Note: Figures may not add up due to rounding. 1 ASM = 1.6093 ASK. *Pre-tax. **SAirLines’ figures apart from net profit, which is SAirGroup. ***Excludes Condor from 1998 onwards. 4Q+ data are on IAS basis.

The Principals and Associates of Aviation Economics apply a problem-solving, creative and pragmatic approach to commercial aviation projects.
Our expertise is in strategic and financial consulting in Europe, the Americas, Asia, Africa and the Middle East, covering:
• Start-up business plans • Turnaround strategies • State aid applications
• Antitrust investigations • Merger/takeover proposals • Competitor analyses
• Credit analysis • Corporate strategy reviews • Market forecasts
• Privatisation projects • IPO prospectuses • Cash flow forecasts
• Asset valuations • E&M processes • Distribution policy
For further information please contact:Tim Coombs or Keith McMullan
Aviation EconomicsJames House, LG, 22/24 Corsham Street, London N1 6DR
Tel: + 44 (0)20 7490 5215 Fax: +44 (0)20 7490 5218e-mail:[email protected]
PLEASE RETURN THIS FORM TO:Aviation EconomicsJames House, LG
22/24 Corsham StreetLondon N1 6DR
Fax: +44 (0)20 7490 5218
Delivery addressName
Position
Company
Address
Country Postcode
Tel Fax
I enclose a Sterling, Euro or US Dollarcheque, made payable to:Aviation Economics
Please invoice me
Please charge my AMEX/Mastercard/Visacredit card or Switch debit cardCard numberName on card Expiry date
I am sending a direct bank transfer of£390 net of all charges to AviationEconomics’ account: HSBC BankSort code: 40 04 37 Account no: 91256904
Aviation Economics
Please enter my Aviation Strategysubscription for:One year (12 issues) @£390 / €625 / US$625,starting with the issue(Discounts available for multiplesubscriptions - please call for details)
DATA PROTECTION ACTThe information you provide will be held on our database and may beused to keep you informed of our products and services or for selectedthird party mailings
Invoice address (if different from delivery address)
NamePositionCompanyAddress
Country Postcode
SUBSCRIPTION FORM