AVIATION DEPARTMENT NOTICE - Broward County, Florida · BROWARD COUNTY AVIATION DEPARTMENT ANNUAL...
79
AVIATION DEPARTMENT NOTICE The Airport’s financial statements conform to the respective audited financial statements contained in Broward County’s basic financial statements. However, the financial statements, schedules and various analyses represented in this Annual Financial Report are: “Unaudited”
Transcript of AVIATION DEPARTMENT NOTICE - Broward County, Florida · BROWARD COUNTY AVIATION DEPARTMENT ANNUAL...

AVIATION DEPARTMENT
NOTICE
The Airport’s financial statements conform to the respective audited
financial statements contained in Broward County’s basic financial
statements. However, the financial statements, schedules and various
analyses represented in this Annual Financial Report are:
“Unaudited”

AVIATION DEPARTMENT

BROWARD COUNTY AVIATION DEPARTMENT
A Major Fund of Broward County, Florida
FORT LAUDERDALE / HOLLYWOOD INTERNATIONAL AIRPORT
NORTH PERRY AIRPORT
2007 ANNUAL FINANCIAL REPORT
Fiscal Year Ended September 30, 2007
(Unaudited)
Prepared By the Finance Division
Mark Spennacchio, Director of Finance
Natalie Otto, CPA, Assistant Director of Finance
Jackie Jackson, Accounting Manager
Finance Division Staff
Aida Smith, Collection Specialist
Jane Bronshteyn, Accounts Payable Specialist
Jeanne Cavelli, Division Administrative Assistant
Joann Daniels, Accounts Payable Specialist
Karla Drummond, Accounts Payable Specialist
Anthony Davidson, Capital Projects Finance Manager
Barbara Wright, Grants Administrator
Thomas Karakunnel, Property Accountant
Angela Lambert, Procurement Coordinator
Ishwar Mahadeo, Capital Payable Specialist
Sandra Alston, Senior Revenue/Cost Analyst
Monique Burn, Billing Specialist
Ron Rubin, General Ledger Accountant
Harriet Samar, Revenue Manager
Mercedes Pichardo, Administrative Specialist
Shirley Spanie, Disbursement Accountant
Pui King Liu, Capital Projects Accountant
Melva Cushman, Accounts Receivable Supervisor
Manny Lax, Compliance Manager

BROWARD COUNTY AVIATION DEPARTMENT
ANNUAL FINANCIAL REPORT
For the Year Ended September 30, 2007
(Unaudited)
TABLE OF CONTENTS
I - FINANCIAL SECTION
Overview and Analysis ....................................................................................................................................... I – 1
Financial Statements:
Comparative Statement of Net Assets ........................................................................................................... I – 10
Comparative Statement of Revenues, Expenses and Changes in Fund Net Assets ....................................... I – 11
Comparative Statement of Cash Flows .......................................................................................................... I – 12
Notes to Financial Statements ....................................................................................................................... I – 13
Summary of Significant Accounting Policies ......................................................................................... I – 14
Cash and Investments ............................................................................................................................. I – 17
Accounts Receivable .............................................................................................................................. I – 18
Restricted Assets .................................................................................................................................... I – 18
Capital Assets ......................................................................................................................................... I – 19
Lease and Concession Agreements ........................................................................................................ I – 20
Long-Term Liabilities ............................................................................................................................ I – 21
Capital Contributions ............................................................................................................................. I – 23
Airline-Airport Lease and Use Agreement ............................................................................................. I – 23
Commitments and Contingent Liabilities ............................................................................................... I – 23
Subsequent Events ................................................................................................................................. I – 23
II- SUPPLEMENTARY INFORMATION
Supplementary Information Locator Guide ................................................................................................... II – 1
Combining Statement of Net Assets ....................................................................................................... II – 2
Combining Statement of Revenues, Expenses and Changes in Net Assets ............................................ II – 4
Combining Statement of Cash Flows ..................................................................................................... II – 6
Debt Service Requirements to Maturity ................................................................................................. II – 8
Debt Service to Maturity by Series......................................................................................................... II – 9
Deposits to and Withdrawals from Special Funds and Accounts
Created Airport Bond Resolutions and the Airline-Airport Lease & Use Agreement ........................ II – 15
Airport System Revenue Bonds Debt Service Coverage ........................................................................ II – 16
Passenger Facility Charge Convertible Lien Bonds – Sufficiency Test ................................................. II – 17

III - STATISTICAL SECTION
Operating Statistics:
Annual Enplaned Passengers ......................................................................................................................... III – 1
Landed Weights............................................................................................................................................. III – 2
Aircraft Operations ........................................................................................................................................ III – 3
Air Cargo Activity ......................................................................................................................................... III – 4
Landing Fees ................................................................................................................................................. III – 5
Average Terminal Rent ................................................................................................................................. III – 6
Airline Cost per Enplaned Passenger ............................................................................................................ III – 7
Revenue Statistics:
Total Concession Revenue per Enplaned Passenger ..................................................................................... III – 8
Food & Beverage Revenue per Enplaned Passenger ..................................................................................... III – 9
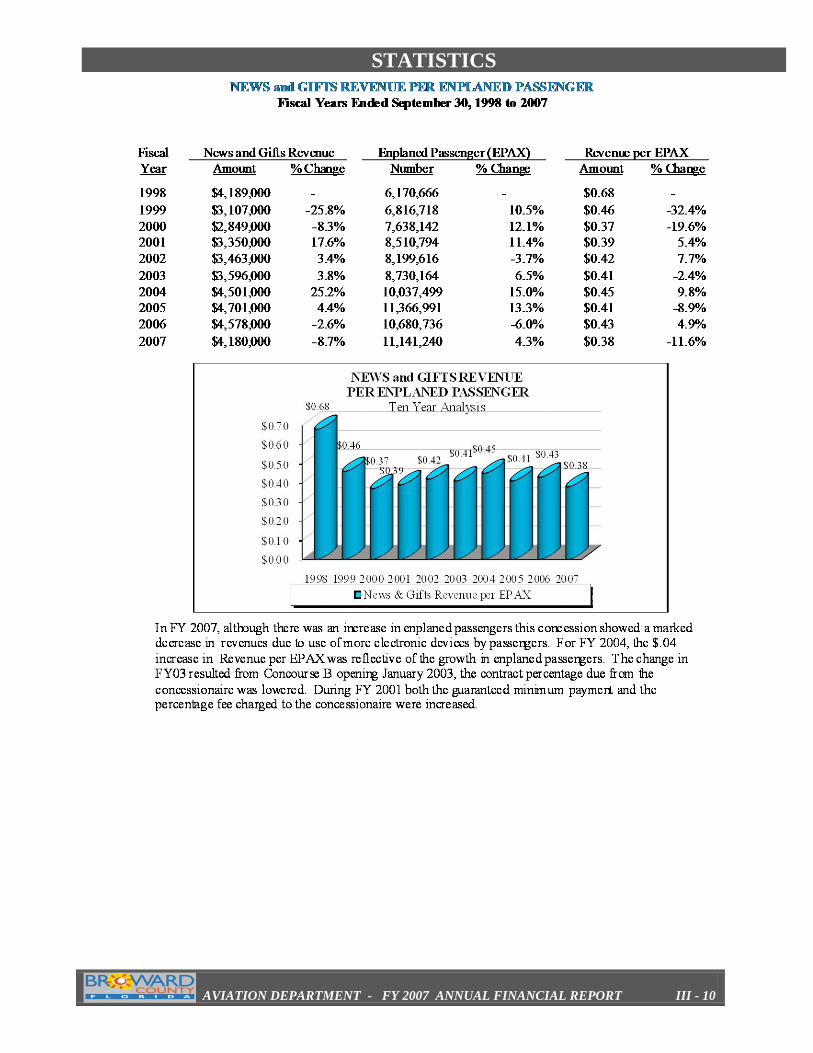
News & Gifts Revenue per Enplaned Passenger ........................................................................................... III – 10
Rental Car Revenue per Enplaned Passenger ................................................................................................ III – 11
Parking Revenue per Enplaned Passenger ..................................................................................................... III – 12
Building & Ground Rental Revenue per Enplaned Passenger ....................................................................... III – 13
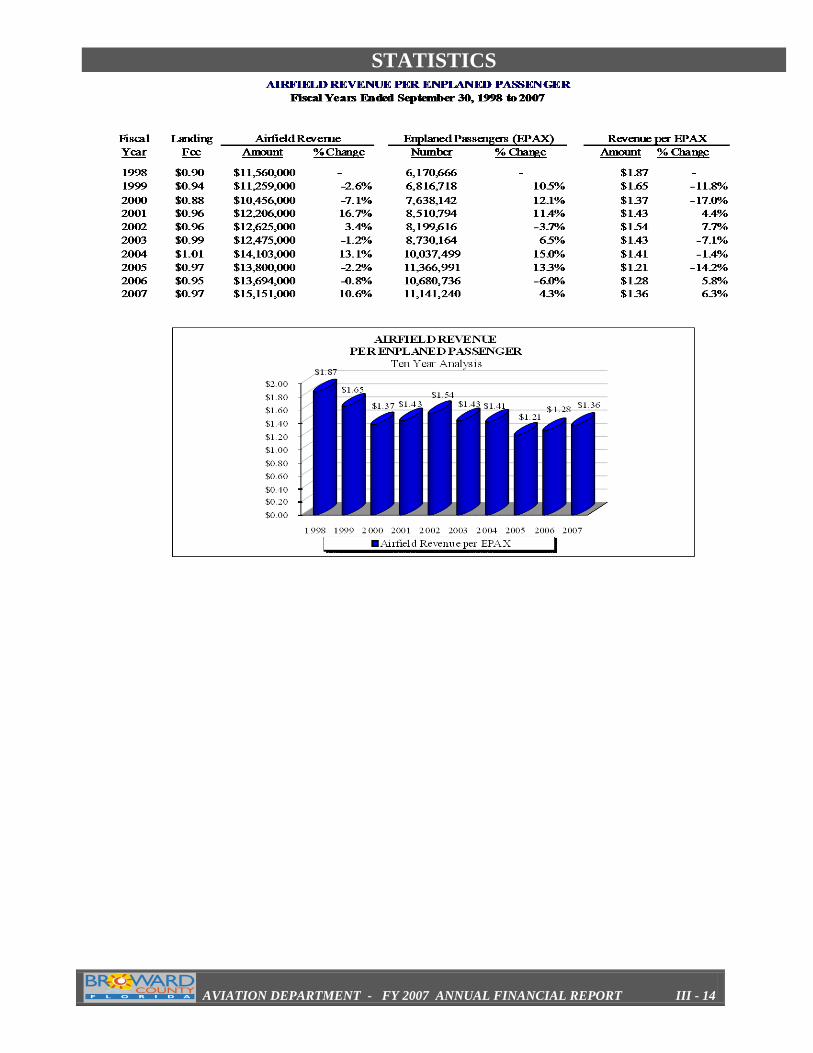
Airfield Revenue per Enplaned Passenger .................................................................................................... III – 14
Terminal Rent Revenue per Enplaned Passenger .......................................................................................... III – 15
Other Revenue per Enplaned Passenger ........................................................................................................ III – 16
Expense Statistics:
Personal Services Expense per Enplaned Passenger ..................................................................................... III – 17
Contractual Services Expense per Enplaned Passenger ................................................................................. III – 18
General Operating Expense per Enplaned Passenger .................................................................................... III – 19
Financial Statistics:
Passenger Facility Charges ............................................................................................................................ III – 20
Cash/Investments and Yields ........................................................................................................................ III – 21
Current Liquidity Ratio ................................................................................................................................. III – 22
Debt to Capital Asset Ratio ........................................................................................................................... III – 23
Debt Service per Enplaned Passenger ........................................................................................................... III – 24
Airport Information:
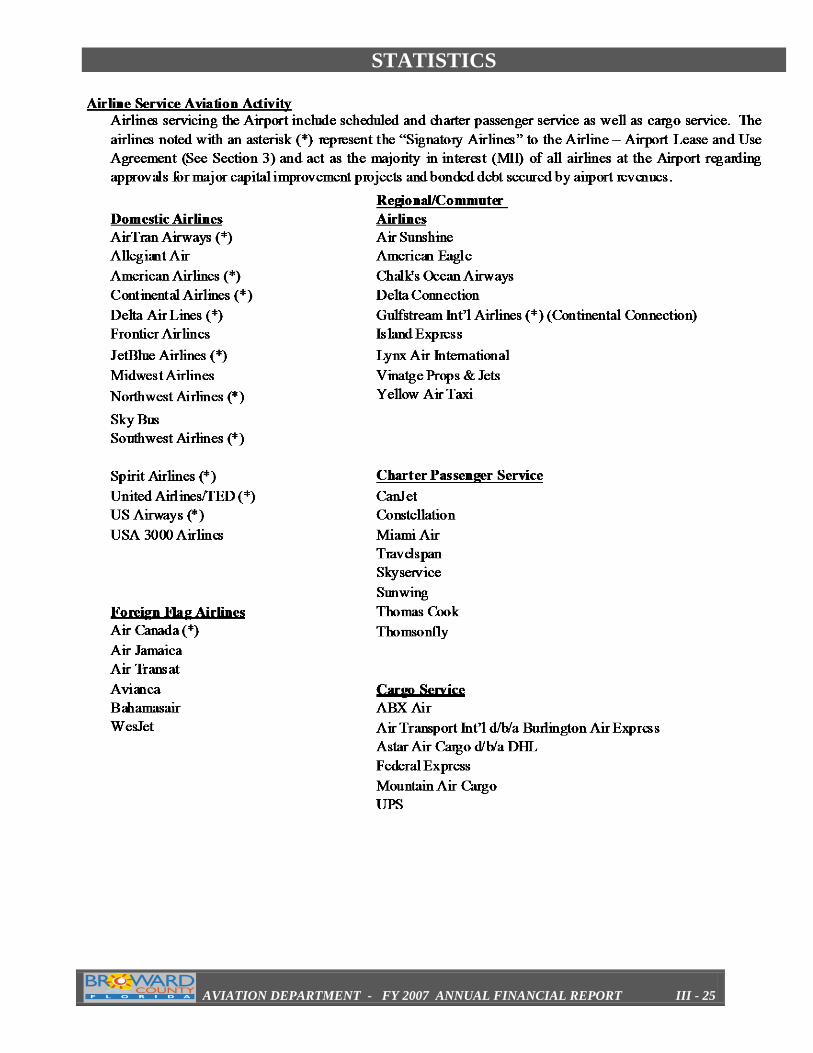
Airlines Servicing the Airport ....................................................................................................................... III – 25
Primary Origination & Destination for Airport Domestic Passenger Markets .............................................. III – 26
Scheduled Airlines ........................................................................................................................................ III – 27
Commuter Airlines, Charters, Cargo Carriers ............................................................................................... III – 28
Total Passengers ............................................................................................................................................ III – 29
Airline Market Share ..................................................................................................................................... III – 30
Comparative Airline Cost Per Enplanement by Major FLL Airlines ............................................................ III – 31
Bond Ratings ................................................................................................................................................. III – 32
Airport Information ....................................................................................................................................... III – 33

AVIATION DEPARTMENT

FINANCIAL
AVIATION DEPARTMENT - FY 2007 ANNUAL FINANCIAL REPORT I - 1
OVERVIEW & ANALYSIS
This narrative summarizes the overview and analysis of the financial activities of Fort Lauderdale-International Airport
(FLL) and North Perry Airport (HWO) for the fiscal year ended September 30, 2007. The financial activity of HWO, a
small general aviation airport is immaterial, but together the two airports make up the financial activity regarding the
Airport System for the five (5) fiscal years (FY) ending September 30, 2003 through September 30, 2007. All amounts,
unless otherwise indicated, are expressed in thousands of dollars.
Financial Highlights
Airport management continues to emphasize cost containment practices and the pursuit of revenue enhancement
opportunities. With increased passenger enplanements at FLL, operating revenues increased 61% during the five-year
period, primarily from non-aviation revenues received from parking and concessions.
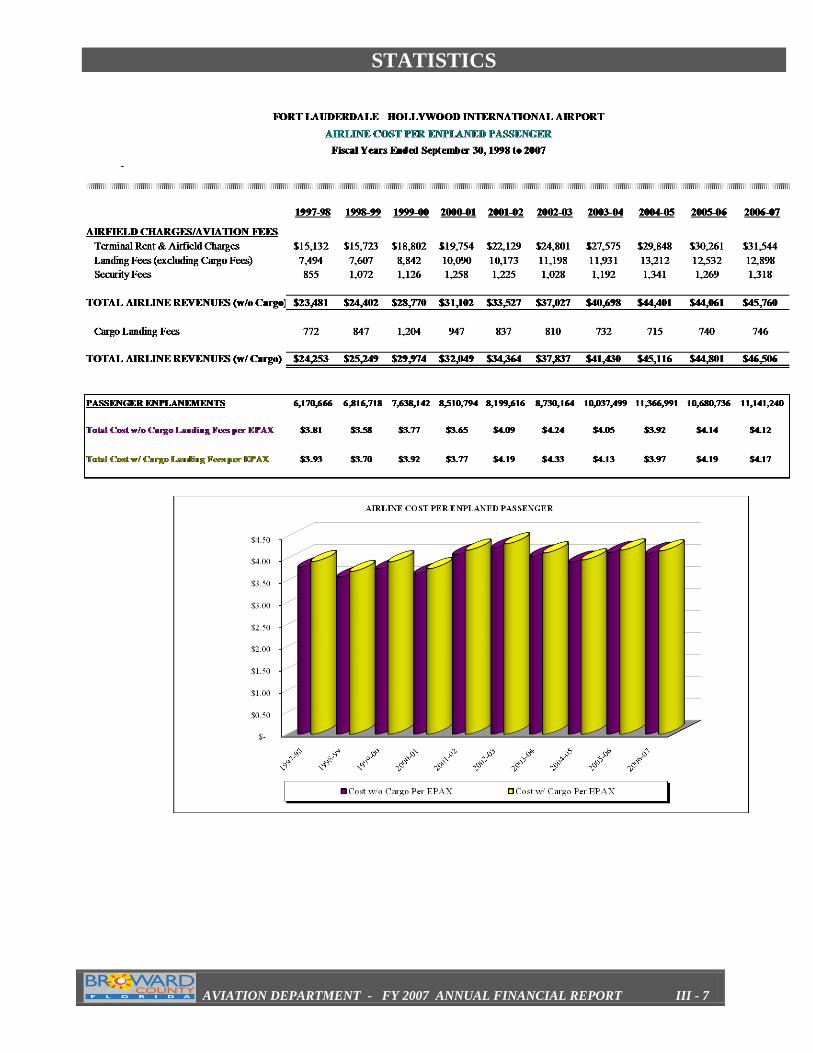
Airline cost per enplaned passenger (a common industry measure) is the net result of balancing these practices. Airline
costs are those airport operating revenues received from the airlines. Terminal rent and landing fees are the major costs
impacting the airline cost per enplanement. The following table illustrates the results of this measure and the low cost per
enplaned passenger at FLL.
Terminal rental rates and landing fees are calculated in accordance with the Airline-Airport Lease and Use Agreements.
Terminal rental rates and landing fees have remained relatively stable during the five-year period.
The airline cost per enplanement (revenues received from passenger and cargo airlines) of $4.17 in FY 2007 reflected a
reduction when compared to FY 2003, despite the 70 % cumulative increase in operating expenses over the same period.

FINANCIAL
AVIATION DEPARTMENT - FY 2007 ANNUAL FINANCIAL REPORT I - 2
Summary of Financial Position
The following table summarizes BCAD's net assets as of September 30 for each of the last five years.
Net assets increased $182.9 million (27%) from $686.5 million in FY 2003 to $869.4 million in FY 2007. The
increase is primarily the result of the additional investment in capital and restricted assets, less restricted and non-
current liabilities.

FINANCIAL
AVIATION DEPARTMENT - FY 2007 ANNUAL FINANCIAL REPORT I - 3
Summary of Revenues and Expenses
Operating revenues increased 61% and non-operating revenues increased 309%, respectively, while operating
expenses increased 70% from FY 2003 to FY 2007. This resulted in total net income increasing $21.2 million or
(106%) from $20.1million in FY 2003 to $41.3 million in FY 2007 as summarized below.
An analysis of operating revenues, operating expenses and non-operating revenues follows.
Analysis of Operating Revenues
Airport System operating revenues increased $64.6 million or 61% during the five-year period from $106.7
million in FY 2003 to $171.3 million in FY 2007. The major components of operating revenues for each
fiscal year are summarized via the following chart and table:
Operating revenue increases
were mainly due to a $21.4
million or 35% increase in
concession and parking
revenues combined, during the
five-year period. In FY 2003,
concession and parking
revenues totaled $62.3 million
and were 59% of the $106.7
million total operating
revenues. These two non-
aviation revenue components
increased to $83.7 million and
represented 49% of the $171.3
million total operating revenues
in FY 2007. The 35% growth
rate outpaced the 28% growth
in enplaned passengers during
the same five year period. This
increase in non-aviation
revenues has been a major
factor in the ability to maintain
low terminal rents and landing
fees that result in low airline
costs per enplanement.

FINANCIAL
AVIATION DEPARTMENT - FY 2007 ANNUAL FINANCIAL REPORT I - 4
Concession revenues increased $9.1 million (29%) from $32.2million in FY 2003 to $41.3 million in
FY 2007 due to increases in airport traffic and guaranteed minimum payments. These revenues
accounted for 24% of total revenues in fiscal year 2007. Within the category of concessions, rental car
concessions and food & beverage concessions amounted to $24.7 million (15%) and $7.6 million (5%)
of operating revenues, respectively.
Parking revenues increased $12.4 million (42%) to $42.5 million during the same period and represented
25% of operating revenues for FY 2007. This growth was primarily due to an increase in total airline
passengers, the addition of valet parking service and an increase in short term parking rates.
Terminal, Building and Ground Rentals increased $40.9 million (135.0%) from $30.3 million in FY 2003 to
$71.2 million in FY 2007. These revenues are derived from the recovery of operating expenses through the
annual adjustment of terminal rental rates and the collection of the customer facility charges. These
revenues accounted for 41.6% of operating revenues in FY 2007. Terminal rents include revenues from
signatory airlines, non-signatory airlines, and non-airline terminal tenants, plus airline user fees for ticket
counters, gates, passenger boarding bridges and baggage conveyors. Building & ground rentals from airline
and non-airline sources primarily represent land and building leases, apron fees and tenant service rents.
Customer Facility Charges are fees charged by the rental car companies.
Landing fees plus miscellaneous fees increased (16.6%) during the five-year period. Together, they
represented $16.4 million or 9.6% of the $171.3 million total operating revenue in FY 2007. Landing fees
are calculated according to the Airline Lease and Use Agreements. Miscellaneous fees primarily include
security fees.
Analysis of Operating Expenses
While total operating expenses (including depreciation) have increased 70.0% during the five-year period,
total operating expenses per enplaned passenger have increased 33% from $10.76 in FY 2003 to $14.37 in
FY 2007 as shown below.
Operating expenses increased $66.2 million (71%) from $93.9 million in FY 2003 to $160.1 million in FY
2007. This increase is attributable to personal and contractual services to meet the demands of airline
passenger growth at FLL and security requirements.

FINANCIAL
AVIATION DEPARTMENT - FY 2007 ANNUAL FINANCIAL REPORT I - 5
Personal Services
22%
Contractual
Services
40%
Other
16%
Depreciation
21%
Personal services (salaries & wages and all employee fringe benefits) increased $5.8 million or 33% from
$20.2 million in FY 2003 to $26.9 million in FY 2007. During this period, total authorized staff positions
grew from 408 in FY 2003 to 424 in FY 2007, a 4% increase. Personal services accounted for 22% of total
operating expenses in FY 2007 compared to 21% in FY 2003.
Contractual services of $73.9 million increased $36.8 million or 99% from FY 2003 to FY 2007. This
growth is primarily attributable to increased costs in shuttle bus service, parking management, security, and
janitorial services. These increased costs are directly related to the large increase in airport traffic that
requires improving passenger services, such as shuttle frequency and parking management, with the
opening of additional parking facilities in FY 2000.
Other expenses totaling $25 million accounted for 15.7% of total operating expenses in FY 2007.
Collectively, these expenses increased by $9 million (56%) from $16 million in FY 2003. These include
such areas as legal, purchasing, information technology systems, human resources, central finance and
accounting services and utilities. The increased costs are associated with the growth the airport has seen
over the past five years.
Depreciation expense of $34.2 million represents 21% of operating expenses in FY 2007 compared to
$20.6 million (22%) in FY 2003.

FINANCIAL
AVIATION DEPARTMENT - FY 2007 ANNUAL FINANCIAL REPORT I - 6
Analysis of Non-Operating Revenues and Expenses
The components of the non-operating revenues and expenses category are shown as follows.
Passenger Facility Charges increased 92% from $23.7million in FY 2003 to $45.5 million in FY 2007, as a
result of an increase in collections and a rate increase from $3.00 to $4.50 per enplaned passenger. These
collections are done by the Airlines and remitted to the Airport net of a $0.11 collection charge. See
"PASSENGER FACILITY CHARGES" in section III of this report.
Interest income over the past five years has increased 323% from $6 million in FY 2003 to $25.5 million in
FY 2007. This increase is primarily attributable to interest earned on invested bond proceeds.
Interest expense increased 89% from $22.1 million in FY 2003 to $41.6 million in FY 2007. This increase
in interest expense is due to the issuance of additional bonds.
Summary of Cash Flow Activities
The following shows a summary of the major sources and uses of cash and cash equivalents for the past five
years. Cash equivalents are considered cash-on-hand, bank deposits and highly liquid investments with an
original maturity of three months or less.
Cash and cash equivalents increased $175 million or 103 % during the five year period from $169.9 million
in FY 2003 to $344.9 million in FY 2007.

FINANCIAL
AVIATION DEPARTMENT - FY 2007 ANNUAL FINANCIAL REPORT I - 7
Capital Acquisitions and Construction Activities
Property and Equipment (net of depreciation) increased $247.4 million (24%) from $1,036.9 million in FY
2003 to $1,284.3 million in FY 2007. Major projects nearing completion or under construction at
September 30, 2007 had an aggregate cost of $168.9 million.
Property and equipment as of September 30, 2007 consisted of the following:
Outstanding Bonds
The following table summarizes the Airport System Revenue (ASR) Bond and Passenger Facility Charge
(PFC) Convertible Lien Bond activity through September 30, 2007. Series F, G, and H provided
approximately $200 million funding for the 1998 Project. Series I provided funding for Terminal 1 and
Series J provided funding for the Consolidated Rental Car Facility. Series L provided funding for Exit
Road Funding Improvements and Grade Separated Pedestrian Bridges. Series M provided funding for
Security Enhancements, Renewal and Replacement Projects, partial funding for Terminal 4 Renovation,
Pay-on-Foot Upgraded Parking Revenue System, Airport Signage, Runway Implementation Plan
Initiatives, additional Public Parking and Sanitary Sewer project. Other changes include the refunding of
Series B with Series E in 1998, Series C with Series K and the scheduled retirements as noted below.

FINANCIAL
AVIATION DEPARTMENT - FY 2007 ANNUAL FINANCIAL REPORT I - 8
Airport System Revenue Bonds. The bond resolution contains a provision, among others, to set its revenue
rates and charges at a level where net revenues plus excess Airline Fees & Charges from the prior year
exceed required debt service payments by 125%. The following table illustrates the actual ASR debt
service coverage percentage.
PFC Convertible Lien Bonds. The following table illustrates the actual PFC revenues available for PFC
debt service from FY 2003 to FY 2007 and the annual debt service requirement from FY 2003 to FY 2007
following the issuance of the PFC Convertible Lien Bonds during 1998. While there is no debt service
coverage requirement, it is calculated at 204% in FY 2003 and 214% in FY 2007.
Credit Ratings and Bond Insurance

FINANCIAL
AVIATION DEPARTMENT - FY 2007 ANNUAL FINANCIAL REPORT I - 9
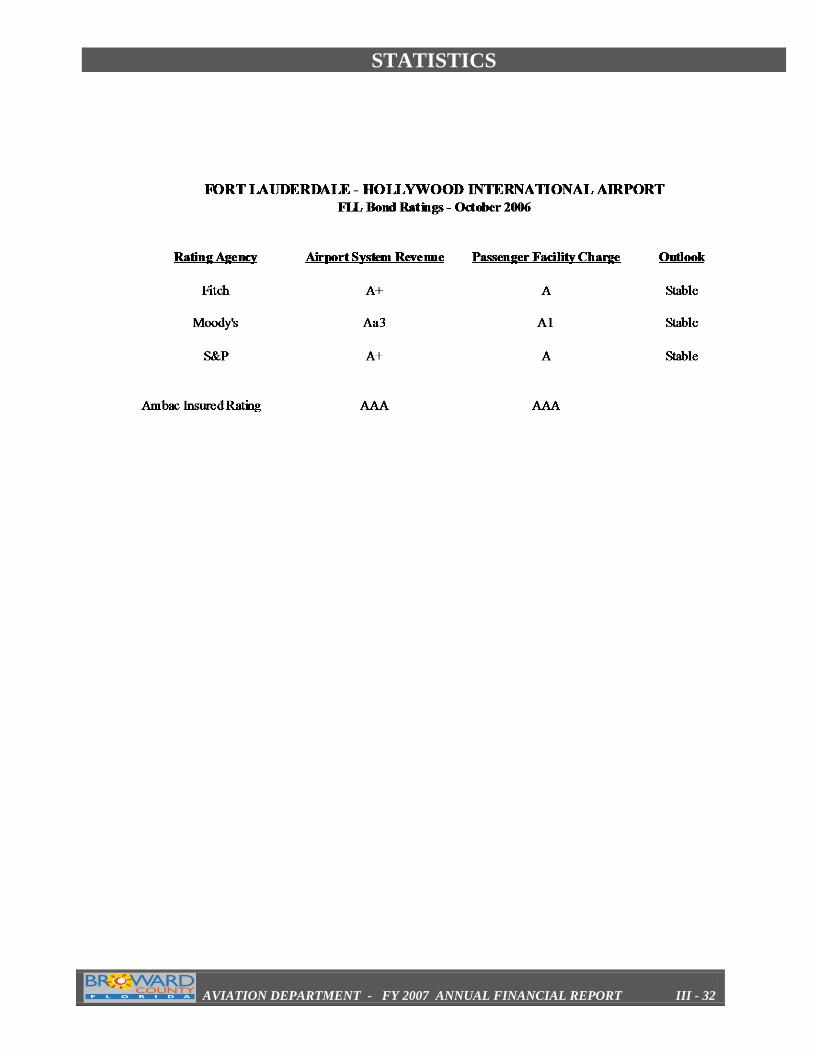
During October 2006, BCAD updated its credit ratings with the three major rating agencies and received
the following ratings:
Standard & Poor’s rating services assigned an “A+” to the County’s Airport System
revenue (ASR) Bonds and to the County’s Passenger Facility Charge (PFC) Bonds an “A”
rating with a positive outlook.
Fitch Ratings also assigned the same ratings to the bonds with a stable outlook
Moody’s Investor’s Service assigned an Aa3 rating with a stable outlook to the ASR
Bonds and an A1 rating on the PFC Bonds.
Passenger Facility Charge (PFC)
Effective January 1, 1995, the FAA authorized the Aviation Department to impose and use collected PFCs of
$3.00 per departing passenger at Fort Lauderdale - Hollywood International Airport (the Airport). In July
2005, the Airport received approval by the FAA to implement a $4.50 PFC effective October 1, 2005.
Through initial and subsequent FAA approvals, the Aviation Department is authorized to collect PFCs up to
$571,292,000 of which $333,389,000 has been collected as of September 30, 2007. This includes interest
earned on the collected dollars.
Request for Information
Our Annual Financial Report is designed to provide detailed information on BCAD’s operations.
Questions concerning any of the information provided in this report or any request for additional
information should be addressed to Mark Spennacchio, Director of Finance, Broward County Aviation
Department, 100 Aviation Boulevard, Fort Lauderdale, Florida 33315 or by e-mail to

FINANCIAL
AVIATION DEPARTMENT - FY 2007 ANNUAL FINANCIAL REPORT I - 10
(Unaudited)
2007 2006
ASSETS
Current Assets:
Cash and Cash Equivalents 30,677$ 42,232$
Receivables (Net) 6,446 6,443
Inventory 319 333
Other Current Assets 3,715 2,330
Total Current Assets 41,157 51,338
Noncurrent Assets:
Restricted Assets:
Cash and Cash Equivalents 86,699 38,487
Investments 382,048 447,400
Grant Receivables 10,753 15,522
Total Restricted Assets 479,500 501,409
Deferred Bond Issuance Cost 9,147 9,964
Capital Assets:
Land and Improvements 282,797 282,797
Buildings and Facilities 1,093,465 1,087,996
Equipment 14,717 14,227
Construction in Progress 168,954 92,887
Total Capital Assets 1,559,933 1,477,907
Less Accumulated Depreciation (275,646) (242,065)
Fixed Assets (Net) 1,284,287 1,235,842
Total Noncurrent Assets 1,772,934 1,747,215
Total Assets 1,814,091$ 1,798,553$
LIABILITIES AND NET ASSETS
Current Liabilities:
Vouchers Payable and Accrued Liabilities 25,881$ 25,155$
Due to Other County Funds - -
Other Current Liabilities 3,172 1,233 Total Current Liabilities 29,053 26,388
Current Liabilities Payable from Restricted Assets:
Vouchers Payable and Accrued Liabilities 15,126 14,583
Accrued Interest Payable 19,618 20,380
Revenue Bonds Payable 35,875 34,245
Deferred Revenue-Airline Fees and Charges 20,320 23,438
Total Current Liabilities Payable from Restricted Assets 90,939 92,646
Long Term Liabilities:
Revenue Bonds Payable 797,850 833,725
Notes Payable 17,166 21,966
Other Long-Term Liabilities and Unamortized Discount 9,690 9,660
Total Long Term Liabilities 824,706 865,351
Total Liabilities 944,698 984,385
NET ASSETS
Invested in Capital Assets, Net of Related Debt 634,423 563,174
Restricted:
Rate Stabilization 1,000 14,000
Debt Service 55,024 51,773
Passenger Facility Charge 100,704 96,318
Capital Projects 57,247 67,372
Total Restricted 213,975 229,4630
Unrestricted 20,995 21,5310
Total Net Assets 869,393 814,168
Total Liabilities and Net Assets 1,814,091$ 1,798,553$
(in thousands)
For Twelve Months Ended September 30, 2007 and 2006
BROWARD COUNTY AVIATION DEPARTMENT
COMPARATIVE STATEMENT OF NET ASSETS

FINANCIAL
AVIATION DEPARTMENT - FY 2007 ANNUAL FINANCIAL REPORT I - 11
FINANCIAL
AVIATION DEPARTMENT - FY 2007 ANNUAL FINANCIAL REPORT I - 12
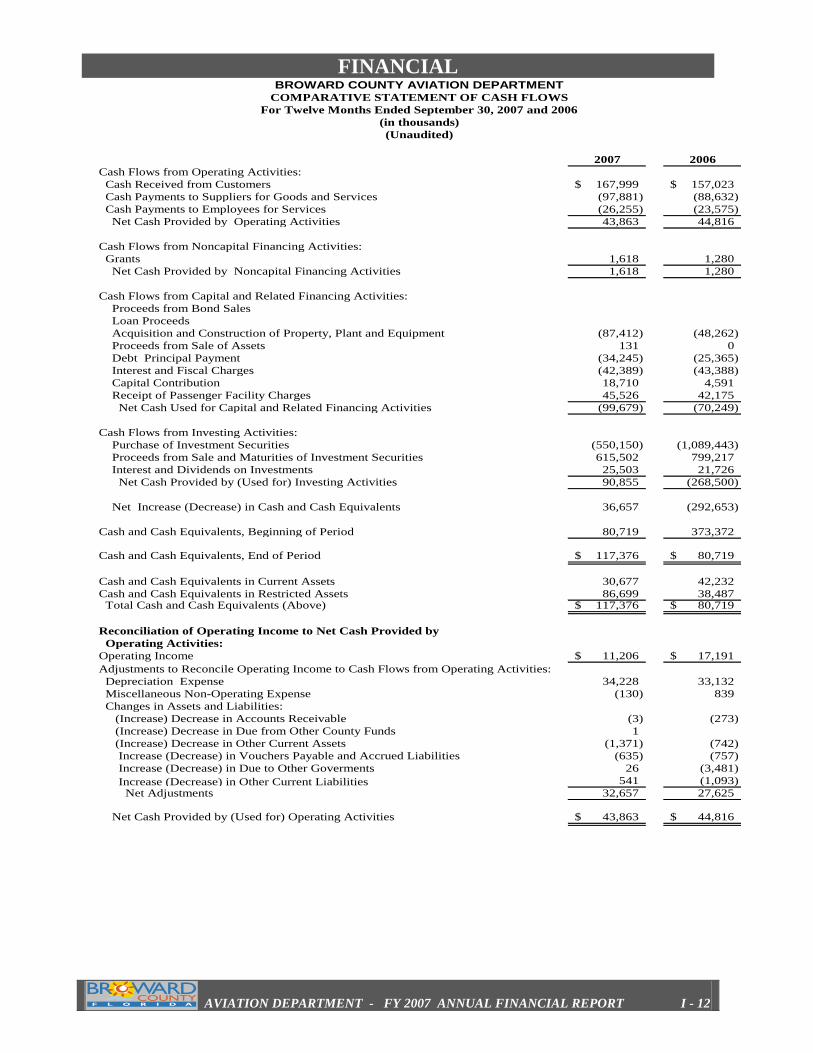
BROWARD COUNTY AVIATION DEPARTMENT
(Unaudited)
2007 2006
Cash Flows from Operating Activities:
Cash Received from Customers 167,999$ 157,023$
Cash Payments to Suppliers for Goods and Services (97,881) (88,632)
Cash Payments to Employees for Services (26,255) (23,575)
Net Cash Provided by Operating Activities 43,863 44,816
Cash Flows from Noncapital Financing Activities:
Grants 1,618 1,280
Net Cash Provided by Noncapital Financing Activities 1,618 1,280
Cash Flows from Capital and Related Financing Activities:
Proceeds from Bond Sales
Loan Proceeds
Acquisition and Construction of Property, Plant and Equipment (87,412) (48,262)
Proceeds from Sale of Assets 131 0
Debt Principal Payment (34,245) (25,365)
Interest and Fiscal Charges (42,389) (43,388)
Capital Contribution 18,710 4,591
Receipt of Passenger Facility Charges 45,526 42,175
Net Cash Used for Capital and Related Financing Activities (99,679) (70,249)
Cash Flows from Investing Activities:
Purchase of Investment Securities (550,150) (1,089,443)
Proceeds from Sale and Maturities of Investment Securities 615,502 799,217
Interest and Dividends on Investments 25,503 21,726
Net Cash Provided by (Used for) Investing Activities 90,855 (268,500)
Net Increase (Decrease) in Cash and Cash Equivalents 36,657 (292,653)
Cash and Cash Equivalents, Beginning of Period 80,719 373,372
Cash and Cash Equivalents, End of Period 117,376$ 80,719$
Cash and Cash Equivalents in Current Assets 30,677 42,232
Cash and Cash Equivalents in Restricted Assets 86,699 38,487 Total Cash and Cash Equivalents (Above) 117,376$ 80,719$
Reconciliation of Operating Income to Net Cash Provided by
Operating Activities:
Operating Income 11,206$ 17,191$
Adjustments to Reconcile Operating Income to Cash Flows from Operating Activities:
Depreciation Expense 34,228 33,132
Miscellaneous Non-Operating Expense (130) 839
Changes in Assets and Liabilities:
(Increase) Decrease in Accounts Receivable (3) (273)
(Increase) Decrease in Due from Other County Funds 1
(Increase) Decrease in Other Current Assets (1,371) (742)
Increase (Decrease) in Vouchers Payable and Accrued Liabilities (635) (757)
Increase (Decrease) in Due to Other Goverments 26 (3,481)
Increase (Decrease) in Other Current Liabilities 541 (1,093)
Net Adjustments 32,657 27,625
Net Cash Provided by (Used for) Operating Activities 43,863$ 44,816$
COMPARATIVE STATEMENT OF CASH FLOWS
For Twelve Months Ended September 30, 2007 and 2006
(in thousands)

FINANCIAL
AVIATION DEPARTMENT - FY 2007 ANNUAL FINANCIAL REPORT I - 13
Notes to the Financial Statements
September 30, 2007 (Unaudited)
Note 1: Summary of Significant Accounting Policies .............................................................................I - 14
Note 2: Cash and Investments .................................................................................................................I - 17
Note 3: Accounts Receivable ..................................................................................................................I - 18
Note 4: Restricted Assets .........................................................................................................................I - 18
Note 5: Capital Assets .............................................................................................................................I - 19
Note 6: Lease and Concession Agreements .............................................................................................I - 20
Note 7: Long-Term Liabilities .................................................................................................................I - 21
Note 8: Capital Contributions ..................................................................................................................I - 23
Note 9: Airline-Airport Lease and Use Agreement .................................................................................I - 23
Note 10: Commitments and Contingent Liabilities ...................................................................................I - 23
Note 11: Subsequent Events ......................................................................................................................I - 23

FINANCIAL
AVIATION DEPARTMENT - FY 2007 ANNUAL FINANCIAL REPORT I - 14
Notes to the Financial Statements
September 30, 2007 (Unaudited)
NOTE 1 - SUMMARY OF SIGNIFICANT ACCOUNTING POLICIES
A. Reporting Entity
The County owns and through the Aviation Fund of Broward County Aviation Department (BCAD),
operates the Fort Lauderdale-Hollywood International Airport (FLL), a major air carrier airport and the
North Perry Airport (HWO), a general aviation airport. The Aviation Fund is a major enterprise fund of
Broward County. All accounts of FLL and HWO are included in the Aviation Fund. There are no other
financial activities or funds considered for inclusion in BCAD’s reporting entity.
B. Basis of Accounting
The BCAD’s financial statements are presented using the flow of economic resources measurement focus
and the accrual basis of accounting. The economic resources measurement focus reports capital assets and
long-term debt on the statement of net assets. In turn, capital assets are depreciated and recorded as an
expense on the operating statement. The accrual basis of accounting recognizes revenues when they are
earned and expenses when incurred. However, during the fiscal year, BCAD operates using the flow of
financial resources measurement focus and modified accrual basis of accounting to comply with the
budgetary requirements of the County.
Revenues from airlines, concessions, rental cars and parking are reported as operating revenues.
Transactions which are capital, financing or investing related are reported as non-operating revenues. All
expenses related to operating the airport are reported as operating expenses. Interest expense and financing
costs are reported as non-operating expenses
C. Net Assets
Net assets represent the residual interest in BCAD’s assets after liabilities are deducted and consist of three
sections: Invested in capital assets, net of related debt, restricted and unrestricted net assets. Net assets
invested in capital assets, net of related debt includes capital assets, restricted and unrestricted, net of
accumulated depreciation, reduced by outstanding debt expended for capital assets. Net assets are reported as
restricted when constraints are imposed by third parties or enabling legislation. All other net assets are
unrestricted.
D. Proprietary Accounting and Financial Reporting
Pursuant to GASB Statement No. 20, Accounting and Financial Reporting for Proprietary Funds and Other
Governmental Entities That Use Proprietary Fund Accounting, BCAD applies all applicable GASB
pronouncements as well as FASB Statements and Interpretations, APB Opinions, and ARB’s issued on or
before November 30, 1989, unless those pronouncements conflict or contradict GASB pronouncements.
E. Cash and Cash Equivalents
Cash and cash equivalents consist of amounts in demand deposits as well as investments with a maturity of
three months or less from the date of purchase.
FINANCIAL
AVIATION DEPARTMENT - FY 2007 ANNUAL FINANCIAL REPORT I - 15
Notes to the Financial Statements
September 30, 2007 (Unaudited)
F. Accounts Receivable
Accounts receivable for the Aviation Fund are presented in the accompanying financial statements net of an
allowance for uncollectible accounts of $1,938,000 and $1,947,000 at September 30, 2007 and 2006,
respectively.
G. Inventory
Inventory consists of maintenance materials and supplies for consumption and is recorded at the lower of
cost or market value, using the first-in, first-out method.
H. Grants Receivable
The amount due from other governments represents grants receivable from the Federal and State
governments for their share of amounts expended on various capital projects.
I. Deferred Bond Issue Costs
Bond issue costs include underwriting spreads, insurance and various professional fees. The costs are
deferred and amortized over lives of respective bond issues.
J. Capital Assets
Property, plant and equipment acquired by BCAD are carried at cost, net of accumulated depreciation.
During construction of assets, interest incurred on related construction debt, less interest earned from
investments whose use is related capital improvements, is capitalized from the time of borrowing until
completion of the project. BCAD follows the policy of depreciating capital assets on the straight-line basis
over the following estimated useful lives:
Buildings and Facilities 3-40 years
Furniture, Fixtures and Equipment 3-15 years
K. Capitalized Interest
Interest is capitalized during construction to Construction in Progress, and consists of interest expense on
certain borrowings in excess of interest earned on related investments acquired with the proceeds of
borrowings.
L. Compensated Absences
BCAD’s policy is to permit employees to accumulate vacation and sick leave. The cost of earned but unused
vacation is accrued as a liability in the period in which the leave is earned. A liability for earned but unused
sick leave is accrued only to the extent that the leave will result in cash payments at termination. At
September 30, 2007 and 2006, such amounts aggregate $3,434,000 and $3,507,000 respectively and are
included in other current and long term liabilities.
FINANCIAL
AVIATION DEPARTMENT - FY 2007 ANNUAL FINANCIAL REPORT I - 16
Notes to the Financial Statements
September 30, 2007 (Unaudited)
M. Deferred Revenues – Airline Fees and Charges
Deferred revenues represent revenues earned in excess of certain required deposits in accordance with the
Airline-Airport Lease and Use Agreement.
N. Capital Contributions
Capital contributions consist mainly of grants from Federal and State governments. They are recognized as
earned as related project costs are incurred.
O. Passenger Facility Charges
In 1990, Congress authorized domestic airports to impose a Passenger Facility Charge (PFC) on each
departing passenger. Subsequently, the Federal Aviation Administration (FAA) issued regulations for the
use and reporting of PFCs. Airports are authorized to use PFCs for projects that must meet at least one of the
following eligibility requirements: (1) preserve or enhance safety, security, or capacity of the national
transportation system; (2) reduce noise or reduce noise impacts resulting from an airport; or (3) furnish
opportunities for enhanced competition between or among carriers.
Effective January 1, 1995, the FAA authorized the Aviation Department to impose and use collected PFCs of
$3.00 per departing passenger at Fort Lauderdale - Hollywood International Airport (the Airport). In July
2005, the Airport received approval from the FAA to implement a $4.50 PFC effective October 1, 2005.
Through initial and subsequent FAA approvals, the Aviation Department is authorized to collect PFCs up to
$571.2 million, of which $333.4 million has been collected as of September 30, 2007. The net receipts from
PFCs are non-refundable and restricted to be used on FAA approved capital projects and debt service on
revenue bonds that fund approved PFC eligible projects. As of September 30, 2007, $232.7 million of the
collected PFCs had been spent on approved projects or debt service, and the remaining $100.7 million was
reflected in restricted net assets. The ticketing airline includes the departing PFC in the price of each ticket
when it is sold to the traveler. The $4.50 PFC collected by the airlines is remitted monthly to the Airport,
less an $0.11 per passenger administrative fee.
P. Pension Costs
BCAD participates in the Florida Retirement System (FRS), a cost sharing, multiple-employer Public
Employment Retirement System, which covers substantially all permanent full and part-time employees. The
FRS is non-contributory and is totally administered by the State of Florida. Benefits are computed on the
basis of age, average final compensation and service credit. Average final compensation is the average of the
five highest fiscal years of earnings. The FRS provides vesting of benefits after six years of creditable
service. Early retirement may be taken any time after vesting; however, there is a 5% benefit reduction for
each year prior to normal retirement age or date. The FRS also provides death and disability benefits. A State
Statute establishes benefits.
Notes to the Financial Statements

FINANCIAL
AVIATION DEPARTMENT - FY 2007 ANNUAL FINANCIAL REPORT I - 17
September 30, 2007 (Unaudited)
Q. Estimates
The preparation of financial statements in conformity with generally accepted accounting principles requires
management to make estimates and assumptions that affect certain reported amounts and disclosures.
Accordingly, actual results could differ from those estimates.
R. Reclassifications
Certain amounts in the prior year financial statements have been reclassified to conform to the current year
presentation.
NOTE 2 - CASH AND INVESTMENTS
The County maintains a pool for substantially all cash and investments. Each fund type’s portion of the pool
is displayed on the balance sheet as “cash and cash equivalents” or “restricted assets” as appropriate. BCAD
also maintains bond proceeds and debt service accounts with Wells Fargo Bank who in turn makes
investments. At September 30, 2007 and 2006, BCAD’s cash and investments consist of the following (in
thousands):

FINANCIAL
AVIATION DEPARTMENT - FY 2007 ANNUAL FINANCIAL REPORT I - 18
Notes to the Financial Statements
September 30, 2007 (Unaudited)
NOTE 3 - ACCOUNTS RECEIVABLE
Accounts Receivable consists of the following (in thousands):
NOTE 4 - RESTRICTED ASSETS
Restricted assets and reserves of BCAD at September 30, 2007 represent amounts designated for
construction and restricted for debt service, maintenance and improvements under the terms of outstanding
bond agreements and regulatory requirements. The construction accounts include bond proceeds available
for the design and construction of the major expansion projects. The bond reserve accounts contain the
maximum amount of required principal and interest requirement on all outstanding bonds in a subsequent
fiscal year. The principal and interest account contains the principal and interest amounts required for
payment due on October 1. The passenger facility charges account contains amounts collected, but unspent
and the airline fees and charges account contains remaining funds at year end after all required deposits were
made from the operating account. Other capital funds account contains amounts to be used for renewal and
replacement and improvements.
Assets were restricted for the following purpose (in thousands):

FINANCIAL
AVIATION DEPARTMENT - FY 2007 ANNUAL FINANCIAL REPORT I - 19
Notes to the Financial Statements
September 30, 2007 (Unaudited)
NOTE 5 - CAPITAL ASSETS
A summary of changes in capital assets for the years ended September 30, 2007 and 2006 is as follows (in
thousands):

FINANCIAL
AVIATION DEPARTMENT - FY 2007 ANNUAL FINANCIAL REPORT I - 20
Notes to the Financial Statements
September 30, 2007 (Unaudited)
NOTE 6 - LEASE AND CONCESSION AGREEMENTS
The following is a schedule by years of minimum future revenues on non-cancelable agreements:
Total minimum future revenues do not include contingent revenues that may be received under certain
concession leases on the basis of a percentage of the tenants’ gross revenue in excess of stipulated
minimums. Contingent revenues amounted to approximately $ 41.2 million and $37.1 million for the years
ended September 30, 2007 and 2006, respectively.

FINANCIAL
AVIATION DEPARTMENT - FY 2007 ANNUAL FINANCIAL REPORT I - 21
Notes to the Financial Statements
September 30, 2007 (Unaudited)
NOTE 7 - LONG-TERM LIABILITIES
A summary of long-term liability activity for the years ended September 30, 2007 and 2006 was as follows
(in thousands):

FINANCIAL
AVIATION DEPARTMENT - FY 2007 ANNUAL FINANCIAL REPORT I - 22
Notes to the Financial Statements
September 30, 2007 (Unaudited)
A schedule of debt maturities is as follows:
$17,166,000 Notes Payable to Florida Department of Transportation due in fiscal years 2009-2012, is a
non-interest bearing loan used to fund the terminal roadways capital project.
A description of the bonds is as follows:
$75,560,000 Airport System Revenue Refunding Bonds Series E, dated July 15, 1998 was issued for the
purpose of redeeming $75,000,000 Airport System Revenue Bonds, Series B.
$10,530,000 Airport System Revenue Bonds Series F, dated July 15, 1998 was issued to pay certain project
costs and issuance costs.
$63,515,000 Airport System Revenue Bonds Series G, dated December 16, 1998 were issued to pay costs of
the 1998 Project and to fund additional reserves , capitalized interest and issuance costs.
$126,670,000 Passenger Facility Charge/Airport System Revenue Convertible Lien Bonds Series H, dated
December 16, 1998 was issued for the purpose of funding the 1998 Project and issuance costs.
$41,855,000 Passenger Facility Charge/Airport System Revenue Convertible Lien Bonds Series I, dated
May 24, 2001 was issued to pay a portion of the costs of the 2001 PFC Project and issuance costs.
$285,155,000 Airport System Revenue Bonds Series J, dated May 24, 2001 was issued for the purpose of
funding the consolidated rental car and public parking facility, capitalized interest and issuance costs.
$87,360,000 Airport System Revenue Refunding Bonds Series K, dated July 2, 2003 was issued to redeem
$89,160,000 Airport System Revenue Refunding Bonds, Series C.

FINANCIAL
AVIATION DEPARTMENT - FY 2007 ANNUAL FINANCIAL REPORT I - 23
$142,015,000 Airport System Revenue Bonds Series L, dated October 22, 2005 was issued to pay for the
2004 Project, capitalized interest and issuance costs.
$105,225,000 Airport System Revenue Bonds, Series M, dated October 29, 2004 was issued to pay for the
2004 Project, fund the increase in Reserve Requirement, capitalized interest, and issuance costs.
NOTE 8 - CAPITAL CONTRIBUTIONS
Grants and other contributions used to acquire capital assets are classified as capital contributions in the
Statement of Revenues, Expenses and Changes in Net Assets. Capital contributions consisted of the
following at September 30, (in thousands):
NOTE 9 – AIRLINE-AIRPORT LEASE AND USE AGREEMENT
BCAD has entered into a 25-year Lease and Use agreement with its major airline tenants (signatory airlines)
whereby a residual rate setting methodology was established for the terminal complex and the airfield. The
Airline Agreements terminate on September 30, 2011. The agreements require that landing fees and terminal
rentals be reviewed annually and adjusted as necessary so that the total revenue is sufficient to meet BCAD’s
requirements as determined by the signatory airline agreements. At the end of the fiscal year, after all
required deposits have been made; any remaining excess funds are used to meet the requirements in the
following fiscal year. These excess funds have been recorded as deferred revenue by BCAD at September
30, 2007 and have been included in current liabilities payable from restricted assets. For the year ended
September 30, 2007, these funds amounted to $20,320,000.
NOTE 10 - COMMITMENTS AND CONTINGENT LIABILITIES
Federal and State of Florida grants are subject to audit by the granting agencies to determine if activities
comply with conditions of the grant. Management believes that no material liability will arise from any such
audits.
At September 30, 2007, BCAD had in process various uncompleted construction projects with remaining
balances totaling $77,850,000. The retainage payable on these contracts totaled $6,813,000. Funding of
these projects is to be made primarily through the proceeds of the related bond issues.
NOTE 11 - SUBSEQUENT EVENTS
None

SUPPLEMENTARY INFORMATION
AVIATION DEPARTMENT - FY 2007 ANNUAL FINANCIAL REPORT II - 1
Supplementary Information Locator Guide
September 30, 2007
Combining Statement of Net Assets...................................................................................................... II – 2
Combining Statement of Revenues, Expenses and Changes in Net Assets ........................................... II – 4
Combining Statements of Cash Flows .................................................................................................. II – 6
Debt Service Requirements to Maturity ................................................................................................ II – 8
Debt Service to Maturity by Series ....................................................................................................... II – 9 to 14
Deposits to and Withdrawals from Special Funds and Accounts Created by Airport Bond
Resolutions and The Airline-Airport Lease & Use Agreement ………………………………………II – 15
Airport System Revenue Bonds Debt Service Coverage ...................................................................... II – 16
Passenger Facility Charge Convertible Lien Bonds – Sufficiency Test ................................................ II – 17

SUPPLEMENTARY INFORMATION
AVIATION DEPARTMENT - FY 2007 ANNUAL FINANCIAL REPORT II - 2
COMBINING STATEMENT OF NET ASSETS
September 30, 2007
(in thousands)
(Unaudited)
Airport System
Operation and Airline Fees Renewal &
Maintenance and Charges Replacement Improvement
ASSETS Total Account Account Account Account
Current Assets:
Cash and Cash Equivalents 30,677$ 29,677$ 1,000$ -$ -$
Receivables (Net) 6,446 6,446 - - -
Inventory 319 319 - - -
Other Current Assets 3,715 3,715 - - -
Total Current Assets 41,157 40,157 1,000 - -
Restricted Assets:
Cash and Cash Equivalents 86,699 52,861 20,320 - -
Investments 382,048 38,695 - 26,138 3,101
Grant Receivables 10,753 - - 251 -
Total Restricted Assets 479,500 91,556 20,320 26,389 3,101
Fixed Assets:
Land and Improvements 282,797 282,797 - - -
Buildings & Facilities 1,093,465 1,093,465 - - -
Equipment 14,717 14,717 - - -
Construction in Progress 168,954 168,954 - - -
Total Fixed Assets (Gross) 1,559,933 1,559,933 - - -
Less Accumulated Depreciation (275,646) (275,646) - - -
Total Fixed Assets (Net) 1,284,287 1,284,287 - - -
Other Assets:
Deferred Bond Issuance Cost 9,147 9,147 - - -
Total Assets 1,814,091$ 1,425,147$ 21,320$ 26,389$ 3,101$
LIABILITIES AND NET ASSETS
Liabilities:
Current Liabilities:
Vouchers Payable and Accrued Liabilities 25,881 25,881 - - -
Other Current Liabilities 3,172 3,172 - - -
Total Current Liabilities 29,053 29,053 - - -
Current Liabilities Payable from Restricted Assets:
Vouchers Payable and Accrued Liabilities 15,126 - - 676 17
Accrued Interest Payable 19,618 19,618 - - -
Revenue Bonds Payable 35,875 35,875 - - -
Deferred Revenue-Airline Fees and Charges 20,320 - 20,320 - -
Total Current Liabilities Payable from Restricted Assets 90,939 55,493 20,320 676 17
Long Term Liabilities:
Revenue Bonds Payable 797,850 622,264 - - -
Notes Payable 17,166 - - - -
Other Long Term Liabilities 9,690 7,895 - - -
Total Long Term Liabilities 824,706 630,159 - - -
Total Liabilities 944,698 714,705 20,320 676 17
Net Assets:
Invested in Capital Assets, Net of Related Debt 634,423 634,423 - - -
Restricted:
Debt Service 55,024 55,024 - - -
Passenger Facility Charge 100,704 - - - -
Capital Projects 57,247 - - 25,713 3,084
Total Restricted 847,398 689,447 - 25,713 3,084
Unrestricted 21,995 20,995 1,000 - -
Total Net Assets 869,393 710,442 1,000 25,713 3,084
Total Liabilities and Net Assets 1,814,091$ 1,425,147$ 21,320$ 26,389$ 3,101$

SUPPLEMENTARY INFORMATION
AVIATION DEPARTMENT - FY 2007 ANNUAL FINANCIAL REPORT II - 3
Facilities Passenger
Improvement & Restricted Facility
Development Discretionary Asset Charges Construction
Account Account Account Account Account
-$ -$ -$ -$ -$
- - - - -
- - - - -
- - - - -
- - - - -
7,586 - 5,932
10,058 13,298 1,441 100,704 188,613
5,444 - 93 - 4,965
23,088 13,298 1,534 100,704 199,510
- - - - -
- - - - -
- - - - -
- - - - -
- - - - -
- - - - -
- - - - -
- - - - -
23,088$ 13,298$ 1,534$ 100,704$ 199,510$
- - - - -
- - - - -
- - - - -
4,097 - 83 - 10,253
- - - - -
- - - - -
- - - - -
4,097 - 83 - 10,253
- - - - 175,586
- - - - 17,166
- - - - 1,795
- - - - 194,547
4,097 - 83 - 204,800
- - - - -
- - - - -
- - - 100,704 -
18,991 13,298 1,451 - (5,290)
18,991 13,298 1,451 100,704 (5,290)
- - - - -
18,991 13,298 1,451 100,704 (5,290)
23,088$ 13,298$ 1,534$ 100,704$ 199,510$

SUPPLEMENTARY INFORMATION
AVIATION DEPARTMENT - FY 2007 ANNUAL FINANCIAL REPORT II - 4
Airport System
Operation and Airline Fees Renewal &
Maintenance and Charges Replacement Improvement
Total Account Account Account Account
Operating Revenue:
Concessions 41,282$ 41,282$ -$ -$ -$
Parking 42,463 42,463 - - -
Terminal Rents and Charges 35,550 35,550 - - -
Airfield Fees and Charges 15,151 15,151 - - -
Building and Ground Rentals 35,626 35,626 - - -
Miscellaneous Fees 1,259 1,259 - - -
Total Operating Revenue 171,331 171,331 - - -
Operating Expenses Before Depreciation:
Personal Services 26,977 26,977 - - -
Contractrual Services 73,917 73,383 - 329 104
Other 25,003 25,003 - - -
Capital Outlay - - - 3,771 395
Total Expenses Before Depreciation 125,897 125,363 - 4,100 499
Operating Income Before Depreciation 45,434 45,968 - (4,100) (499)
Depreciation 34,228 34,228 - - -
Operating Income 11,206 11,740 - (4,100) (499)
Non-Operating Income (Expense):
Federal & State Grants 1,618 1,618 - - -
Passenger Facility Charges 45,526 - - - -
Interest Income 25,503 6,889 - 1,053 153
Interest Expense (41,627) (41,627) - - -
Amortization of Bond Issuance Cost (817) (817) - - -
Gain (Loss) on Disposal of Asset 6 6 - - -
Other Non-Operating (130) (130) - - -
Total Non-Operating Income 30,079 (34,061) - 1,053 153
Net Income Before Contributions and Transfers 41,285 (22,321) - (3,047) (346)
Capital Contributions 13,941 - - 747 25
Oper. Transfer In (Out) from Operating and Maint. Acct. 55,297 23,913 - 6,200 547
Oper. Transfer In (Out) from Airlines Fees & Charges Acct. - - - - -
Oper. Transfer In (Out) from Passenger Fac. Charges Acct. (55,297) (7,497) - (1,000) -
Oper. Transfer In (Out) From Construction Account - - - - -
Change in Net Assets 55,226 (5,905) - 2,900 226
Total Net Assets, Beginning of period 814,167 648,557 14,000 30,035 4,170
Total Net Assets, End of period 869,393$ 642,652$ 14,000$ 32,935$ 4,396$
September 30, 2007
(In Thousands)
(Unaudited)
COMBINING STATEMENT OF REVENUES, EXPENSES AND CHANGES IN NET ASSETS

SUPPLEMENTARY INFORMATION
AVIATION DEPARTMENT - FY 2007 ANNUAL FINANCIAL REPORT II - 5

SUPPLEMENTARY INFORMATION
AVIATION DEPARTMENT - FY 2007 ANNUAL FINANCIAL REPORT II - 6
Airport System
Operation and Airline Fees Renewal &
Maintenance and Charges Replacement Improvement
Total Account Account Account Account
Cash Flows from Operating Activities:
Cash Received from Customers 167,999$ 171,117$ (3,118)$ -$ -$
Cash Payments to Suppliers for Goods and Services (97,881) (97,347) - (329) (104)
Cash Payments to Employees for Services (26,255) (26,255) - - -
Net Cash Provided by (Used for) Operating Activities 43,863 47,515 (3,118) (329) (104)
Cash Flows from Noncapital Financing Activities:
Grants 1,618 1,618 - - -
Operating Transfers In 23,887 (7,497) - 6,200 547
Operating Transfers Out (23,887) 23,913 - (1,000) -
Net Cash Provided by (Used for) Noncapital Financing Activities 1,618 18,034 - 5,200 547
Cash Flows from Capital and Related Financing Activities:
Loan Proceeds - - - - -
Acquisition and Construction of Property, Plant and Equipment (87,412) - - (3,771) (395)
Proceeds from Sale of Assets 131 131 - - -
Debt Principal Payment (34,245) (34,245) - - -
Interest and Fiscal Charges (42,389) (42,389) - - -
Capital Contribution 18,710 - - - -
Receipt of Passenger Facility Charges 45,526 - - - -
Net Cash Provided by (Used for) Capital and Related Financing Activities (99,679) (76,503) - (3,771) (395)
Cash Flows from Investing Activities:
Purchase of Investment Securities (550,150) - - - -
Proceeds from Sale and Maturities of Investment Securities 615,502 - - - -
Interest and Dividends on Investments 25,503 6,889 - 1,053 153
Net Cash Provided by (Used for) Investing Activities 90,855 6,889 - 1,053 153
Net Increase (Decrease) in Cash and Cash Equivalents 36,657 (4,065) (3,118) 2,153 201
Cash and Cash Equivalents, Beginning of Period 80,719 38,219 14,000 - -
Cash and Cash Equivalents, End of Period 117,376 34,154 10,882 2,153 201
Cash and Cash Equivalents in Current Assets 30,677 29,677 1,000 - -
Cash and Cash Equivalents in Restricted Assets 86,699 52,861 20,320 - -
Total Cash and Cash Equivalents (Above) 117,376$ 82,538$ 21,320$ -$ -$
Reconciliation of Operating Income to Net Cash Provided by
(Used for) Operating Activities:
Operating Income (Expense) 11,206$ 11,740$ -$ (329)$ (104)$
Adjustments to Reconcile Operating Income to Cash Flows from Operating Activities:
Depreciation Expense 34,228 34,228 - - -
Miscellaneous Non-Operating Income (130) (130) - - -
Changes in Assets and Liabilities:
(Increase) Decrease in Accounts Receivable (3) (3) - - -
(Increase) Decrease in Inventory - - - - -
(Increase) Decrease in Other Current Assets (1,370) (1,370) - - -
Increase (Decrease) in Vouchers Payable and Accrued Liabilities (635) 2,483 (3,118) - -
Increase (Decrease) in Other Current Liabilities 567 567 - - -
Net Adjustments 32,657 35,775 (3,118) - -
Net Cash Provided by (Used for) Operating Activities 43,863$ 47,515$ (3,118)$ (329)$ (104)$
(in thousands)
(Unaudited)
COMBINING STATEMENT OF CASH FLOWS
September 30, 2007

SUPPLEMENTARY INFORMATION
AVIATION DEPARTMENT - FY 2007 ANNUAL FINANCIAL REPORT II - 7
Facilities Passenger
Improvement & Restricted Facility
Development Discretionary Asset Charges Construction
Account Account Account Account Account
-$ -$ -$ -$ -$
(78) - (23) - -
- - - - -
(78) - (23) - -
- - - - -
1,016 - 1,000 22,621
- - - (46,800) -
1,016 - 1,000 (46,800) 22,621
- - - - -
(19,368) - (2,555) - (61,323)
- - - - -
- - - - -
- - - - -
- - - - 18,710
- - - 45,526 -
(19,368) - (2,555) 45,526 (42,613)
- - - - (550,150)
- - - - 615,502
809 693 14 5,660 10,232
809 693 14 5,660 75,584
(17,621) 693 (1,564) 4,386 55,592
- - - - 28,500
(17,621) 693 (1,564) 4,386 84,092
- - - - -
7,586 - - - 5,932
7,586$ -$ -$ -$ 5,932$
(78)$ -$ (23)$ -$ -$
- - - - -
- - - - -
- - - - -
- - - - -
- - - - -
- - - - -
- - - - -
- - - - -
(78)$ -$ (23)$ -$ -$

SUPPLEMENTARY INFORMATION
AVIATION DEPARTMENT - FY 2007 ANNUAL FINANCIAL REPORT II - 8

SUPPLEMENTARY INFORMATION
AVIATION DEPARTMENT - FY 2007 ANNUAL FINANCIAL REPORT II - 9

SUPPLEMENTARY INFORMATION
AVIATION DEPARTMENT - FY 2007 ANNUAL FINANCIAL REPORT II - 10

SUPPLEMENTARY INFORMATION
AVIATION DEPARTMENT - FY 2007 ANNUAL FINANCIAL REPORT II - 11

SUPPLEMENTARY INFORMATION
AVIATION DEPARTMENT - FY 2007 ANNUAL FINANCIAL REPORT II - 12

SUPPLEMENTARY INFORMATION
AVIATION DEPARTMENT - FY 2007 ANNUAL FINANCIAL REPORT II - 13

SUPPLEMENTARY INFORMATION
AVIATION DEPARTMENT - FY 2007 ANNUAL FINANCIAL REPORT II - 14

SUPPLEMENTARY INFORMATION
AVIATION DEPARTMENT - FY 2007 ANNUAL FINANCIAL REPORT II - 15
SCHEDULE OF DEPOSITS TO AND WITHDRAWALS FROM SPECIAL FUNDS AND ACCOUNTS
CREATED BY AIRPORT BOND RESOLUTIONS AND THE AIRLINE-AIRPORT LEASE & USE AGREEMENT
For The Twelve Months Ended September 30, 2007
(in thousands)
(Unaudited)
Balances Balances
Oct. 1, 2006 Deposits Withdrawals Sept.30, 2007
Restricted Accounts/Funds
Bond Debt Service Accounts/Funds:
Series E and F Principal and Interest 3,131$ 5,209$ 5,109$ 3,231$
Series G Principal and Interest 3,157 5,598 4,329 4,426
Series H Principal and Interest 6,793 9,305 9,028 7,070
Series I Principal and Interest 2,000 3,020 2,945 2,075
Series J Principal and Interest 13,976 22,695 21,948 14,723
Series K Principal and Interest 17,589 18,699 17,830 18,458
Series L Principal and Interest 7,554 10,734 10,466 7,822
Series M1 & M2 Principal and Interest 2,343 5,672 7,565 450
Bond Reserves 49,855 2,407 0 52,262
Total Bond Debt Service Accounts/Funds 106,398 83,339 79,220 110,517
Capital Construction Accounts/Funds:
Construction Funds 193,300 55,609 73,323 175,586
Renewal and Replacement 23,812 8,000 5,674 26,138
Discretionary 12,611 692 7 13,296
Facilities Improvements and Development 26,002 15,297 23,655 17,644
Restricted Assets-North Perry 1,085 3,017 2,661 1,441
Improvements 2,923 724 546 3,101
Passenger Facilities Charges 96,318 51,186 46,800 100,704
Total Capital Construction Accounts/Funds 356,051 134,525 152,666 337,910
Airline Fees and Charges Sub-Account 23,438 20,320 23,438 20,320
Total Restricted Accounts/Funds 485,887$ 238,184$ 255,324$ 468,747$
Restricted Account Balances:
Cash and Cash Equivalents 38,487$ 86,699$
Investments 447,400 382,048
Total Restricted Accounts/Funds (As Above) 485,887 468,747
Revenue Account 42,232 206,757 218,312 - 30,677
Total Cash, Cash Equivalents and Investments 528,119$ 444,941$ 473,636$ 499,424$
Note:
All ending balances include accrued interest

SUPPLEMENTARY INFORMATION
AVIATION DEPARTMENT - FY 2007 ANNUAL FINANCIAL REPORT II - 16
SUPPLEMENTARY INFORMATION
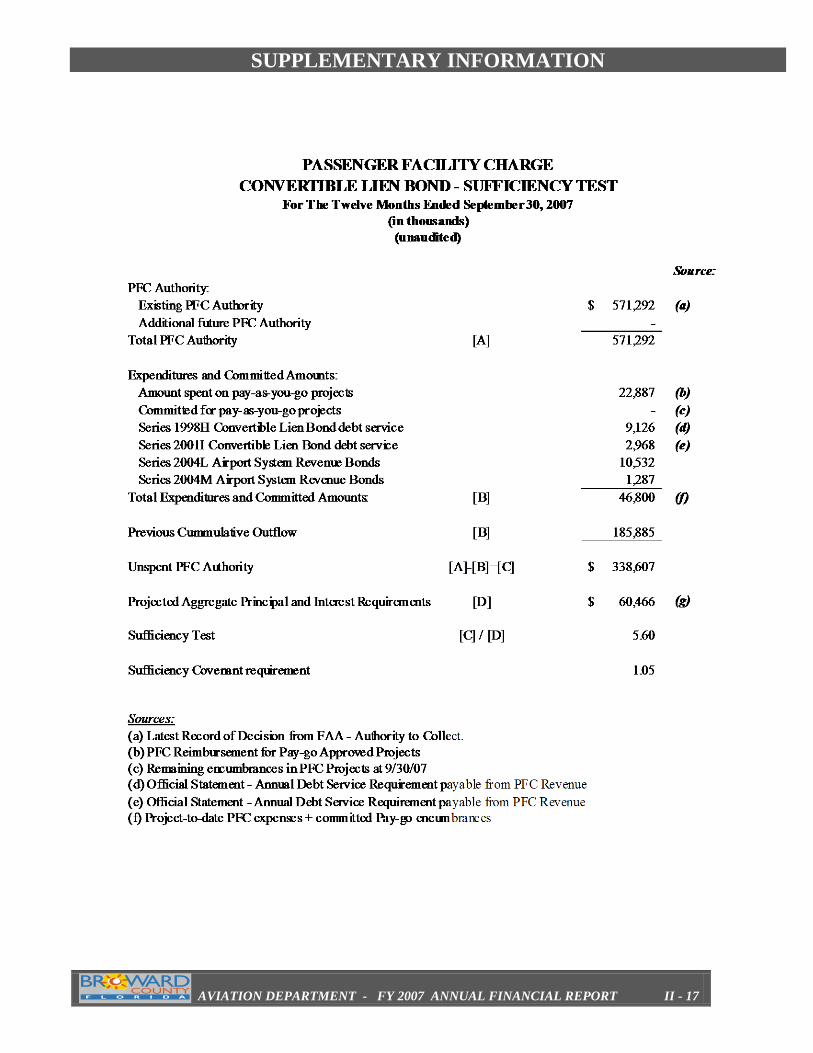
AVIATION DEPARTMENT - FY 2007 ANNUAL FINANCIAL REPORT II - 17

STATISTICS
AVIATION DEPARTMENT - FY 2007 ANNUAL FINANCIAL REPORT III - 1

STATISTICS
AVIATION DEPARTMENT - FY 2007 ANNUAL FINANCIAL REPORT III - 2

STATISTICS
AVIATION DEPARTMENT - FY 2007 ANNUAL FINANCIAL REPORT III - 3

STATISTICS
AVIATION DEPARTMENT - FY 2007 ANNUAL FINANCIAL REPORT III - 4

STATISTICS
AVIATION DEPARTMENT - FY 2007 ANNUAL FINANCIAL REPORT III - 5

STATISTICS
AVIATION DEPARTMENT - FY 2007 ANNUAL FINANCIAL REPORT III - 6
STATISTICS
AVIATION DEPARTMENT - FY 2007 ANNUAL FINANCIAL REPORT III - 7

STATISTICS
AVIATION DEPARTMENT - FY 2007 ANNUAL FINANCIAL REPORT III - 8

STATISTICS
AVIATION DEPARTMENT - FY 2007 ANNUAL FINANCIAL REPORT III - 9
STATISTICS
AVIATION DEPARTMENT - FY 2007 ANNUAL FINANCIAL REPORT III - 10

STATISTICS
AVIATION DEPARTMENT - FY 2007 ANNUAL FINANCIAL REPORT III - 11

STATISTICS
AVIATION DEPARTMENT - FY 2007 ANNUAL FINANCIAL REPORT III - 12

STATISTICS
AVIATION DEPARTMENT - FY 2007 ANNUAL FINANCIAL REPORT III - 13
STATISTICS
AVIATION DEPARTMENT - FY 2007 ANNUAL FINANCIAL REPORT III - 14

STATISTICS
AVIATION DEPARTMENT - FY 2007 ANNUAL FINANCIAL REPORT III - 15

STATISTICS
AVIATION DEPARTMENT - FY 2007 ANNUAL FINANCIAL REPORT III - 16

STATISTICS
AVIATION DEPARTMENT - FY 2007 ANNUAL FINANCIAL REPORT III - 17

STATISTICS
AVIATION DEPARTMENT - FY 2007 ANNUAL FINANCIAL REPORT III - 18

STATISTICS
AVIATION DEPARTMENT - FY 2007 ANNUAL FINANCIAL REPORT III - 19

STATISTICS
AVIATION DEPARTMENT - FY 2007 ANNUAL FINANCIAL REPORT III - 20

STATISTICS
AVIATION DEPARTMENT - FY 2007 ANNUAL FINANCIAL REPORT III - 21

STATISTICS
AVIATION DEPARTMENT - FY 2007 ANNUAL FINANCIAL REPORT III - 22

STATISTICS
AVIATION DEPARTMENT - FY 2007 ANNUAL FINANCIAL REPORT III - 23

STATISTICS
AVIATION DEPARTMENT - FY 2007 ANNUAL FINANCIAL REPORT III - 24
STATISTICS
AVIATION DEPARTMENT - FY 2007 ANNUAL FINANCIAL REPORT III - 25

STATISTICS
AVIATION DEPARTMENT - FY 2007 ANNUAL FINANCIAL REPORT III - 26
Market of Origin or Destination1
Air Miles from
FLL % Share
New York 21.1%
John F Kennedy 1,069 6.2%
La Guardia 1,076 7.8%
Newark Intl 1,065 5.9%
Islip (MacArthur 1,093 1.1%
Washington D.C./Baltimore 5.9%
Baltimore/Wash Int'l 925 2.6%
Dulles Intl 901 1.5%
Ronald Reagan Nt 899 1.8%
Chicago 4.4%
O'Hare Intl 1,168 2.6%
Chicago Midway 1153 1.8%
Other Cities
Boston 1,237 5.9%
Philadelphia Int 992 3.6%
Atlanta 581 3.5%
Detroit 1,127 2.5%
Los Angeles Intl 2,316 2.2%
Tampa Intl 197 2.0%
Las Vegas 2,174 1.7%
San Juan, P.R. 1,046 1.6%
Dallas/Ft Wor In 1,114 1.6%
Jacksonville Int 318 1.5%
Hartford 1,173 1.4%
Denver Intl 1,700 1.4%
Orlando Intl 178 1.1%
Pittsburgh Intl 994 1.1%
Charlotte 625 1.0%
Nashville 793 1.0%
Providence 1,188 1.0%
Phoenix 1,969 1.0%
Cleveland 1,062 1.0%
St. Louis 1,058 0.9%
Houston 951 0.8%
Atlantic Cty Int 977 0.8%
Indianapolis 1,005 0.8%
Cities Listed 70.8%
All Others 29.2%
Total 100.0%
DOMESTIC PASSENGER ORIGIN-DESTINATION MARKETS
Fort Lauderdale-Hollywood International Airport
For the 12 months ended September, 30 2007
______________
(1) Markets with 1.0 percent or more of total inbound and outbound domestic passengers on scheduled airlines at the
Airport on the basis of a 10 percent sample for the 12 months ended September 30, 2007.

STATISTICS
AVIATION DEPARTMENT - FY 2007 ANNUAL FINANCIAL REPORT III - 27
SCHEDULED AIRLINES
STATISTICS
AVIATION DEPARTMENT - FY 2007 ANNUAL FINANCIAL REPORT III - 28
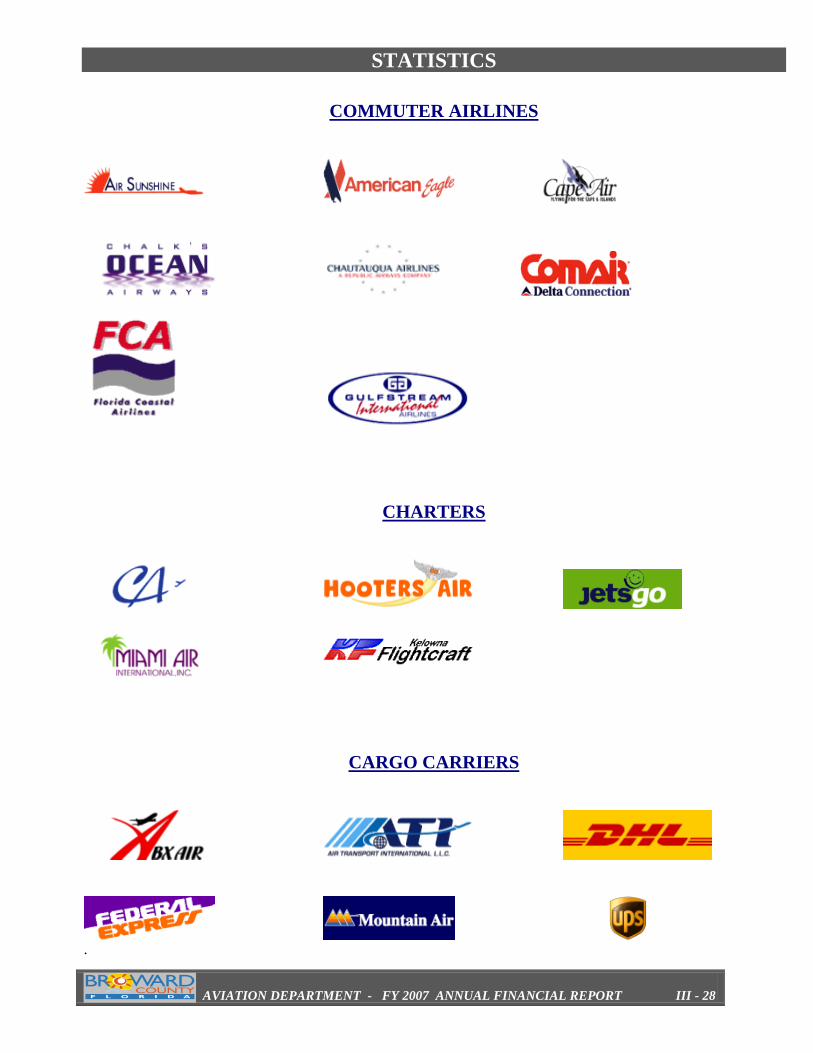
COMMUTER AIRLINES
CHARTERS
CARGO CARRIERS
.

STATISTICS
AVIATION DEPARTMENT - FY 2007 ANNUAL FINANCIAL REPORT III - 29

STATISTICS
AVIATION DEPARTMENT - FY 2007 ANNUAL FINANCIAL REPORT III - 30

STATISTICS
AVIATION DEPARTMENT - FY 2007 ANNUAL FINANCIAL REPORT III - 31
STATISTICS
AVIATION DEPARTMENT - FY 2007 ANNUAL FINANCIAL REPORT III - 32

STATISTICS
AVIATION DEPARTMENT - FY 2007 ANNUAL FINANCIAL REPORT III - 33