AVENTUS GROUP
102
Annual report 2020
Transcript of AVENTUS GROUP

Annual report2020
AV
EN
TU
S G
RO
UP
AN
NU
AL R
EP
OR
T 2020

For more information visit aventusgroup.com.au
Australia’s home & lifestyle destination
Contents
About the Group 02From the Chairman and CEO 06Our Portfolio 12Sustainability 14Board of Directors 16Financial Report 18
Hills Super Centre, Castle Hill NSW
AVENTUS HOLDINGS LIMITED ACN 627 640 180AVENTUS CAPITAL LIMITED ACN 606 555 480As responsible entity for the AVENTUS RETAIL PROPERTY FUND ARSN 608 000 764 Australian Financial Services Licence No. 478061 www.aventusgroup.com.au

1. All metrics as at 30 Jun 2020
2. For the 12 months ended 30 Jun 2019
3. ICR is calculated EBITDA divided interest expense
4. Excludes Caringbah ground level given development works currently in progress
5. Percentage by GLA
87%Established National Tenants5
98%Consistently High Occupancy4
5.2xInterest Cover Ratio3
from 4.7x2
Portfolio Performance1
Financial Management1
36%Gearing 2.7% from 38.7%
$100mFFO 4.2% from $96m2
29%Diversity of Income from Top 10 Tenants
Stage 1 Complete
CaringbahDevelopment
Established Since Listing
1st PropertySyndicate
FY20 Highlights
Annual Report 2020 Aventus Group 01
Page 10
Page 11
Caringbah Super Centre, Caringbah NSW

About the Group
Our Mission and Objective
To be the leading Large Format Retail (LFR) pure‑play landlord in Australia by consolidating the highly fragmented LFR sector through portfolio management, development and selective acquisitions.
To provide Securityholders with stable, secure and growing income returns and potential for capital growth through selective acquisitions and value enhancing development opportunities.
Australia’s Home and Lifestyle Destination
Aventus has built a reputation for strong financial performance underpinned by a focus on Large Format Retail (LFR) to help Australians transform their homes and lifestyles.
Led by a trusted team of industry experts, we harness market insights and retail relationships to reinforce our leadership position in the face of remarkable new challenges.
At the heart of this effort is the pride we take in the Aventus Way: our values and a culture of continuous improvement to create amazing places for customers and retailers.
It is instrumental to our Core Purpose: “To create amazing places where people can transform their home and lifestyle”
At Aventus, our purpose is to create amazing places where people can transform their home and lifestyle.
This purpose underlines why the Aventus team is focused on, and driven by, doing all things possible to deliver this to our customers, alongside our retail partners.
Underpinning this objective is how we use our values as a team to deliver on our core purpose – but also is our promise to each other, on how we behave and act, and towards all our stakeholders.
Own It We are hands on, proud yet humble, and accountable
Do It Now We act with urgency and without fuss
HungryWe have the passion, energy and stamina to make a difference and achieve our goals
Customer FocusedWe exist to inspire and add value for our customers
Find a Better WayContinuous improvement is in our DNA
Got Your BackWe respect each other and tell it like it is
Our Core Values devised by the Aventus team and introduced in 2017
The Aventus Way
02

Hills Super Centre, Castle Hill NSW
Hills Super Centre, Castle Hill NSW
Annual Report 2020 Aventus Group 03
About the Group
Hills Super Centre, Castle Hill NSW
To create amazing places where people can transform their home and lifestyle
Our Core Purpose

Aventus prides itself on being proactive, hands on and visible and wants to redefine t he f uture of retail property.
The Aventus Retail Property Group (the Group) (ARSN 608 000 764 was listed on the Australian Securities Exchange (“ASX”) on 16 October 2015 and invests in Australian retail property, focusing predominantly on Large Format Retail (LFR) centres. On 1 October 2018, the securities in the Group were stapled to Aventus Holdings Limited shares to create the Aventus Group (AVN, Aventus or the Group).
Aventus is an Australian success story built on dedication, ambition and innovation.
Since 2004, we have been at the forefront of a relentless effort to create amazing places and inspiring shopping experiences where people can transform their home and lifestyle.
Further, Aventus continues to strengthen Large Format Retail (LFR) model to be the foundation of strong financial performance and the springboard to redefine the future of retail property.
The LFR property sector is a substantial component of the Australian retail property sector and accounts for approximately 25% of all retail sales in Australia.
As at 30 June 2020, the Group owned 20 LFR centres in NSW, QLD, VIC, SA and WA valued at approximately $2 billion.
The Group portfolio is diversified by tenant base, with national retailers representing 87% of the total Portfolio by GLA. Over 76% of gross annual income is subject to annual fixed rent increases. The AVN portfolio has minimal exposure to turnover‑based leases which mitigate against the risk of a downturn in retail sales.
The Fund is managed by Aventus Capital Limited (ACL or the Company) (ACN 606 555 480) (AFSL No. 478061) which was appointed under the Group’s constitution and operates under an Australian Financial Services Licence.
Legacy
A Proven Track Record
5 years listed on the ASX and strong financial performance and 17 years industry experience owning, managing and developing LFR
Culture
Champions of the Aventus Way
A proud history of innovation to create amazing places
Ambition
A Plan for the Future
A unique LFR model with remarkable growth opportunities
Leadership
Experienced and Trusted
Respected industry experts providing continuity and vision
tint
04

The Four Pillars of the Aventus Strategy1
Aventus continues to deliver on its four key growth initiatives, driving sustainable earnings growth and creating long‑term value.
Development Pipeline
> Acquisition of adjoining Epping development sitefor $11.5m
> $110m+ invested across more than 23 developmentprojects with an average cash yield of 9%6
> $34m transformation of Sydney asset, CaringbahSuper Centre, underway with expected completionin Nov 2020
> Unlock 1.2m sqm land bank with current sitecover ratio of only 44%
Capital Management
> Increase interest cover ratio to 5.2x
> No debt expiring before May 2022
> Successful Distribution Reinvestment Plan (“DRP”)raised $49m of equity during FY20
> Establishment of Aventus Property Syndicate 1recycles capital and broadens the group’s incomestream by creating external funds managementfee income
> Achieved consistently high average occupancy of 98%2
> Everyday‑needs category remains robust at 37% ofportfolio by gross income
> Focus on partnering with leading retailers of which87%3 are national tenants
> Creating opportunities for incremental income e.g.signage, solar and storage
Driving Asset Performance
> Leading market share of 22% of dominantLarge Format Retail (“LFR”) centres4
> $820m of capital transactions5 since IPO including9 acquisitions and 3 divestments
> Establishment of funds management platformwith first property syndicate since listing in FY16
Consolidation Opportunities and Funds Management
1. All figures reported since IPO in Oct 2015
2. Excludes Caringbah ground level given development works currently in progress
3. Percentage by GLA
4. For LFR centres >25,000 sqm. Source: Deep End Services as at 1 Aug 2019; by GLA (excl. the former Masters Home Improvement tenancy)
5. Including the Kaufland Epping Acquisition settled in July 2020
6. Based on income producing development projects since Oct 2015
tint
Annual Report 2020 Aventus Group 05
About the Group

tint
FY20 was an extraordinary year and, in many ways, a year of 2 halves: with strong momentum in the first half and the COVID‑19 global pandemic impacting all areas of our lives in the second, especially how we work, learn and entertain.
At Aventus, we were incredibly proud of our team and how our experience and culture combined to respond quickly and decisively to the challenges that presented themselves in the final quarter of the financial year. This was an unprecedented challenge that required immediately assessing and taking the necessary steps to protect our financial strength, responding and supporting our impacted retailers, reducing our operating expenses and acting quickly with new initiatives to lessen the financial impact to our stakeholders, and safeguard the economic viability of the Group.
It is also a period to identify new opportunities and for the Aventus Group to adapt and further develop the strength of our portfolio.
Our Response to the COVID Pandemic
In March 2020, the Australian government’s response to the pandemic through restrictions on certain retail operations and other businesses, and the introduction of social distancing and travel restrictions saw the business and retail landscape shift rapidly. The government‑imposed restrictions, including store closures and distancing rules, impacted many stores in the portfolio.
Our centre teams have remained on site throughout the entire pandemic period and we quickly introduced many measures to support the health and safety of our retailers, customers and visitors. This commitment continues.
We also extended confidential and free access to financial and counselling services to all our retailers during this time.
The Board met weekly through the period, and the Leadership team met daily as the circumstances unfolded to be able to lead and manage their teams and the initiatives we introduced to respond to the consequences of the pandemic in a swift and unified way.
On behalf of the Directors of Aventus Holdings Limited (AHL) and Aventus Capital Limited (ACL), the responsible entity of Aventus Retail Property Fund (the Group), we are proud to present the Group’s Annual Report, including the audited financial statements, for the year ended 30 June 2020.
Bruce CarterChairman
Darren HollandCEO
tint
From the Chairman and CEO
06

tint
Further, as detailed in the Remuneration Report, all Board members and the Leadership team elected to reduce their fees and salaries for the period from April to June 2020. The broader team moved to reduced or flexible hours and we are very grateful for the team’s ongoing commitment throughout this period as it has been an extremely challenging time.
Each team also had daily Zoom meetings that aligned them, and all team members regularly checked in with others to keep a sense of connection with one another during this time.
Supporting our Retail Partners
One of our first responses in late March was the roll‑out of dedicated Click & Collect spaces in 100% of our centres to support the retailers and their customers as they adapted to new shopping habits.
Approximately half of our tenant base requested rent relief and we adopted the principles set out on the Mandatory Code of Conduct (Code) to provide support to our impacted retailers who qualified under the participation terms of the Code. Of these, as at 30 June 2020, we reached agreements with 86%, equivalent to $6m or 4% of annual rent. On costs, we established a dedicated team to focus on reducing non‑essential costs with the intention of passing any savings to our retailers.
We also negotiated a number of agreements with national tenants outside of the Code, in which we provided short‑term rent relief in exchange for lease extensions (38 extensions agreed) on existing terms or brand‑new stores in our portfolio.
Unfortunately, as at the date of writing, Victoria remains under government mandated restrictions and the Aventus team continues to work closely with our retail partners there.
Pleasingly, despite the challenges and closures brought on by the pandemic, overall Aventus centres attracted approximately 42 million people this year, which is a million more visitors than last year.
Traffic, excluding Victoria, has increased to above pre‑COVID‑19 levels of +9% across the portfolio over the past three months from June, showing the sustained attraction of shopping in an Aventus centre. Pleasingly, 100% of all retailers at Aventus centres, excluding Victoria, are open and trading.
Focus on Strategy
The challenge presented this financial year has also re‑affirmed our strategy to focus on sustainable earnings growth and on creating long‑term value.
During the height of the pandemic period, we continued to execute our strategy by:
> delivering the first stage of our Caringbah development in Sydney;
> acquiring the adjoining development site in Epping, Melbourne for $11.5 million which expands the site size by 53%; and
> establishing our first retail property syndicate in McGraths Hill, Sydney.
From the Chairman and CEO
tint
Annual Report 2020 Aventus Group 07

Creating and Managing Safe and Convenient Centres
Portfolio is well positioned with flexible spaces and Click & Collect in all centres
Ease of Access and Safety
75% externalExternal Centres by Number
Large Store Size
910 sqmAverage Store Size GLA
Convenient and Ample On‑Grade Parking
13,410 spacesTotal Portfolio Car Spaces
Portfolio Results
We are extremely proud and grateful to the entire Aventus team for their ability to accept, adapt and then to accelerate over the last quarter of FY20.
We remain focused on creating amazing places where people can transform their home and lifestyle and with Australians spending more time in their homes than ever before, our retailers and centres are well placed to receive the benefit of the changes to how we work, learn and entertain.
We believe that the COVID‑19 crisis has once again demonstrated the distinction between Large Format Retail (LFR) and traditional retail. Our diversified and robust tenancy mix is well placed to benefit from the recent household shift to working, learning and entertaining from home.
The features of Aventus centres: on‑grade, convenient car parking; easy access from main roads; large, flexible tenancies; low rents and sustainable occupancy costs, appeal to tenants and shoppers alike, now more than ever.
Our performance in terms of traffic, stores open, and rent collection are a testament to the fact that not all retail is created equal.
Key Portfolio Results Include:
> Strong rent collection of 87% through the COVID‑19 Period2;
> High occupancy of 98% maintained, with minimal holdovers of approximately 2%;
> 100% of all retailers at Aventus centres, excluding Victoria, are open and trading;
> Active leasing management with 90 leases negotiated across 80,600 sqm of GLA with positive leasing spreads and low incentives3
> High exposure to established national tenants, which comprise 87% of the portfolio by GLA;
> All leases in the portfolio include annual rent reviews, over 76% of leases contain fixed annual increases.
Highlands Hub, Mittagong NSW
08

Capital Management
The Group also reported a solid financial outcome this year despite the very challenging environment resulting from COVID‑19 and the measures to contain it. In response, we moved quickly to reduce costs to counter lower rental collection in the last quarter of FY20.
Furthermore, we delayed all non‑core capital expenditure, and combined with a lower distribution pay‑out ratio, this has enabled us to preserve the liquidity of the Group. These initiatives, together with work done by the team to maintain the operational momentum of the portfolio and our active capital management going into the pandemic, has meant that Aventus was relatively well placed to absorb the initial impact of COVID‑19.
Key Financial Results Include:
> Funds from Operations (FFO) of $100 million, an increase of 4.2% on FY19, or 18.2 cents per security;
> Statutory Profit of $57 million;
> Net Tangible Asset per security of $2.14 and Net Asset Value per security of $2.41;
> Distributions of 11.9 cents per security;
> Establishment of third party funds management platform with the successful launch of the Aventus Property Syndicate 1 (APS1);
> Gearing reduced 2.7% to 36%, within self‑imposed target range of 30% – 40%;
> Weighted average debt maturity of 3.1 years and weighted average cost of debt reduced to 3.1%;
> Interest Cover Ratio increased to 5.2x, an increase from 4.7x in FY19 and well above covenant requirement of 2.0x; and
> Preserved $121 million in liquidity and no debt expiries until 2022.
We are well positioned to weather the economic challenges, achieving our near‑term goals and focusing on our long‑term objectives, however, due to the uncertainty around COVID‑19, Aventus has not provided FY21 guidance at this time.
From the Chairman and CEO
Valuations
The Weighted Average Capitalisation Rate (WACR) of 6.7% has remained stable for the past three years. For the FY20 period, independent valuations encompassed 38% of the portfolio by value. The resulting net devaluation of $37.3 million primarily reflected the impact of COVID‑19, which accounted for 66% of the valuation change. This devaluation represents a net valuation change of ‑1.9% from 30 June 2019, which, in the context of total valuation uplifts over the last three years of $181 million, driven predominantly by income growth and development, highlights the resilience of the Aventus portfolio value now valued at approximately $2.1 billion4.
2. COVID‑19 Period is from 1 March 2020 to 30 June 2020
3. Excluding licences less than 12 months. In FY19, 5 of the total 141 deals were short term licences
4. Total funds under management, including Kotara North and McGraths Hill
Development Track Record Since Listing in FY16
$110m+Development Spend
9% Average Cash Yield1
18k+ SQM of GLA Added
$27mFY20 Development Spend
1. B ased on income producing development projects since Oct 2015
Annual Report 2020 Aventus Group 09

Caringbah Transformation
> Only integrated LFR centre in Southern Sydney
> Total projected spend of $34m+ with a forecasted 10%+ project IRR
> Stage 1 (Upper Ground) completed on time and on budget during COVID‑19 Period
> Stage 2 (Ground Level) works continuing with project on track for completion by Nov 2020
> Anchored by strong national tenants including JB Hi‑Fi, Harvey Norman and Freedom
Before
After
Leasing
Over the period, Aventus negotiated 90 leases covering 80,600 sqm and managed to achieve a high occupancy rate of 98% across the portfolio5. Further, these leases were achieved with positive leasing spreads and low incentives, and 36 were executed throughout the COVID‑19 period.
Development
The FY20 development spend was $27 million, with the major project being the transformation of the Caringbah Super Centre in metropolitan Sydney which commenced in late calendar 2019. The upper ground was completed on time and opened, despite the COVID‑19 related restrictions. The development is expected to be fully completed in November 2020.
Third Party Funds Management
We were also very pleased to launch the Aventus Property Syndicate (APS1) in October 2020.This syndicate is a single asset fund holding McGraths Hill in metro Sydney. The performance at the centre has been strong during the pandemic period, paying an 8.25% cash distribution, and this highlights our management capabilities for our syndicate investors.
This new fund is a significant milestone for Aventus that establishes our fund’s management capabilities, diversifies our income, recycles capital, and provides the platform for further syndication opportunities.
5. Excluding licences less than 12 months. In FY19, 5 of the total 141 deals were short‑term licenses
10

Growing Our Funds Management Platform
> Aventus Property Syndicate 1 (APS1) is our first dedicated large format retail syndicate since listing in FY16
> McGraths Hill is currently valued at $43m and located in metropolitan Sydney
> 25% Aventus cornerstone interest to ensure long‑term alignment
> Launch of APS1 establishes third‑party fund management platform and highlights ability to diversify income and capital sources
Our Funds Management Platform ($m)
Environmental, Social and Governance (ESG)
Released today with our Annual Report is our FY20 ESG Report which contains details of our continuing focus on improving and deepening our commitment to our environmental, social and governance initiatives.
During the recent period, our key focus was to develop our COVID‑19 Plan and the pandemic has deepened our commitment to the health and safety of our team. We have responded by making changes to ensure our places of work are COVID safe, and to increase our focus on the health and wellbeing of our team members, who are our No.1 asset.
The Group’s first solar project has been installed and is now fully operational in Midland, WA.
This year, we will again continue to monitor and review our energy consumption, emissions, water and waste data across our centres, and with two years of emissions data, we will be able to commence the creation of targets.
We will also begin to focus on our other future plans to further build our ESG commitment within our portfolio.
Leadership Appointments
This year, we also further strengthened our leadership team with the appointment of Jason James, Head of Leasing, and Ruth Jothy, Head of Asset Management. Their deep retail experience, together with our existing talented team, have produced these strong portfolio results.
On behalf of the Board and management, we would like to thank our loyal Securityholders for their investment in the Group, and our tenants, retailers and shoppers for their support throughout this unprecedented year.
Bruce Carter Darren HollandChairman CEO
FY18
140 140
192
FY19 FY20
McGrath’s Hill Home, Vineyard NSW
Annual Report 2020 Aventus Group 11
From the Chairman and CEO
Caringbah Home, Caringbah NSW

Storage and Parking > Focus on alternate storage opportunities in the portfolio
> Free parking across the portfolio with 13,410 spaces
Solar > Midland, WA solar project, comprised of a 700 kWh
system, is now fully operational, profitable and supplying 45% of the site’s energy consumption
> 95% of portfolio’s roof area is untapped and further opportunities are being actively pursued
Signage > Internal digital signage implemented at all centres
> Exterior highway signage opportunities exist for our centres with 11km of street frontage
11kmof Street Frontage
536k sqmGLA of Tenancies
82%of Portfolio with Development Opportunitiy1
Intensify Land Use
Unlock Land Bank
44%Site Coverage Ratio
1.2m sqmLand Area
39%of Portfolio with Zoning for Other Uses2
1. By site area
2. By GLA attributable to zoning alternative to Large Format Retail
3% Western Australia
Our Portfolio
Opportunities to Diversify Revenue Streams
12

Belrose
Caringbah
Bankstown
Castle Hill
Marsden Park
McGraths Hills
5%South Australia 16%
Victoria
58%New South Wales
18% Queensland
Assets Under Management2
$2.1b Metro by Value1
73% Catchment Coverage of Sydney3
43%1. Carrying value derived from
independent and internal valuations
2. Includes externally owned centres that are managed by Aventus
3. Source: Deep End, 2017
Annual Report 2020 Aventus Group 13
Our Portfolio
Aventus centres
Externally managed

Our People
We continue to invest in the well‑being of our people and achieved an overall team engagement score of 90%. During the recent period, we developed and implemented our COVID‑19 plan and offered financial and counselling service to all team members. The recent pandemic period has deepened our commitment to the health and safety of our team, and we have responded by making changes to ensure our places of work are COVID safe.
Our Environmental Commitment
The group’s first solar project has been installed and is now fully operational in Midland, WA. The 700 kWh system is expected to generate 45% of the centre’s energy consumption. This year, we will again continue to monitor and review our energy consumption, emissions, water and waste data across our centres. Our 2020 ESG Report is available on our website at www.aventusgroup.com.au in the Reports and Presentation section under the Investor Tab.
Sustainability
Our People
90%Overall Team Engagement Score
14

Cranbourne Home, Cranbourne VIC
Midland Home, Midland WA
Our Environmental Commitment
700kWhSolar System Installed in Midland, WA
Our Centres and Community
Alongside the financial support we have extended to our COVID‑19 impacted retailers, we implemented further initiatives to extend our health and safety commitment to our tenants, their team members and our customers that come to our centres.
Financial and counselling services extended to all tenants
Sanitising stations
Enhanced cleaning
Click & Collect
45%of Midland Centre’s energy consumption generated from the group’s first solar installation
Annual Report 2020 Aventus Group 15
Sustainability

16
Board of Directors
Our Board comprises five directors, three of whom are independent, including an independent Chairman. They bring valuable skills and experience to our organisation, including industry and business knowledge, financial management and corporate governance.
Experience and Expertise
Bruce has spent over 30 years in corporate recovery and insolvency. Bruce was formerly at Ferrier Hodgson in Adelaide, where he was the managing partner for 19 years. Bruce was formerly a partner at Ernst Young, Chair of the South Australian Economic Development Board and a Member of the Executive Committee of Cabinet.
Bruce is currently Chair of the Australian Submarine Corporation, Deputy Chair of SkyCity Entertainment Group Limited, a Director of the Bank of Queensland and a Director of AIG Australia Ltd. He holds a Master of Business Administration from Heriot‑Watt University and a Bachelor of Economics from the University of Adelaide. Bruce is a Fellow of both the Institute of Chartered Accountants in Australia and the Australian Institute of Company Directors.
Other current listed and government directorships
> ASC Pty Limited
> SkyCity Entertainment Group Limited
> Bank of Queensland Limited
Special responsibilities
Member of the Audit, Risk and Compliance Committee
Member of the People, Culture and Remuneration Committee
Interest in stapled securities
1,189,312
Experience and Expertise
Darren has more than 25 years’ experience in the retail property industry. He is experienced in leasing, development, asset management and acquisitions, and has grown Aventus assets under management from one centre in 2004 to 20 centres, valued at $1.9 billion.
Prior to co‑founding Aventus, Darren played a leading role in the development and management of the only other pure‑play listed large format retail owner and operator to date, Homemaker Retail Group. Darren holds a Bachelor of Business (Land Economics) from the University of Western Sydney and is a licensed Real Estate Agent.
Other current listed directorships
None
Interest in stapled securities
7,530,177
BRUCE CARTERIndependent Non-Executive Chairman
DARREN HOLLANDChief Executive Officer and Managing Director

Annual Report 2020 Aventus Group 17
Board of Directors
Experience and Expertise
Ray Itaoui is a non‑executive and independent Director. For over 30 years, he has invested in Australian and global retail and property businesses and his current retail investments include Sanity, Honey Birdette, Mr Vitamins and The Universal Store.
He also serves as Chairman of Sanity, Honey Birdette and Mr Vitamins.
He is also a substantial investor in AVN with a holding of circa 5%.
Other current listed and not-for-profit directorships
None
Special responsibilities
Member of the People, Culture and Remuneration Committee
Interest in stapled securities
31,071,484
RAY ITAOUIIndependent Non-Executive Director
Experience and Expertise
Kieran has over 25 years’ experience in the property industry. He spent nine years at Lendlease Corporation in the construction, development and investment management divisions, before becoming Chief Financial Officer at General Property Trust (GPT). Kieran remained CFO of GPT following the internalisation of management, before moving to Australand Property Group as CFO between 2010 and 2014, and from July 2016 until July 2018 held the role of CFO of Grocon Pty Limited. Kieran holds a Bachelor of Commerce (Accounting) from the University of Wollongong and is a Fellow of CPA Australia.
In addition to being an Independent Non‑Executive Director, Kieran is also the Chair of the Audit Risk and Compliance Committee (ARCC) for Aventus.
Other current listed and not-for-profit directorships
OzHarvest Limited
Special responsibilities
Chair of the Audit, Risk and Compliance Committee
Interest in stapled securities
70,873
KIERAN PRYKEIndependent Non-Executive Director
Experience and Expertise
Robyn is a board director working across several ASX 200–300 Companies including Brickworks Limited and InvoCare Limited. She also provides executive coaching services to a diverse range of corporate clients via the Stephenson Mansell Group.
Prior to joining the Aventus Board in 2015, Robyn enjoyed a 25+ year career as a senior executive in large, complex organisations. She spent 8 years with Stockland as a General Manager, her last role heading up retail leasing across a portfolio of 40 shopping centres nationally.
Robyn is a graduate of the Australian Institute of Company Directors and holds a Master of Science degree in Coaching Psychology from The University of Sydney. She was awarded a University Medal with her business degree from the University of Technology Sydney.
In addition to being an Independent Non‑Executive Director, Robyn is also the Chair of the Remuneration Committee for Aventus.
Other current listed and not-for-profit directorships
InvoCare Limited
Brickworks Limited
Special responsibilities
Chair of the People, Culture and Remuneration Committee
Member of the Audit, Risk and Compliance Committee
Interest in stapled securities
41,364
ROBYN STUBBSIndependent Non-Executive Director

FinancialPerformance $57m2
Statutory Profit for FY20
11.9c2
Distribution per Security from 16.6 Cents3
5.2xInterest Cover Ratio
from 4.7x 3
3.1yearsWeighted Average Debt Expiry
3.1%Weighted Average Cost of Debt5
40 bps2
Capital Structure
Debt Management
$100m2
FFO 4.2% from $96m3
18.2c2
FFO per Security 4
from 18.4 Cents3
36%Gearing 2.7% from 38.7%
$121mAvailable Cash andUndrawn Debt Liquidity
Key Financial Metrics1
1. All metrics as at 30 Jun 2020
2. For the 12 months ended 30 Jun 2020
3. For the 12 months ended 30 Jun 2019
4. Based on a weighted average number of securities of 552m over the 12 months ended 30 Jun 2020
5. Weighted average cost of debt is calculated based on historical finance costs, excluding amortisation of debt establishment costs and net fair value gains/losses on interest rate swaps, for the 12 months ended 30 June 2020
18

Annual reportfor the financial year ended 30 June 2020
CONTENTSDirectors’ Report 20
Auditor’s Independence Declaration 41
Annual Financial Report
Consolidated Statement of Comprehensive Income 42
Consolidated Balance Sheet 43
Consolidated Statement of Changes in Equity 44
Consolidated Statement of Cash Flows 46
Notes to the Consolidated Financial Statements 47
Directors’ Declaration 87
Independent Auditor’s Report 88
Annual Report 2020 Aventus Group 19

Directors’ Report
The directors of Aventus Capital Limited (“ACL”) (ACN 606 555 480), the Responsible Entity of the Aventus Retail Property Fund (“ARPF” or “Fund”) (ARSN 608 000 764), and the directors of Aventus Holdings Limited (“AHL”) (ACN 627 640 180) present their report together with the consolidated financial statements of the Aventus Group and AHL Group for the year ended 30 June 2020.
The Aventus Group is a stapled entity comprising ARPF and its controlled entities (“the ARPF Group”) and AHL and its controlled entities (“the AHL Group”). For financial reporting purposes ARPF has been deemed the parent entity of the Aventus Group. The consolidated financial statements of the Aventus Group comprise ARPF and its controlled entities which includes AHL.
Directors and company secretariesThe following persons were directors of ACL and AHL during the whole of the financial year and up to the date of this report, unless otherwise stated:
> Bruce Carter Independent Non-Executive Chairman
> Darren Holland Executive Director
> Kieran Pryke Independent Non-Executive Director
> Robyn Stubbs Independent Non-Executive Director
> Brett Blundy Non-Executive Director (resigned 12 May 2020)
> Nico van der Merwe Alternate Director to Brett Blundy (resigned 12 May 2020)
> Ray Itaoui Independent Non-Executive Director (appointed 29 May 2020)
The company secretaries of ACL and AHL are Mary Weaver AGIA and Lawrence Wong.
Principal activityThe principal activity of the Aventus Group during the financial year was investment and management of large format retail property assets. There was no significant change in the principal activity during the financial year.
Review of operations and resultsSummary of financial performanceA summary of the Aventus Group’s financial performance for the financial year is set out below.
2020$m
2019$m
Funds from operations (FFO) 100.2 96.2
Net profit 56.7 110.4
FFO per security (cents) 18.2 18.4
Basic and diluted earnings per security (cents) 10.3 21.1
Distributions to securityholders 65.8 87.0
Distributions to securityholders (cents) 11.9 16.6
Funds from Operations (FFO)FFO represents the Aventus Group’s underlying and recurring earnings from operations. FFO is calculated by adjusting statutory net profit after tax for certain non-cash items, unrealised revenue and expenses and non-recurring amounts outside core operating activities. FFO has been determined in accordance with best practice guidelines published by the Property Council of Australia.
The Aventus Group delivered FFO of $100.2m for the year ended 30 June 2020 representing an increase of $4.0 million or 4.2% on the prior financial year. This translates to FFO per security of 18.2 cents per security representing a decrease of 0.2 cents per security or 1.1%.
The result represents a solid financial performance considering the challenges presented by the COVID-19 pandemic. To support our retailers Aventus has provided rental relief to tenants who have been significantly impacted by COVID-19. Requests for rental relief are being assessed on a case by case basis taking into account specific tenant circumstances and the National Cabinet’s code of conduct. The board also implemented initiatives during the financial year to reduce property and corporate costs with savings passed onto tenants. Furthermore, non-essential capital projects were delayed and the distribution payout ratio for the March and June 2020 quarters was reduced to support the liquidity of the group.
FFO for the year ended 30 June 2020 was significantly impacted by a $6.3 million doubtful debts expense with the majority COVID-19 related. The total provision for doubtful debts at 30 June 2020 amounted to $6.7 million. COVID-19 also negatively impacted June 2020 property valuations. A summary of the investment property portfolio at 30 June 2020 is outlined below.
All Aventus centres have remained open for trading since the outbreak of COVID-19 and at 30 June 2020 only 16 tenancies remained closed across the portfolio with the majority subject to mandated closures in accordance with state government restrictions. Occupancy at 30 June 2020 remained high at 98.0% (June 2019: 98.4%).
20

The Aventus portfolio is underpinned by its strong tenant profile which comprises approximately 87% national retailers with the majority listed companies. Recent trading updates from key tenants including Bunnings, Officeworks, Harvey Norman, JB Hi-Fi, The Good Guys, Nick Scali, Super Retail Group, Beacon Lighting and Adairs indicate strong sales growth.
A reconciliation of statutory net profit for the financial year and FFO is as follows:
2020$m
2019$m
Net profit for the year 56.7 110.4
Straight-lining of rental income 2.2 0.9
Amortisation of rental guarantees 0.4 2.3
Amortisation of debt establishment costs 1.6 2.7
Net loss/(gain) on movement in fair value of investment properties 37.3 (39.5)
Net loss on movement in fair value of derivative financial instruments 1.3 14.0
Distributions from associates 0.3 –
Transaction costs – 5.2
Other 0.4 0.2
FFO 100.2 96.2
Net profitThe Aventus Group’s net profit for the year ended 30 June 2020 was $56.7 million representing a decrease of $53.7 million or 48.6% on the prior financial year. The decrease was mainly attributable to a:
(a) $76.8 million decrease in net fair value adjustments on investment properties;
(b) $16.3 million decrease in finance costs which includes a $12.7m decrease in fair value losses on interest rate swaps and a $2.5 million decrease in interest costs;
(c) $5.2 million decrease in transaction costs; and
(d) $1.6 million increase in net property income.
DistributionsDistributions declared and/or paid to securityholders during the financial year were as follows:
Quarter ended
Distributionper security
(cents)
Totaldistribution
$m
Ex-distribution
dateRecord
datePayment
date
September 2019 4.22 23.1 27/09/2019 30/09/2019 31/10/2019
December 2019 4.26 23.7 30/12/2019 31/12/2019 20/02/2020
March 2020 1.07 5.9 30/03/2020 31/03/2020 20/05/2020
June 2020 2.35 13.1 26/06/2020 30/06/2020 28/08/20201
Total 11.90 65.8
September 2018 4.09 20.2 27/09/2018 28/09/2018 23/11/2018
December 2018 4.14 22.0 28/12/2018 31/12/2018 27/02/2019
March 2019 4.16 22.3 28/03/2019 29/03/2019 22/05/2019
June 2019 4.18 22.5 27/06/2019 28/06/2019 30/08/2019
Total 16.57 87.0
1 Estimated payment date
The Aventus Group’s distribution policy is to distribute between 90% and 100% of FFO to securityholders.
Due to the uncertainty created by COVID-19 the directors declared conservative distributions for the quarters ended 31 March 2020 and 30 June 2020 in order to preserve liquidity and strengthen the financial position of the group.
Annual Report 2020 Aventus Group 21
Directors’ Reportcontinued
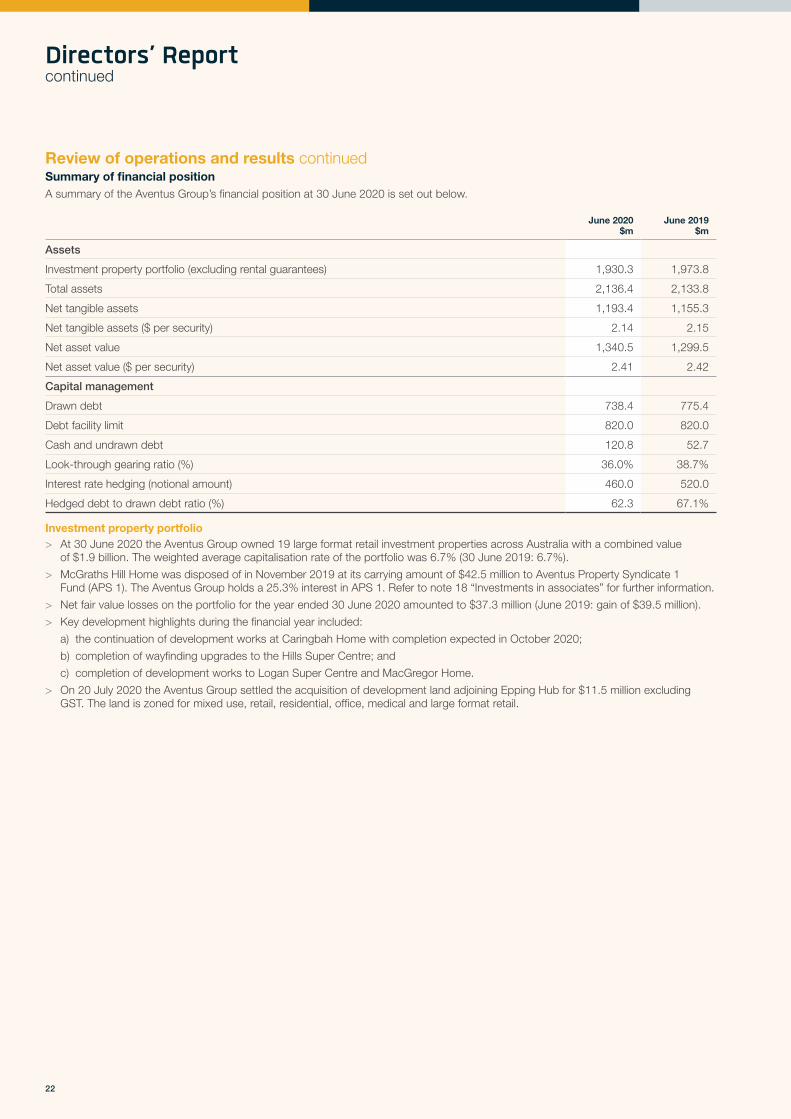
Review of operations and results continuedSummary of financial positionA summary of the Aventus Group’s financial position at 30 June 2020 is set out below.
June 2020$m
June 2019$m
Assets
Investment property portfolio (excluding rental guarantees) 1,930.3 1,973.8
Total assets 2,136.4 2,133.8
Net tangible assets 1,193.4 1,155.3
Net tangible assets ($ per security) 2.14 2.15
Net asset value 1,340.5 1,299.5
Net asset value ($ per security) 2.41 2.42
Capital management
Drawn debt 738.4 775.4
Debt facility limit 820.0 820.0
Cash and undrawn debt 120.8 52.7
Look-through gearing ratio (%) 36.0% 38.7%
Interest rate hedging (notional amount) 460.0 520.0
Hedged debt to drawn debt ratio (%) 62.3 67.1%
Investment property portfolio> At 30 June 2020 the Aventus Group owned 19 large format retail investment properties across Australia with a combined value
of $1.9 billion. The weighted average capitalisation rate of the portfolio was 6.7% (30 June 2019: 6.7%).
> McGraths Hill Home was disposed of in November 2019 at its carrying amount of $42.5 million to Aventus Property Syndicate 1Fund (APS 1). The Aventus Group holds a 25.3% interest in APS 1. Refer to note 18 “Investments in associates” for further information.
> Net fair value losses on the portfolio for the year ended 30 June 2020 amounted to $37.3 million (June 2019: gain of $39.5 million).
> Key development highlights during the financial year included:
a) the continuation of development works at Caringbah Home with completion expected in October 2020;
b) completion of wayfinding upgrades to the Hills Super Centre; and
c) completion of development works to Logan Super Centre and MacGregor Home.
> On 20 July 2020 the Aventus Group settled the acquisition of development land adjoining Epping Hub for $11.5 million excludingGST. The land is zoned for mixed use, retail, residential, office, medical and large format retail.
22

Debt portfolio > Look-through gearing decreased from 38.7% at 30 June 2019 to 36.0% at 30 June 2020 mainly due to debt repayments following
equity raised from the DRP underwrite for the quarters ended 30 June 2019 and 30 September 2019 and equity released from the APS 1 transaction. These decreases were partially offset by net fair value losses on investment properties.
> The Aventus Group has no debt expiring before May 2022. The debt maturity profile as at 30 June 2020 was as follows:
Debt maturity profile
0
100
200
300
400
500
FY21
–
100.0 100.0
160.0
460.0$m
FY22 FY23 FY24 FY25
> The Aventus Group continued to comply with and maintain significant headroom for all key debt covenants during the financial year.
Hedging > At 30 June 2020 the Aventus Group had $460.0 million in interest rate swaps (30 June 2019: $520.0 million).
> Hedging coverage as a percentage of drawn debt decreased from 67.1% at 30 June 2019 to 62.3% at 30 June 2020.
Significant changes in state of affairsWith the exception of the impacts of COVID-19 noted above there were no significant changes in the state of affairs of the Aventus Group or the AHL Group during the financial year.
Business strategies and prospects for future financial yearsThe Aventus Group will continue to engage in its principal activity in accordance with the investment objectives and guidelines as set out in the governing documents of ARPF and in accordance with the provisions of the ARPF’s constitution.
The key business strategies of the Aventus Group include:
> optimising the tenancy mix across the portfolio through proactive management and leasing leverage;
> executing on future development projects;
> participating in sector consolidation through acquisition of additional centres; and
> monitor potential regulatory changes in the LFR sector which could enable a broader range of tenants to occupy centres within the portfolio.
Annual Report 2020 Aventus Group 23
Directors’ Report

Directors’ Reportcontinued
Information on directorsThe following information is current as at the date of this report.
Bruce Carter Independent non-executive chair
Experience and expertise Bruce has spent over 30 years in corporate recovery and insolvency. Bruce was formerly managing partner at Ferrier Hodgson Adelaide for 19 years and prior to that a partner at Ernst & Young, Chair of the South Australian Economic Development Board and a member of the Executive Committee of Cabinet.
Bruce is currently Chair of the Australian Submarine Corporation, Deputy Chair of SkyCity Entertainment Group Limited, a director of the Bank of Queensland Limited and a director of AIG Australia Ltd. He holds a Masters of Business Administration from Heriot-Watt University and a Bachelor of Economics from University of Adelaide. He is a Fellow of both the Institute of Chartered Accountants in Australia and the Australian Institute of Company Directors.
Other current listed and government directorships
ASC Pty Limited
SkyCity Entertainment Group Limited
Bank of Queensland Limited
AIG Australia Ltd*
Special responsibilities Member of the Audit, Risk and Compliance Committee
Member of the People, Culture and Remuneration Committee
Interest in stapled securities
1,189,312
Kieran Pryke Independent non-executive director
Experience and expertise Kieran has over 25 years experience in the property industry. He spent 9 years in various finance roles across the construction, development and investment management divisions within Lend Lease Corporation before becoming CFO of General Property Trust (“GPT”) in 1996. He remained as CFO of GPT during and after the internalisation of management of GPT. Kieran was CFO of Australand Property Group between 2010 and 2014 and the CFO of Grocon between July 2016 and July 2018.
Kieran holds a Bachelor of Commerce (Accounting) from the University of Wollongong and is a Fellow of CPA Australia.
Other current listed and not-for-profit directorships
OzHarvest Limited
Special responsibilities Chair of the Audit, Risk and Compliance Committee
Interest in stapled securities
70,873
24
*AIG Australia Ltd not a listed entity

Robyn Stubbs Independent non-executive director
Experience and expertise Robyn is a board director working across several ASX 200-300 companies including Brickworks Limited and InvoCare Limited. She also provides executive coaching services to a diverse range of corporate clients via the Stephenson Mansell Group.
Prior to joining the Aventus board in 2015, Robyn enjoyed a successful 25+ year career as a senior executive in large, complex organisations. She spent 8 years with Stockland as a General Manager, her last role heading up retail leasing across a portfolio of 40 shopping centres nationally.
Robyn is a graduate of the Australian Institute of Company Directors, she holds a Master of Science degree in Coaching Psychology from The University of Sydney and was awarded a University Medal with her business degree from the University of Technology, Sydney.
Other current listed and not-for-profit directorships
InvoCare Limited
Brickworks Limited
Special responsibilities Chair of the People, Culture and Remuneration Committee
Member of the Audit, Risk and Compliance Committee
Interest in stapled securities
41,364
Darren Holland Executive director
Experience and expertise Darren has more than 25 years experience in the retail property industry. He is experienced in leasing, development, asset management and acquisitions, and has grown assets under management from one centre in 2004 to 20 centres at the date of this report, valued at $1.9 billion.
Prior to co-founding the Aventus Property Group, Darren played a leading role in the development and management of the only pure-play listed Australian LFR owner and operator to date, Homemaker Retail Group (ASX: HRP). He holds a Bachelor of Business (Land Economics) from the University of Western Sydney and is a Licensed Real Estate Agent.
Other current listed directorships
None
Special responsibilities None
Interest in stapled securities
7,530,177
Ray Itaoui Independent non-executive director
Experience and expertise Ray is a substantial securityholder in the Aventus Group.
Ray has over 30 years of retail and property experience and was an original investor in Aventus. He is also the owner of Greenway Wetherill Park a large format retail centre in Western Sydney.
His current retail investments include Sanity, Honey Birdette, Mr Vitamins and The Universal Store. Ray also serves as Chair of Sanity, Honey Birdette and Mr Vitamins.
Other current listed and not-for-profit directorships
None
Special responsibilities Member of the People, Culture & Remuneration Committee
Interest in stapled securities
31,071,484
Annual Report 2020 Aventus Group 25
Directors’ Report

Directors’ Reportcontinued
Remuneration reportThe People, Culture and Remuneration Committee (“the Committee”) presents the remuneration report of the Aventus Group for the year ended 30 June 2020. The report has been audited in accordance with section 300A of the Corporations Act 2001.
Comparative balances disclosed in the remuneration report are for the period 1 October 2018 to 30 June 2019 which represents the 9-month period ARPF was internally managed.
For the period 1 July 2018 to 30 September 2018 ARPF was externally managed by ACL. During this period the ACL directors were remunerated by the APG Group. Director fees of independent non-executive directors of ACL were reimbursed by ARPF for the period 1 July 2018 to 30 September 2018 and are disclosed in note 36(d) ‘Related party transactions’.
ContentsThe remuneration report is structured as follows:
Section What it covers
A Introduction from the Committee chair
B Governance and remuneration strategy
C Key management personnel (KMP)
D Overview of executive remuneration
E Contractual arrangements with executive KMP
F Remuneration outcomes
G Remuneration expenses for executive KMP
H Actual remuneration received by executive KMP
I Performance based remuneration granted and forfeited during the year
J Restricted stapled securities
K Overview of non-executive director remuneration
L Additional information
26

A. INTRODUCTION FROM THE COMMITTEE CHAIR
To our valued securityholders,
As chair of the People, Culture & Remuneration Committee I am pleased to present the remuneration report for the year ended 30 June 2020. This report has been approved by the board and is intended to be informative while complying with our statutory reporting obligations.
Our remuneration philosophy aims to fairly reward and retain our team, while promoting sustainable, long-term performance. A fundamental requirement is that remuneration outcomes are clearly linked to the performance of the Aventus Group and are reflected in our pay for performance approach. The Aventus Group has a team of circa 60 people in total with a small executive team and the remuneration framework is designed to be simple and transparent for all stakeholders.
The Executive Incentive Scheme (EIS) aims to align short and long-term performance by setting annual key performance indicators (KPIs) and delivering a proportion of variable remuneration in equity. KMP had 100% of their EIS at risk during the year ended 30 June 2020 based on financial and non-financial KPIs.
In March 2020 the business was on track to meet EIS KPIs however due to uncertainty as to the impact and duration of the COVID-19 pandemic the board withdrew its earnings guidance. FFO of 18.2 cents per security was achieved for the year ended 30 June 2020 representing a decrease of 0.2 cents per security or 1.1% on the prior year. The result was 4.1% down on targeted FFO guidance of 3% to 4% growth for the year ended 30 June 2020 which resulted in a 30% forfeiture of EIS entitlements for KMP. In light of market conditions and not achieving FFO guidance, the Committee decided not to award the discretionary board KPI which resulted in an additional 5% forfeiture of EIS entitlements for KMP.
In response to the impact of COVID-19 the Committee considered remuneration outcomes against the EIS plan and replaced the 50% cash component of the EIS with a deferred equity component for the year ended 30 June 2020. The deferred equity will vest in February 2021. The 50% cash component will be reinstated for the year ending 30 June 2021.
In addition to the above, the following voluntary changes to remuneration were implemented for the period 1 April 2020 to 30 June 2020:
> Robyn Stubbs, Bruce Carter and Kieran Pryke agreed to reduce their director fees by 60%;
> Brett Blundy agreed to reduce his director fees by 100% from 1 April 2020 to his resignation on 12 May 2020;
> Ray Itaoui agreed to reduce his director fees by 100% from his appointment on 29 May 2020 to 30 June 2020;
> Darren Holland agreed to reduce his fixed remuneration by 50%; and
> Lawrence Wong agreed to reduce his fixed remuneration by 30%.
Other members of the leadership team agreed to similar arrangements and team working hours were adjusted in line with business operations during this period. Measures were taken to minimise the impact on our team which included the Federal Government’s JobKeeper Payments Scheme for the period April to June 2020 which allowed for operations to be maintained.
The board regularly reviews our remuneration policies with input from securityholders and proxy advisors. This also allows for full consultation in line with our desire to align shareholder interest, incentivising our KMPs and the broader Aventus team to create a strong culture.
We remain confident our approach to remuneration is reflective of our performance and in line with our business strategy.
Robyn Stubbs Chair, People, Culture & Remuneration Committee
Annual Report 2020 Aventus Group 27
Directors’ Report

Directors’ Reportcontinued
Remuneration report continuedB. GOVERNANCE AND REMUNERATION STRATEGYCommittee membersThe Committee consists of the following non-executive directors:
> Robyn Stubbs (Chair)
> Bruce Carter
> Brett Blundy (resigned 12 May 2020)
> Ray Itaoui (appointed 29 May 2020)
In accordance with the Committee’s charter the Committee may only consist of non-executive directors, a majority of independent directors, an independent chair (who is not chair of the board) and a minimum of 3 members of the board.
Remuneration governance frameworkKey responsibilities of the board of directors and the Committee are outlined as follows:
Board of directors > Ensuring the remuneration framework is aligned with the Aventus Group’s purpose, core values and securityholders.
> Setting and overseeing the implementation of remuneration policy.
Committee > Review and recommend to the board of directors:
a) remuneration packages for the Chief Executive Officer (CEO) and senior management including participation in the EIS;
b) fees for non-executive directors including committee fees; and
c) policies and procedures relating to people and remuneration to create a high-performance culture.
> Determine performance targets, executive achievement and outcomes.
> Oversee succession planning and nomination processes for the CEO and senior management.
> Engage with external remuneration consultants where necessary.
A copy of the Committee’s charter is available on the Aventus Group website.
Remuneration strategy
Remuneration strategy To attract and retain executives with the capability and experience to deliver on our business strategies and achieve sustainable returns for securityholders.
Remuneration principles The remuneration strategy is underpinned by the following remuneration principles:
Alignment to performance To reward executives for performance which is aligned with our business strategies.
Culture To align remuneration with a high-performance culture.
Market competitive To ensure remuneration is market competitive in terms of quantum, mix and design to support the attraction and retention of executives.
Remuneration comprises fixed and variable components.
Sustainable To balance financial and non-financial priorities of the Aventus Group.
Simple and transparent The remuneration framework and strategy should be simple, transparent and easy to understand for executives and securityholders.
28

The remuneration strategy focuses on short-term and long-term performance by setting mutually agreed annual KPI targets and delivering a material proportion of variable remuneration in equity which will be subject to vesting conditions over 2, 3, and 4 years.
Executive remuneration components Fixed remuneration Variable remuneration
Purpose and alignment To attract and retain executives with the capability and experience to deliver on business strategies.
To reward annual performance against mutually agreed annual KPI targets and encourage sustainable long-term value creation for securityholders.
Performance measures and link to performance
Role specific accountability that drives a high-performance culture and execution of business strategy.
Annual financial and non-financial KPIs for executives.
Delivery Competitive market based fixed remuneration.
Executive incentive scheme (EIS) comprising:
> 50% cash award; and
> 50% deferred stapled securities subject to vesting conditions over 2, 3 and 4 years.
C. KEY MANAGEMENT PERSONNEL (KMP)KMP for the year ended 30 June 2020 were as follows:
Name Position
Independent non-executive directors
Bruce Carter Chair
Kieran Pryke Director
Robyn Stubbs Director
Ray Itaoui (from 29 May 2020) Director
Non-executive directors
Brett Blundy (until 12 May 2020) Director
Nico van der Merwe (alternate director to Brett Blundy) (until 12 May 2020) Alternate director
Executive director
Darren Holland Chief Executive Officer (CEO)
Senior Executive
Lawrence Wong Chief Financial Officer (CFO)
KMP are those persons who, directly or indirectly, have authority and responsibility for planning, directing and controlling the major activities of the Aventus Group. There have been no changes to KMP between balance date and the date of the remuneration report.
Annual Report 2020 Aventus Group 29
Directors’ Report

Directors’ Reportcontinued
Remuneration report continuedD. OVERVIEW OF EXECUTIVE REMUNERATION
How are executives remunerated?
Executives are remunerated via fixed and variable remuneration components.
Variable remuneration for executives will be delivered via the EIS, where participants are eligible to achieve annual cash awards and grants of stapled securities vesting over 2, 3 and 4 years.
The Committee will review the EIS on an annual basis to ensure the remuneration arrangements are driving business performance and are aligned with the long-term strategy of the Aventus Group.
The Committee will, as required, obtain advice from external remuneration advisers on aspects of the Aventus Group’s remuneration policies and structures.
What is total annual fixed remuneration comprised of?
Total annual fixed remuneration (TFR) consists of base salary, employer superannuation contributions and salary sacrifice benefits. TFR is set based on the role, responsibilities, experience and qualifications of the individual, and with reference to market data of comparable companies. An employee’s TFR will generally be reviewed on an annual basis.
What is variable remuneration comprised of?
Variable remuneration consists of an annual opportunity to receive a short-term variable cash award and a grant of restricted stapled securities under the EIS, awarded to the extent that certain mutually agreed KPI targets are achieved for the financial year.
The diagram below provides an illustration of how the EIS operates for a single performance period of one year, assuming all KPIs are achieved. The Aventus Group intends to offer EIS awards annually. As the EIS progresses, the vesting of restricted equity awards will become cumulative:
Year 0 +1 year +2 years +3 years +4 years
50% of EIS award
paid in cash
First thirdof deferredequity vests
Second thirdof deferredequity vests
Final third of deferredequity vests
EIS is delivered as follows:– 50% in cash– 50% in deferred equity
Delivery of EIS outcome
EIS performance period(1 year)
(33%) – Deferred for one year
(33%) – Deferred equity for two years
(33%) – Deferred equity for three years
Deferred equity component (50% of total EIS)
30

Who is eligible to participate in the EIS?
Offers are made at the board’s discretion to executives and other employees of the Aventus Group. Details of CEO and CFO entitlements and KPIs are set out below. Non-Executive Directors are not eligible to participate in the EIS.
How are awards under the EIS delivered to participants?
Mutually agreed KPI targets must be satisfied over a respective performance period. To the extent the KPIs are satisfied, EIS awards will be delivered 50% in cash and 50% in restricted stapled securities.
The cash award will be paid following the end of the performance period. In response to the impact of COVID-19 the cash component for the year ended 30 June 2020 was replaced by restricted stapled securities vesting in February 2021.
The restricted stapled securities will be granted following the end of the performance period, and will vest in three tranches following release of full-year results for the first, second and third financial years immediately following the performance period:
> 33.33% of the restricted stapled securities will vest approximately two years after the start of the performance period;
> 33.33% of the restricted stapled securities will vest approximately three years after the start of the performance period; and
> 33.34% of the restricted stapled securities will vest approximately four years after the start of the performance period;
providing the participant remains an employee until the relevant vesting date and the board has not determined that a “clawback” of any restricted stapled securities is required.
The board may claw back restricted stapled securities granted under the EIS in certain circumstances (e.g. gross misconduct, material misstatement, fraud or where in the board’s opinion performance that led to cash payments/equity being awarded is later determined to have been incorrectly measured or not sustained).
The number of restricted stapled securities to be allocated to each participant will be determined by dividing the dollar value of the equity component of the EIS by the volume weighted average price of stapled securities, measured over the ten trading days following release of full-year results for the performance period’s financial year.
Restricted stapled securities relating to Darren Holland must also be approved by securities holders at the annual general meeting.
Restricted stapled securities will be held in an employee share trust on behalf of participants until the relevant vesting date.
What is the acquisition price paid by executives for restricted stapled securities?
Restricted stapled securities under the EIS are issued for nil consideration.
Annual Report 2020 Aventus Group 31
Directors’ Report

Directors’ Reportcontinued
Remuneration report continuedD. OVERVIEW OF EXECUTIVE REMUNERATION CONTINUED
What are the key performance indicators of the EIS and why were they chosen?
KPIs were designed to create alignment to the Aventus Group’s financial performance, both short term and long term, and drive a strong culture. KPIs have both financial and non-financial measures, take into account the relative size and nature of the business and are designed to be simple and transparent.
KPIs are documented for each EIS participant in relation to each performance period, including:
> the percentage weighting for each KPI;
> threshold and stretch performance hurdles; and
> the maximum opportunity that may be delivered in cash and equity, expressed as a percentage of TFR.
EIS awards for the period ended 30 June 2020 will be subject to the following financial and non-financial KPIs tested over the performance period from 1 July 2019 to 30 June 2020. No EIS award will be grantedunless either the funds from operations (FFO) of the Aventus Group or the relative total shareholder return (RTSR) KPIs are met:
> FFO is a calculation of the Aventus Group’s underlying and recurring earnings from its operations. This is determined by adjusting statutory net profit for certain non-cash and other non-recurring amounts outside core operating activities. FFO is determined in accordance with best practice guidelines published by the Property Council of Australia. Targeted FFO for the year ended 30 June 2020 was 3% to 4% growth or 19.0 to 19.2 cents per security. FFO was chosen to align executives with investor expectations for earnings growth.
> RTSR is measured against the S&P/ASX 200 A-REIT accumulation index (Index). RTSR measures performance against industry peers and aligns executives with returns delivered to investors for the respective performance period.
> A cost control measure based on expenses against revenue (Cost Control Measure). The Cost Control Measure aims to align executives with running a cost-efficient platform.
> People and culture is measured against regretted attrition of less than 25% and an annual engagement score above 75%. People and culture KPIs aim to create a high-performance culture, retain executives and staff who can deliver on strategy and promote team engagement and satisfaction.
> Board discretion involves an assessment of individual executive performance by the board. The KPI for board discretion is only awarded for outperformance by the executive in their role during the financial year.
The following KPIs and weightings will apply to the CEO and CFO for the year ended 30 June 2020:
Financial KPIs Non-financial KPIs
Role FFO RTSRCost Control
MeasurePeople &
cultureBoard
discretion
CEO 30% 30% 15% 20% 5%
CFO 30% 30% 15% 20% 5%
Are distributions and dividends paid during the vesting period?
Participants who have been granted restricted stapled securities will be entitled to dividends and distributions during the vesting period on the same basis as other securityholders.
What happens on cessation of employment?
Unless the board determines otherwise:
> if a participant’s employment is terminated for cause, misconduct, or gives notice of their resignation, they will not be entitled to receive any EIS award for the performance period in which they cease employment and any unvested restricted stapled securities will be forfeited; and
> if a participant ceases employment for any other reason, the participant will be entitled to a pro-rated EIS award for the performance period in which they cease employment (based on performance achieved against the performance conditions and the time served during the performance period). In this case the EIS award may be paid fully in cash (at the normal payment date). Any restricted stapled securities granted will continue to be restricted until the original vesting dates.
What happens on change of control?
Unless the board determines otherwise, restricted stapled securities will vest in full upon a change of control.
32

Where there any changes to the EIS for the year ended 30 June 2020?
1. KPI weightings for people and culture increased from 15% to 20% and the weighting for board discretion decreased from 10% to 5%. The change was designed to place greater emphasis on enhancing our high-performance culture.
2. The KPI for regretted attrition was measured against voluntary attrition rather than against a pool of high potential team members.
3. In response to the COVID-19 pandemic executive KMP undertook the following voluntary reductions in remuneration for the period 1 April 2020 to 30 June 2020:
> Darren Holland agreed to a 50% reduction of fixed remuneration;
> Lawrence Wong agreed to a 30% reduction of fixed remuneration;
> Other executives agreed to similar arrangements.
4. The 50% cash component of the EIS was replaced with a deferred equity component which will vest in February 2021.
Are there any changes expected to the EIS for the 2021 financial year?
1. The 50% cash component will be reinstated to the EIS for the year ending 30 June 2021.
2. The regretted attrition KPI, which was measured against voluntary attrition for the year ended 30 June 2020, will be measured against all attrition for the year ending 30 June 2021.
E. CONTRACTUAL ARRANGEMENTS WITH EXECUTIVE KMPThe table below outlines the annual contracted remuneration of executive KMP (including statutory superannuation). Variable remuneration for the year ended 30 June 2020 relates solely to deferred stapled securities. Amounts disclosed exclude voluntary reductions in fixed remuneration for the period 1 April 2020 to 30 June 2020 which are disclosed in section G.
Role Name
Total annualfixed
remuneration
Totalmaximum
variableremuneration
Maximumremuneration
amountpaid in cash
(fixed + variable)
Maximumremuneration
amountin restricted
stapledsecurities (fixed
+ variable)
Total maximumremuneration
(fixed + variable)
Chief Executive Officer Darren Holland $746,750 $746,750 $746,750 $746,750 $1,493,500
Chief Financial Officer Lawrence Wong $450,883 $450,883 $450,883 $450,883 $901,765
Key terms and conditions of KMP employment agreements are summarised as follows:
Darren Holland Executive director and CEO
Remuneration Mr Holland is entitled to receive annual fixed remuneration (including superannuation) of $746,750, and an EIS opportunity of $746,750.
Term of employment Mr Holland’s current employment contract with Aventus Services Pty Ltd is for an initial 3-year period commencing 1 October 2018. The contract will automatically extend for 6 months if Aventus Services Pty Ltd does not provide Mr Holland with notice that it intends to terminate the contract at least one month before end of the 3-year period (and any subsequent 6-month period).
Termination Aventus Services Pty Ltd or Mr Holland may terminate employment on 6 months notice (or payment in lieu of notice).
Any payment in lieu of notice is calculated on total fixed remuneration (inclusive of superannuation). If Mr Holland’s employment is terminated by Aventus Services Pty Ltd otherwise than for cause:
> within two years of the initial 3-year term – Aventus Services Pty Ltd will provide a termination payment equal to 12 months salary (including superannuation) (less any actual notice or payment in lieu of notice);
> after two years of the initial 3-year term but before 1 April 2021 – Aventus Services Pty Ltd will provide a termination payment equal to the amount payable to the end of the initial term (less any actual notice or payment in lieu of notice);
> after 1 April 2021 – Aventus Services Pty Ltd will provide a termination payment equal to 6 months salary (including superannuation) (less any actual notice or payment in lieu of notice).
Any incentive payments will be governed by the applicable EIS plan rules, as summarised above.
The contract contains a provision stating that any termination benefits will not exceed the termination benefits cap calculated in accordance with Part 2D.2 of the Corporations Act.
Post-employment restraints
Mr Holland is restrained from soliciting suppliers, customers and staff for a maximum of 12 months after employment ends.
Annual Report 2020 Aventus Group 33
Directors’ Report

Directors’ Reportcontinued
Lawrence Wong CFO
Remuneration Mr Wong is entitled to receive annual fixed remuneration (including superannuation) of $450,883, and have an EIS opportunity of $450,883.
Term of employment Mr Wong is a permanent employee of Aventus Services Pty Ltd and his employment has no fixed term.
Termination Aventus Services Pty Ltd or Mr Wong may terminate employment on three months notice (or payment in lieu of notice). Any payment in lieu of notice is calculated on total fixed remuneration (inclusive of superannuation). Any incentive payments will be governed by the applicable EIS plan rules, as summarised above.
If Mr Wong ceases employment for redundancy, he is entitled to the higher of a redundancy payment calculated in accordance with the National Employment Standards, or two weeks salary per completed year of service plus a pro-rata amount for any partially completed year.
Post-employment restraints
Mr Wong is restrained from soliciting suppliers, customers and staff for a maximum of 12 months after employment ends.
In the prior financial year Mr Wong was granted a one-off issue of 224,554 restricted stapled securities at a value of $2.38 per security or $534,438. The restricted stapled securities will vest in two equal tranches over a two-year period from 1 October 2018 subject to forfeiture of unvested amounts on resignation or termination for cause during that period. This entitlement was awarded in place of forgone actual and potential pre-internalisation cash bonus entitlements of $267,219.
F. REMUNERATION OUTCOMESPerformance of executive KMP against mutually agreed KPI targets for the year ended 30 June 2020 are summarised as follows:
Darren Holland Lawrence Wong
Metric Target Actual KPI met KPI weighting KPI met KPI weighting
Financial KPIs
FFO 3–4% growth (1.1%) growth ✗ 30% ✗ 30%
RTSR (22.2%) (6.2%) ✓ 30% ✓ 30%
Cost control Below 10.0% 9.7% ✓ 15% ✓ 15%
Non-financial KPIs
People and cultureRegretted attrition < 25%Engagement score > 75%
15%90% ✓ 20% ✓ 20%
Board discretion N/A N/A ✗ 5% ✗ 5%
Total KPIs met 65% 65%
Refer to section H below for a summary of variable remuneration (comprising cash bonus and restricted stapled securities) awarded and forfeited for each KMP.
Remuneration report continuedE. CONTRACTUAL ARRANGEMENTS WITH EXECUTIVE KMP CONTINUED
34

Commentary on financial and non-financial KPIs are as follows:
KPI Commentary
Funds From Operations (FFO)
Targeted FFO of the Aventus Group for the year ended 30 June 2020 was 3% to 4% growth representing 19.0 to 19.2 cents per security. FFO aligns executives with investor expectations for earnings growth.
Relative Total Shareholder Return (RTSR)
RTSR is measured against the S&P/ASX 200 A-REIT accumulation index (Index). RTSR for the year ended 30 June 2020 was negative 6.2% which outperformed the Index return of negative 22.2%. RTSR measures performance against industry peers and aligns executives with returns delivered to investors for the respective performance period.
Cost Control Cost control is measured based on a ratio of expenses against revenue and seeks to align executives with running a cost-efficient platform.
People and culture The regretted attrition target of less than 25% is measured against voluntary attrition. The engagement score was based on a team engagement survey conducted in November 2019. People and culture KPIs aim to create a high-performance culture, retain executives and staff who can deliver on strategy and promote team engagement and satisfaction.
Board discretion Board discretion involves an assessment of individual executive performance including consideration of outperformance in individual roles and demonstration of key values embedded in the Aventus culture. The KPI for board discretion is only awarded for outperformance by the executive in their role during the financial year.
G. REMUNERATION EXPENSES FOR EXECUTIVE KMPThe following table outlines the remuneration expenses recognised for executive KMP for the year ended 30 June 2020 and 2019 measured in accordance with accounting standards disclosed in note 2 to the financial statements. Comparative balances are for the 9-month period 1 October 2018 to 30 June 2019 representing the period the Aventus Group was internally managed.
In response to the COVID-19 pandemic executive KMP undertook the following voluntary reductions in remuneration for the period 1 April 2020 to 30 June 2020:
> Darren Holland agreed to a 50% reduction of fixed remuneration;
> Lawrence Wong agreed to a 30% reduction of fixed remuneration.
Fixed remuneration Variable remuneration
Name Year
Cashsalary1
$
Voluntary salary
reduct-ion1
$
Non-monetary benefits1
$
Annualleave &
long service
leave2
$Super
$
EISCash
comp-onent1
$
EIS restricted
stapledsecurities3
$
Other restricted
stapled securities
$
Total remun-eration
$
Perform-ance
related%
Darren Holland 2020 635,327 (90,219) – 67,548 25,000 – 275,014 – 912,670 30.1%
20195
(9 months) 471,155 – 6,330 42,133 18,750 190,313 68,724 – 797,405 32.5%
Lawrence Wong 2020 400,075 (31,941) – 39,858 25,000 – 166,052 133,609 732,653 40.9%
20195
(9 months) 276,226 – – 23,812 18,750 114,909 41,495 133,6104 608,802 47.6%
1 Short-term benefits as per Corporations Regulation 2M.3.03(1) Item 6.
2 Other long-term benefits as per Corporations Regulation 2M.3.03(1) Item 8. The amounts disclosed in this column represent annual leave and long service leave accrued during the period.
3 The cost of restricted stapled securities, to be granted to KMPs under the EIS, are expensed over the performance period and the subsequent vesting period of the restricted securities. Restricted stapled securities represent equity settled share-based payments as per Corporations Regulation 2M.3.03(1) Item 11.
4 Balance represents the current year cost of the one-off issue of restricted stapled securities referred to in section E ‘Contractual arrangements with executive KMP’.
5 Comparative balances are for the 9-month period 1 October 2018 to 30 June 2019 representing the period the Aventus Group was internally managed.
For the year ending 30 June 2021 there will be no increase in contracted remuneration for executive KMP.
Annual Report 2020 Aventus Group 35
Directors’ Report

Directors’ Reportcontinued
H. ACTUAL REMUNERATION RECEIVED BY EXECUTIVE KMPThe following table outlines the actual benefits received by each KMP during the year ended 30 June 2020 and 2019. Comparative balances are for the period 1 October 2018 to 30 June 2019 representing the period the Aventus Group was internally managed.
Executive KMP Year
Fixedremuneration
$
EIS cashcomponent
$
Vestedstapled
securities$
Total$
Darren Holland 2020 693,018 190,312 – 883,330
20191
(9 months)543,750 – – 543,750
Lawrence Wong 2020 451,283 114,910 267,219 833,412
20191
(9 months)328,313 – – 328,313
1 Comparative balances are for the 9-month period 1 October 2018 to 30 June 2019 representing the period the Aventus Group was internally managed.
The amounts disclosed above are not the same as the remuneration expensed to the income statement in accordance with the accounting standards. The directors believe remuneration received is more relevant to the users of the financial statements for the following reasons:
> The statutory remuneration expense is based on historic cost and does not reflect the value of the stapled securities when they are actually received by the KMPs.
> The statutory remuneration expense shows benefits before they are actually received by the KMPs.
I. PERFORMANCE BASED REMUNERATION GRANTED AND FORFEITED DURING THE YEARThe table below shows for each KMP how much of their variable remuneration were awarded and how much were forfeited.
KMP Year
Maximumvariable
remuneration$
Awarded$
Awarded%
Forfeited$
Forfeited%
Darren Holland 2020 746,750 485,388 65% 261,362 35%
20191
(9 months)543,750 380,625 70% 163,125 30%
Lawrence Wong 2020 450,883 293,074 65% 157,809 35%
20191
(9 months)328,313 229,819 70% 98,494 30%
1 Comparative balances are for the 9-month period 1 October 2018 to 30 June 2019 representing the period the Aventus Group was internally managed.
J. RESTRICTED STAPLED SECURITIESA reconciliation of the movement in restricted stapled securities granted during the financial year is outlined as follows:
KMP Year
Balance atthe beginning
of the financialyear Issued Vested
Balance atthe end of thefinancial year
Value yetto vest
$
Darren Holland 2020 – 72,0881 – 72,088 190,312
2019 – – – – –
Lawrence Wong 2020 224,554 43,5261 (112,277) 155,803 382,128
2019 – 224,5542 – 224,554 534,439
1 Securities were issued at a price of $2.64 per security.
2 Securities were issued at a price of $2.38 per security.
Remuneration report continued
36

K. OVERVIEW OF NON-EXECUTIVE DIRECTOR REMUNERATIONNon-executive directors are entitled to a board fee and fees for chairing or participating on board committees of AHL and ACL. Fees are inclusive of superannuation.
Non-executive directors are not entitled to participate in any variable remuneration schemes or receive any performance-based remuneration entitlements.
The following table outlines annual remuneration of non-executive directors (including statutory superannuation) excluding voluntary reductions taken for the period 1 April 2020 to 30 June 2020.
YearBoard
$
Audit, risk andcompliancecommittee
$
People, culture& remuneration
committee$
Chair 2020 $185,400 $10,300 $10,300
2019 $180,000 $10,000 $10,000
Member 2020 $92,700 $5,150 $5,150
2019 $90,000 $5,000 $5,000
The chair of the board does not receive an additional fee for participation on the respective committees. Fees will be reviewed annually by the board taking into account comparable roles and market data provided by independent remuneration advisors.
For the year ending 30 June 2021 there will be no change to remuneration for non-executive directors.
The AHL constitution provides a limit of $1 million (or such greater amount as may be fixed by AHL in a general meeting) on the total aggregate remuneration which may be provided to all non-executive directors of AHL in any financial year for their services as directors.
Actual remuneration derived by non-executive directors for the year ended 30 June 2020 is summarised below.
In response to the COVID-19 pandemic non-executive directors undertook the following voluntary reductions in remuneration for the period 1 April 2020 to 30 June 2020:
> Bruce Carter, Robyn Stubbs, Kieran Pryke – 60% of director fees;
> Brett Blundy – 100% of director fees (from 1 April 2020 to his resignation on 12 May 2020); and
> Ray Itaoui – 100% of director fees (from his appointment on 29 May 2020 to 30 June 2020).
NameBoard1
$
Audit, risk andcompliancecommittee1
$
People, culture& remuneration
committee1
$Super
$
Voluntaryreduction
$Total
$
Bruce Carter 177,358 – – 8,042 (27,810) 157,590
Kieran Pryke 84,658 9,406 – 8,936 (15,450) 87,550
Robyn Stubbs 84,658 4,703 9,406 9,383 (16,222) 91,928
Brett Blundy 80,240 – 4,458 – (11,311) 73,387
Ray Itaoui 8,472 – 471 – (8,943) –
Total 435,386 14,109 14,335 26,361 (79,736) 410,455
1 Short-term benefits as per Corporations Regulation 2M.3.03(1) Item 6.
Actual remuneration derived by non-executive directors for the 9-month period 1 October 2018 to 30 June 2019 is summarised as follows:
NameBoard1
$
Audit, risk andcompliancecommittee1
$
People, culture& remuneration
committee1
$Super
$Total
$
Bruce Carter 123,288 – – 11,712 135,000
Kieran Pryke 61,644 6,849 – 6,507 75,000
Robyn Stubbs 61,644 3,425 6,849 6,832 78,750
Brett Blundy 67,500 – 3,750 – 71,250
Total 314,076 10,274 10,599 25,051 360,000
1 Short-term benefits as per Corporations Regulation 2M.3.03(1) Item 6.
Annual Report 2020 Aventus Group 37
Directors’ Report

Directors’ Reportcontinued
L. ADDITIONAL INFORMATIONStapled security holdings of KMP
Balance at 1 July 2019
Receivedon vesting
of restrictedsecurities
Otherchanges
Balance at30 June 2020
Bruce Carter 1,189,312 – – 1,189,312
Kieran Pryke 70,873 – – 70,873
Robyn Stubbs 41,364 – – 41,364
Brett Blundy 170,887,938 – (13,284,565) 157,603,373
Nico van der Merwe(alternative director to Brett Blundy) – – – –
Ray Itaoui 30,636,484 – 435,000 31,071,484
Darren Holland (CEO) 12,330,177 – (4,800,000) 7,530,177
Lawrence Wong (CFO) 369,768 112,277 – 482,045
Option holdings of KMPThere were no options over stapled securities held by KMP during the financial year or at 30 June 2020 or 2019.
Loans to KMP and their related partiesThere were no loans to KMP or their related parties during the financial year or at 30 June 2020 or 2019.
Reliance on external remuneration consultantsIn the prior financial year, the board engaged Ernst & Young to review remuneration policies, review employment contracts and to assist with the design and establishment of the EIS. Ernst & Young was paid $141,000 for these services.
No remuneration recommendations were provided by Ernst & Young or any other advisor during the current financial year.
Meetings of directorsThe number of meetings of the board of directors and each board committee held during the period and the numbers of meetings attended by each director are as follows:
Board meetingAudit risk and
compliance committeePeople, culture and
remuneration committee
Attended Eligible to attend Attended Eligible to attend Attended Eligible to attend
Bruce Carter 7 7 4 4 4 4
Kieran Pryke 7 7 4 4 N/A N/A
Robyn Stubbs 7 7 3 4 4 4
Darren Holland 7 7 N/A N/A N/A N/A
Brett Blundy1 4 6 N/A N/A 2 3
Nico van der Merwe (alternate director to Brett Blundy)1 2 2 N/A N/A N/A N/A
Ray Itaoui2 1 1 N/A N/A 1 1
1 Resigned on 12 May 2020.
2 Appointed on 29 May 2020.
Remuneration report continued
38

ACL’s interests in ARPFACL did not hold any securities in ARPF at 30 June 2020 or 30 June 2019.
Fees paid to ACL and associatesFees paid to ACL and associates during the financial year are disclosed in note 36(d) to the financial statements.
Interests in ARPFThe number of securities in ARPF issued during the financial year and the total number of securities on issue at 30 June 2020 are disclosed in note 30 to the financial statements.
Securities under optionNo options over unissued securities were granted during the financial year. There were no securities under option at 30 June 2020 or at the date of this report.
Environmental regulationsThe Aventus Group’s development activities are subject to development approvals and environmental regulations under Commonwealth, state and local government legislation. To the best of the directors’ knowledge, development activities during the financial year have been undertaken in compliance with development approvals and applicable environmental regulations.
Events occurring after the reporting periodAcquisition of development landOn 20 July 2020 the Aventus Group settled the acquisition of development land adjoining Epping Hub for $11.5 million excluding GST. Refer to note 40 for further information.
Former Masters Lease at Cranbourne HomeA subsidiary of the Aventus Group, Aventus Cranbourne Thompsons Road Pty Ltd, is the lessor (Landlord) under the lease of the former Masters store at Cranbourne Home (Head Lease).
As announced in September 2019 the Landlord appealed the judgement of the Supreme Court of Victoria in relation to the provision of its consent to a proposed sub-lease of part of the premises at Cranbourne previously occupied by Masters.
On 5 August 2020 it was announced the appeal was successful. The Court of Appeal found the Landlord did not act unreasonably in regards to the requests and set aside the decision of the trial judge.
The Head Lease remains on foot until 30 September 2030 including the guarantee by Woolworths Limited for the performance by Home Consortium Leasehold Pty Ltd (formerly Masters Home Improvement Australia Pty Ltd) of its obligations under the Head Lease.
There has not been any other matter or circumstance occurring subsequent to the end of the financial year that has significantly affected, or may significantly affect, the operations of the Aventus Group or AHL Group, the results of those operations, or the state of affairs of the Aventus Group or AHL Group in future financial years.
Insurance of officers and indemnitiesDuring the financial year, the Aventus Group and AHL paid a premium to insure the directors, company secretaries and officers against a liability incurred as such a director, secretary or executive officer to the extent permitted by the Corporations Act 2001. The contract of insurance prohibits disclosure of the nature of the liability and the amount of the premium. So long as officers act in accordance with ARPF’s and AHL’s constitution and the law, the officers remain indemnified out of the assets of the Aventus Group and AHL Group against losses incurred while acting on behalf of the Aventus Group and AHL Group.
To the extent permitted by law, ACL and AHL have agreed to indemnify the auditors of the Aventus Group, Ernst & Young, as part of the terms of its audit engagement agreement, against claims by third parties arising from the audit except for any loss in respect of any matters which are finally determined to have resulted from Ernst & Young’s negligent, wrongful or wilful acts or omissions. No payment has been made to indemnify Ernst & Young during or since the financial year.
The Aventus Group and AHL Group have not otherwise, during or since the end of the financial period, except to the extent permitted by law, indemnified or agreed to indemnify an officer or auditor.
Annual Report 2020 Aventus Group 39
Directors’ Report

Directors’ Reportcontinued
Audit and non-audit servicesDetails of amounts paid or payable to Ernst & Young for audit and non-audit services during the financial year are disclosed in note 42 to the financial statements.
The directors are satisfied that the provision of non-audit services did not compromise the auditor’s independence requirements under the Corporations Act 2001 as:
> all non-audit services have been reviewed by the Audit, Risk and Compliance Committee to ensure they do not impact on the impartiality and objectivity of the auditor; and
> none of the services undermine the general principles relating to auditor independence as set out in Accounting Professional and Ethical Standards Board APES 110 Code of Ethics for Professional Accountants.
Auditor’s independence declarationA copy of the auditor’s independence declaration as required under section 307C of the Corporations Act 2001 is set out on page 41.
Rounding of amountsIn accordance with ASIC Legislative Instrument 2016/191 amounts disclosed in the directors’ report and the financial report for the Aventus Group have been rounded off to the nearest hundred thousand dollars, or in certain cases, to the nearest thousand dollars or nearest dollar. AHL Group balances have been rounded to the nearest thousand dollars, or in certain cases to the nearest dollar.
This report is made in accordance with a resolution of the directors of ACL and AHL made pursuant to s298(2) of the Corporations Act 2001.
Darren Holland Bruce Carter Executive Director Chair
Sydney Sydney 24 August 2020 24 August 2020
40

Auditor’s Independence Declaration
A member firm of Ernst & Young Global Limited Liability limited by a scheme approved under Professional Standards Legislation
30
Ernst & Young Services Pty Limited 200 George Street Sydney NSW 2000 Australia GPO Box 2646 Sydney NSW 2001
Tel: +61 2 9248 5555 Fax: +61 2 9248 5959 ey.com/au
Auditor’s Independence Declaration to the Directors of Aventus Capital Limited as the Responsible Entity of Aventus Retail Property Fund and the Directors of Aventus Holdings Limited As lead auditor for the audit of the financial report of Aventus Group and Aventus Holdings Limited for the financial year ended 30 June 2020, I declare to the best of my knowledge and belief, there have been:
a) no contraventions of the auditor independence requirements of the Corporations Act 2001 in relation to the audit; and
b) no contraventions of any applicable code of professional conduct in relation to the audit. This declaration is in respect of Aventus Retail Property Fund and Aventus Holdings Limited and the entities they controlled during the financial year. Ernst & Young Mark Conroy Partner 24 August 2020
Annual Report 2020 Aventus Group 41

Consolidated Statement of Comprehensive IncomeFor the Financial Year Ended 30 June 2020
Notes
AventusGroup
2020$m
AventusGroup
2019$m
AHLGroup
2020$’000
AHLGroup
20191
$’000
Revenue
Rental and other property revenue 167.5 166.3 – –
Revenue from services 5 1.8 0.6 18,059 13,808
Other revenue 0.6 0.4 689 642
169.9 167.3 18,748 14,450
Other income
Net gain/(loss) on movement in fair value of investment properties (37.3) 39.5 – –
Total revenue and other income 132.6 206.8 18,748 14,450
Expenses
Property expenses (35.0) (35.4) – –
Finance costs 6 (26.3) (42.6) (3,426) (3,335)
Management fees 36(d) – (2.6) – –
Transaction costs 7 – (5.2) – (689)
Employee benefits expense 8 (8.9) (6.4) (10,159) (7,557)
Depreciation (1.1) – (920) (49)
Other expenses (4.4) (4.4) (3,286) (3,494)
Total expenses (75.7) (96.6) (17,791) (15,124)
Profit/(loss) before income tax 56.9 110.2 957 (674)
Income tax (expense)/benefit 9(a) (0.2) 0.2 (190) 212
Profit for the year 56.7 110.4 767 (462)
Other comprehensive income for the year net of tax – – – –
Total comprehensive income for the year 56.7 110.4 767 (462)
Profit/(loss) for the year and total comprehensive income/(loss) for the year attributable to:
ARPF 67.4 119.7 – –
AHL (10.7) (9.3) 767 (462)
Total 56.7 110.4 767 (462)
Earnings per security
Basic and diluted earnings per security attributable to the securityholders (cents per security) 10 10.3 21.1 0.1 (0.1)
The consolidated statement of comprehensive income should be read in conjunction with the accompanying notes.
1 AHL was incorporated on 20 July 2018. Accordingly, 2019 AHL Group balances disclosed in the consolidated statement of comprehensive income and corresponding notes are for the period 20 July 2018 to 30 June 2019.
42

Consolidated Balance SheetAs at 30 June 2020
Notes
Aventus GroupJune 2020
$m
Aventus GroupJune 2019
$m
AHL GroupJune 2020
$’000
AHL GroupJune 2019
$’000
Assets
Current assets
Cash and cash equivalents 11 39.2 8.1 3,929 5,484
Trade and other receivables 12 6.2 1.9 2,113 1,861
Rental guarantees 13 2.1 1.1 – –
Current tax assets 14 0.2 – 202 –
Other assets 15 4.4 2.1 143 166
Total current assets 52.1 13.2 6,387 7,511
Non-current assets
Plant and equipment 16 0.1 0.1 145 109
Right-of-use asset 17 2.9 – 2,005 –
Investments in associates 18 5.8 – – –
Rental guarantees 13 1.0 2.5 – –
Investment properties 19 1,930.3 1,973.8 – –
Intangible assets 20 144.2 144.2 186,002 186,002
Total non-current assets 2,084.3 2,120.6 188,152 186,111
Total assets 2,136.4 2,133.8 194,539 193,622
Liabilities
Current liabilities
Trade and other payables 21 (23.1) (21.6) (3,249) (2,178)
Distributions payable 22 (13.1) (22.5) – –
Lease liabilities 23 (1.0) – (834) –
Derivative financial instruments 24 (1.8) (0.3) – –
Current tax liabilities 25 – (0.7) – (653)
Provision for employee benefits 26 (0.4) (0.5) (379) (532)
Deferred revenue 27 (4.0) (2.4) – –
Total current liabilities (43.4) (48.0) (4,462) (3,363)
Non-current liabilities
Trade and other payables 21 – (0.1) – (140)
Borrowings 28 (735.0) (770.8) (84,941) (89,511)
Lease liabilities 23 (2.0) – (1,209) –
Derivative financial instruments 24 (15.0) (15.2) – –
Deferred tax liabilities 29 (0.3) – (42,075) (41,807)
Provision for employee benefits 26 (0.2) (0.2) (222) (193)
Total non-current liabilities (752.5) (786.3) (128,447) (131,651)
Total liabilities (795.9) (834.3) (132,909) (135,014)
Net assets 1,340.5 1,299.5 61,630 58,608
Equity
Contributed equity 30 1,118.2 1,071.2 – –
Reserves 31 0.9 0.1 – –
Retained earnings 32 234.4 232.8 – –
Total equity attributable to ARPF 1,353.5 1,304.1 – –
Contributed equity 30 6.9 4.7 61,283 59,062
Reserves 31 0.1 – 42 8
(Accumulated losses)/retained earnings 32 (20.0) (9.3) 305 (462)
Total equity attributable to AHL (13.0) (4.6) 61,630 58,608
Total equity 1,340.5 1,299.5 61,630 58,608
The consolidated balance sheet should be read in conjunction with the accompanying notes.
Annual Report 2020 Aventus Group 43
Financial Report

Consolidated Statement of Changes in EquityFor the Financial Year Ended 30 June 2020
Aventus Group Notes
ARPF Contrib-
utedequity
$m
ARPFReserves
$m
ARPF Retainedearnings
$m
ARPFTotal
equity$m
AHLContrib-
utedequity
$m
AHLReserves
$m
AHLAccum-
ulated losses
$m
AHLTotal
equity$m
Aventus Group
Totalequity
$m
Balance at1 July 2018 975.1 – 200.1 1,175.2 – – – – 1,175.2
Profit/(loss) for the year/period – – 119.7 119.7 – – (9.3) (9.3) 110.4
Other comprehensive income – – – – – – – – –
Total comprehensive income/(loss) for the year/period – – 119.7 119.7 – – (9.3) (9.3) 110.4
Issue of securities net of transaction costs 30 96.1 – – 96.1 4.7 – – 4.7 100.8
Security based payments 31 – 0.1 – 0.1 – – – – 0.1
Distributions paid or provided for 33 – – (87.0) (87.0) – – – – (87.0)
Balance at30 June 2019 1,071.2 0.1 232.8 1,304.1 4.7 – (9.3) (4.6) 1,299.5
Balance at1 July 2019 1,071.2 0.1 232.8 1,304.1 4.7 – (9.3) (4.6) 1,299.5
Profit/(loss) for the year – – 67.4 67.4 – – (10.7) (10.7) 56.7
Other comprehensive income – – – – – – – – –
Total comprehensive income/(loss) for the year – – 67.4 67.4 – – (10.7) (10.7) 56.7
Issue of securities net of transaction costs 30 47.0 (0.4) – 46.6 2.2 – – 2.2 48.8
Security based payments 31 – 1.2 – 1.2 – 0.1 – 0.1 1.3
Distributions paidor provided for 33 – – (65.8) (65.8) – – – – (65.8)
Balance at30 June 2020 1,118.2 0.9 234.4 1,353.5 6.9 0.1 (20.0) (13.0) 1,340.5
The consolidated statement of changes in equity should be read in conjunction with the accompanying notes.
44

AHL Group Notes
Contributedequity$’000
Reserves$’000
Retainedearnings/
(accumulatedlosses)
$’000
Totalequity$’000
Balance at 20 July 2018 – – – –
Loss for the period – – (462) (462)
Other comprehensive income – – – –
Total comprehensive loss for the period – – (462) (462)
Issue of securities net of transaction costs 30 59,062 – – 59,062
Security based payments 31 – 8 – 8
Dividends paid or provided for – – – –
Balance at 30 June 2019 59,062 8 (462) 58,608
Balance at 1 July 2019 59,062 8 (462) 58,608
Profit for the year – – 767 767
Other comprehensive income – – – –
Total comprehensive income for the year – – 767 767
Issue of securities net of transaction costs 30 2,221 (20) – 2,201
Security based payments 31 – 54 – 54
Dividends paid or provided for – – – –
Balance at 30 June 2020 61,283 42 305 61,630
The consolidated statement of changes in equity should be read in conjunction with the accompanying notes.
Annual Report 2020 Aventus Group 45
Financial Report

Consolidated Statement of Cash FlowsFor the Financial Year Ended 30 June 2020
Notes
AventusGroup
2020$m
AventusGroup
2019$m
AHLGroup
2020$’000
AHLGroup
20191
$’000
Cash flows from operating activities
Rental and other property revenue received 178.1 185.2 – –
Receipts from services 1.8 0.5 18,639 14,443
Other revenue received 0.6 0.3 758 684
Payments to suppliers and employees (56.0) (73.5) (15,136) (11,938)
Payment of transaction costs – (5.8) – (4)
Finance costs paid (24.2) (26.0) (2,710) (3,335)
Income tax paid (0.8) – (778) (15)
Net cash inflows/(outflows) from operating activities 34(a) 99.5 80.7 773 (165)
Cash flows from investing activities
Payments for capital expenditure (40.1) (44.3) – –
Payment for plant and equipment (0.1) (0.1) (104) (62)
Proceeds on disposal of subsidiary 36.4 – – –
Distributions from associates 0.2 – – –
Payments for businesses net of cash/net cash acquired from business combination – (56.2) – 6,875
Advances to related parties – – (7,050) (2,064)
Repayment of advances to related parties – – 5,647 900
Net cash inflows/(outflows) from investing activities (3.6) (100.6) (1,507) 5,649
Cash flows from financing activities
Proceeds from issue of securities 39.2 – – –
Security issue transaction costs (0.3) – – –
Proceeds from borrowings 84.5 447.4 – –
Repayment of borrowings (121.5) (350.0) – –
Payment of debt establishment costs (0.4) (3.7) – –
Distributions paid (65.3) (69.3) – –
Principal elements of lease payments (1.0) – (821) –
Net cash inflows/(outflows) from financing activities (64.8) 24.4 (821) –
Net increase/(decrease) in cash and cash equivalents 31.1 4.5 (1,555) 5,484
Cash at the beginning of the financial year 8.1 3.6 5,484 –
Cash at the end of the financial year 11 39.2 8.1 3,929 5,484
The consolidated statement of cash flows should be read in conjunction with the accompanying notes.
1 AHL was incorporated on 20 July 2018. Accordingly, 2019 AHL Group balances disclosed in the consolidated statement of cash flows and corresponding notes are for the period 20 July 2018 to 30 June 2019.
46

Notes to the Consolidated Financial Statements
1. Basis of preparationa) The Aventus GroupThe Aventus Group is a stapled entity comprising the Aventus Retail Property Fund (“ARPF”) (ARSN 608 000 764) and its controlled entities (“the ARPF Group”) and Aventus Holdings Limited (“AHL”) (ACN 627 640 180) and its controlled entities (“the AHL Group”). For financial reporting purposes ARPF has been deemed the parent entity of the Aventus Group. The consolidated financial statements of the Aventus Group comprise ARPF and its controlled entities which includes AHL.
The stapled securities of the Aventus Group comprise one unit in ARPF and one share in AHL. Securities of ARPF and AHL were stapled on 1 October 2018. Stapled securities cannot be traded or dealt with separately. ARPF and AHL remain separate legal entities in accordance with the Corporations Act 2001.
b) Statement of complianceThese general purpose financial statements have been prepared in accordance with ARPF’s and AHL’s constitution, Australian Accounting Standards and Interpretations issued by the Australian Accounting Standards Board and the Corporations Act 2001. The Aventus Group and AHL Group are for-profit entities for the purpose of preparing the financial statements.
The consolidated financial statements of the Aventus Group and AHL Group also comply with International Financial Reporting Standards as issued by the International Accounting Standards Board.
The financial statements were authorised for issue by the directors on 24 August 2020.
c) Comparative informationAHL was incorporated on 20 July 2018. Accordingly, prior period balances disclosed in the AHL Group consolidated statement of comprehensive income, statement of changes in equity and statement of cash flows are for the period 20 July 2018 to 30 June 2019.
Where necessary, comparative information has been adjusted to conform with changes in presentation in the current year.
d) Historical cost conventionThe financial statements have been prepared on a historical cost basis, except for the following:
> financial assets and derivative financial instruments measured at fair value; and
> investment properties measured at fair value.
e) Rounding of amountsIn accordance with ASIC Legislative Instrument 2016/191 amounts disclosed in the directors’ report and the financial report for the Aventus Group have been rounded off to the nearest hundred thousand dollars, or in certain cases, to the nearest thousand dollars or nearest dollar. AHL Group balances have been rounded to the nearest thousand dollars, or in certain cases to the nearest dollar.
f) Functional and presentation currencyAll amounts presented in the consolidated financial statements are expressed in Australian dollars which is the functional and presentation currency of the Aventus Group and AHL Group.
g) New and amended accounting standards and interpretations adopted by the Aventus GroupThe Aventus Group and AHL Group have adopted all of the new and revised accounting standards issued by the Australian Accounting Standards Board that are relevant to its operation and effective for the financial reporting period beginning 1 July 2019 including AASB 16 Leases (AASB 16). The directors’ assessment of the impact of AASB 16 is set out below. Other new and amended accounting standards adopted from 1 July 2019 did not have any impact on the amounts recognised in prior periods and are not expected to significantly affect the current or future periods.
AASB 16This note explains the impact of the adoption of AASB 16 on the financial statements and discloses the new accounting policies that have been applied from 1 July 2019. The Aventus Group and AHL Group have adopted AASB 16 retrospectively from 1 July 2019, but have not restated comparatives for the 2019 reporting period, as permitted under the specific transitional provisions in the standard. The reclassifications and the adjustments arising from the new leasing rules are therefore recognised in the opening balance sheet on 1 July 2019.
Adjustments recognised on adoption of AASB 16On adoption of AASB 16 lease liabilities were recognised in relation to leases which had previously been classified as ‘operating leases’ under the principles of AASB 117 Leases. These liabilities were measured at the present value of the remaining lease payments, discounted using the lessee’s incremental borrowing rate as of 1 July 2019.
The associated right-of-use assets were measured on a retrospective basis with the cumulative effect of initially applying the standard recognised on 1 July 2019. There were no onerous lease contracts that would have required an adjustment to the right-of-use assets at the date of initial application. The recognised right-of-use assets relate to leases of land and buildings. The change in accounting policy included an option to present an asset and liability at equal value. This resulted in a $4.0 million and $2.9 million increase of right-of-use assets and lease liabilities for the Aventus Group and AHL Group respectively on 1 July 2019.
Annual Report 2020 Aventus Group 47
Financial Report

Notes to the Consolidated Financial Statementscontinued
1. Basis of preparation continuedg) New and amended accounting standards and interpretations adopted by the Aventus Group continuedLeasing activities and how these are accounted forThe business leases land and buildings under operating leases.
Until the 2019 financial year, leases were classified as either finance or operating leases. Payments made under operating leases (net of any incentives received from the lessor) were charged to profit or loss on a straight-line basis over the period of the lease.
From 1 July 2019, leases are recognised as a right-of-use asset and a corresponding liability at the date at which the leased asset is available for use by the group. Each lease payment is allocated between the liability and finance costs. The finance cost is charged to profit or loss over the lease period so as to produce a constant periodic rate of interest on the remaining balance of the liability for each period. The right-of-use asset is depreciated over the shorter of the asset’s useful life and the lease term on a straight-line basis.
Assets and liabilities arising from a lease are initially measured on a present value basis. Lease liabilities include the net present value of fixed payments less any lease incentives receivable.
The lease payments are discounted using the interest rate implicit in the lease. If that rate cannot be determined, the lessee’s incremental borrowing rate is used, being the rate that the lessee would have to pay to borrow the funds necessary to obtain an asset of similar value in a similar economic environment with similar terms and conditions.
Right-of-use assets are measured at cost comprising the following:
> the amount of the initial measurement of lease liability
> any lease payments made at or before the commencement date less any lease incentives received
> any initial direct costs, and
> restoration costs.
Payments associated with short-term leases and leases of low-value assets are recognised on a straight-line basis as an expense in profit or loss. Short-term leases are leases with a lease term of 12 months or less.
h) New and amended accounting standards and interpretations issued but not yet adoptedCertain new accounting standards and interpretations have been published that are not mandatory for the year ended 30 June 2020 and have not been early adopted by the Aventus Group or AHL Group. These standards are not expected to have a material impact in the current or future reporting periods and on foreseeable future transactions.
2. Summary of significant accounting policiesThis note provides a list of all significant accounting policies adopted in the preparation of these consolidated financial statements. References to “Group” apply to the Aventus Group and the AHL Group unless otherwise stated in the relevant accounting policy. With the exception of changes to accounting policies resulting from the adoption of AASB 16 Leases the accounting policies adopted are consistent with those of the previous financial year.
a) Principles of consolidationSubsidiaries are all entities over which the Group has control. The Group controls an entity when the Group is exposed to, or has rights to, variable returns from its involvement with the entity and has the ability to affect those returns through its power to direct the activities of the entity. Subsidiaries are fully consolidated from the date on which control is transferred to the Group. They are deconsolidated from the date that control ceases.
The acquisition method of accounting is used to account for business combinations by the Group.
Inter-entity transactions, balances and unrealised gains on transactions between Group entities are eliminated. Unrealised losses are also eliminated unless the transaction provides evidence of an impairment of the transferred asset. Accounting policies of subsidiaries have been changed where necessary to ensure consistency with the policies adopted by the Group.
When the Group ceases to consolidate for an investment because of a loss of control any retained interest in the entity is remeasured to its fair value with the change in carrying amount recognised in profit or loss.
In addition, any amounts previously recognised in other comprehensive income in respect of that entity are accounted for as if the Group had directly disposed of the related assets or liabilities. This may mean that amounts previously recognised in other comprehensive income are reclassified to profit or loss.
48

b) Business combinationsThe acquisition method of accounting is used to account for all business combinations, regardless of whether equity instruments or other assets are acquired. The consideration transferred for the acquisition of a subsidiary comprises the:
> fair values of the assets transferred
> liabilities incurred to the former owners of the acquired business
> equity interests issued by the Group
> fair value of any asset or liability resulting from a contingent consideration arrangement, and
> fair value of any pre-existing equity interest in the subsidiary.
Identifiable assets acquired and liabilities and contingent liabilities assumed in a business combination are, with limited exceptions, measured initially at their fair values at the acquisition date. The Group recognises any non-controlling interest in the acquired entity on an acquisition-by-acquisition basis either at fair value or at the non-controlling interest’s proportionate share of the acquired entity’s net identifiable assets.
Acquisition-related costs are expensed as incurred.
The excess of the consideration transferred, amount of any non-controlling interest in the acquired entity, and acquisition-date fair value of any previous equity interest in the acquired entity over the fair value of the net identifiable assets acquired is recorded as goodwill. If those amounts are less than the fair value of the net identifiable assets of the subsidiary acquired, the difference is recognised directly in profit or loss as a bargain purchase.
Where settlement of any part of cash consideration is deferred, the amounts payable in the future are discounted to their present value as at the date of exchange. The discount rate used is the entity’s incremental borrowing rate, being the rate at which a similar borrowing could be obtained from an independent financier under comparable terms and conditions.
Contingent consideration is classified either as equity or a financial liability. Amounts classified as a financial liability are subsequently remeasured to fair value with changes in fair value recognised in profit or loss.
If the business combination is achieved in stages, the acquisition date carrying value of the acquirer’s previously held equity interest in the acquiree is remeasured to fair value at the acquisition date. Any gains or losses arising from such remeasurement are recognised in profit or loss.
c) Segment reportingThe Aventus Group has only one reportable segment being investment and management of Australian large format retail assets.
The directors of ACL are the chief operating decision makers of the Aventus Group. Information provided to the directors for strategic decision making is consistent with that presented in the financial report.
d) Revenue recognitionRevenue is measured at the fair value of the consideration received or receivable. Amounts disclosed as revenue are net of allowances, rebates and amounts collected on behalf of third parties. The Group recognises revenue when the amount of revenue can be reliably measured, it is probable that future economic benefits will flow to the entity and specific criteria have been met for each of the Group’s activities as described below.
Revenue for the Group’s business activities is recognised on the following basis:
Rental incomeRental income derived from investment properties is recognised on a straight-line basis over the term of the lease. Initial direct costs incurred in obtaining the lease are added to the carrying amount of the investment property and recognised as expense over the lease term on the same basis as lease income.
The portion of rental income relating to fixed increases in rent in future years is recognised as a separate component of investment properties and amortised on a straight-line basis over the term of the lease.
Revenue from servicesThe AHL Group derives revenue from the provision of property investment, management, development and leasing services. Revenue is recognised in accordance with underlying management agreements in the period in which performance obligations are satisfied and actual services are rendered. Fees are recognised net of rebates.
Interest incomeInterest income is recognised on an accruals basis using the effective interest method. Interest income is disclosed as ‘other income’ in the statement of comprehensive income.
Annual Report 2020 Aventus Group 49
Financial Report

Notes to the Consolidated Financial Statementscontinued
2. Summary of significant accounting policies continuede) ExpensesProperty expensesProperty expenses include rates, taxes, other property outgoings incurred in relation to investment properties and expenses for bad and doubtful debts. Property expenses are recorded on an accruals basis.
Finance costsFinance costs include interest, fair value movements in derivative financial instruments, payments in respect of derivative financial instruments and the amortisation of other costs incurred in respect of obtaining finance. Finance costs associated with the acquisition or construction of a qualifying asset are capitalised as part of the cost of that asset during the period that is required to complete and prepare the asset for its intended use. Borrowing costs not associated with qualifying assets are recognised as an expense when incurred. Other costs incurred in respect of obtaining finance, including loan establishment fees, are deferred and expensed over the term of the respective loan facility.
Management feesManagement fees are recognised on an accruals basis.
Lease expensesUntil 30 June 2019 leases in which a significant portion of the risks and rewards of ownership are not transferred to the Group as lessee were classified as operating leases. Payments made under operating leases (net of any incentives received from the lessor) were charged to profit or loss on a straight-line basis over the period of the lease. The accounting policy for leases from 1 July 2019 is disclosed in note 1(g).
Other expensesAll other expenses are recognised on an accruals basis.
f) Government grantsGrants from the government are recognised at their fair value where there is a reasonable assurance that the grant will be received and the Group will comply with all attached conditions. Grants relating to costs are recognised in profit or loss over the period necessary to match them with costs they are intended to compensate.
g) Income taxARPF GroupUnder current income tax legislation, ARPF is not liable to pay income tax as the net income of ARPF is assessable in the hands of the beneficiaries (the securityholders) who are ‘presently entitled’ to the income of ARPF. There is no income of ARPF to which the securityholders are not presently entitled.
As a result, deferred taxes have not been recognised in the financial statements in relation to differences between the carrying amounts of assets and liabilities and their respective tax bases, including taxes on capital gains which could arise in the event of a sale of investments for the amount at which they are stated in the financial statements. In the event that taxable gains are realised by ARPF, these gains would be included in the taxable income that is assessable in the hands of the securityholders as noted above.
Realised capital losses are not distributed to securityholders but are retained within ARPF to be offset against any realised capital gains. The benefit of any carried forward capital losses are generally not recognised in the financial statements, on the basis that ARPF is a flow through trust for Australian tax purposes. If in any period realised capital gains exceed realised capital losses, including those carried forward from earlier periods and eligible for offset, the excess is included in taxable income that is assessable in the hands of securityholders in that period and is distributed to securityholders in accordance with the requirements of ARPF’s constitution.
AHL GroupThe income tax expense or revenue for the period is the tax payable on the current period’s taxable income based on the applicable income tax rate adjusted by changes in deferred tax assets and liabilities attributable to temporary differences and to unused tax losses.
The current income tax charge is calculated on the basis of the tax laws enacted or substantively enacted at the end of the reporting period.
Deferred income tax is provided in full, using the liability method, on temporary differences arising between the tax bases of assets and liabilities and their carrying amounts in the consolidated financial statements. However, deferred tax liabilities are not recognised if they arise from the initial recognition of goodwill. Deferred income tax is also not accounted for if it arises from initial recognition of an asset or liability in a transaction other than a business combination that at the time of the transaction affects neither accounting nor taxable profit or loss. Deferred income tax is determined using tax rates (and laws) that have been enacted or substantially enacted by the end of the reporting period and are expected to apply when the related deferred income tax asset is realised or the deferred income tax liability is settled.
Deferred tax assets are recognised only if it is probable that future taxable amounts will be available to utilise those temporary differences and losses.
50

Deferred tax assets and liabilities are offset when there is a legally enforceable right to offset current tax assets and liabilities and when the deferred tax balances relate to the same taxation authority. Current tax assets and tax liabilities are offset where the entity has a legally enforceable right to offset and intends either to settle on a net basis, or to realise the asset and settle the liability simultaneously.
Current and deferred tax is recognised in profit or loss, except to the extent that it relates to items recognised in other comprehensive income or directly in equity. In this case, the tax is also recognised in other comprehensive income or directly in equity, respectively.
Tax consolidation legislationAHL and its wholly-owned controlled entities have implemented the tax consolidation legislation.
The head entity, AHL, and the controlled entities in the tax consolidated group account for their own current and deferred tax amounts. These tax amounts are measured as if each entity in the tax consolidated group continues to be a stand-alone taxpayer in its own right.
In addition to its own current and deferred tax amounts, AHL also recognises the current tax liabilities (or assets) and the deferred tax assets arising from unused tax losses and unused tax credits assumed from controlled entities in the tax consolidated group.
The entities have entered into a tax funding agreement under which the wholly-owned entities fully compensate AHL for any current tax payable assumed and are compensated by AHL for any current tax receivable and deferred tax assets relating to unused tax losses or unused tax credits that are transferred to AHL under the tax consolidation legislation. The funding amounts are determined by reference to the amounts recognised in the wholly-owned entities’ financial statements.
The amounts receivable/payable under the tax funding agreement are due upon receipt of the funding advice from the head entity, which is issued as soon as practicable after the end of each financial year. The head entity may also require payment of interim funding amounts to assist with its obligations to pay tax instalments.
Assets or liabilities arising under tax funding agreements with the tax consolidated entities are recognised as current amounts receivable from or payable to other entities in the group.
Any difference between the amounts assumed and amounts receivable or payable under the tax funding agreement are recognised as a contribution to (or distribution from) wholly-owned tax consolidated entities.
h) Goods and service tax (“GST”)Revenues, expenses and assets are recognised net of the amount of associated GST, unless the GST incurred is not recoverable from the Australian Taxation Office (“ATO”). In this case it is recognised as part of the cost of acquisition of the asset or as part of the expense.
Receivables and payables are stated inclusive of the amount of GST receivable or payable. The net amount of GST recoverable from, or payable to, the ATO is included within receivables or payables in the balance sheet.
Cash flows are presented on a gross basis. The GST components of cash flows arising from investing or financing activities which are recoverable from, or payable to the ATO, are presented as operating cash flows.
i) Cash and cash equivalentsFor the purpose of presentation in the statement of cash flows, cash and cash equivalents includes cash on hand, deposits held at call with financial institutions, other short-term, highly liquid investments with original maturities of three months or less that are readily convertible to known amounts of cash and which are subject to an insignificant risk of changes in value.
j) Trade and other receivablesTrade and other receivables are initially recognised at the amounts due to the Group, and subsequently at amortised cost, less any provision for doubtful debts. Receivables are usually settled within 30 days of recognition. Receivables are presented as current assets unless collection is not expected for greater than 12 months after reporting date.
Collectability of receivables is reviewed on an ongoing basis. The Group applies the AASB 9 simplified approach to measuring expected credit losses which uses a lifetime expected loss allowance for all trade receivables. Expected loss rates are based on historical payment profiles adjusted for current and forward-looking macroeconomic factors affecting the ability of debtors to settle the receivables.
Trade receivables are written off when there is no reasonable expectation of recovery. Impairment losses on trade receivables are presented as net impairment losses within operating profit. Subsequent recoveries of amounts previously written off are credited against the same line item.
k) Rental guaranteesRental guarantees are measured as the expected future cash flows to be received under the guarantee arrangements and are disclosed as a separate asset in the balance sheet. Guarantees are recognised in the statement of comprehensive income on an amortised cost basis over the period of the guarantee.
Annual Report 2020 Aventus Group 51
Financial Report

Notes to the Consolidated Financial Statementscontinued
2. Summary of significant accounting policies continuedl) Plant and equipmentPlant and equipment are stated at historical cost less depreciation and accumulated impairment losses. Historical cost includes expenditure that is directly attributable to the acquisition of the items.
Subsequent costs are included in the asset’s carrying amount or recognised as a separate asset, as appropriate, only when it is probable that future economic benefits associated with the item will flow to the Group and the cost of the item can be measured reliably. The carrying amount of any component accounted for as a separate asset is derecognised when replaced. All other repairs and maintenance are charged to profit or loss during the reporting period in which they are incurred.
Depreciation is calculated using the straight-line method to allocate the cost of the asset, net of any residual amount, over its estimated useful life. The useful life of plant and equipment ranges from 2.5 years to 20 years.
The assets’ residual values and useful lives are reviewed, and adjusted if appropriate, at the end of each reporting period.
An asset’s carrying amount is written down immediately to its recoverable amount if the asset’s carrying amount is greater than its estimated recoverable amount.
Gains and losses on disposals are determined by comparing proceeds with carrying amount. These are included in profit or loss.
m) Investment in associatesAssociates are all entities over which the Group has significant influence but not control or joint control. Investments in associates are accounted for using the equity method of accounting after initially being recognised at cost.
Under the equity method of accounting, investments are initially recognised at cost and adjusted thereafter to recognise the Group’s share of the post-acquisition profits or losses of the investee in profit or loss, and the group’s share of movements in other comprehensive income of the investee in other comprehensive income. Distributions received or receivable from associates are recognised as a reduction in the carrying amount of the investment.
Where the Group’s share of losses in an equity-accounted investment equals or exceeds its interest in the entity, including any other unsecured long-term receivables, the Group does not recognise further losses, unless it has incurred obligations or made payments on behalf of the other entity.
Unrealised gains on transactions between the Group and its associates are eliminated to the extent of the group’s interest in these entities. Unrealised losses are also eliminated unless the transaction provides evidence of an impairment of the asset transferred. Accounting policies of equity-accounted investees have been changed where necessary to ensure consistency with the policies adopted by the Group.
The carrying amount of equity-accounted investments is tested for impairment in accordance with the policy described in note 1(q).
n) Investment propertiesInvestment properties comprise large format retail centres which are held for long-term rental yields and/or capital appreciation and are not occupied by the Group.
With the exception of investment properties acquired as part of a business combination (refer to note 2b), investment properties are initially measured at cost, including transaction costs. Subsequent to initial recognition, investment properties are measured at fair value.
Fair value is the amount at which the investment property could be exchanged between knowledgeable, willing parties in an arm’s length transaction. A willing seller is neither a forced seller nor one prepared to sell at a price not considered reasonable in the market.
The best evidence of fair value is current prices in an active market for similar properties. Where such information is not available the directors consider information from a variety of sources including:
> current prices in an active market for properties of different nature or recent prices of similar properties in less active markets, adjusted to reflect those differences;
> discounted cash flow projections based on reliable estimates of future cash flows;
> capitalised income projections based upon a property’s estimated net market income, and a capitalisation rate derived from an analysis of market evidence.
Gains and losses arising from changes in fair value of investment properties are recognised in profit or loss in the period in which they arise.
The Group obtains independent valuations for its investment properties at least every two years.
At the end of each reporting period, the directors update their assessment of the fair value of each property, taking into account the most recent independent valuations. The directors determine a property’s value within a range of reasonable fair value estimates. Fair value is determined using a long-term investment period. Specific circumstances of the owner are not taken into account.
The carrying amount of investment properties recorded in the balance sheet may include the cost of acquisition, additions, refurbishments, improvements, lease incentives, leasing costs and assets relating to fixed increases in operating lease rentals in future years.
52

Existing investment properties being developed for continued future use are also carried at fair value.
Where the Group disposes of an investment property at fair value in an arm’s length transaction, the carrying value immediately prior to the sale is adjusted to the transaction price, with a corresponding adjustment recorded in profit or loss.
o) Lease incentives and leasing feesProspective lessees may be offered incentives as an inducement to enter into non-cancellable operating leases. These incentives may take various forms including rent-free periods, upfront cash payments, or a contribution to certain lessee costs such as a fit-out contribution. Leasing fees may also be incurred for the negotiation of leases. Incentives and leasing fees are capitalised in the consolidated balance sheet as a component of investment properties and amortised on a straight-line basis over the term of the lease as an adjustment to rental income.
p) Intangible assetsGoodwillGoodwill is measured as described in note 2(b). Goodwill on acquisitions of subsidiaries is included in intangible assets. Goodwill is not amortised but it is tested for impairment annually, or more frequently if events or changes in circumstances indicate that it might be impaired, and is carried at cost less accumulated impairment losses. Gains and losses on the disposal of an entity include the carrying amount of goodwill relating to the entity sold.
Goodwill is allocated to cash-generating units for the purpose of impairment testing except for goodwill that arises from the recognition of deferred tax on management rights with an indefinite useful life. The allocation is made to those cash-generating units or groups of cash-generating units that are expected to benefit from the business combination in which the goodwill arose. The units or groups of units are identified at the lowest level at which goodwill is monitored for internal management purposes, being the operating segments.
Management rightsManagement rights reflect the right to provide investment and property management services in accordance with management agreements. Management rights acquired as part of a business combination are recognised at fair value at the date of acquisition.
Management rights have an indefinite useful life. Management rights are not subject to amortisation and are tested annually for impairment or more frequently if events or changes in circumstances indicate that they might be impaired.
q) Impairment of assetsAssets, other than intangible assets, are tested for impairment whenever events or changes in circumstances indicate that the carrying amount may not be recoverable. An impairment loss is recognised for the amount by which the asset’s carrying amount exceeds its recoverable amount. The recoverable amount is the higher of an asset’s fair value less costs of disposal and value in use.
For the purposes of assessing impairment, assets are grouped at the lowest levels for which there are separately identifiable cash inflows which are largely independent of the cash inflows from other assets or groups of assets (cash-generating units). Non-financial assets that suffered an impairment are reviewed for possible reversal of the impairment at the end of each reporting period. Impairment of management rights acquired via business combinations will result in a decrease to deferred tax liabilities associated with management rights and a corresponding decrease in goodwill.
r) Trade and other payablesTrade and other payables represent liabilities for goods and services provided to the Group prior to the end of the financial year which are unpaid. The amounts are unsecured and are usually paid within 30 days of recognition. Payables are presented as current liabilities unless payment is not due within 12 months after the reporting period. They are recognised initially at their fair value and subsequently measured at amortised cost using the effective interest method.
s) Employee benefitsA liability is recognised for benefits accruing to employees in respect of wages and salaries, annual leave and long service leave in the period the related service is rendered.
Liabilities recognised in respect of short-term employee benefits are measured at their nominal values using the remuneration rate expected to apply at the time of settlement.
Liabilities recognised in respect of long-term employee benefits are measured at the present value of the estimate future cash outflows to be made by the Group in respect of services provided by employees up to the reporting date.
The obligations are presented as current liabilities in the consolidated balance sheet if the Group does not have an unconditional right to defer settlement for at least twelve months after the reporting period, regardless of when the actual settlement is expected to occur.
Superannuation contributionsSuperannuation contributions are recognised as employee benefits expenses when employees have rendered service entitling them to the contributions.
Annual Report 2020 Aventus Group 53
Financial Report

Notes to the Consolidated Financial Statementscontinued
2. Summary of significant accounting policies continueds) Employee benefits continuedExecutive incentive scheme (EIS)Senior management and executives participate in an EIS whereby, subject to achieving certain KPIs, they will be eligible for annual cash awards and restricted stapled securities vesting over 2, 3 and 4 years.
Annual cash awards are recognised on an accruals basis as part of employee benefits expenses.
The fair value of the restricted stapled securities are estimated at the beginning of the annual EIS performance period and recognised as employee benefits expenses on a straight-line basis over the relevant vesting period with a corresponding increase in equity via an EIS reserve.
When restricted stapled securities are issued they are held in trust, on behalf of EIS participants, for the duration of the vesting period by the Aventus Group Employee Security Trust. The cost of issued restricted stapled securities is initially recognised in a reserve and subsequently transferred to the EIS reserve on vesting date.
t) BorrowingsBorrowings are initially recognised at fair value, net of transaction costs incurred. Borrowings are subsequently measured at amortised cost. Any difference between the proceeds (net of transaction costs) and the redemption amount is recognised in profit or loss over the period of the borrowings using the effective interest method.
Borrowings are classified as current liabilities unless the Group has an unconditional right to defer settlement of the liability for at least 12 months after the reporting period.
u) Derivative financial instrumentsThe Group has entered into derivative financial instruments, in the form of interest rate swap agreements, to partially hedging against interest rate fluctuations on its debt facilities.
The Group has not adopted hedge accounting. Derivative financial instruments are classified as financial instruments at fair value through profit or loss. Derivative financial instruments are initially recognised at fair value on the date the derivative contract is entered into and are subsequently remeasured to their fair value at the end of each reporting period. Subsequent changes in fair value are recognised in profit or loss.
Fair value is determined using valuation techniques with reference to observable market inputs for similar instruments.
Derivative financial instruments are presented as current assets or liabilities as appropriate if they are expected to be settled within 12 months, or presented as non-current assets or liabilities if they are expected to be settled more than 12 months after the end of the reporting period.
v) Distributions/dividends payableA payable is recognised for the amount of any distribution or dividend declared, appropriately authorised and no longer at the discretion of the entity, on or before the end of the reporting period but not distributed at the end of the reporting period.
w) Contributed equityStapled securities are classified as equity and recognised at the fair value of the consideration received. Transaction costs directly attributable to the issue of new ordinary securities are recognised directly in equity as a deduction from the proceeds received.
x) Earnings per securityBasic earnings per securityBasic earnings per security is calculated by dividing the profit or loss attributable to securityholders by the weighted average number of ordinary securities outstanding during the financial year, adjusted for bonus elements in ordinary securities issued during the financial year.
Diluted earnings per securityDiluted earnings per security is calculated by dividing the profit or loss attributable to securityholders, adjusted for the after income tax effect of interest and other financing costs associated with dilutive potential ordinary securities, by the weighted average number of ordinary securities and dilutive potential ordinary securities outstanding during the financial year.
The weighted average number of securities used in calculating basic and diluted earnings per security is retrospectively adjusted for bonus elements in ordinary securities issued during the financial year.
54

3. Critical accounting estimates and judgementsThe preparation of the consolidated financial statements requires the use of critical accounting estimates and judgement. Financial statement balances or transactions involving a higher degree of judgement or complexity, or where assumptions and estimates are significant to the consolidated financial statements are outlined below.
The COVID-19 pandemic has created a higher degree of estimation uncertainty at 30 June 2020 for investment property valuations, assessing the recoverable amounts of intangible assets and estimating loss allowances for trade and other receivables.
Account balance or transaction Notes
Investment properties 19 and 37
Derivative financial instruments 24 and 37
Goodwill and management rights with an indefinite useful life 20
Trade and other receivables – loss allowance 12 and 39(c)
Estimates and judgements are continually evaluated and are based on historical experience and other factors, including expectations of future events, that may have a financial impact on the Aventus Group and are believed to be reasonable under the circumstances.
The resulting accounting estimates may differ from actual results.
4. Segment informationThe Aventus GroupThe Aventus Group has only one reportable segment being the investment and management of Australian large format retail assets.
The directors of ACL are the chief operating decision makers of the Aventus Group. Information provided to the directors for strategic decision making is consistent with that presented in the financial report.
The AHL GroupThe AHL Group has only one reportable segment being the management of Australian large format retail assets.
The directors of AHL are the chief operating decision makers of the AHL Group.
5. Revenue from services
AventusGroup
2020$m
AventusGroup
2019$m
AHL Group
2020$’000
AHL Group
2019$’000
Fees derived from management agreements 1.8 0.6 18,059 13,808
6. Finance costs
AventusGroup
2020$m
AventusGroup
2019$m
AHL Group
2020$’000
AHL Group
2019$’000
Interest expenses 24.0 26.2 3,426 3,335
Amortisation of debt establishment costs 1.6 2.7 – –
Less: amounts capitalised relating to redevelopment of investment properties (0.6) (0.3) – –
25.0 28.6 3,426 3,335
Fair value losses on interest rate swaps 1.3 14.0 – –
Finance costs expensed 26.3 42.6 3,426 3,335
The capitalisation rate used to determine the amount of borrowing costs capitalised during the financial year was the weighted average interest rate applicable to the Aventus Group’s general borrowings.
Annual Report 2020 Aventus Group 55
Financial Report

Notes to the Consolidated Financial Statementscontinued
7. Transaction costs
AventusGroup
2020$m
AventusGroup
2019$m
AHL Group
2020$’000
AHL Group
2019$’000
Advisory fees – 3.9 – –
Other – 1.3 – 689
Total – 5.2 – 689
8. Employee benefits expense
AventusGroup
2020$m
AventusGroup
2019$m
AHL Group
2020$’000
AHL Group
2019$’000
Superannuation expenses 0.8 0.5 774 584
Security based payments expenses 1.2 0.1 1,215 165
Other employee benefits 7.4 5.8 8,707 6,808
JobKeeper payments scheme (0.5) – (537) –
Total 8.9 6.4 10,159 7,557
9. Income tax expense/(benefit)
AventusGroup
2020$m
AventusGroup
2019$m
AHL Group
2020$’000
AHL Group
2019$’000
a) Income tax expense/(benefit)
Current tax
Current tax on profits for the year – 0.2 22 185
Adjustment for current tax of prior periods (0.1) – (100) –
Total current tax expense/(benefit) (0.1) 0.2 (78) 185
Deferred income tax
(Increase)/decrease in deferred tax assets (0.3) (0.4) (333) (397)
Increase/(decrease) in deferred tax liabilities 0.6 – 601 –
Total deferred tax expense/(benefit) 0.3 (0.4) 268 (397)
Income tax expense/(benefit) 0.2 (0.2) 190 (212)
b) Numerical reconciliation of prima facie tax payable to income tax expense/(benefit)
Profit/(loss) before income tax expense 56.9 110.2 957 (674)
Less: ARPF profit not subject to tax (67.4) (119.7) – –
Profit/(loss) subject to taxation (10.5) (9.5) 957 (674)
Prima facie tax at 30% (3.2) (2.9) 287 (202)
Tax effect of amounts which are not deductible/(taxable) in calculating taxable income
Intra-staple transactions 3.5 2.7 – –
Other (0.1) – (97) (10)
Income tax expense/(benefit) 0.2 (0.2) 190 (212)
56

10. Earnings per security
AventusGroup
2020$m
AventusGroup
2019$m
AHL Group
2020$’000
AHL Group
2019$’000
Net profit/(loss) for the year 56.7 110.4 767 (462)
Weighted average number of securities used in calculating basic and diluted earnings per security (m) 551.9 523.6 551.9 420.8
Basic and diluted earnings per security (cents) 10.3 21.1 0.1 (0.1)
11. Cash and cash equivalents
Aventus Group
June 2020$m
Aventus Group
June 2019$m
AHL Group
June 2020$’000
AHL Group
June 2019$’000
Cash at bank and in hand 9.2 5.6 3,929 2,984
Term deposits 30.0 2.5 – 2,500
Total 39.2 8.1 3,929 5,484
12. Trade and other receivables
Aventus Group
June 2020$m
Aventus Group
June 2019$m
AHL Group
June 2020$’000
AHL Group
June 2019$’000
Current
Trade receivables 12.2 1.2 1,669 887
Loss allowance (6.7) (0.6) – –
5.5 0.6 1,669 887
Other receivables 0.7 1.3 444 974
Total 6.2 1.9 2,113 1,861
Critical estimates and judgementsCOVID-19 has created a higher degree of estimation uncertainty in calculating the loss allowance at 30 June 2020. The loss allowance incorporates COVID-19 specific adjustments for rental relief granted or expected to be granted to tenants plus other adjustments based on retailer types, industries, geographical locations and/or specific tenant circumstances. If there are any changes in these assumptions or economic conditions the actual loss allowance required may differ.
Additional information about the loss allowance and exposure to credit risk is disclosed in note 39(c).
13. Rental guarantees
Aventus Group
June 2020$m
Aventus Group
June 2019$m
AHL Group
June 2020$’000
AHL Group
June 2019$’000
Current
Rental guarantees 2.1 1.1 – –
Non-current
Rental guarantees 1.0 2.5 – –
Rental guarantees relate to five investment properties with expiry dates ranging from May 2021 to July 2022.
Annual Report 2020 Aventus Group 57
Financial Report

Notes to the Consolidated Financial Statementscontinued
14. Current tax assets
Aventus Group
June 2020$m
Aventus Group
June 2019$m
AHL Group
June 2020$’000
AHL Group
June 2019$’000
Current
Income tax refund 0.2 – 202 –
15. Other assets
Aventus Group
June 2020$m
Aventus Group
June 2019$m
AHL Group
June 2020$’000
AHL Group
June 2019$’000
Current
Prepayments 4.4 2.1 143 166
16. Plant and equipment
Aventus Group
June 2020$m
Aventus Group
June 2019$m
AHL Group
June 2020$’000
AHL Group
June 2019$’000
Non-current
Plant and equipment – at cost 0.3 0.3 303 292
Accumulated depreciation (0.2) (0.2) (158) (183)
Total 0.1 0.1 145 109
17. Right-of-use assets
Aventus Group
June 2020$m
Aventus Group
June 2019$m
AHL Group
June 2020$’000
AHL Group
June 2019$’000
Non-current
Land 0.9 – – –
Office building 2.0 – 2,005 –
2.9 – 2,005 –
Depreciation recognised by the Aventus Group and AHL Group for right-of-use assets for the year ended 30 June 2020 amounted to $1.0 and $0.8m respectively.
18. Investment in associates
Aventus Group
June 2020$m
Aventus Group
June 2019$m
AHL Group
June 2020$’000
AHL Group
June 2019$’000
Non-current
Investment in Aventus Property Syndicate 1 Fund (APS 1) 5.8 – – –
58

APS 1On 15 November 2019 the Aventus McGraths Hill Holding Trust (McGraths Hill), a 100% owned subsidiary of ARPF, issued new units to external investors. McGraths Hill was also renamed Aventus Property Syndicate 1 Fund (APS 1).
The equity raising diluted ARPF’s ownership interest in APS 1 from 100% to 25.3%. Consequently, ARPF ceased to control APS 1 and derecognised all APS 1 assets and liabilities at their carrying amounts from the consolidated balance sheet including the McGraths Hill Home investment property valued at $42.5 million.
ARPF’s residual investment in APS 1 has been recognised as an investment in an associate. The residual investment was initially recognised at fair value and has been subsequently accounted for using the equity method in accordance with accounting standard AASB 128 Investment in Associates and Joint Ventures.
The movement in the carrying amount of the investment in APS 1 for the period ended 30 June 2020 is as follows:
Aventus Group$m
Balance at 15 November 2019 6.1
Equity accounted profit for the period –
Distributions (0.3)
Balance at 30 June 2020 5.8
Refer to note 36(d) for a summary of transactions with APS 1 during the financial year.
Summarised financial information for APS 1The tables below provide summarised financial information for APS 1. The information disclosed reflects the amounts presented in the unaudited financial statements of APS 1 and not the Aventus Group’s share of those amounts.
15 Nov 2019to
30 June 2020$m
Statement of comprehensive income
Revenue 2.3
Profit for the year 1.2
Other comprehensive income –
Total comprehensive income for the year 1.2
June 2020$m
Balance sheet
Current assets 0.9
Non-current assets 42.5
Total assets 43.4
Current liabilities (0.9)
Non-current liabilities (19.8)
Total liabilities (20.7)
Net assets 22.7
Annual Report 2020 Aventus Group 59
Financial Report

Notes to the Consolidated Financial Statementscontinued
19. Investment properties
PropertyLast independent
valuation date
Independentvaluation
$m
AventusGroup
June 2020$m
AventusGroup
June 2019$m
Ballarat Home 30 June 2019 42.5 42.9 42.5
Bankstown Home 31 Dec 2019 67.0 66.0 63.8
Belrose Super Centre 31 Dec 2018 183.0 183.0 183.0
Caringbah Home 30 June 2019 97.0 112.1 97.0
Hills Super Centre 30 June 2020 340.0 340.0 359.3
Cranbourne Home 31 Dec 2019 143.5 141.6 142.9
Epping Hub 31 Dec 2018 44.0 44.7 44.7
Highlands Hub 31 Dec 2019 33.5 33.6 33.5
Jindalee Home 30 June 2019 135.5 134.5 135.5
Kotara Home (South) 31 Dec 2019 126.5 122.8 124.1
Logan Super Centre 30 June 2020 92.0 92.0 95.2
MacGregor Home 31 Dec 2018 20.6 26.3 25.2
Marsden Park Home 30 June 2020 100.0 100.0 101.0
McGraths Hill Home 31 Oct 2019 42.5 – 42.5
Midland Home 31 Dec 2019 65.0 63.8 63.3
Mile End Home 30 June 2019 104.0 103.4 104.0
Peninsula Home 31 Dec 2018 85.5 89.8 89.2
Sunshine Coast Home 30 June 2020 101.0 101.0 100.0
Tuggerah Super Centre 30 June 2020 94.2 94.2 91.6
Warners Bay Home 31 Dec 2019 42.0 41.7 39.1
1,959.3 1,933.4 1,977.4
Less amounts classified as rental guarantees (3.1) (3.6)
Total 1,930.3 1,973.8
A reconciliation of the movement in the carrying value of investment properties during the financial year is outlined below:
AventusGroup
2020$m
AventusGroup
2019$m
Balance at the beginning of the financial year 1,973.8 1,886.9
Disposals – McGraths Hill Home (42.5) –
Capitalised expenditure 38.5 48.8
Straight-lining of rental income (2.2) (0.9)
Net (loss)/gain on movement in fair value of investment properties (37.3) 39.5
Amounts reclassified from rental guarantees – (0.5)
Balance at the end of the financial year 1,930.3 1,973.8
Information on how fair value of investment properties is determined is outlined in note 37.
60

Critical estimates and judgements and the impact of the COVID-19 pandemicCritical assumptions underlying the estimated fair value of investment properties are those relating to passing and market rents, capitalisation rates, terminal yields and discount rates. If there is any change in these assumptions or economic conditions the fair value of investment properties may differ.
The COVID-19 pandemic has created a higher degree of estimation uncertainty for investment property valuations. As a result, independent valuations at 30 June 2020 are reported on the basis of ‘significant valuation uncertainty’. This implies valuations are current at the valuation date only and less certainty and a higher degree of caution should be attached to the valuation. Estimated fair values may change significantly and unexpectedly over a relatively short period of time.
To reflect the impact of COVID-19 independent valuers have adjusted a number of valuation inputs and estimates, where appropriate, including lower probabilities of tenant retention, lower market rent growth rates, longer lease up periods, increased leasing allowances and adjustments to capitalisation and discount rates to reflect the uncertainty in the amount and timing of cash flows. Valuations also include deductions for the cost of estimated rental relief to be provided to tenants. Where appropriate director valuations have adopted the same adjustment process as used for independent valuations.
While these estimates have been formed after careful consideration and consultation COVID-19 is a unique and continually evolving event. The fair value assessment of investment properties incorporates a best estimate of the impact of COVID-19 using information available at the time of preparing the valuations and conditions existing at the reporting date. The duration and depth of the pandemic are unknown at reporting date. In the event the impacts of the COVID-19 pandemic are more severe or prolonged than anticipated this may have an adverse impact on the fair value of the portfolio.
Leasing arrangementsInvestment properties are leased to tenants under non-cancellable operating leases with rentals payable on a monthly basis. Future minimum rentals receivable under the leases as at 30 June 2020 and 30 June 2019 are as follows:
AventusGroup
June 2020$m
AventusGroup
June 2019$m
Within 1 year 111.0 106.9
Later than 1 year but not later than 5 years 282.9 291.4
Later than 5 years 65.8 80.6
Total 459.7 478.9
20. Intangible assets
AventusGroup
June 2020$m
AventusGroup
June 2019$m
AHL GroupJune 2020
$’000
AHL GroupJune 2019
$’000
Goodwill 140.4 140.4 42,923 42,923
Management rights 3.8 3.8 143,079 143,079
Total 144.2 144.2 186,002 186,002
Aventus GroupA reconciliation of the movement in intangibles during the prior financial year is outlined as follows:
Goodwill$m
Managementrights
$m
Balance at the beginning of the financial year – –
Acquisition of the APG Group 140.4 3.8
Balance at the end of the financial year 140.4 3.8
Annual Report 2020 Aventus Group 61
Financial Report

Notes to the Consolidated Financial Statementscontinued
20. Intangible assets continuedAventus Group continuedGoodwillGoodwill represents the incremental value created from the internalisation of management and by replacing external management fees with an internalised cost structure.
Management rightsManagement rights relate to the Kotara Home (North) property which is owned by a director related entity. The underlying property and development management agreement is between the director related entity and Aventus Property Management Pty Ltd and has an indefinite useful live.
Impairment testingGoodwill and management rights with an indefinite useful life are tested annually for impairment or when there are indicators of impairment. Goodwill and management rights are considered to be impaired if their recoverable amount is less than their carrying amount. Goodwill generated as a result of the recognition of deferred tax on management rights with an indefinite useful life is excluded from annual impairment testing.
No impairment expense was recognised for the year ended 30 June 2020.
The recoverable amount of goodwill and management rights was determined using the value in use approach and valued using discounted cash flow projections. Key assumptions adopted in the discounted cash flow valuation are as follows:
Assumption 2020 2019
Cash flows 5 years 5 years
Terminal growth rate 2.0% 2.0%
Discount rate applied to cash flow projections 7.5% 6.9%
Cash flow projections were based on financial budgets for the year ending 30 June 2021. Cash flows beyond the projected period are extrapolated using estimated growth rates.
Terminal growth rates are estimated based on the expected long-term earnings growth of the Aventus Group and macro-economic factors. Discount rates applied to cash flow projections are calculated by reference to the Aventus Group’s weighted average cost of capital. Discount rates are adjusted for risks specific to the cash generating unit.
The recoverable amount of goodwill would equal its carrying amount if the terminal growth rate decreased from 2.0% to 1.3% or the discount rate increased from 7.5% to 8.1%.
AHL GroupA reconciliation of the movement in intangibles during the prior financial period is outlined as follows:
Goodwill$’000
Managementrights$’000
Balance at the beginning of the financial period – –
Acquisition of the APG Group 42,923 143,079
Balance at the end of the financial period 42,923 143,079
Management rightsManagement rights relate to the following investment and property management agreements:
> Management Services Agreement between ARPF and Aventus Funds Management Pty Ltd;
> Property Management and Development Agreements between ARPF and Aventus Property Management Pty Ltd; and
> Property and Development Management Agreement between a director related entity and Aventus Property Management Pty Ltd.
The above agreements have indefinite useful lives.
GoodwillGoodwill relates solely to a corresponding deferred tax liability on management rights with an indefinite useful life which was recognised on the acquisition of the APG Group. Goodwill is excluded from annual impairment testing.
62

Impairment testing of management rightsManagement rights with an indefinite useful life are tested annually for impairment or when there are indicators of impairment. Management rights are considered to be impaired if their recoverable amount is less than their carrying amount.
No impairment expense was recognised for the year ended 30 June 2020.
The recoverable amount of management rights was determined based on the fair value less cost to sell approach and valued using discounted cash flow projections. Key assumptions adopted in the discounted cash flow valuation are as follows:
Assumption 2020 2019
Cash flows 5 years 5 years
Terminal growth rate 2.0% 2.0%
Discount rate applied to cash flow projections 8.7% 8.3%
Cash flow projections were based on management contracts. Cash flows beyond the projected period are extrapolated using estimated growth rates.
Terminal growth rates are estimated based on the expected long-term earnings growth of the AHL Group and macro-economic factors. Discount rates applied to cash flow projections are calculated by reference to the Group’s weighted average cost of capital. Discount rates are adjusted for risks specific to the cash generating unit.
The recoverable amount of management rights would equal its carrying amount if the terminal growth rate decreased from 2.0% to 1.8% or the discount rate increased from 8.7% to 8.8%.
As growth and discount rates are unobservable inputs in the valuation process they are considered ‘Level 3’ in the fair value hierarchy.
Critical estimates and judgementsThe recoverable amount of goodwill and management rights with an indefinite useful life are estimated based on projected future cash flows. Key assumptions underlying these calculations include growth rates and discount rates. The COVID-19 pandemic has created a higher degree of estimate uncertainty for forecasting future cash flows, estimating growth rates and calculating discount rates at 30 June 2020.
Significant differences between actual and projected cash flows or changes in discount rates may result in changes to the estimated recoverable amount.
21. Trade and other payables
AventusGroup
June 2020$m
AventusGroup
June 2019$m
AHL GroupJune 2020
$’000
AHL GroupJune 2019
$’000
Current
Trade creditors and accruals 17.3 19.6 831 2,178
Other payables 5.8 2.0 2,418 –
Total 23.1 21.6 3,249 2,178
Non-current
Other payables – 0.1 – 140
Trade payables are unsecured and are usually paid within 30 days of recognition.
22. Distributions payable
AventusGroup
June 2020$m
AventusGroup
June 2019$m
AHL GroupJune 2020
$’000
AHL GroupJune 2019
$’000
Current
Distributions payable 13.1 22.5 – –
Annual Report 2020 Aventus Group 63
Financial Report

Notes to the Consolidated Financial Statementscontinued
23. Lease liabilities
AventusGroup
June 2020$m
AventusGroup
June 2019$m
AHL GroupJune 2020
$’000
AHL GroupJune 2019
$’000
Current
Lease liabilities 1.0 – 834 –
Non-current
Lease liabilities 2.0 – 1,209 –
24. Derivative financial instruments
AventusGroup
June 2020$m
AventusGroup
June 2019$m
AHL GroupJune 2020
$’000
AHL GroupJune 2019
$’000
Current liabilities
Interest rate swaps – at fair value 1.8 0.3 – –
Non-current liabilities
Interest rate swaps – at fair value 15.0 15.2 – –
The Aventus Group utilises interest rate swaps to partially hedge against interest rate risk fluctuations. Interest rate swaps have the economic effect of converting borrowings from floating interest rates to fixed interest rates.
At 30 June 2020 the Aventus Group had entered into interest rate swap agreements totalling $460.0 million (30 June 2019: $520.0 million) representing 62.3% (30 June 2019: 67.1%) of drawn debt. Key features of the interest rate swaps are summarised as follows:
Maturity date
Notionalamount
June 2020$m
Notionalamount
June 2019$m
Fair valueJune 2020
$m
Fair valueJune 2019
$m
FY20 – 60.0 – (0.3)
FY21 125.0 125.0 (1.8) (2.3)
FY22 120.0 120.0 (3.3) (3.1)
FY23 125.0 125.0 (5.5) (5.2)
FY24 90.0 90.0 (6.2) (4.6)
Total 460.0 520.0 (16.8) (15.5)
As at 30 June 2020 the fixed rate on the interest rate swaps ranged from 1.89% to 2.43% per annum (30 June 2019: 1.83% to 2.43%).
Interest rate swap contracts require settlement of net interest receivable or payable on a monthly or quarterly basis.
25. Current tax liabilities
AventusGroup
June 2020$m
AventusGroup
June 2019$m
AHL GroupJune 2020
$’000
AHL GroupJune 2019
$’000
Current
Provision for income tax – 0.7 – 653
64
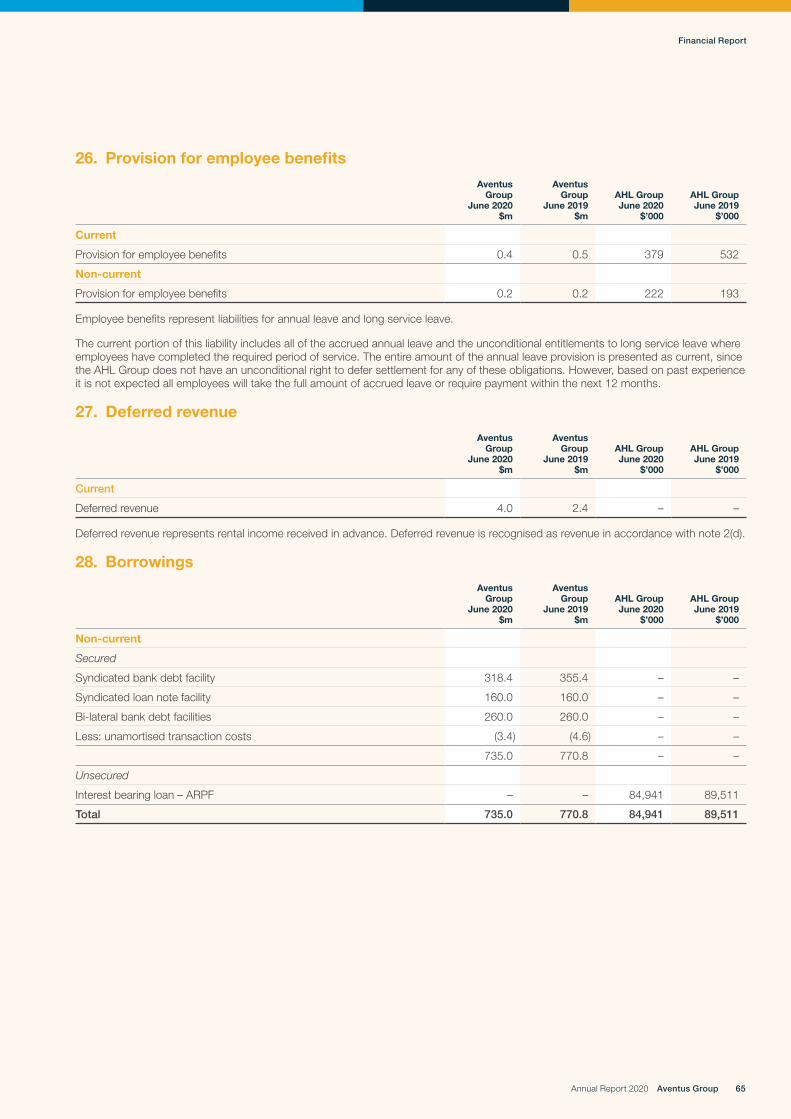
26. Provision for employee benefits
AventusGroup
June 2020$m
AventusGroup
June 2019$m
AHL GroupJune 2020
$’000
AHL GroupJune 2019
$’000
Current
Provision for employee benefits 0.4 0.5 379 532
Non-current
Provision for employee benefits 0.2 0.2 222 193
Employee benefits represent liabilities for annual leave and long service leave.
The current portion of this liability includes all of the accrued annual leave and the unconditional entitlements to long service leave where employees have completed the required period of service. The entire amount of the annual leave provision is presented as current, since the AHL Group does not have an unconditional right to defer settlement for any of these obligations. However, based on past experience it is not expected all employees will take the full amount of accrued leave or require payment within the next 12 months.
27. Deferred revenue
AventusGroup
June 2020$m
AventusGroup
June 2019$m
AHL GroupJune 2020
$’000
AHL GroupJune 2019
$’000
Current
Deferred revenue 4.0 2.4 – –
Deferred revenue represents rental income received in advance. Deferred revenue is recognised as revenue in accordance with note 2(d).
28. Borrowings
AventusGroup
June 2020$m
AventusGroup
June 2019$m
AHL GroupJune 2020
$’000
AHL GroupJune 2019
$’000
Non-current
Secured
Syndicated bank debt facility 318.4 355.4 – –
Syndicated loan note facility 160.0 160.0 – –
Bi-lateral bank debt facilities 260.0 260.0 – –
Less: unamortised transaction costs (3.4) (4.6) – –
735.0 770.8 – –
Unsecured
Interest bearing loan – ARPF – – 84,941 89,511
Total 735.0 770.8 84,941 89,511
Annual Report 2020 Aventus Group 65
Financial Report

Notes to the Consolidated Financial Statementscontinued
28. Borrowings continueda) Financing arrangementsThe Aventus Group had access to the following undrawn borrowing facilities at balance date:
Aventus Group June 2020
Aventus Group June 2019
Limit$m
Drawn$m
Undrawn$m
Limit$m
Drawn$m
Undrawn$m
Syndicated bank debt facility
– Tranche C 100.0 100.0 – 100.0 95.0 5.0
– Tranche E 50.0 50.0 – 50.0 50.0 –
– Tranche F 50.0 50.0 – 50.0 50.0 –
– Tranche G 75.0 60.4 14.6 75.0 35.4 39.6
– Tranche H 125.0 58.0 67.0 125.0 125.0 –
Syndicated loan note facility 160.0 160.0 – 160.0 160.0 –
Bi-lateral bank debt facilities 260.0 260.0 – 260.0 260.0 –
Total 820.0 738.4 81.6 820.0 775.4 44.6
Undrawn debt under the syndicated bank debt facility and bi-lateral bank debt facilities may be drawn at any time.
An additional tranche (tranche D) of up to $100 million may be added to the existing syndicated bank debt facility subject to the satisfaction of certain conditions. No commitment is provided by the banks for this additional tranche and there is no certainty that it will be available in future financial periods.
b) Debt maturity profile – secured debtDebt maturity profile
0
100
200
300
400
500
FY21
–
100.0 100.0
160.0
460.0$m
FY22 FY23 FY24 FY25
c) Syndicated bank debt facilityThe syndicated bank debt facility is a revolving cash advance facility.
Loan repayments are interest only with a lump sum payment of all amounts outstanding at the end of the term. Key features of each tranche are summarised as follows:
Tranche C Tranche E Tranche F Tranche G Tranche H
Tranche limit A$100 million A$50 million A$50 million A$75 million A$125 million
Maturity May 2022 July 2022 July 2022 July 2023 July 2023
Interest 30-day BBSY + margin
90-day BBSY + margin
90-day BBSY + margin
90-day BBSY + margin
30-day BBSY + margin
66

d) Syndicated loan note facilityKey terms of the syndicated loan note facility at 30 June 2020 are summarised as follows:
Facility limit A$160 million
Term 7 years (5-year initial term plus 2 x 1-year extensions at the option of the Aventus Group)
Maturity January 2025
Interest 90-day BBSY + margin
Repayments Before 3rd anniversary – non-call period Before 4th anniversary – 105% prepayment Before 5th anniversary – 101% prepayment
e) Bi-lateral bank debt facilitiesThe Aventus Group has an aggregate of $260.0 million in bi-lateral bank debt facilities. The facilities are revolving cash advance facilities with maturity dates of July and October 2023.
Loan repayments are interest only with a lump sum payment of all amounts outstanding at the end of the term. Interest is based on 90-day BBSY plus a margin.
f) Compliance with debt covenantsThe Aventus Group complied with the financial covenants of its borrowing facilities during the financial year. Key financial covenants are summarised as follows:
> Interest cover ratio is at least 2 times;
> Loan to value ratio is less than or equal to 55%; and
> Total liabilities to total tangible assets ratio is less than or equal to 55%.
Covenants are assessed semi-annually.
g) SecurityThe Aventus Group’s debt facilities are secured by:
> a first ranking real property mortgage in respect of each property in the portfolio;
> a first ranking general security deed over all the assets of the guarantors;
> a first ranking specific security deed over all the shares and units held by the guarantors; and
> a limited recourse share mortgage provided by ACL.
h) Intra-staple loanIntra-staple loanKey terms are summarised as follows:
Facility limit $89,511,000
Term 9 years 11 months
Maturity September 2028
Interest 90-day BBSW + margin
Repayment At the maturity date or such earlier date determined by the lender and borrower.
Annual Report 2020 Aventus Group 67
Financial Report

Notes to the Consolidated Financial Statementscontinued
29. Deferred taxesDeferred taxes comprise temporary differences attributable to:
AventusGroup
June 2020$m
AventusGroup
June 2019$m
AHL GroupJune 2020
$’000
AHL GroupJune 2019
$’000
Non-current
Deferred tax assets
Accrued expenses 0.6 0.6 552 557
Employee benefits 0.2 0.4 180 442
Lease liabilities 0.6 – 613 –
Other – 0.1 104 117
Total 1.4 1.1 1,449 1,116
Deferred tax liabilities
Right-of-use assets (0.6) – (601) –
Management rights (1.1) (1.1) (42,923) (42,923)
Total (1.7) (1.1) (43,524) (42,923)
Net deferred tax liabilities (0.3) – (42,075) (41,807)
30. Contributed equity
AventusGroup
June 2020$m
AventusGroup
June 2019$m
AHL GroupJune 2020
$’000
AHL GroupJune 2019
$’000
557,117,635 fully paid stapled securities (30 June 2019: 537,474,903)
ARPF 1,118.2 1,071.2 – –
AHL 6.9 4.7 61,283 59,062
Total 1,125.1 1,075.9 61,283 59,062
The stapled securities of the Aventus Group comprise one unit in ARPF and one share in AHL. Stapled securities cannot be traded or dealt with separately.
ARPF unitsAs stipulated in ARPF’s constitution, each unit represents a right to an individual share in ARPF and does not extend to a right to the underlying assets of ARPF.
Each unit ranks equally and has the same rights attached to it as with all other units on issue. Each unit confers the right to vote at meetings of unitholders, subject to any voting restrictions imposed on a unitholder under the Corporations Act and the ASX Listing Rules.
68

AHL sharesShares in AHL entitle the holder to participate in dividends and to share in the proceeds of winding up AHL in proportion to the number of and amounts paid on the shares held. On a show of hands every shareholder present at a meeting in person or by proxy, is entitled to one vote, and upon a poll each share is entitled to one vote. Shares have no par value and AHL does not have a limited amount of authorised capital.
A reconciliation of the movement in contributed equity of the Aventus Group during the financial year is as follows:
Numberof stapledsecurities
ARPF$m
AHL$m
AventusGroup
$m
Balance at 1 July 2018 494,174,250 975.1 – 975.1
Securities issued as consideration for business combinations 35,735,034 80.9 4.2 85.1
Securities issued in accordance with the distribution reinvestment plan 7,278,038 14.5 0.7 15.2
One off grant of restricted stapled securities in connection with the internalisation of management 287,581 0.7 – 0.7
Security issue costs – – (0.2) (0.2)
Balance at 30 June 2019 537,474,903 1,071.2 4.7 1,075.9
Balance at 1 July 2019 537,474,903 1,071.2 4.7 1,075.9
Securities issued in accordance with underwriting of distribution reinvestment plan 15,711,530 37.4 1.8 39.2
Securities issued in accordance with the distribution reinvestment plan 3,759,538 9.4 0.4 9.8
Securities issued in accordance with the executive incentive plan 171,664 0.4 – 0.4
Security issue costs – (0.2) – (0.2)
Balance at 30 June 2020 557,117,635 1,118.2 6.9 1,125.1
A reconciliation of the movement in contributed equity of the AHL Group during the financial year is as follows:
AHL Group2020
Securities
AHL Group2019
Securities
AHL Group2020
$’000
AHL Group2019$’000
Balance at the beginning of the year 537,474,903 – 59,062 –
Shares issued on incorporation – 5 – –
Securities issued on initial capitalisation – 494,471,467 – 54,388
Securities issued as consideration for business combinations – 35,735,034 – 4,179
Securities issued in accordance with underwriting of distribution reinvestment plan 15,711,530 – 1,769 –
Securities issued in accordance with the distribution reinvestment plan 3,759,538 6,980,816 442 718
Securities issued in accordance with the executive incentive plan 171,664 – 20 –
One off grant of restricted stapled securities in connection with the internalisation of management – 287,581 – 34
Security issue costs – – (10) (257)
Balance at the end of the year 557,117,635 537,474,903 61,283 59,062
Annual Report 2020 Aventus Group 69
Financial Report

Notes to the Consolidated Financial Statementscontinued
31. Reserves
AventusGroup
June 2020$m
AventusGroup
June 2019$m
AHL GroupJune 2020
$’000
AHL GroupJune 2019
$’000
ARPF
Security based payments reserve 1.3 0.1 – –
Restricted stapled securities reserve (0.4) – – –
Total 0.9 0.1 – –
AHL
Security based payments reserve 0.1 – 62 8
Restricted stapled securities reserve – – (20) –
Total 0.1 – 42 8
Total 1.0 0.1 42 8
Nature and purpose of reservesSecurity based payments reserveThe security-based payments reserve is used to recognise the fair value of equity settled security-based payments provided to executives, including key management personnel, and employees as part of their remuneration.
Restricted stapled securities reserveThe restricted stapled securities reserve is used to recognise the cost of restricted stapled securities issued and held in trust on behalf of participants of the Executive Incentive Scheme and Employee Security Scheme for the duration of the vesting period by the Aventus Group Employee Security Trust. At the vesting date amounts recorded in the restricted stapled securities reserve are transferred to the security-based payments reserve.
A reconciliation of the movement in the security-based payments reserves during the financial year is as follows:
AventusGroup
2020$m
AventusGroup
2019$m
AHL Group2020
$’000
AHL Group2019$’000
ARPF
Balance at the beginning of the year 0.1 – – –
Security based payments 1.2 0.1 – –
Balance at the end of the year 1.3 0.1 – –
AHL
Balance at the beginning of the year – – 8 –
Security based payments 0.1 – 54 8
Balance at the end of the year 0.1 – 62 8
A reconciliation of the movement in the restricted stapled securities reserve during the financial year is as follows:
AventusGroup
2020$m
AventusGroup
2019$m
AHL Group2020
$’000
AHL Group2019$’000
ARPF
Balance at the beginning of the year – – – –
Issue of restricted stapled securities (0.4) – – –
Balance at the end of the year (0.4) – – –
AHL
Balance at the beginning of the year – – – –
Issue of restricted stapled securities – – (20) –
Balance at the end of the year – – (20) –
70

32. Retained earnings/(accumulated losses)
AventusGroup
June 2020$m
AventusGroup
June 2019$m
AHL GroupJune 2020
$’000
AHL GroupJune 2019
$’000
ARPF 234.4 232.8 – –
AHL (20.0) (9.3) 305 (462)
Total 214.4 223.5 305 (462)
A reconciliation of the movement in retained earnings of the Aventus Group during the financial year is as follows:
ARPF$m
AHL$m
AventusGroup
$m
Balance at 1 July 2018 200.1 – 200.1
Net profit for the year 119.7 (9.3) 110.4
Distributions/dividends paid or payable (87.0) – (87.0)
Balance at 30 June 2019 232.8 (9.3) 223.5
Balance at 1 July 2019 232.8 (9.3) 223.5
Net profit for the year 67.4 (10.7) 56.7
Distributions/dividends paid or payable (65.8) – (65.8)
Balance at 30 June 2020 234.4 (20.0) 214.4
A reconciliation of the movement in retained earnings of the AHL Group during the financial year is as follows:
AHL Group2020
$’000
AHL Group2019$’000
Balance at the beginning of the year/period (462) –
Net profit/(loss) for the year 767 (462)
Dividends paid or payable – –
Balance at the end of the year/period 305 (462)
33. Distributions
AventusGroup
2020Distribution
cents
AventusGroup
2020Distribution
$m
AventusGroup
2019Distribution
cents
AventusGroup
2019Distribution
$m
Fully paid ordinary securities
September quarter 4.22 23.1 4.09 20.2
December quarter 4.26 23.7 4.14 22.0
March quarter 1.07 5.9 4.16 22.3
June quarter 2.35 13.1 4.18 22.5
Total 11.90 65.8 16.57 87.0
Distribution reinvestment plan (“DRP”)During the financial year the Aventus Group operated a distribution reinvestment plan (“DRP”) under which securityholders may elect to reinvest all or part of their distributions or dividends in new stapled securities rather than being paid in cash. The last date for the receipt of an election notice for participation in the DRP is the next business day after the record date for the respective distribution or dividend. The DRP price is determined as the average of the daily volume weighted average price of the stapled securities sold on the Australian Securities Exchange during a ten-day trading period prior to the payment date for the distribution or dividend, less a discount (if any).
The DRP unit price for the quarters ended 30 September 2019 and 31 December 2019 included a discount of 2%.
The DRP was suspended for the quarter ended 31 March 2020 but reinstated for the quarter ended 30 June 2020 with no discount.
DRP underwriting agreementDuring the financial year the Aventus Group entered into an agreement with Macquarie Capital (Australia) Limited to act as sole underwriter of an offer of stapled securities under its DRP for the quarters ended 30 June 2019 and 30 September 2019.
Annual Report 2020 Aventus Group 71
Financial Report

Notes to the Consolidated Financial Statementscontinued
34. Statement of cash flow informationa) Reconciliation of profit to net cash flows from operating activities
AventusGroup
2020$m
AventusGroup
2019$m
AHL Group2020
$’000
AHL Group2019$’000
Profit/(loss) for the year 56.7 110.4 767 (462)
Adjustments for
Finance costs capitalised (0.6) (0.3) – –
Straight-lining of rental income 2.2 0.9 – –
Amortisation of rental guarantees 0.4 2.3 – –
Amortisation of debt establishment costs 1.6 2.7 – –
Net loss/(gain) on movement in fair value of investment properties 37.3 (39.5) – –
Net loss on movement in fair value of interest rate swaps 1.3 14.0 – –
Depreciation 1.1 – 920 49
Expenses not paid in cash 1.2 0.6 1,215 692
Other 0.4 – 8 (33)
Change in operating assets and liabilities, net of effects from purchase of controlled entities:
(Increase)/decrease in trade and other receivables (4.2) 0.4 (1,226) (746)
(Increase)/decrease in other assets (1.7) 0.1 23 (111)
Increase/(decrease) in trade and other payables 2.9 0.2 (224) 804
Increase/(decrease) in current tax (0.9) 0.2 (855) 168
Increase/(decrease) in deferred tax 0.3 (0.4) 268 (395)
Increase/(decrease) in provision for employee benefits (0.1) (0.1) (123) (131)
Increase/(decrease) in provision for performance fees – (9.1) – –
Increase/(decrease) in deferred revenue 1.6 (1.7) – –
Net cash inflow/(outflow) from operating activities 99.5 80.7 773 (165)
b) Non-cash investing and financing activities
AventusGroup
2020$m
AventusGroup
2019$m
AHL Group2020
$’000
AHL Group2019$’000
Securities issued on initial capitalisation of AHL – – – 54,388
Securities issued as consideration for business combinations – 85.1 – 4,179
Securities issued in accordance with the distribution reinvestment plan 9.8 15.2 2,211 718
Securities issued in accordance with executive incentive scheme 0.4 – 20 –
One off grant of restricted stapled securities in connection with the internalisation of management – 0.7 – 34
Proceeds from borrowings – – – 89,511
Repayment of borrowings – – (4,570) –
35. Security based paymentsExecutive incentive scheme (EIS)EIS participants, subject to achieving certain Key Performance Indicators (KPIs), are entitled to receive variable remuneration consisting of annual cash awards and grants of stapled securities vesting over 2, 3 and 4 years.
KPIs must be satisfied over the relevant performance period. To the extent the KPIs are satisfied, EIS awards will be delivered 50% in cash and 50% in restricted stapled securities.
The cash award will be paid following the end of the performance period. In response to the impact of COVID-19 the cash component for the year ended 30 June 2020 was replaced by restricted stapled securities vesting in February 2021.
72

The restricted stapled securities will be granted following the end of the performance period, and will vest in three tranches following release of full-year results for the first, second and third financial years immediately following the performance period:
> 33.33% of the restricted stapled securities will vest approximately two years after the start of the performance period;
> 33.33% of the restricted stapled securities will vest approximately three years after the start of the performance period; and
> 33.34% of the restricted stapled securities will vest approximately four years after the start of the performance period;
providing the participant remains an employee until the relevant vesting date and the board has not determined that a “clawback” of any restricted stapled securities is required.
The diagram below provides an illustration of how the EIS operates for a single performance period of one year, assuming all KPIs are achieved. The Aventus Group intends to offer EIS awards annually. As the EIS progresses, the vesting of restricted equity awards will become cumulative.
Year 0 +1 year +2 years +3 years +4 years
50% of EIS award
paid in cash
First thirdof deferredequity vests
Second thirdof deferredequity vests
Final third of deferredequity vests
EIS is delivered as follows:– 50% in cash– 50% in deferred equity
Delivery of EIS outcome
EIS performance period(1 year)
(33%) – Deferred for one year
(33%) – Deferred equity for two years
(33%) – Deferred equity for three years
Deferred equity component (50% of total EIS)
The number of restricted stapled securities to be allocated to each participant is determined by dividing the dollar value of the equity component of the EIS by the volume weighted average price of stapled securities, measured over the ten trading days following release of full-year results for the performance period’s financial year.
Employee security scheme (ESS)For the year ended 30 June 2020 the People, Culture and Remuneration Committee has implemented a one-off ESS whereby participants will be entitled to receive restricted stapled securities based on either a percentage of the reduction in remuneration taken or for contributions made to the business in response to the COVID-19 pandemic. The ESS excludes KMP. The restricted stapled securities will vest in February 2021 subject to forfeiture of unvested amounts on resignation or termination prior to vesting.
In the prior financial year, a one-off grant of restricted stapled securities was issued to selected employees in October 2018 in connection with the internalisation of management. The restricted stapled securities will vest in two equal tranches over a two-year period from 1 October 2018 subject to forfeiture of unvested amounts on resignation or termination for cause during that period.
Grants of restricted stapled securities are accounted for in accordance with AASB 2 Share Based Payments. The fair value of the restricted stapled securities are recognised as employee benefits expenses over the relevant vesting period with a corresponding increase in equity via a security-based payments reserve. When restricted stapled securities are issued they are held in trust, on behalf of EIS or ESS participants, for the duration of the vesting period by the Aventus Group Employee Security Trust. The cost of issued restricted stapled securities is initially recognised in a reserve and subsequently transferred to the security-based payments reserve on vesting date.
A reconciliation of the number of restricted stapled securities granted and vested during the financial year is as follows:
Number of restricted stapled securities 2020 2019
Opening balance 287,581 –
Issued 171,664 287,581
Vested (143,791) –
Closing balance 315,454 287,581
Annual Report 2020 Aventus Group 73
Financial Report
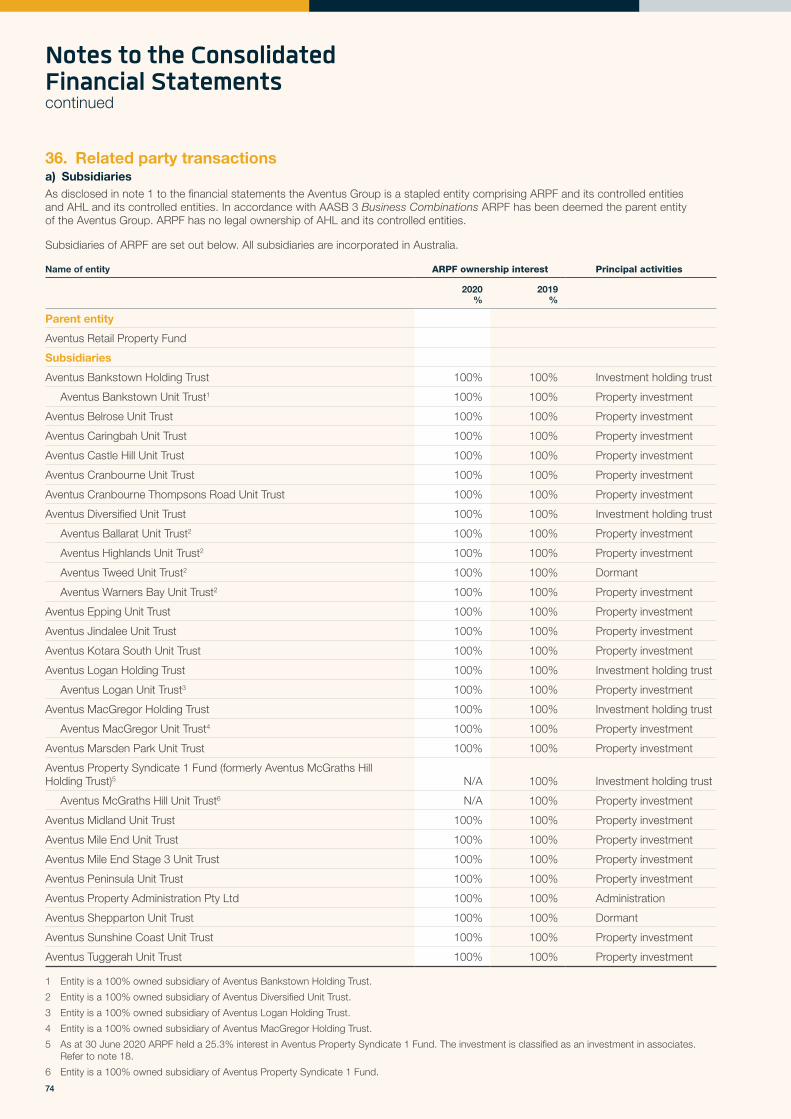
Notes to the Consolidated Financial Statementscontinued
36. Related party transactionsa) SubsidiariesAs disclosed in note 1 to the financial statements the Aventus Group is a stapled entity comprising ARPF and its controlled entities and AHL and its controlled entities. In accordance with AASB 3 Business Combinations ARPF has been deemed the parent entity of the Aventus Group. ARPF has no legal ownership of AHL and its controlled entities.
Subsidiaries of ARPF are set out below. All subsidiaries are incorporated in Australia.
Name of entity ARPF ownership interest Principal activities
2020%
2019%
Parent entity
Aventus Retail Property Fund
Subsidiaries
Aventus Bankstown Holding Trust 100% 100% Investment holding trust
Aventus Bankstown Unit Trust1 100% 100% Property investment
Aventus Belrose Unit Trust 100% 100% Property investment
Aventus Caringbah Unit Trust 100% 100% Property investment
Aventus Castle Hill Unit Trust 100% 100% Property investment
Aventus Cranbourne Unit Trust 100% 100% Property investment
Aventus Cranbourne Thompsons Road Unit Trust 100% 100% Property investment
Aventus Diversified Unit Trust 100% 100% Investment holding trust
Aventus Ballarat Unit Trust2 100% 100% Property investment
Aventus Highlands Unit Trust2 100% 100% Property investment
Aventus Tweed Unit Trust2 100% 100% Dormant
Aventus Warners Bay Unit Trust2 100% 100% Property investment
Aventus Epping Unit Trust 100% 100% Property investment
Aventus Jindalee Unit Trust 100% 100% Property investment
Aventus Kotara South Unit Trust 100% 100% Property investment
Aventus Logan Holding Trust 100% 100% Investment holding trust
Aventus Logan Unit Trust3 100% 100% Property investment
Aventus MacGregor Holding Trust 100% 100% Investment holding trust
Aventus MacGregor Unit Trust4 100% 100% Property investment
Aventus Marsden Park Unit Trust 100% 100% Property investment
Aventus Property Syndicate 1 Fund (formerly Aventus McGraths Hill Holding Trust)5 N/A 100% Investment holding trust
Aventus McGraths Hill Unit Trust6 N/A 100% Property investment
Aventus Midland Unit Trust 100% 100% Property investment
Aventus Mile End Unit Trust 100% 100% Property investment
Aventus Mile End Stage 3 Unit Trust 100% 100% Property investment
Aventus Peninsula Unit Trust 100% 100% Property investment
Aventus Property Administration Pty Ltd 100% 100% Administration
Aventus Shepparton Unit Trust 100% 100% Dormant
Aventus Sunshine Coast Unit Trust 100% 100% Property investment
Aventus Tuggerah Unit Trust 100% 100% Property investment
1 Entity is a 100% owned subsidiary of Aventus Bankstown Holding Trust.
2 Entity is a 100% owned subsidiary of Aventus Diversified Unit Trust.
3 Entity is a 100% owned subsidiary of Aventus Logan Holding Trust.
4 Entity is a 100% owned subsidiary of Aventus MacGregor Holding Trust.
5 As at 30 June 2020 ARPF held a 25.3% interest in Aventus Property Syndicate 1 Fund. The investment is classified as an investment in associates. Refer to note 18.
6 Entity is a 100% owned subsidiary of Aventus Property Syndicate 1 Fund.
74

Name of entity AHL ownership interest Principal activities
2020%
2019%
Parent entity
Aventus Holdings Limited
Subsidiaries
Aventus Property Group Pty Ltd1 100% 100% Investment holding company
Aventus Capital Limited2 100% 100% Responsible entity for ARPF
Aventus Custodian Pty Ltd3 100% 100% Trustee company
Aventus Kotara South Pty Ltd3 100% 100% Trustee company
Aventus Cranbourne Thompsons Road Pty Ltd3 100% 100% Trustee company
Aventus Cranbourne Pty Ltd3 100% 100% Trustee company
Aventus Epping Pty Ltd3 100% 100% Trustee company
Aventus Peninsula Pty Ltd3 100% 100% Trustee company
Aventus Caringbah Pty Ltd3 100% 100% Trustee company
Aventus Jindalee Pty Ltd3 100% 100% Trustee company
Aventus Mile End Pty Ltd3 100% 100% Trustee company
Aventus Mile End Stage 3 Pty Ltd3 100% 100% Trustee company
Aventus Midland Pty Ltd3 100% 100% Trustee company
Aventus Belrose Pty Ltd3 100% 100% Trustee company
Aventus Sunshine Coast Pty Ltd3 100% 100% Trustee company
Aventus Tuggerah Pty Ltd3 100% 100% Trustee company
Aventus Diversified Pty Ltd3 100% 100% Trustee company
Aventus Properties Pty Ltd3 100% 100% Trustee company
Aventus Landowner Pty Ltd3 100% 100% Trustee company
Aventus Funds Management Pty Ltd2 100% 100% Funds management
Aventus Property Management Pty Ltd2 100% 100% Property management
Aventus Services Pty Ltd2 100% 100% Administration
Aventus Investment Management Holdings Pty Ltd1 100% N/A Investment holding company
Aventus Investment Management Pty Ltd4 100% N/A Trustee company
1 Company is a 100% owned subsidiary of Aventus Holdings Limited.
2 Company is a 100% owned subsidiary of Aventus Property Group Pty Ltd.
3 Company is a 100% owned subsidiary of Aventus Capital Limited.
4 Company is a 100% owned subsidiary of Aventus Investment Management Holdings Pty Ltd.
b) Responsible entityThe responsible entity of ARPF is Aventus Capital Limited (“ACL”).
ACL is not entitled to a fee for services provided in its capacity as responsible entity.
Annual Report 2020 Aventus Group 75
Financial Report

Notes to the Consolidated Financial Statementscontinued
36. Related party transactions continuedc) Key management personnel
AventusGroup
2020$’000
AventusGroup
2019$’000
AHL Group2020
$
AHL Group2019
$
Short term employee benefits 1,481 1,460 1,481,142 1,459,827
Security based payments expense 441 110 441,065 110,219
Post-employment benefits 74 63 73,613 62,551
Total 1,996 1,633 1,995,820 1,632,597
Detailed remuneration disclosures for key management personnel are outlined in the remuneration report.
d) Transactions with other related partiesThe following transactions occurred with related parties during the financial year:
AventusGroup
2020$’000
AventusGroup
2019$’000
AHLGroup
2020$
AHLGroup
2019$
Transactions with:
APG Group
Management fee expenses1 – 2,548 – –
Property management, leasing and development fee expenses1 – 5,459 – –
Reimbursement of independent director fees1 – 97 – –
Rental revenue1 – 281 – –
APS 1
Establishment fee revenue 638 – 637,500 –
Management fee revenue 205 – 204,652 –
Property management and leasing fee revenue 142 – 142,150 –
Other related parties
Property management and leasing fee revenue 849 574 849,302 574,227
Rental revenue 106 77 105,951 77,069
ARPF
Management fee revenue N/A N/A 936,268 599,793
Property management, leasing and development fee revenue N/A N/A 15,289,009 12,634,325
Other revenue N/A N/A 149,499 389,093
Finance costs N/A N/A (3,426,375) (3,335,160)
1 Prior year amounts are for the period 1 July 2018 to 30 September 2018 representing the period ARPF was externally managed by the APG Group.
Transactions with related parties are in accordance with relevant management or other agreements and are on normal commercial terms and conditions.
76

e) Outstanding balances with related parties
AventusGroup
June 2020$’000
AventusGroup
June 2019$’000
AHLGroup
June 2020$
AHLGroup
June 2019$
Receivables due from:
APS 1 42 – 41,628 –
Other related parties 57 80 56,918 80,393
ARPF N/A N/A 1,675,456 1,735,760
Payables to:
ARPF N/A N/A 1,958,143 –
Borrowings
ARPF N/A N/A 84,940,615 89,511,017
Related party receivables are unsecured and are usually collected within 30 days of recognition. There is no allowance account for impaired receivables in relation to any outstanding balances, and no expense has been recognised in respect of impaired receivables due from related parties.
f) Key related party contractsKotara Home call option and pre-emptive deedThe Aventus Group’s Kotara Home (South) property (“Kotara South”) is adjacent to another property (“Kotara North”) which is owned by an entity associated with Brett Blundy. The respective owners have entered into the Kotara Call Option and Pre-emptive Deed under which:
> The owner of Kotara South grants to the owner of Kotara North a call option to acquire Kotara South (“Call Option”); and
> The owner of Kotara North and the owner of Kotara South have each granted the other reciprocal pre-emptive rights in the event that either of them wishes to sell their respective Kotara properties (“Pre-emptive Right”).
Further information relating to the Call Option and the Pre-emptive Right is outlined below.
Call optionWhere as a result of a vote of the unitholders in ARPF, there is a change of the responsible entity of ARPF to an entity who is not a member of the APG Group (“Call Option Event”) the following process will apply:
> The owner of Kotara North may require a valuation to be conducted on Kotara South, with two independent valuers to be appointed – one by the owner of Kotara North Owner and one by the new responsible entity;
> the purchase price for Kotara South will be the average of the two valuations; and
> upon receipt of those valuations, the owner of Kotara North may exercise the call option and purchase Kotara South for the relevant purchase price so determined.
Pre-emptive rightUnder the pre-emptive right, where an owner wishes to deal with their Kotara property, it must give notice to the other owner of the proposed sale terms which will constitute an offer to the relevant recipient to acquire the selling owner’s Kotara property. The owner will have 40 days to accept those sale terms. If the offer is not accepted, then the owner selling its Kotara asset may sell to another third party within six months on terms and at a price that are no more favourable to the proposed purchaser than the terms offered under the pre-emptive right.
Annual Report 2020 Aventus Group 77
Financial Report

Notes to the Consolidated Financial Statementscontinued
37. Fair value measurementAventus GroupThis note provides information about how the Aventus Group determines fair value of assets and liabilities.
Assets and liabilities measured at fair value on a recurring basisInvestment properties and derivative financial instruments are measured at fair value on a recurring basis.
To provide an indication about the reliability of inputs used in determining fair value, assets and liabilities are classified into three levels prescribed under accounting standards. An explanation of each level is outlined below:
Level 1 – Quoted prices (unadjusted) in active markets for identical assets or liabilities.
Level 2 – Inputs other than quoted prices included within Level 1 that are observable for the asset or liability, either directly or indirectly.
Level 3 – Inputs for the asset or liability are not based on observable market data (unobservable inputs).
The following table summarises assets and liabilities measured and recognised at fair value on a recurring basis:
Level 2 Level 3 Total
NoteJune 2020
$mJune 2019
$mJune 2020
$mJune 2019
$mJune 2020
$mJune 2019
$m
Non-financial assets
Investment properties 19 – – 1,930.3 1,973.8 1,930.3 1,973.8
Financial liabilities
Derivative financial instruments 24 16.8 15.5 – – 16.8 15.5
There were no transfers between levels of fair value measurement during the financial year.
No financial assets or liabilities were measured at fair value on a non-recurring basis as at 30 June 2020 or 30 June 2019.
Valuation techniques used to derive level 2 fair valuesThe only level 2 assets or liabilities measured at fair value are interest rate swaps. The fair value of interest rate swaps is estimated using the discounted cash flow technique. Future cash flows are estimated based on forward interest rates (from observable yield curves at the end of the reporting period) and contract forward rates, discounted at a rate that reflects the credit risk of various counterparties.
Critical estimates and judgementsThe fair value of derivative assets and liabilities are based on assumptions of future events and involves significant estimates. The fair value of the derivatives at the reporting date may differ if there is volatility in market rates.
Valuation techniques used to derive level 3 fair valuesThe only level 3 assets or liabilities measured at fair value are investment properties. Independent valuations are obtained for investment properties at least every two years. At the end of each reporting period, the directors update their assessment of the fair value of each property, taking into account the most recent independent valuations. The directors determine a property’s value within a range of reasonable fair value estimates.
The fair value of investment properties is determined using recognised valuation techniques including the capitalisation of net income method and discounted cash flow method. Key inputs used in determining property values as at 30 June 2020 and 30 June 2019 are outlined below. Terminal yields and discount rates relate solely to independent valuations at balance date.
Range30 June 2020
Weighted average30 June 2020
Range30 June 2019
Weighted average30 June 2019
Net passing rent ($ per square metre) $153 to $396 $283 $143 to $388 $278
Net market rent ($ per square metre) $155 to $398 $287 $159 to $388 $280
Adopted capitalisation rate (%) 5.8% to 7.5% 6.7% 5.5% to 7.5% 6.7%
Adopted terminal yield (%) 6.0% to 7.3% 6.5% 7.3% to 7.8% 7.5%
Adopted discount rate (%) 6.8% to 8.0% 7.2% 7.8% to 8.8% 8.1%
In determining the valuation of all investment properties measured at recurring fair value, consideration has been given to the highest and best use of those properties.
78

Critical estimates and judgements and the impact of the COVID-19 pandemicCritical assumptions underlying the estimated fair value of investment properties are those relating to passing and market rents, capitalisation rates, terminal yields and discount rates. If there is any change in these assumptions or economic conditions the fair value of investment properties may differ.
The COVID-19 pandemic has created a higher degree of estimation uncertainty for investment property valuations. As a result, independent valuations at 30 June 2020 are reported on the basis of ‘significant valuation uncertainty’. This implies valuations are current at the valuation date only and less certainty and a higher degree of caution should be attached to the valuation. Estimated fair values may change significantly and unexpectedly over a relatively short period of time.
To reflect the impact of COVID-19 independent valuers have adjusted a number of valuation inputs and estimates, where appropriate, including lower probabilities of tenant retention, lower market rent growth rates, longer lease up periods, increased leasing allowances and adjustments to capitalisation and discount rates to reflect the uncertainty in the amount and timing of cash flows. Valuations also include deductions for the cost of estimated rental relief to be provided to tenants. Where appropriate director valuations have adopted the same adjustment process as used for independent valuations.
While these estimates have been formed after careful consideration and consultation COVID-19 is a unique and continually evolving event. The fair value assessment of investment properties incorporates a best estimate of the impact of COVID-19 using information available at the time of preparing the valuations and conditions existing at the reporting date. The duration and depth of the pandemic are unknown at reporting date. In the event the impacts of the COVID-19 pandemic are more severe or prolonged than anticipated this may have an adverse impact on the fair value of the portfolio.
Sensitivity analysis
Valuation input Relationship of valuation input to fair value
Net passing rent The higher net passing rent, the higher the fair value.
Net market rent The higher net market rent, the higher the fair value.
Adopted capitalisation rate The higher the capitalisation rate, the lower the fair value.
Adopted terminal yield The higher the termination yield, the lower the fair value.
Adopted discount rate The higher the discount rate, the lower the fair value.
The sensitivity analysis below shows the impact a 0.25% and 0.50% increase in the weighted average capitalisation rate of the portfolio would have on the fair value of the portfolio. The analysis assesses the movement in capitalisation rates in isolation and assumes all other inputs are held constant.
Capitalisationrate
+0.25%
Capitalisationrate
+0.50%
Decrease in fair value ($m) (69.2) (133.7)
Decrease in fair value (%) (3.6) (6.9)
AHL GroupThe AHL Group does not have any assets and liabilities which are measured at fair value.
Assets and liabilities not measured at fair valueThe Aventus Group and AHL Group have a number of financial assets and liabilities which are not measured at fair value. The fair values of these assets and liabilities are not materially different to their carrying amounts disclosed in the consolidated balance sheet.
38. Capital managementThe Aventus Group and AHL Group have a capital management framework which is approved and monitored by the board of directors. The framework aims to safeguard the Aventus Group’s and AHL Group’s ability to continue as a going concern, so it can continue to provide returns for securityholders and maintain an optimal capital structure to reduce the cost of capital.
The Aventus Group’s and AHL Group’s capital structure consists of cash, borrowings and equity. In determining the optimal capital structure, the directors take into account a number of factors including the capital needs of its business, the relative cost of debt versus equity, the execution and market risk of raising equity or debt, the financial risks of debt including increased volatility of earnings due to exposure to interest rate movements, the liquidity risk of maturing debt facilities and the market in general.
The capital mix maybe adjusted by issuing new stapled securities, adjusting the amount of distributions and dividends paid to securityholders, increase borrowings or sell assets to reduce debt.
The Aventus Group’s capital position is monitored via its gearing ratio. Gearing at 30 June 2020 was 36.0% (30 June 2019: 38.7%). The Aventus Group’s strategy is to maintain a gearing ratio of between 30% and 40%.
Annual Report 2020 Aventus Group 79
Financial Report

Notes to the Consolidated Financial Statementscontinued
39. Financial risk managementAventus GroupThe Aventus Group’s activities expose it to financial risks including interest rate risk, liquidity risk and credit risk.
a) Interest rate riskInterest rate risk is the risk that the fair value of cash flows of a financial instrument will fluctuate due to changes in market interest rates. The main interest rate risk arises from borrowings with variable interest rates. The Aventus Group manages interest rate risk by using floating to fixed interest rate swaps which have the effect of converting a portion of borrowings from variable to fixed interest rates. The policy for maintaining minimum levels of borrowings at fixed rates using interest rate swaps varies depending upon the maturity profile of the debt.
Exposure to interest rate risk from borrowings is summarised in the table below:
AventusGroup
June 2020$m
AventusGroup
June 2019$m
Floating rate borrowings
Syndicated bank debt facility 318.4 355.4
Syndicated loan note facility 160.0 160.0
Bilateral bank debt facilities 260.0 260.0
Derivative financial instruments
Interest rate swaps (notional principal amount) (460.0) (520.0)
Net interest rate exposure 278.4 255.4
Further details of borrowings and interest rate swaps held at 30 June 2020 and 30 June 2019 are disclosed in notes 28 and 24 respectively.
Interest rate risk sensitivityThe impact of a 0.5% increase/decrease in market interest rates at balance date would result in a $1.4 million (2019: $1.3 million) decrease/increase in profit or loss per annum.
b) Liquidity riskLiquidity risk is the risk that the Aventus Group will not be able to meet its financial obligations as they fall due. Management manages liquidity by ensuring there is sufficient cash and/or committed undrawn borrowings available. Management prepares and monitors rolling forecasts of liquidity reserves, comprising cash and undrawn borrowing facilities, on the basis of expected future cash flows. Financing arrangements, debt maturity profiles and access to undrawn borrowing facilities at 30 June 2020 and 30 June 2019 are disclosed in note 28.
Maturities of financial liabilitiesThe tables below analyse financial liabilities into relevant maturity groupings based on their contractual maturities for:
a) all non-derivative financial liabilities, and
b) derivative financial instruments for which the contractual maturities are essential for an understanding of the timing of the cash flows.
The amounts disclosed in the table are the contractual undiscounted cash flows. For interest rate swaps the cash flows have been estimated using forward interest rates applicable at the end of the reporting period.
80

30 June 2020
Contractual maturities of financial liabilities
Less than6 months
$m6–12 months
$m1 to 3 years
$m3–5 years
$m
Greater than5 years
$m
Totalcontractedcash flows
$m
Carryingamount of
liabilities$m
Non-derivative
Payables 23.1 – – – – 23.1 23.1
Distributions payable 13.1 – – – – 13.1 13.1
Lease liabilities 0.6 0.6 1.7 0.4 – 3.3 3.0
Borrowings 5.8 5.7 220.2 544.1 – 775.8 735.0
Total 42.6 6.3 221.9 544.5 – 815.3 774.2
Derivative
Interest rate swaps 4.6 4.2 7.3 0.4 – 16.5 16.8
30 June 2019
Contractual maturities of financial liabilities
Less than6 months
$m6–12 months
$m1 to 3 years
$m3–5 years
$m
Greater than5 years
$m
Totalcontractedcash flows
$m
Carryingamount of
liabilities$m
Non-derivative
Payables 21.6 – – – – 21.6 21.6
Distributions payable 22.5 – – – – 22.5 22.5
Borrowings 10.8 10.7 142.7 583.7 163.0 910.9 770.8
Total 54.9 10.7 142.7 583.7 163.0 955.0 814.9
Derivative
Interest rate swaps 2.1 1.9 5.7 0.8 – 10.5 15.5
c) Credit riskRisk management and securityCredit risk is the risk that a customer or counterparty to a financial instrument will default on their contractual obligations resulting in a financial loss to the Aventus Group. The Aventus Group’s credit risk arises from cash and cash equivalents and receivables. The carrying amount of these financial assets disclosed in the consolidated balance sheet represents the maximum credit exposure at 30 June 2020 and 30 June 2019.
To manage credit risk in relation to cash and cash equivalents, deposits are held with financial institutions with AA- Standards and Poor’s credit ratings. To manage credit risk in relation to receivables, tenants are billed monthly in advance. For some tenants collateral may also be obtained in the form of security deposits, bank guarantees or rental guarantees. Management also monitors tenancy exposure across its portfolio on a monthly basis.
Trade receivables and loss allowanceTrade receivables are comprised mainly of rental payments due from tenants. The Aventus Group applies the AASB 9 simplified approach to measuring expected credit losses which uses a lifetime expected loss allowance for all trade receivables. Expected loss rates are based on historical payment profiles adjusted for current and forward-looking macroeconomic factors affecting the ability of debtors to settle the receivables.
Annual Report 2020 Aventus Group 81
Financial Report

Notes to the Consolidated Financial Statementscontinued
39. Financial risk management continuedAventus Group continuedA reconciliation of the movement in the loss allowance during the financial year is as follows:
2020$m
2019$m
Balance at the beginning of the financial year 0.6 0.4
Increase in loss allowance recognised in profit or loss during the year 6.3 0.5
Receivables written off during the year as uncollectable (0.2) (0.3)
Balance at the end of the financial year 6.7 0.6
Critical estimates and judgementsCOVID-19 has created a higher degree of estimation uncertainty in calculating the loss allowance at 30 June 2020. The loss allowance incorporates COVID-19 specific adjustments for rental relief granted or expected to be granted to tenants plus other adjustments based on retailer types, industries, geographical locations and/or specific tenant circumstances. If there are any changes in these assumptions or economic conditions the actual loss allowance required may differ.
Impaired receivablesImpaired receivables are written-off when there is no reasonable expectation of recovery. Indicators that there is no reasonable expectation of recovery include, amongst other:
> agreed abatement terms with debtors;
> significant financial difficulties of the debtor;
> failure to comply with repayment plans;
> probability the debtor will enter bankruptcy or financial reorganisation, and
> default or failure to make contractual payments for a period of 120 days past due.
Impairment losses on rental receivables are presented as property expenses in the consolidated statement of comprehensive income. Subsequent recovery of amounts previously written-off are credited against the same line item.
AHL GroupThe AHL Group’s activities expose it to financial risks including interest rate risk, liquidity risk and credit risk.
a) Interest rate riskInterest rate risk is the risk that the fair value of cash flows of a financial instrument will fluctuate due to changes in market interest rates. The main interest rate risk arises from borrowings from ARPF which are disclosed in note 28 to the financial statements.
Interest rate risk sensitivityThe impact of a 0.5% increase/decrease in market interest rates at balance date would result in a $425,000 increase/decrease in profit or loss per annum.
b) Liquidity riskLiquidity risk is the risk that the AHL Group will not be able to meet its financial obligations as they fall due. Management manages liquidity by ensuring there is sufficient cash and/or committed undrawn borrowings available.
Management prepares and monitors rolling forecasts of liquidity reserves, comprising cash and undrawn borrowing facilities, on the basis of expected future cash flows.
Financing arrangements, debt maturity profiles and access to undrawn borrowing facilities at 30 June 2020 and 30 June 2019 are disclosed in note 28.
82

Maturities of financial liabilitiesThe tables below analyse financial liabilities into relevant maturity groupings based on their contractual maturities for all financial liabilities. The amounts disclosed in the table are the contractual undiscounted cash flows.
30 June 2020
Contractual maturities of financial liabilities
Less than6 months
$’0006–12 months
$’0001 to 3 years
$’0003–5 years
$’000
Greater than 5 years
$’000
Totalcontractedcash flows
$’000
Carryingamount of
liabilities$’000
Payables 3,249 – – – – 3,249 3,249
Lease liabilities 464 476 1,307 – – 2,247 2,042
Borrowings 1,448 1,424 5,744 5,752 94,053 108,421 84,941
Total 5,161 1,900 7,051 5,752 94,053 113,917 90,232
30 June 2019
Contractual maturities of financial liabilities
Less than6 months
$’0006–12 months
$’0001 to 3 years
$’0003–5 years
$’000
Greater than 5 years
$’000
Totalcontractedcash flows
$’000
Carryingamount of
liabilities$’000
Payables 2,178 – – – – 2,178 2,178
Borrowings 1,900 1,879 7,537 7,547 105,235 124,098 89,511
Total 4,078 1,879 7,537 7,547 105,235 126,276 91,689
c) Credit riskRisk management and securityCredit risk is the risk that a customer or counterparty to a financial instrument will default on their contractual obligations resulting in a financial loss to the AHL Group.
The AHL Group’s credit risk arises from cash and cash equivalents and receivables. The carrying amount of these financial assets disclosed in the consolidated balance sheet represents the maximum credit exposure at 30 June 2020 and 30 June 2019.
To manage credit risk in relation to cash and cash equivalents, deposits are held with financial institutions with AA- Standards and Poor’s credit ratings.
In relation to receivables, the AHL Group has a significant concentration of receivables due from the ARPF. Management has no concerns regarding the recoverability of these receivables taking into account the underlying financial position of ARPF and past payment history.
Impaired receivablesThere were no impaired receivables at 30 June 2020 or 30 June 2019.
Impaired receivables are written-off when there is no reasonable expectation of recovery. Indicators that there is no reasonable expectation of recovery include:
> significant financial difficulties of the debtor;
> probability the debtor will enter bankruptcy or financial reorganisation, and
> default or delinquency in payments (more than 120 days overdue).
Impairment losses on receivables are presented as net impairment losses in the consolidated statement of comprehensive income. Subsequent recovery of amounts previously written-off are credited against the same line item.
Receivables past due but not impairedAs at 30 June 2020 and 30 June 2019 no trade receivables were past due.
Annual Report 2020 Aventus Group 83
Financial Report

Notes to the Consolidated Financial Statementscontinued
40. CommitmentsCapital commitmentsSignificant capital expenditure contracted for at balance date but not recognised as liabilities is as follows:
AventusGroup
June 2020$m
AventusGroup
June 2019$m
AHL GroupJune 2020
$’000
AHL GroupJune 2019
$’000
Development expenditure 8.0 2.9 – –
Acquisition of development land 13.0 – – –
21.0 2.9 – –
Acquisition of development landOn 17 June 2020 the Aventus Group exchanged contracts to acquire development land adjoining Epping Hub for $11.5 million excluding GST. The land is zoned for mixed use, retail, residential, office, medical and large format retail.
Total outstanding commitments under the contract at 30 June 2020, including GST, stamp duty and settlement adjustments, amounted to $13.0 million. The acquisition was settled on 20 July 2020.
41. ContingenciesBank guarantees
AventusGroup
June 2020$m
AventusGroup
June 2019$m
AHL GroupJune 2020
$’000
AHL GroupJune 2019
$’000
ARPF facility 4.1 1.1 – –
Aventus Services Pty Ltd facility – 0.5 – 478
Total 4.1 1.6 – 478
ARPF facilityARPF has a $5.0 million bank guarantee facility which expires in July 2023. At 30 June 2020 $4.1m of bank guarantees had been issued including a:
> $1.1 million guarantee relating to the redevelopment of investment properties (30 June 2019: $1.1 million).
> $2.5m guarantee provided to ACL in relation to its Australian Financial Services Licence (30 June 2019: Nil). The guarantee has been eliminated on consolidation of the Aventus Group and represents a contingent asset of ACL.
> $0.5 million relating to the lease of office premises (30 June 2019: Nil).
Aventus Services Pty Ltd facilityThe Aventus Services Pty Ltd facility was terminated in June 2020.
As at 30 June 2019 the facility was fully drawn from the issue of a $478,000 bank guarantee relating to the lease of office premises.
Drawn bank guarantees represent contingent liabilities and do not form part of borrowings disclosed in the consolidated balance sheet. Drawn bank guarantees are also excluded from total borrowings when calculating debt covenants.
There were no other contingent liabilities or assets at 30 June 2020 or 30 June 2019.
84

42. Remuneration of auditorsThe auditor of the Aventus Group is Ernst & Young. The following fees were paid or payable to Ernst & Young for services provided during the financial year.
AventusGroup
2020$’000
AventusGroup
2019$’000
AHLGroup
2020$
AHLGroup
2019$
Fees for auditing the statutory financial report
Audit and review of financial reports of the group and controlled entities 298 343 41,000 41,000
Fees for assurance services required by legislation to be provided by the auditor
Australian Financial Services Licence audit 5 5 6,000 6,000
Fees for other assurance services
Compliance plan audit 20 20 – –
Other assurance services 92 467 – –
Total audit and other assurance services 415 835 47,000 47,000
Non-audit services
Remuneration services – 141 – –
Consulting services – 20 – –
Total non-audit services – 161 – –
Total fees to Ernst & Young 415 996 47,000 47,000
43. Offsetting financial assets and liabilitiesAt 30 June 2020 and 2019 there were no financial assets and liabilities that were offset in the Aventus Group or AHL Group consolidated balance sheets.
ISDA Master AgreementsAgreements with derivative counterparties are based on an ISDA Master Agreement. Under the terms of these arrangements, only where certain credit events occur (such as default), the net position payable/receivable to a single counterparty in the same currency will be taken as owing and all the relevant arrangements terminated. As the Aventus Group does not presently have a legally enforceable right of set-off, these amounts have not been offset in the balance sheet.
44. Events occurring after the reporting periodAcquisition of development landOn 20 July 2020 the Aventus Group settled the acquisition of development land adjoining Epping Hub for $11.5 million excluding GST. Refer to note 40 for further information.
Former Masters Lease at Cranbourne HomeA subsidiary of the Aventus Group, Aventus Cranbourne Thompsons Road Pty Ltd, is the lessor (Landlord) under the lease of the former Masters store at Cranbourne Home (Head Lease).
As announced in September 2019 the Landlord appealed the judgement of the Supreme Court of Victoria in relation to the provision of its consent to a proposed sub-lease of part of the premises at Cranbourne previously occupied by Masters.
On 5 August 2020 it was announced the appeal was successful. The Court of Appeal found the Landlord did not act unreasonably in regards to the requests and set aside the decision of the trial judge.
The Head Lease remains on foot until 30 September 2030 including the guarantee by Woolworths Limited for the performance by Home Consortium Leasehold Pty Ltd (formerly Masters Home Improvement Australia Pty Ltd) of its obligations under the Head Lease.
There has not been any other matter or circumstance occurring subsequent to the end of the financial year that has significantly affected, or may significantly affect, the operations of the Aventus Group or AHL Group, the results of those operations, or the state of affairs of the Aventus Group or AHL Group in future financial years.
Annual Report 2020 Aventus Group 85
Financial Report

Notes to the Consolidated Financial Statementscontinued
45. Parent entity informationa) Summary financial informationThe individual financial statements for ARPF and AHL show the following aggregate amounts:
ARPF2020
$m
ARPF2019
$m
AHL2020
$’000
AHL2019$’000
Statement of comprehensive income
Profit/(loss) for the year 32.4 45.7 (2,398) (2,814)
Total comprehensive income for the year 32.4 45.7 (2,398) (2,814)
ARPFJune 2020
$m
ARPFJune 2019
$m
AHLJune 2020
$’000
AHLJune 2019
$’000
Balance sheet
Current assets 36.7 6.4 1,131 1,976
Non-current assets 1,605.9 1,665.0 148,181 148,282
Total assets 1,642.6 1,671.4 149,312 150,258
Current liabilities (22.2) (27.7) (641) (4,499)
Non-current liabilities (750.0) (785.9) (92,558) (89,511)
Total liabilities (772.2) (813.6) (93,199) (94,010)
Net assets 870.4 857.8 56,113 56,248
Contributed equity 1,154.0 1,107.0 61,283 59,062
Reserves 0.9 – 42 –
Accumulated losses (284.5) (249.2) (5,212) (2,814)
Total equity 870.4 857.8 56,113 56,248
b) Guarantees entered into by the parent entityWith the exception of guarantees provided in relation to the Aventus Group’s debt facilities ARPF and AHL had not provided any guarantees as at 30 June 2020 or 30 June 2019.
c) Contingent liabilities of the parent entityWith the exception of items disclosed in note 41 to the financial statements ARPF and AHL did not have any contingent liabilities as at 30 June 2020 or 30 June 2019.
d) Contractual commitmentsARPF and AHL did not have any contractual commitments as at 30 June 2020 or 30 June 2019.
e) Determining the parent entity financial informationThe financial information for ARPF and AHL have been prepared on the same basis as the consolidated financial statements with the exception of the following:
> Investments in subsidiaries and associates are recorded at cost. Distributions or dividends received from subsidiaries and associates are recognised in profit or loss when its right to receive the distribution or dividend is established.
86

Directors’ Declaration
In the directors’ opinion:
a) the financial statements and notes of the Aventus Group and AHL Group are in accordance with the Corporations Act 2001, including:
i. complying with Accounting Standards, the Corporations Regulations 2001 and other mandatory professional reporting requirements, and
ii. giving a true and fair view of the consolidated financial position of the Aventus Group and AHL Group as at 30 June 2020 and of their performance for the financial year ended on that date, and
b) there are reasonable grounds to believe that ARPF and AHL will be able to pay their debts as and when they become due and payable.
The financial statements of the Aventus Group and AHL Group also comply with International Financial Reporting Standards as disclosed in note 1(b) to the financial statements.
The directors have been given the declarations by the chief executive officer and chief financial officer required by section 295A of the Corporations Act 2001.
This declaration is made in accordance with a resolution of the directors of ACL and AHL made pursuant to s295(5) of the Corporations Act 2001.
Darren Holland Bruce Carter Executive Director Chair
Sydney Sydney 24 August 2020 24 August 2020
Annual Report 2020 Aventus Group 87
Financial Report

Independent Auditor’s Report
A member firm of Ernst & Young Global Limited Liability limited by a scheme approved under Professional Standards Legislation
94
Ernst & Young Services Pty Limited 200 George Street Sydney NSW 2000 Australia GPO Box 2646 Sydney NSW 2001
Tel: +61 2 9248 5555 Fax: +61 2 9248 5959 ey.com/au
Independent Auditor's Report to the Stapled Security Holders of Aventus Group
Report on the Audit of the Financial Report
Opinion
We have audited the financial report of Aventus Group (the Group) which comprises of Aventus Retail Property Fund (the Fund) and its subsidiaries, and Aventus Holdings Limited (AHL or the Company) and its subsidiaries, and which comprises:
• the Group consolidated and Company consolidated statements of financial position as at 30 June 2020;
• the Group consolidated and Company consolidated statements of comprehensive income, statements of changes in equity and statements of cash flows for the year then ended;
• notes to the financial statements, including a summary of significant accounting policies; and
• the directors' declaration.
In our opinion, the accompanying financial report is in accordance with the Corporations Act 2001, including:
a) giving a true and fair view of the Company’s and the Group's financial position as at 30 June 2020 and of their financial performance for the year ended on that date; and
b) complying with Australian Accounting Standards and the Corporations Regulations 2001.
Basis for Opinion
We conducted our audit in accordance with Australian Auditing Standards. Our responsibilities under those standards are further described in the Auditor’s Responsibilities for the Audit of the Financial Report section of our report. We are independent of the Group in accordance with the auditor independence requirements of the Corporations Act 2001 and the ethical requirements of the Accounting Professional and Ethical Standards Board’s APES 110 Code of Ethics for Professional Accountants (including Independence Standards) (the Code) that are relevant to our audit of the financial report in Australia. We have also fulfilled our other ethical responsibilities in accordance with the Code.
We believe that the audit evidence we have obtained is sufficient and appropriate to provide a basis for our opinion.
88

A member firm of Ernst & Young Global Limited Liability limited by a scheme approved under Professional Standards Legislation
95
Key Audit Matters
Key audit matters are those matters that, in our professional judgment, were of most significance in our audit of the financial report of the current year. These matters were addressed in the context of our audit of the financial report as a whole, and in forming our opinion thereon, but we do not provide a separate opinion on these matters. For each matter below, our description of how our audit addressed the matter is provided in that context. We have fulfilled the responsibilities described in the Auditor’s Responsibilities for the Audit of the Financial Report section of our report, including in relation to these matters. Accordingly, our audit included the performance of procedures designed to respond to our assessment of the risks of material misstatement of the financial report. The results of our audit procedures, including the procedures performed to address the matters below, provide the basis for our audit opinion on the accompanying financial report.
Investment Property Portfolio – Determination of fair value
Why significant How our audit addressed the key audit matter
The Group’s total assets include investment properties either held directly or through an interest in an Associate. These assets are carried at fair value, which is assessed by the directors with reference to either external independent property valuations or internal valuations and are based on market conditions existing at the reporting date.
As disclosed in note 2(n), the valuation of investment properties is inherently subjective. A small difference in any one of the key market input assumptions, when aggregated across all the properties, could result in a significant change to the valuation of investment properties.
Two approaches are generally used: the Income Capitalisation approach and the Discounted Cash Flow approach to arrive at a range of valuation outcomes, from which the valuers derive their best estimate of the value at a point in time.
We have considered this a key audit matter due to the number of judgments required in determining fair value.
Our audit procedures included the following:
• We discussed the following matters with management:
• movements in the Group’s investment property portfolio;
• changes in the condition of each property;
• controls in place relevant to the valuation process; and
• the impact that COVID-19 has had on the Group’s investment property portfolio including rent abatements offered to tenants and tenant occupancy risk arising from changes in the estimated lease renewals.
• On a sample basis, we performed the following procedures for selected properties: • Evaluated the key assumptions and agreed passing
rental income to tenancy schedules. These assumptions and inputs included market and contractual rent, occupancy rates including forecast occupancy levels, forecast rent, lease terms, re-leasing costs, operating expenditure and future capital expenditure. We assessed the effectiveness of relevant controls over the leasing process and associated tenancy reports which are used as source data in the property valuations by testing the relevant controls.
Annual Report 2020 Aventus Group 89
Independent Auditor’s report

Independent Auditor’s Reportcontinued
A member firm of Ernst & Young Global LimitedLiability limited by a scheme approved under Professional Standards Legislation
96
Investment Property Portfolio – Determination of fair value (continued)
Why significant How our audit addressed the key audit matter
As at 30 June 2020 there is valuation uncertainty arising from the COVID-19 pandemic and the response of Governments to it. This means there is a wider range of possible assumptions and values than at other valuation points in the past. In addition, property values may change unexpectedly over a relatively short period of time.
Given the market conditions at balance date, the independent valuers have reported on the basis of the existence of ‘material valuation uncertainty’, noting that less certainty, and a higher degree of caution, should be attached to the valuations than would normally be the case. In this situation the disclosures in the financial statements provide particularly important information about the assumptions made in the property valuations and the market conditions at 30 June 2020.
For these reasons we consider it important that attention is drawn to the information in Notes 3 and 19 in assessing the property valuations at 30 June 2020.
• Assessed whether COVID-19 relief provided to tenants had been factored into the valuations and that changes in tenant occupancy risk were also considered.
• Tested the mathematical accuracy of internal valuations.
• Involved our real estate valuation specialists to assist with the assessment of the valuation assumptions and methodologies, in particular changes made as a result of COVID-19.
• Where relevant we compared the valuation against comparable transactions utilised in the valuation process.
• Evaluated the suitability of the valuation methodology across the portfolio based on the type of asset. We considered the reports of the independent valuers which included the impact that COVID-19 has had on key assumptions such as the capitalisation, discount or growth rate and future forecast rentals. We have also considered and responded to restrictions imposed on the valuation process (if any) and the market conditions at balance date.
• Assessed the qualifications, competence and objectivity of the valuers.
• We have considered whether there have been any indicators of material changes in property valuations from 30 June 2020 up to the date of our opinion or any matters emerging since 30 June 2020 which provide evidence of a material change in valuation at that date. We involved our real estate valuation specialists in making that assessment.
• We have considered whether the financial report disclosures and in particular those relating to the valuation uncertainty are appropriate.
90

A member firm of Ernst & Young Global LimitedLiability limited by a scheme approved under Professional Standards Legislation
97
Impairment assessment for goodwill and other intangible assets
Why significant How our audit addressed the key audit matter
At 30 June 2020 the Group’s and the Company’s consolidated statements of financial position includes goodwill and other intangible assets amounting to $144.2 million and $186.0 million respectively. The directors have assessed goodwill and other intangible assets for impairment at 30 June 2020. As disclosed within Notes 3 and 20 of the financial report, the assessment of the impairment of the Group’s goodwill and other intangible assets incorporated significant judgments and estimates, specifically concerning factors such as forecast cashflows, discounts rates and terminal growth rates. As at 30 June 2020 there is increased uncertainty arising from the COVID-19 pandemic and the response of Governments to it. This means that the cash flow forecasts and assumptions may change unexpectedly over a relatively short period of time. These estimates and assumptions incorporate future performance, market and economic conditions. Minor changes in certain assumptions can lead to significant changes in the recoverable amount of these assets. Accordingly, we considered this to be a key audit matter due to the uncertainty and judgements required in the impairment testing of goodwill.
Our audit procedures included the following: • Considered the appropriateness and
application of valuation methodologies applied; • Assessed the cash flow forecasts, assumptions
and estimates used by the Group, by considering the reliability of the Group’s historical cash flow forecasts, our knowledge of the business and corroborating data with external information and other internal data sources where possible;
• Involved our valuation specialists to assess whether the methodology applied was in accordance with Australian Accounting Standards and to evaluate the key assumptions applied in the impairment models, in particular, changes made as a result of COVID-19. These included the discount rates, growth rates, and terminal value assumptions;
• Tested the mathematical accuracy of the impairment testing models including the consistency of relevant data with latest approved forecasts;
• Performed sensitivity analysis on key assumptions including discount rates, terminal growth rates and EBIT forecasts;
• Considered the relationship between the market capitalisation of the business to the net assets of the Group; and
• Assessed the adequacy of the disclosure in the financial report.
Annual Report 2020 Aventus Group 91
Independent Auditor’s report
Independent Auditor’s Reportcontinued
A member firm of Ernst & Young Global Limited Liability limited by a scheme approved under Professional Standards Legislation
98
Information Other than the Financial Report and Auditor’s Report Thereon
The directors are responsible for the other information. The other information comprises the information included in the Company’s 2020 Annual Report other than the financial report and our auditor’s report thereon. We obtained the Directors’ Report that is to be included in the Annual Report, prior to the date of this auditor’s report, and we expect to obtain the remaining sections of the Annual Report after the date of this auditor’s report.
Our opinion on the financial report does not cover the other information and we do not and will not express any form of assurance conclusion thereon, with the exception of the Remuneration Report and our related assurance opinion.
In connection with our audit of the financial report, our responsibility is to read the other information and, in doing so, consider whether the other information is materially inconsistent with the financial report or our knowledge obtained in the audit or otherwise appears to be materially misstated.
If, based on the work we have performed on the other information obtained prior to the date of this auditor’s report, we conclude that there is a material misstatement of this other information, we are required to report that fact. We have nothing to report in this regard.
Responsibilities of the Directors for the Financial Report
The directors of the Company are responsible for the preparation of the financial report that gives a true and fair view in accordance with Australian Accounting Standards and the Corporations Act 2001 and for such internal control as the directors determine is necessary to enable the preparation of the financial report that gives a true and fair view and is free from material misstatement, whether due to fraud or error.
In preparing the financial report, the directors are responsible for assessing the Company’s and Group’s ability to continue as a going concern, disclosing, as applicable, matters relating to going concern and using the going concern basis of accounting unless the directors either intend to liquidate the Company or Group or to cease operations, or have no realistic alternative but to do so.
Auditor's Responsibilities for the Audit of the Financial Report
Our objectives are to obtain reasonable assurance about whether the financial report as a whole is free from material misstatement, whether due to fraud or error, and to issue an auditor’s report that includes our opinion. Reasonable assurance is a high level of assurance, but is not a guarantee that an audit conducted in accordance with the Australian Auditing Standards will always detect a material misstatement when it exists. Misstatements can arise from fraud or error and are considered material if, individually or in the aggregate, they could reasonably be expected to influence the economic decisions of users taken on the basis of this financial report.
As part of an audit in accordance with the Australian Auditing Standards, we exercise professional judgment and maintain professional scepticism throughout the audit. We also:
92

A member firm of Ernst & Young Global Limited Liability limited by a scheme approved under Professional Standards Legislation
99
• Identify and assess the risks of material misstatement of the financial report, whether due to fraud or error, design and perform audit procedures responsive to those risks, and obtain audit evidence that is sufficient and appropriate to provide a basis for our opinion. The risk of not detecting a material misstatement resulting from fraud is higher than for one resulting from error, as fraud may involve collusion, forgery, intentional omissions, misrepresentations, or the override of internal control.
• Obtain an understanding of internal control relevant to the audit in order to design audit
procedures that are appropriate in the circumstances, but not for the purpose of expressing an opinion on the effectiveness of the Company’s or the Group’s internal control.
• Evaluate the appropriateness of accounting policies used and the reasonableness of accounting
estimates and related disclosures made by the directors.
• Conclude on the appropriateness of the directors’ use of the going concern basis of accounting and, based on the audit evidence obtained, whether a material uncertainty exists related to events or conditions that may cast significant doubt on the Company’s or Group’s ability to continue as a going concern. If we conclude that a material uncertainty exists, we are required to draw attention in our auditor’s report to the related disclosures in the financial report or, if such disclosures are inadequate, to modify our opinion. Our conclusions are based on the audit evidence obtained up to the date of our auditor’s report. However, future events or conditions may cause the Company or the Group to cease to continue as a going concern.
• Evaluate the overall presentation, structure and content of the financial report, including the
disclosures, and whether the financial report represents the underlying transactions and events in a manner that achieves fair presentation.
• Obtain sufficient appropriate audit evidence regarding the financial information of the entities or
business activities within the Group to express an opinion on the financial report. We are responsible for the direction, supervision and performance of the Group audit. We remain solely responsible for our audit opinion.
We communicate with the directors regarding, among other matters, the planned scope and timing of the audit and significant audit findings, including any significant deficiencies in internal control that we identify during our audit. We also provide the directors with a statement that we have complied with relevant ethical requirements regarding independence, and to communicate with them all relationships and other matters that may reasonably be thought to bear on our independence, and where applicable, actions taken to eliminate threats or safeguards applied.
From the matters communicated to the directors, we determine those matters that were of most significance in the audit of the financial report of the current year and are therefore the key audit matters. We describe these matters in our auditor’s report unless law or regulation precludes public disclosure about the matter or when, in extremely rare circumstances, we determine that a matter should not be communicated in our report because the adverse consequences of doing so would reasonably be expected to outweigh the public interest benefits of such communication.
Annual Report 2020 Aventus Group 93
Independent Auditor’s report

Independent Auditor’s Reportcontinued
A member firm of Ernst & Young Global LimitedLiability limited by a scheme approved under Professional Standards Legislation
100
Report on the Audit of the Remuneration Report
Opinion on the Remuneration Report
We have audited the Remuneration Report included in pages 10 to 26 of the directors' report for the year ended 30 June 2020.
In our opinion, the Remuneration Report of Aventus Group for the year ended 30 June 2020, complies with section 300A of the Corporations Act 2001.
Responsibilities
The directors of the Company are responsible for the preparation and presentation of the Remuneration Report in accordance with section 300A of the Corporations Act 2001. Our responsibility is to express an opinion on the Remuneration Report, based on our audit conducted in accordance with Australian Auditing Standards. Ernst & Young Mark Conroy Partner Sydney 24 August 2020
26 to 38
94

Securityholder Information
The Securityholder Information set out below was applicable as at 30 September 2020.
a) Distribution of equity securitiesAn analysis of the number of Securityholders by size of holding are set out below:
Holding distribution
Range Securities % No. of holders
100,001 and Over 496,170,434 88.93 139
10,001 to 100,000 44,571,623 7.99 1,889
5,001 to 10,000 10,917,299 1.96 1,390
1,001 to 5,000 5,832,500 1.05 1,863
1 to 1,000 468,584 0.08 1,054
Total 557,960,440 100.00 6,335
b) Equity security holdersThe names of the 20 largest Securityholders as at 30 September 2020 are listed below:
Rank Name 30 Sep 2020 %IC
1 HSBC CUSTODY NOMINEES (AUSTRALIA) LIMITED 85,319,613 15.29
2 BBFIT INVESTMENTS PTE LIMITED 81,661,175 14.64
3 BB RETAIL CAPITAL PTY LTD 75,942,198 13.61
4 J P MORGAN NOMINEES AUSTRALIA PTY LIMITED 55,354,937 9.92
5 CITICORP NOMINEES PTY LIMITED 40,756,551 7.30
6 NATIONAL NOMINEES LIMITED 35,189,685 6.31
7 RRI INVESTMENTS PTY LTD 22,901,245 4.10
8 JD MARNABECK PTY LTD 7,895,292 1.42
9 BNP PARIBAS NOMS(NZ) LTD 7,638,967 1.37
10 RAYRA PTY LIMITED 5,881,989 1.05
11 BNP PARIBAS NOMS PTY LTD 4,495,835 0.81
12 MRS ALISON BETTY HANSEN & MR MICHAEL KENNETH HANSEN 3,608,771 0.65
13 HSBC CUSTODY NOMINEES (AUSTRALIA) LIMITED 3,526,797 0.63
14 THE TRUST COMPANY (AUSTRALIA) LIMITED 3,463,750 0.62
15 BNP PARIBAS NOMINEES PTY LTD 3,312,708 0.59
16 COLOSKYE PTY LIMITED 2,651,216 0.48
17 WEC ENTERPRISES PTY LTD 2,287,929 0.41
18 ECAPITAL NOMINEES PTY LIMITED 2,015,178 0.36
19 MR JOHN CRAIG CHARLTON & MRS JANE AMANDA LEWIS 1,993,514 0.36
20 CECILE BRUNNER PTY LTD 1,920,018 0.34
Total 447,817,368 80.26
Balance of register 110,143,072 19.74
Grand total 557,960,440 100.00
Annual Report 2020 Aventus Group 95

Securityholder Informationcontinued
c) Substantial holdersSubstantial Securityholders in AVN are set out below:
Name Number heldDate of
last Notice
Brett Blundy 157,603,373 11/9/2019
The Vangaurd Group 34,080,884 20/12/2019
Ray Itaoui 31,071,484 29/9/2016
d) Securities subject to voluntary escrowNil.
e) Voting rightsEach security confers the right to vote at meetings of Securityholders, subject to any voting restrictions imposed on a securityholder under the Corporations Act and the ASX Listing Rules.
On a poll, each securityholder has one vote for each dollar value of securities held.
ASXThe Aventus Group is listed on the Australian Securities Exchange (ASX:AVN).
WebsiteThe Aventus website, www.aventusgroup.com.au provides information on each property in the AVN Portfolio, and an overview of AVN’s corporate governance structures. The site also provides security price information and access to reports, presentations and releases made to the ASX.
How do I become a securityholder?Investors will need to use the services of a stockbroker or an online broking facility to invest in AVN.
Securityholder enquiriesPlease contact the Registry if you have any questions about your securityholding or distributions.
Contact details are as follows:
C/- Link Market Services Limited Locked Bag A14 Sydney South NSW 1235
Telephone: +61 1300 554 474 Facsimile: +61 2 9287 0303
ASX Code: AVN
Email: [email protected]
Website: www.linkmarketservices.com.au
How do I access my holding onlineVisit www.linkmarketservices.com.au and click on “Investor Login” or scan the QR Code to take you to the Investor Centre.
Select from one of the following access methods> Login to view your portfolio
> Register to set up a free portfolio
> Login via a single holding
Access a variety of holding information> View all holdings under your portfolio
> View current and historical balances, transactions andpayment information
Update your details> Update your address details, payment instructions and
tax details
> Update your communication preferences and address
> Lodge your proxy vote for any current meetings
96

Distribution reinvestment plan (DRP)A DRP has been established. A copy of the Plan Rules can be obtained from the website.
Electronic payment of distributionsSecurityholders may nominate a bank, building society or credit union account for the payment of distributions by direct credit. Payments are electronically credited on the distribution date and confirmed by mailed payment advice.
PublicationsThe annual report is the main source of information for Securityholders. A half year presentation is available in February each year providing a review of the six months to December. AVN also sends releases to the ASX covering matters of relevance to Securityholders.
Annual tax statementsAccompanying the final distribution payment each year will be an annual tax statement which details tax advantaged components of the year’s distribution.
DistributionsDistributions are paid quarterly.
Complaints handlingComplaints made in regard to the Group should be directed to:
The Fund Manager, Governor Macquarie Tower Level 33, 1 Farrer Place SYDNEY NSW 2000
The procedure for lodgement of complaints and complaints handling is set out in the Dispute Resolution Policy. A copy can be found under the Corporate Governance section at www.aventusproperty.com.au
Should a complainant be dissatisfied with the decision made by the responsible entity in relation to a compliant, the complainant is entitled to take the matter up with the Australian Financial Complaints Authority (AFCA) an external and independent industry complaint handling scheme.
AFCA’s contact details are:
Consumers: 1800 931 678 | [email protected]
Members: 1300 56 55 62 | [email protected]
Postal address: GPO Box 3, Melbourne VIC 3001
AFCA Website: www.afca.org.au
Securityholder Information
Annual Report 2020 Aventus Group 97

THE AVENTUS GROUPAventus Holdings Limited (ACN 627 640 180)
Aventus Capital Limited (ACN 606 555 480) (responsible entity for the Aventus Retail Property Fund)
AFSL No. 478061
Governor Macquarie Tower Level 33, 1 Farrer Place SYDNEY NSW 2000
DirectorsBruce Carter
Darren Holland
Kieran Pryke
Robyn Stubbs
Ray Itaoui
Company secretariesMary Weaver AGIA
Lawrence Wong
Registered office and principal place of businessGovernor Macquarie Tower Level 33, 1 Farrer Place SYDNEY NSW 2000 +61 2 9285 6700
Share registryLink Market Services Limited
Level 12, 680 George Street SYDNEY NSW 2000
AuditorsErnst & Young
Level 34, 200 George Street SYDNEY NSW 2000
CustodianOne Managed Investment Groups Limited
Level 16, Governor Macquarie Tower 1 Farrer Place SYDNEY NSW 2000
Corporate Directory
98

Annual Report 2020 Aventus Group 99
NSW
SA
VIC
QLD
WA
1. Bankstown: 44% site coverage
2. Belrose: 83% site coverage
3. Caringbah: 86% site coverage
4. Castle Hill: 86% site coverage
5. Kotara: 55% site coverage
6. Mittagong: 36% site coverage
7. Marsden Park: 50% site coverage
8. Mcgraths Hill: 44% site coverage
9. Tuggerah: 30% site coverage
10. Warners Bay: 35% site coverage
11. Mile End: 48% site coverage
12. Ballarat: 39% site coverage
13. Cranbourne: 29% site coverage
14. Epping: 24% site coverage
15. Mornington: 39% site coverage
16. Jindalee: 37% site coverage
17. Logan: 100% site coverage
18. MacGregor: 42% site coverage
19. Sunshine Coast: 39% site coverage
20. Midland: 55% site coverage
Portfolio
1
6
11
16
2
7
12
17
3
8
13
18
4
9
14
19
5
10
15
20

www.aventusgroup.com.au