Availability Solar Radiation Data - Earth System Research ...Availability Solar Radiation Data •...
41
Transcript of Availability Solar Radiation Data - Earth System Research ...Availability Solar Radiation Data •...


Availability Solar Radiation Data
• “Solar Radiation over India” by A Mani,
• “Handbook of Solar Radiation” by A Mani and S.Rangarajan
• “Solar Radiant Energy over India (2009)” by Ministry of New and
Renewable Energy ,GOI.
• NISE(SEC)-NREL
• NASA
• Very limited measured solar radiation data is available for the
country.
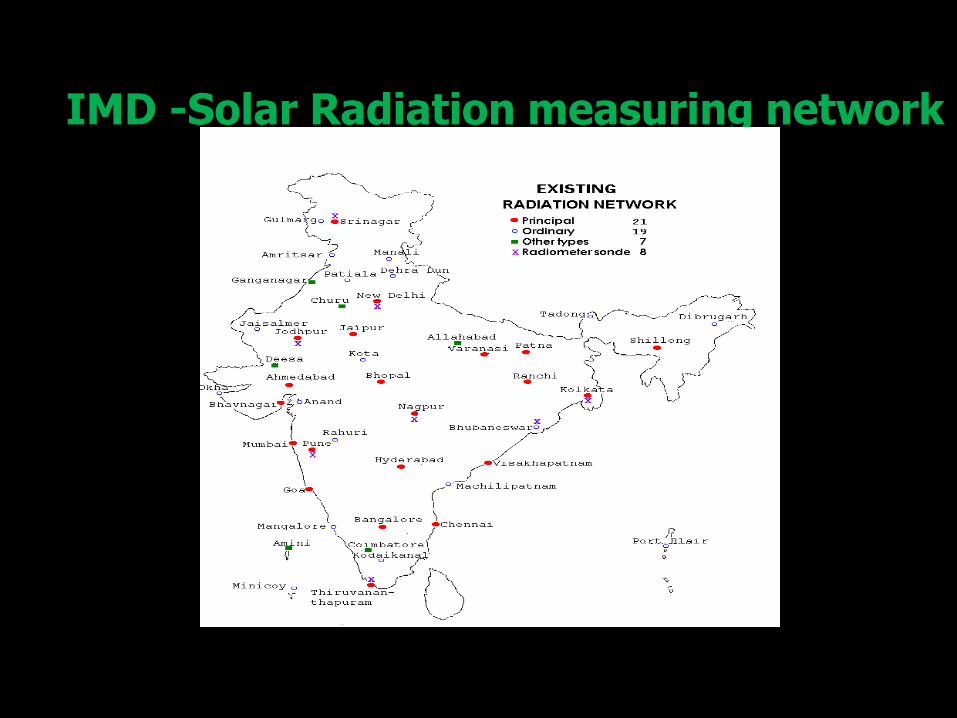
IMD -Solar Radiation measuring network
Figure 2 Spatial Distribution of Solar Radiation Monitoring Stations in the
Existing Network of IMD

Solar Radiation over
India” by A Mani,
Handbook of Solar
Radiation” by A Mani and
S.Rangarajan
“Solar Radiant Energy
over India (2009)” by
MNRE.
India Meteorological
Department (IMD)
Stations.

Commenced from
2010 in staggered phases
Initiated by
Ministry of New and Renewable Energy
National Institute of Wind Energy
Implemented by
An unique project on
Ground Measurement of Solar Radiation data

Installation
• To Install Solar Radiation and Weather data measuring station
• To create countrywide organizational structures for solar radiation data collection system.
Solar Atlas
• To develop a strong database of accurate Solar radiation Data
• To develop solar radiation atlas of India.
Dissemination
• To make Solar Data Products ready for solar developers, FIs, Policy makers, R & D institutions etc
• Support for marketing and bankability of solar projects

Application
segment
Target for Phase I
(2010-13)
Target for Phase 2
(2013-17)
Target for Phase 3
(2017-22)
Solar collectors 7 million
sq. meter
15 million
sq. meter
20 Million
sq. meter
Off grid solar
application
200 MW 1000 MW 2000 MW
Utility grid power,
including roof top
1000-2000 MW 4000-10000 MW 20000 MW
Jawaharlal Nehru National Solar Mission..
1. As per the updated targets the National Solar Mission, India aims to have an installed solar power capacity of 100 GW by 2022.
2. 100 GW capacity will include 40 GW rooftop solar power capacity and 60 GW utility-scale solar power projects

DATA QUALITY PYRAMID
INSTRUMENT SELECTION
SITE SELECTION AND INSTALLATION
MEASUREMENTS
Calibration
QUALITY CONTROL
DATA
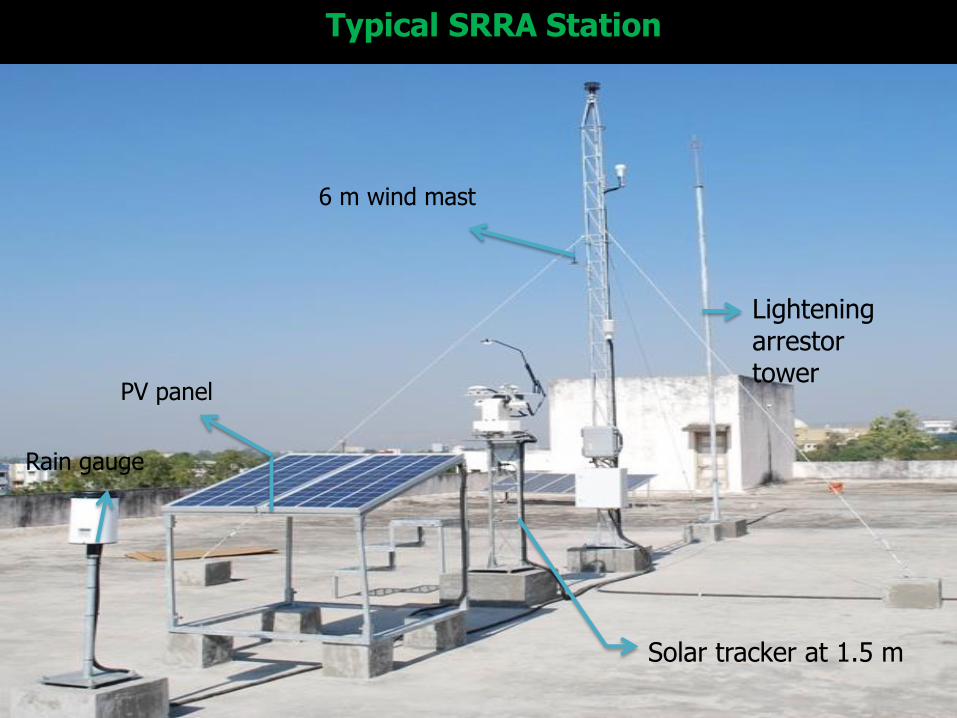
Typical SRRA Station
Lightening arrestor tower
6 m wind mast
PV panel
Rain gauge
Solar tracker at 1.5 m


SRRA Stations-Phase-I

Dedicated SRRA stations
Phase I 51
Phase II 60
MEDA 06
AMS 04
Total 121

Advanced Measurement Station(AMS)
Sun Photometer on solar tracker @ 1.5 m
6m Tower
Lightening Arrestor
Scatterometer

Direct Beam Filter Spectrometer-YES, USA
Scatterometer - Envirotech USA
Albedometer-Hukseflux-SRA20
Pyrgeometer-Hukseflux-IR20 Silicon Pyranometer

SRRA-Servers comprising of Primary, Secondary and Web server receiving & archiving data from all SRRA stations: 1 s data sampling at stations averaged to 1 min. SolMap-Servers for quality check (QC), assessment and SRRA product generation.
SolMap Servers
SRRA Servers
CWET SRRA Station
SRRA Screen Shot

Sampling period Averaging period Duration
10 sec 10 min Up to Nov 2011
1 sec 10 min Up to August 2012
1 sec 1 min From August 2012 till date
For solar radiation parameters, the applied quality control is based on Baseline Surface Radiation Network (BSRN) rules by the World Meteorological Organisation(WMO), elaborated by the Management and Exploitation of Solar Resource Knowledge(MESOR)

Field Experiences

1. Basic Gap Filling Gap filling methodology depends on a) availability of three solar radiation components: Global Horizontal Irradiance (GHI) Diffuse Horizontal Irradiance (DHI) Direct Normal Irradiance (DNI)
– Case 1: gap for one component (GHI only or DHI only or DNI only) – Case 2: gap for two components (DHI and DNI) – Case 3: gap for all three solar radiation components (GHI, DHI and DNI)
b) the duration (length) of the gap:
– up to 3 hours – greater than 3 hours
Gap Filling Procedures – Basic Gap Filling

L3 Basic Gap Filling
Basic gap filling procedures developed under SRRA/SolMap for data products
The methodology depends on the availability of 3 radiation parameters and duration
At the moment basic gap filling is done with 1 hour resolution time series
Advanced gap filling techniques using satellite derived values are being implemented under SolMap project now and expected to be operational in a few months
The impacts of basic gap filling was tested with al 51 stations of SRRA phase 1
Accuracy of basic gap filling method was tested by creating artificial gaps
Mean bias of about 3% observed over GHI, DNI, DHI over all types of gaps
This accuracy is close to the accuracy of the measuring instruments indicating the gap filled values stay within tolerance limits
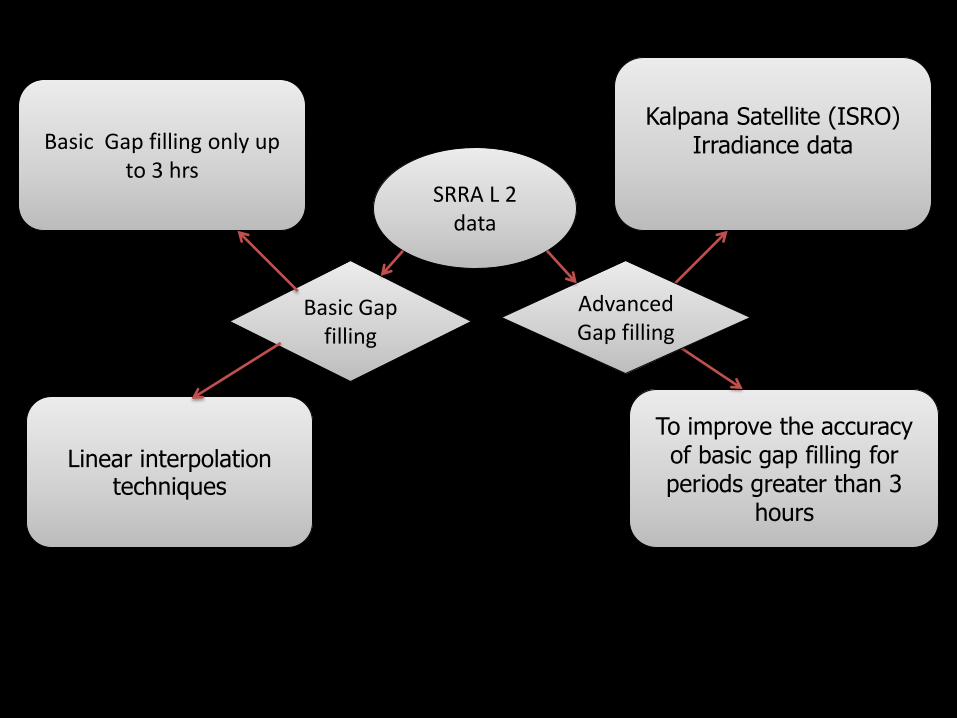
Basic Gap filling only up to 3 hrs
Kalpana Satellite (ISRO) Irradiance data
Linear interpolation techniques
To improve the accuracy of basic gap filling for periods greater than 3
hours
Basic Gap filling
Advanced Gap filling
SRRA L 2 data

SRRA products: example of L2 ASCII data in 1 min
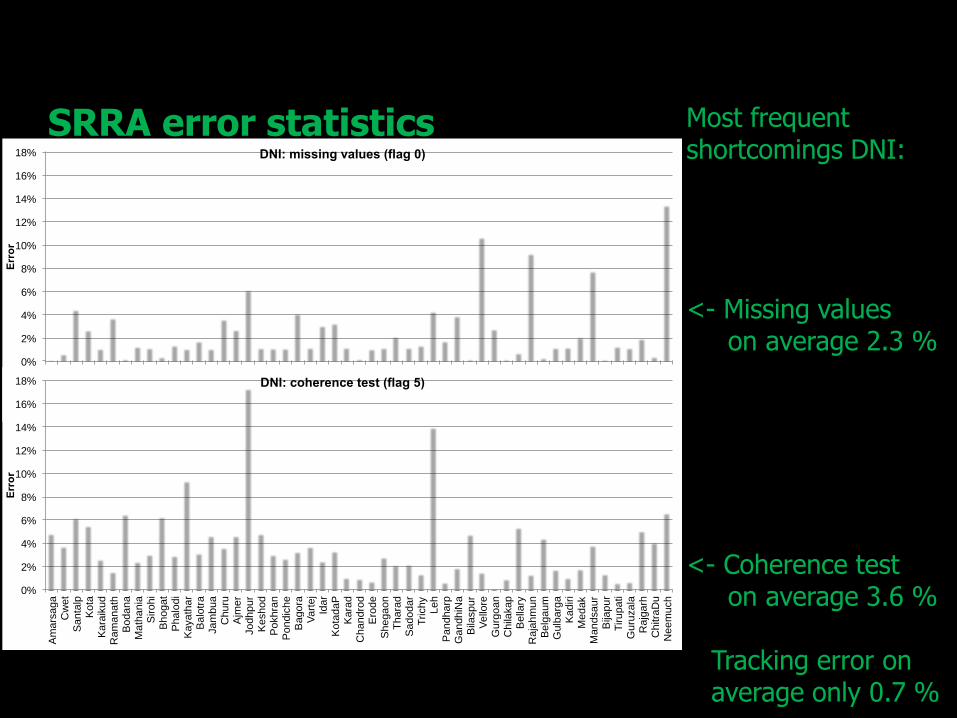
SRRA error statistics Most frequent shortcomings DNI: <- Missing values on average 2.3 % <- Coherence test on average 3.6 % Tracking error on average only 0.7 %
0%
2%
4%
6%
8%
10%
12%
14%
16%
18%
Am
ars
aga
C
wet
San
talp
K
ota
K
ara
ikud
R
am
an
ath
B
od
ana
M
ath
an
ia
Siro
hi
Bh
og
at
Ph
alo
di
Kaya
tha
r B
alo
tra
Ja
mb
ua
C
hu
ru
Ajm
er
Jo
dh
pur
Kesh
od
P
okhra
n
Po
nd
iche
B
ago
ra
Va
rte
j Id
ar
Ko
tad
aP
K
ara
d
Ch
an
dro
d
Ero
de
S
he
ga
on
T
hara
d
Sa
do
da
r T
richy
Leh
P
an
dha
rp
Ga
nd
hiN
a
Bila
spu
r V
ello
re
Gu
rgo
an
C
hila
kap
B
ella
ry
Ra
jah
mun
B
elg
au
m
Gulb
arg
a
Kad
iri
Me
dak
Man
dsa
ur
Bija
pu
r T
iru
pa
ti
Gu
ruza
la
Ra
jga
rh
Ch
itra
Du
N
ee
mu
ch
Err
or
DNI: missing values (flag 0)
0%
2%
4%
6%
8%
10%
12%
14%
16%
18%
Am
ars
aga
C
wet
San
talp
K
ota
K
ara
ikud
R
am
an
ath
B
od
ana
M
ath
an
ia
Siro
hi
Bh
og
at
Ph
alo
di
Kaya
tha
r B
alo
tra
Ja
mb
ua
C
hu
ru
Ajm
er
Jo
dh
pur
Kesh
od
P
okhra
n
Po
nd
iche
B
ago
ra
Va
rte
j Id
ar
Ko
tad
aP
K
ara
d
Ch
an
dro
d
Ero
de
S
he
ga
on
T
hara
d
Sa
do
da
r T
richy
Leh
P
an
dha
rp
Ga
nd
hiN
a
Bila
spu
r V
ello
re
Gu
rgo
an
C
hila
kap
B
ella
ry
Ra
jah
mun
B
elg
au
m
Gulb
arg
a
Kad
iri
Me
dak
Man
dsa
ur
Bija
pu
r T
iru
pa
ti
Gu
ruza
la
Ra
jga
rh
Ch
itra
Du
N
ee
mu
ch
Err
or
DNI: coherence test (flag 5)

Error Percentage (2013)
State
GHI DNI DHI
flagged correct flagged
incorrect flagged correct
flagged incorrect
flagged correct flagged
incorrect
[%] [%] [%] [%] [%] [%]
Jammu &Kashmir 90.15% 9.85% 92.85% 7.15% 95.30% 4.70%
Tamil Nadu 91.21% 8.79% 90.95% 13.30% 90.18% 9.82%
Rajasthan 93.98% 6.06% 94.36% 5.64% 94.40% 5.60%
Pondicherry 95.40% 4.60% 94.60% 5.40% 94.60% 5.40%
Madhya Pradesh 94.83% 5.18% 95.29% 4.87% 94.95% 5.05%
Maharashtra 96.33% 3.54% 96.88% 3.13% 97.01% 3.12%
Karnataka 95.81% 4.19% 93.41% 6.59% 90.31% 9.69%
Harayana 95.00% 5.01% 95.28% 4.74% 98.51% 1.49%
Gujarat 91.47% 8.52% 92.43% 9.80% 92.95% 7.06%
Chhattisgarh 90.80% 9.20% 91.04% 8.96% 91.15% 8.84%
Andhra Pradesh 94.00% 5.90% 94.10% 6.30% 94.10% 5.90%

SRRA Phase I Performance(51Stations)

SOLAR ATLAS
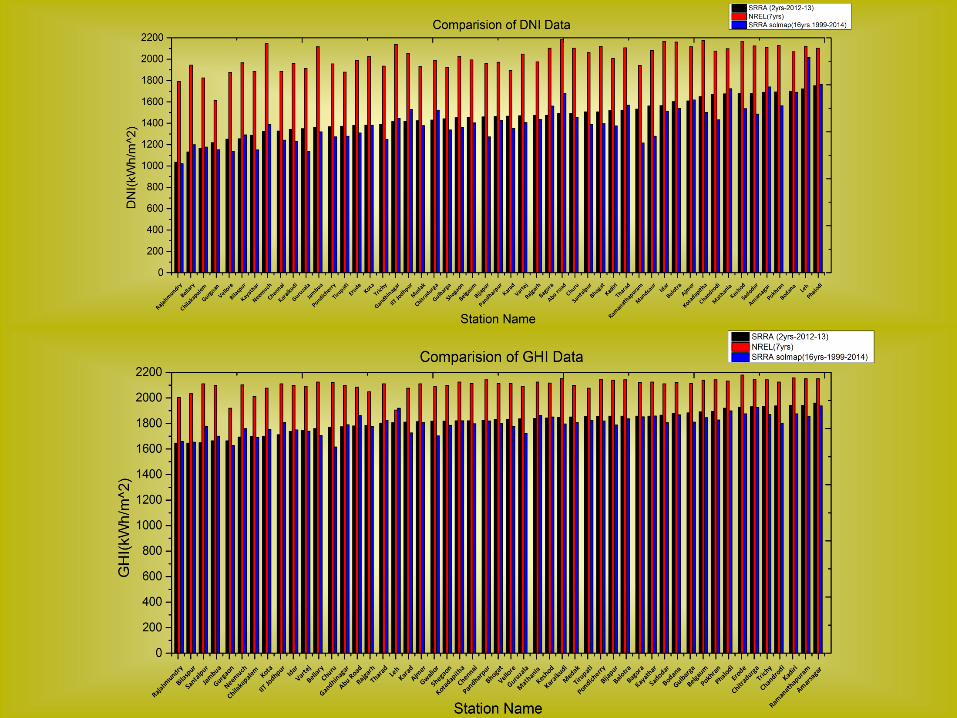
• 16 years of Satellite derived maps (1999-2014) were procured from M/S 3 Tier by competitive bidding.
• Developed of Quality Assessment Protocol for validation of long term solar irradiance data of 3 Tier against SRRA ground measurements.
• Analysis, quality check and comparison of Satellite based time series data for 115 locations against SRRA stations ground data for preparation of Solar Radiation Map of India.
• Measurements from 54 SRRA stations spread over India were used to adjust satellite derived estimates on a monthly basis. The final map products were validated against the remaining 61 SRRA stations. Using both ground measured solar radiation data of three years and long term satellite data, Solar Atlas of India has been prepared. The atlas consists of 90 solar radiation maps with spatial resolution of 3km X 3km, 30 maps each for GHI, DNI and DHI which comprises of log term averages, long term monthly average, annual average, annual variability maps and uncertainty maps.

3 Tier Satellite Data Sources Satellite Platform used
• Meteosat-5 covered India from July 1998 through February 2007. Meteosat-7 covers India from February 2007 through February 2014 and is in continuing service. Both satellites are from the first generation of Meteosat satellite and the visible band (0.45 – 1.0 μm) is used.
• Geo-location of Meteosat-5 from around 2005 onwards was difficult due to difficulties to stabilize the satellites
orbit. Thus, likelihood of erroneous data is
higher until Meteosat-7 took over in 2007
Satellite Position
• Meteosat-5 from mid 1998 was located at
• approx. 63°E, while M-7 from late 2006 was
• at around 57°E Temporal coverage of Satellite_ Start date/ End date and
Operational duration
• Meteosat 5 02/05/1991 – 16/04/2007, Indian
Ocean position started on 01/07/1998.
Meteosat 7 02/09/1997 to 01/31/2014 (ongoing),
Indian Ocean position started on 01/11/2006.
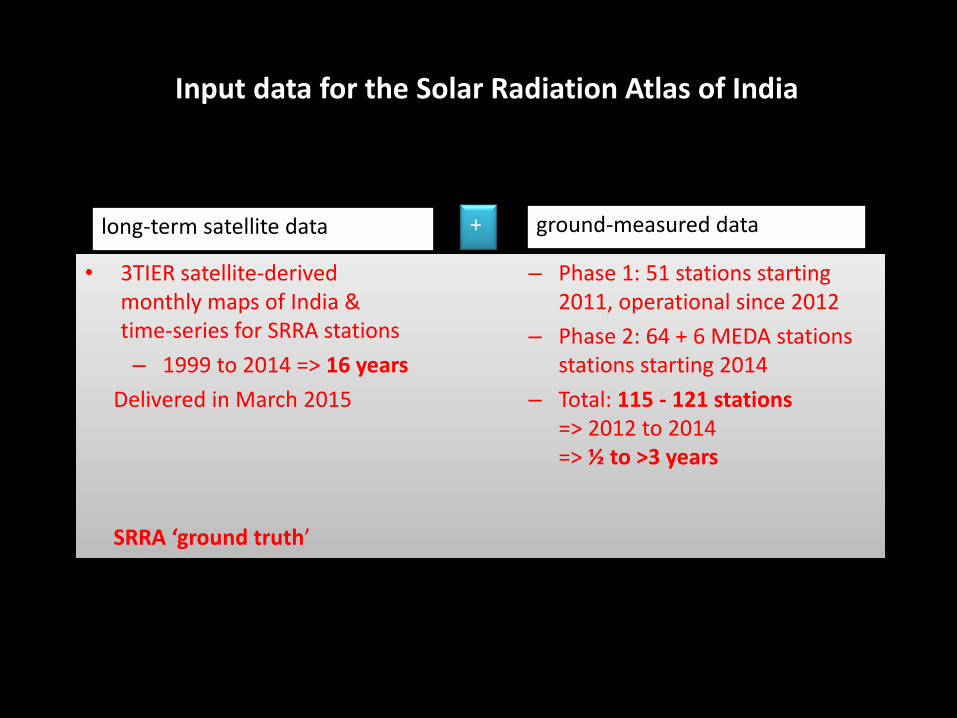
Input data for the Solar Radiation Atlas of India
• 3TIER satellite-derived monthly maps of India & time-series for SRRA stations
– 1999 to 2014 => 16 years
Delivered in March 2015
SRRA ‘ground truth’
– Phase 1: 51 stations starting 2011, operational since 2012
– Phase 2: 64 + 6 MEDA stations stations starting 2014
– Total: 115 - 121 stations => 2012 to 2014 => ½ to >3 years
long-term satellite data ground-measured data +
By extending the sat-data to end of 2014 better overlap reached and with SRRA Phase 2 many more stations available

Processing of solar maps
Processing of spatial correction matrices from geostatistical interpolation of satellite data to measured on hourly base
monthly averages
SRRA
L3
data
sat-time-series st. 1 sat-time-series st. 3
sat-time-series st. 50
SolMap/SRRA L4 GIS layers monthly data over 16 years
sat. DHI 1999 Jan
sat. DHI 1999 Feb
sat. DHI 1999 Mar
sat. DHI 2014 Dec
sat. DNI 1999 Jan
sat. DNI 1999 Feb
sat. DNI 1999 Mar
sat. DNI 2014 Dec
selection of 60 stations for validation by independent measurements on monthly base
sat. GHI 1999 Jan
sat. GHI 1999 Feb
sat. GHI 1999 Mar
sat. GHI 2014 Dec
GHI maps • 1 long-term
average • 12 monthly clim.
av. • 16 annual
averages • 1 interannual var.
DNI maps • 1 long-term
average • 12 monthly clim.
av. • 16 annual
averages • 1 interannual var.
DHI maps • 1 long-term
average • 12 monthly clim.
av. • 16 annual
averages • 1 interannual var.

Map Making Methodology – processing steps
• Level 1 to L2: Checking quality (QC) of SRRA measurements • Level 2 to L3: Gap filling to minimize influence of gaps on
monthly averages from SRRA • Adjust 3TIER sat data layers by using half of the stations
for improvement • Validation by using the remaining 50+ stations
for independent proof of data quality
sat. DHI layer month sat. DHI layer month 2
sat. DHI layer month 3 sat. DHI layer month m
L1 data
base map-processing QC L2 data
base
DNI maps
station 1
station 2
station 3
station 121
sat-time-ser. st. 1
sat-time-ser. st. 2
sat-time-ser st115
sat. DNI layer month
sat. GHI layer month
sat. DNI layer month
sat. GHI layer month 2
sat. DNI layer month
sat. GHI layer month 3
sat. DNI layer month m
sat. GHI layer month m
GHI maps
GF L3 data
base
DIF maps
L4 GIS
layers

Map Making Methodology – processing steps
map-processing: geo-statistical adaption of
satellite data to measurements
monthly reports
L3 data
base
DNI maps: • 1 long-term average • 1 variability of long-term av. • 12 monthly clim. av. • 16 annual averages
sat-time-series st. 1
sat-time-series st. 2
sat-time-series st. 54
selection of 54 stations for inter-comparison and
adaption of satellite data to measurements
GHI maps: • 1 long-term average • 1 variability of long-term av. • 12 monthly clim. av. • 16 annual averages
L4 GIS layers monthly maps over 16 years
sat. GHI 1999 Jan
sat. GHI 1999 Feb
sat. GHI 1999 Mar
sat. GHI 2014 Dec
sat. DNI 1999 Jan
sat. DNI 1998 Feb
sat. DNI 1999 Mar
sat. DNI 2014 Dec
DHI maps: • 1 long-term average • 1 variability of long-term av. • 12 monthly clim. av. • 16 annual averages
sat. DHI 1999 Jan
sat. DHI 1999 Feb
sat. DHI 1999 Mar
sat. DHI 2014 Dec

Comparison GHI Direct normal DNI Diffuse DHI

Calibration lab
Calibration of solar instruments under commercial mode


Primary Sensors
The calibration laboratory has two no. of AWX-AHF and PMO6 CC sensors
These equipments are maintained in the laboratory for inter-comparison and calibration of the sensors used in the field stations.

Two Primary sets of Equipment at NIWE
To be calibrated at Davos (Switzerland) every 4 years
Two Secondary sets of Equipment at NIWE
To be calibrated at NIWE against the Primary
To be used to calibrate the individual measuring stations
every year
(only during clear sky conditions)
Calibration of measuring stations/
equipment


1. Solar Power Forecasting. 2. To validate ISRO Kalpana Satellite data
against SRRA ground measurements for the overlapping period from 2012.
3. Up gradation of solar atlas, development of value added products by applying ISRO’S Land Use Land Cover data.
4. To utilize ISRO data for gap filling of SRRA measurements.
Future Plan

THANK YOU