Insert Systems - Automotive tools, auto supplies and mechanics

PATH TO PURCHASE STUDY
73%SMARTPHONESUSED MORE TO
FIND ANDCONTACT
BUSINESSES
TABLETSUSED MORE FOR
RESEARCH – PRICECOMPARISONS,AND REVIEWS
Look for/use phone numbersto contact businesses
Look up a business locationor map/directions
UP TOUP TO
Of Smartphone & Tablet Users,Across Categories
84%
TOP 3 REASONS FOR ENGAGING WITH MOBILE ADS> LOCALLY RELEVANT
> LOCAL OFFERS COUPONS/PROMOTIONS
> FEATURES A KNOWN BRAND
OVER80%conversion rate forrestaurant searches
November 2012
Mobile Search Is Everywhere
Phone Numbers, Directions, Deals Are Critical Mobile Content
Restaurant Searchers Make Quick Purchase Decisions
Mobile Purchase Intent Is Strong
Conversion rates consistent across smartphones and tablets
Local Relevance Key To Mobile Path To Purchase
Smartphone68%
USERS MOSTLY USE THEIR DEVICE
WHEN THEY ARE ON THE GO
72%Tablet
USERS MOSTLY USE THEIR DEVICE
WHEN THEY ARE AT HOME
RESTAURANT SEARCHES: 64% OF SMARTPHONE AND 44% OF TABLET USERS WANT TO DECIDE WITHIN AN HOUR
Restaurants TravelAutomotive
Searches that result in Purchases
2 OUT OF 3CONSUMERS NOTICE MOBILE ADS
1 OUT OF 3RESULT IN AN AD CLICK
User Transaction Intent
85%
46%
51%
IMMEDIATE Users want to purchasewithin an hour
MIXED Both quick conversions & research
FUTURE Research based with longer termconversions
ON THE GOA CAR IS THE MOST
POPULAR ON THE GOLOCATION FOR
MOBILE SEARCHES
Source: xAd/Telmetrics Mobile Path to Purchase Study 2012. Visit mobilepathtopurchase.com for more info.
Intent to make purchase within the day
Restaurants Travel Automotive87% 49%33%
© xAd, Inc. | 1230 Avenue of the Americas | 7th Floor | New York, NY 10020 | P: 415-814-9837 | xAd.com© Telmetrics, Inc. | 2680 Skymark Avenue| Suite 900 | Mississauga, Ontario, Canada L4W 5L6 | P: 800.255.3224 | Telmetrics.com
IN PARTNERSHIP WITH:
The xAd/Telmetrics Mobile Path to Purchase Study
CONTENTS
1 EXECUTIVE SUMMARY
2 KEY FINDINGS
3 INTRODUCTION
4 REACHING AN INFREQUENT MOBILE USER
5 DEFINING THE MOBILE AUTO USER
6 MOBILE AUTO USER PROFILES
7 FOUR UNIQUE USERS. TWO UNIQUE OPPORTUNITIES.
8 STAGE IN DECISION
9 INFLUENCING THE AUTO USER WITHIN FEEDER CATEGORIES
10 THE RATE OF LOCATION
11 DRIVING MOBILE AUTO CONVERSION
14 SUMMARY
14 TERMINOLOGY
14 METHODOLOGY
15 ABOUT THE REPORT

The xAd/Telmetrics Mobile Path to Purchase Study
1
Mobile ad spending in the Automotive industry has increased nearly 375% from Q2 2011 to Q2 2012. Auto marketers are signing on in droves to test the marketplace and get to know their mobile users. But as the auto industry expands from online advertising into mobile, the call for relevant, locally targeted campaigns specific to consumer behaviors becomes necessity.
In our third installment of the xAd/Telmetrics Mobile Path to Purchase Study, we’ll dive deeper into the Automotive category to uncover mobile consumer behaviors and trends. A key finding is that Auto mobile user behavior is primarily driven by an intent to purchase either new or used vehicles or Auto parts and services, resulting in a variety of mobile usage patterns demonstrated by four distinct user profiles. Our goal is to better educate Auto marketers, allowing them to effectively reach a wide variety of consumers. And as the Auto category continues to increase its mobile spending, the findings of this report will serve as an essential foundation in mobile Automotive marketing for years to come.
EXECUTIVE SUMMARY
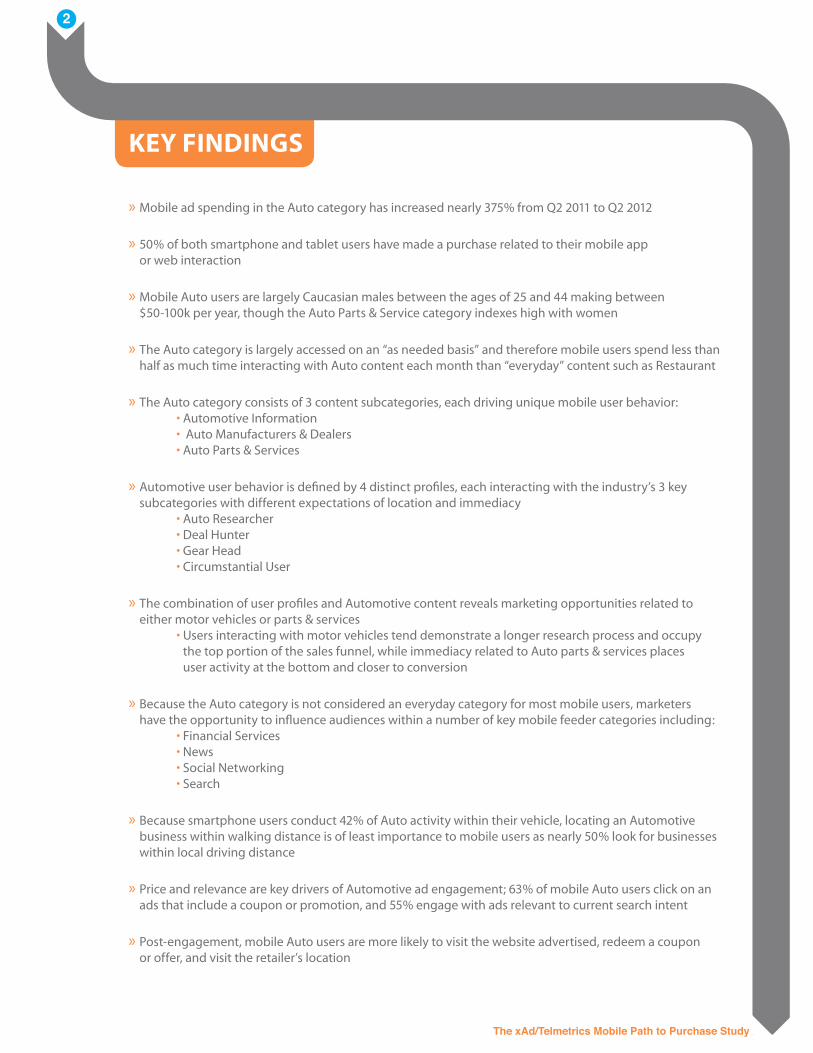
» Mobile ad spending in the Auto category has increased nearly 375% from Q2 2011 to Q2 2012
» 50% of both smartphone and tablet users have made a purchase related to their mobile app or web interaction
» Mobile Auto users are largely Caucasian males between the ages of 25 and 44 making between $50-100k per year, though the Auto Parts & Service category indexes high with women
» The Auto category is largely accessed on an “as needed basis” and therefore mobile users spend less than half as much time interacting with Auto content each month than “everyday” content such as Restaurant
» The Auto category consists of 3 content subcategories, each driving unique mobile user behavior: • Automotive Information • Auto Manufacturers & Dealers • Auto Parts & Services
» Automotive user behavior is defined by 4 distinct profiles, each interacting with the industry’s 3 key subcategories with different expectations of location and immediacy
• Auto Researcher • Deal Hunter • Gear Head • Circumstantial User
» The combination of user profiles and Automotive content reveals marketing opportunities related to either motor vehicles or parts & services
• Users interacting with motor vehicles tend demonstrate a longer research process and occupy the top portion of the sales funnel, while immediacy related to Auto parts & services places user activity at the bottom and closer to conversion
» Because the Auto category is not considered an everyday category for most mobile users, marketers have the opportunity to influence audiences within a number of key mobile feeder categories including:
• Financial Services • News • Social Networking • Search
» Because smartphone users conduct 42% of Auto activity within their vehicle, locating an Automotive business within walking distance is of least importance to mobile users as nearly 50% look for businesses within local driving distance
» Price and relevance are key drivers of Automotive ad engagement; 63% of mobile Auto users click on an ads that include a coupon or promotion, and 55% engage with ads relevant to current search intent
» Post-engagement, mobile Auto users are more likely to visit the website advertised, redeem a coupon or offer, and visit the retailer’s location
KEY FINDINGS
The xAd/Telmetrics Mobile Path to Purchase Study
2

xAd, and long-time partner Telmetrics, have collaborated with Nielsen to develop this first-to-market mobile behavior study that helps track the mobile consumer from initial purchase intent to conversion, while exploring ad effectiveness and examining the various profiles of mobile Auto users. This study combines online survey data from 1,500 U.S. tablet and smartphone users, as well as actual observed behaviors from Nielsen’s Smartphone Analytics Panel of 6,000 Apple and Android users – each group reporting they had engaged in activity related to Automotive information, products and services in the past 30 days.
In our two previously released reports focused on the Travel and Restaurant industries, we demonstrated just how different mobile users behave when using either a tablet or smartphone. The mobile user profiles identified in the Travel category revealed four distinct audiences ranging from the locally-minded traveler to the luxury oriented jet-setter. Our Restaurant study revealed three important profiles—those preferring take-out convenience, engaging in social feedback, or utilizing advanced “foodie” knowledge. For this third installment of the Study, Mobile Auto users fell into four key profiles – the Auto Researcher, Deal Hunter, Gear Head and Circumstantial User. These profiles are shaped by specific user intent and interactions with the Auto industry’s three content subcategories – Auto Information & Resources, Auto Manufacturers, and Auto Parts & Service. User interaction with Auto Resources and Auto Manufacturers are similar in that both provide information vital to the longer-tail research phase demonstrated in purchasing a motor vehicle. Auto Parts & Service users, on the other hand, tend to be a more motivated crowd driven by an immediate need. In this year’s final report, we’ll explore mobile Auto user behavior related to not only the different user profiles, but comparisons and analysis based on location access, immediacy of need and purchase intent in greater detail.
INTRODUCTION
The xAd/Telmetrics Mobile Path to Purchase Study
3
The xAd/Telmetrics Mobile Path to Purchase Study
4
REACHING AN INFREQUENT MOBILE USER
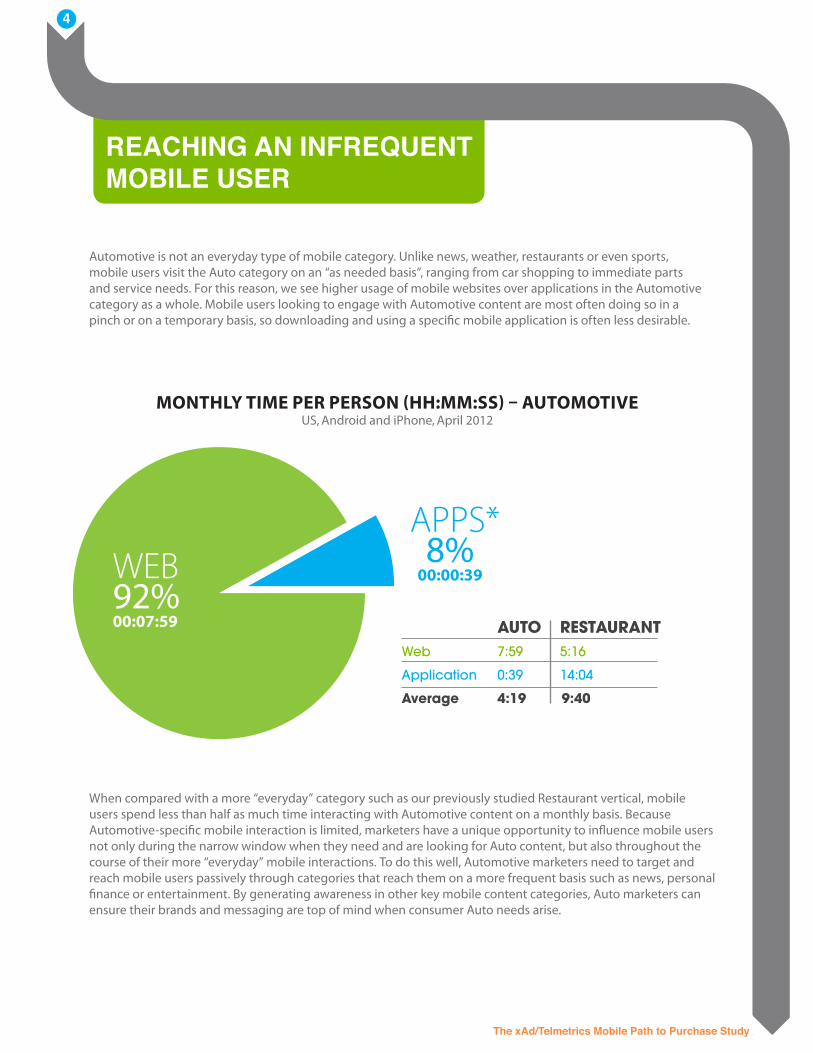
When compared with a more “everyday” category such as our previously studied Restaurant vertical, mobile users spend less than half as much time interacting with Automotive content on a monthly basis. Because Automotive-specific mobile interaction is limited, marketers have a unique opportunity to influence mobile users not only during the narrow window when they need and are looking for Auto content, but also throughout the course of their more “everyday” mobile interactions. To do this well, Automotive marketers need to target and reach mobile users passively through categories that reach them on a more frequent basis such as news, personal finance or entertainment. By generating awareness in other key mobile content categories, Auto marketers can ensure their brands and messaging are top of mind when consumer Auto needs arise.
Automotive is not an everyday type of mobile category. Unlike news, weather, restaurants or even sports, mobile users visit the Auto category on an “as needed basis”, ranging from car shopping to immediate parts and service needs. For this reason, we see higher usage of mobile websites over applications in the Automotive category as a whole. Mobile users looking to engage with Automotive content are most often doing so in a pinch or on a temporary basis, so downloading and using a specific mobile application is often less desirable.
MONTHLY TIME PER PERSON (HH:MM:SS) – AUTOMOTIVEUS, Android and iPhone, April 2012
WEB00:07:5992%
APPS*00:00:398%
AUTO RESTAURANTWeb 7:59 5:16
Application 0:39 14:04
Average 4:19 9:40
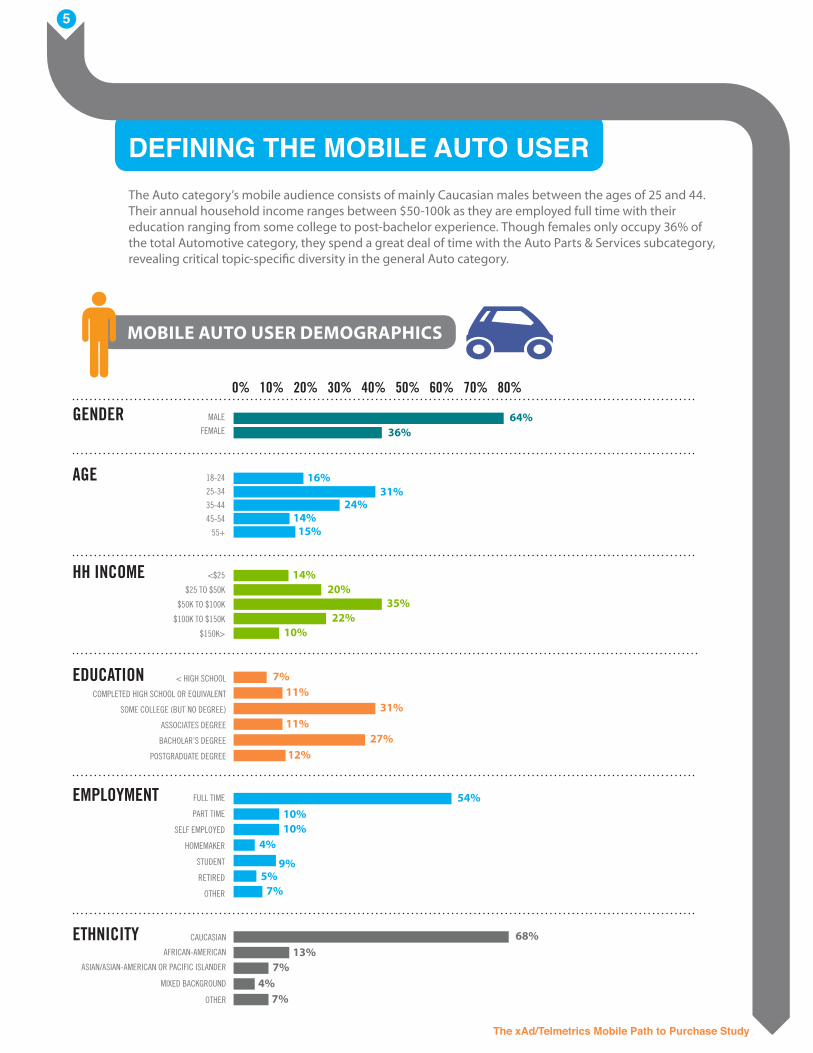
DEFINING THE MOBILE AUTO USER The Auto category’s mobile audience consists of mainly Caucasian males between the ages of 25 and 44. Their annual household income ranges between $50-100k as they are employed full time with their education ranging from some college to post-bachelor experience. Though females only occupy 36% of the total Automotive category, they spend a great deal of time with the Auto Parts & Services subcategory, revealing critical topic-specific diversity in the general Auto category.
MOBILE AUTO USER DEMOGRAPHICS
PATH TO PURCHASE STUDY
73%SMARTPHONESUSED MORE TO
FIND ANDCONTACT
BUSINESSES
TABLETSUSED MORE FOR
RESEARCH PRICECOMPARISONS,AND REVIEWS
Look for/use phone numbersto contact businesses
Look up a business locationor map/directions
UP TOUP TO
Of Smartphone & Tablet Users,Across Categories
84%
TOP 3 REASONS FOR ENGAGING WITH MOBILE ADS> LOCALLY RELEVANT
> LOCAL OFFERS COUPONS/PROMOTIONS
> FEATURES A KNOWN BRAND
OVER80%
conversion rate forrestaurant searches
AUGUST 2012
Mobile Search Is Everywhere
Phone Numbers, Directions, Deals Are Critical Mobile Content
Restaurant Searchers Make Quick Purchase Decisions
Mobile Purchase Intent Is Strong
Conversion rates consistent across smartphones and tablets
Local Relevance Key To Mobile Path To Purchase
Smartphone68%
USERS MOSTLY USE THEIR DEVICE
WHEN THEY ARE ON THE GO
72%Tablet
USERS MOSTLY USE THEIR DEVICE
WHEN THEY ARE AT HOME
RESTAURANT SEARCHES: 64% OF SMARTPHONE AND 44% OF TABLET USERS WANT TO DECIDE WITHIN AN HOUR
Restaurants TravelAutomotive
Searches that result in Purchases
2 OUT OF 3CONSUMERS NOTICE MOBILE ADS
1 OUT OF 3RESULT IN AN AD CLICK
User Transaction Intent
85%
46%
51%
IMMEDIATE Users want to purchasewithin an hour
MIXED Both quick conversions & research
FUTURE Research based with longer termconversions
ON THE GOA CAR IS THE MOST
POPULAR ON THE GOLOCATION FOR
MOBILE SEARCHES
Source: xAd/Telmetrics Mobile Path to Purchase Study 2012. Visit mobilepathtopurchase.com for more info.
Intent to make purchase within the day
Restaurants Travel Automotive87% 49%33%
0% 10% 20% 30% 40% 50% 60% 70% 80%
64%36%
GENDER MALE
FEMALE
16%31%
24%14%
15%
18-24
25-34
35-44
45-54
55+
AGE
14%20%
35%22%
10%
<$25
$25 TO $50K
$50K TO $100K
$100K TO $150K
$150K>
HH INCOME
7%11%
31%11%
27%12%
< HIGH SCHOOL
COMPLETED HIGH SCHOOL OR EQUIVALENT
SOME COLLEGE (BUT NO DEGREE)
ASSOCIATES DEGREE
BACHOLAR’S DEGREE
POSTGRADUATE DEGREE
EDUCATION
7%4%
7%13%
68%CAUCASIAN
AFRICAN-AMERICAN
ASIAN/ASIAN-AMERICAN OR PACIFIC ISLANDER
MIXED BACKGROUND
OTHER
ETHNICITY
54%
10%10%
9%
4%
5%7%
FULL TIME
PART TIME
SELF EMPLOYED
HOMEMAKER
STUDENT
RETIRED
OTHER
EMPLOYMENT
The xAd/Telmetrics Mobile Path to Purchase Study
5
MOBILE AUTO USER PROFILES
The xAd/Telmetrics Mobile Path to Purchase Study
6
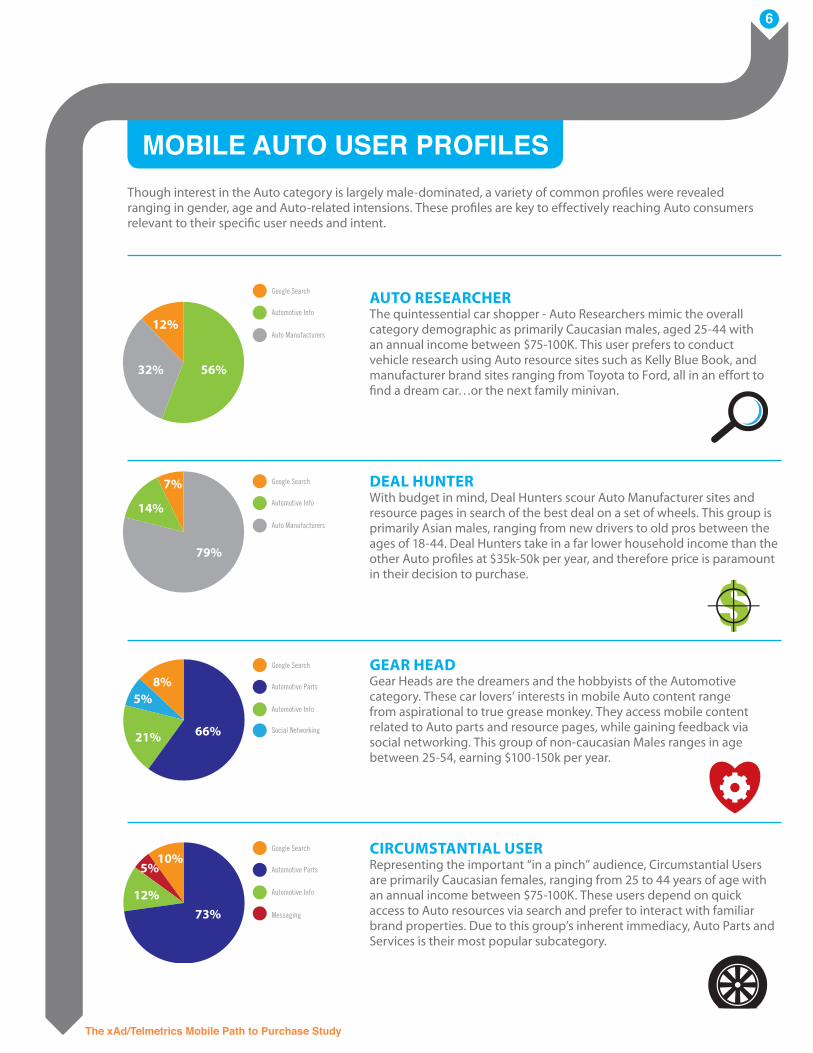
AUTO RESEARCHERThe quintessential car shopper - Auto Researchers mimic the overall category demographic as primarily Caucasian males, aged 25-44 with an annual income between $75-100K. This user prefers to conduct vehicle research using Auto resource sites such as Kelly Blue Book, and manufacturer brand sites ranging from Toyota to Ford, all in an effort to find a dream car…or the next family minivan.
DEAL HUNTERWith budget in mind, Deal Hunters scour Auto Manufacturer sites and resource pages in search of the best deal on a set of wheels. This group is primarily Asian males, ranging from new drivers to old pros between the ages of 18-44. Deal Hunters take in a far lower household income than the other Auto profiles at $35k-50k per year, and therefore price is paramount in their decision to purchase.
GEAR HEADGear Heads are the dreamers and the hobbyists of the Automotive category. These car lovers’ interests in mobile Auto content range from aspirational to true grease monkey. They access mobile content related to Auto parts and resource pages, while gaining feedback via social networking. This group of non-caucasian Males ranges in age between 25-54, earning $100-150k per year.
CIRCUMSTANTIAL USERRepresenting the important “in a pinch” audience, Circumstantial Users are primarily Caucasian females, ranging from 25 to 44 years of age with an annual income between $75-100K. These users depend on quick access to Auto resources via search and prefer to interact with familiar brand properties. Due to this group’s inherent immediacy, Auto Parts and Services is their most popular subcategory.
66%21%
5%8%
Google Search
Automotive Info
Auto Manufacturers
Google Search
Automotive Info
Auto Manufacturers
Google Search
Automotive Parts
Automotive Info
Social Networking
73%12%
5%10%
Google Search
Automotive Parts
Automotive Info
Messaging
56%32%
14%
79%
7%
12%
66%21%
5%8%
Google Search
Automotive Info
Auto Manufacturers
Google Search
Automotive Info
Auto Manufacturers
Google Search
Automotive Parts
Automotive Info
Social Networking
73%12%
5%10%
Google Search
Automotive Parts
Automotive Info
Messaging
56%32%
14%
79%
7%
12%
66%21%
5%8%
Google Search
Automotive Info
Auto Manufacturers
Google Search
Automotive Info
Auto Manufacturers
Google Search
Automotive Parts
Automotive Info
Social Networking
73%12%
5%10%
Google Search
Automotive Parts
Automotive Info
Messaging
56%32%
14%
79%
7%
12%
66%21%
5%8%
Google Search
Automotive Info
Auto Manufacturers
Google Search
Automotive Info
Auto Manufacturers
Google Search
Automotive Parts
Automotive Info
Social Networking
73%12%
5%10%
Google Search
Automotive Parts
Automotive Info
Messaging
56%32%
14%
79%
7%
12%
Though interest in the Auto category is largely male-dominated, a variety of common profiles were revealed ranging in gender, age and Auto-related intensions. These profiles are key to effectively reaching Auto consumers relevant to their specific user needs and intent.
PATH
TO
PURC
HASE
Mobile Auto Users Search On An As Needed Basis
Mobile Web Dominates Apps For Mobile Auto Search
Auto Searching At Home And On The Go
Top 3 Reasons Auto Users Click On Mobile Ads
Strong Conversions, Smartphone Users Have More Immediate Intent
Auto Searchers Conduct Mix Of Research & Conversion Activities
PROXIMITY, RIGHT FIT AND PRICEARE KEY DRIVERS FOR AUTO PURCHASERS
AUTOMOTIVE
Source: xAd/Telmetrics Mobile Path to Purchase Study 2012. Visit mobilepathtopurchase.com for more info.
92%of time spent on autosearches is done on
mobile websites
NEARLY 50% OF MOBILE AUTO USERS LOOKTO MAKE A PURCHASE WITHIN A DAY.
49% OF USERS SEARCH FOR AUTO LOCATIONS WITHIN LOCAL DRIVING DISTANCE
AUTO RESEARCHER> Caucasian male, 25-44> Income: $75-100K> Prefers Auto resource and brand sites
OF SMARTPHONE
USERS SEARCH
BASED ON:
32%OF TABLET
USERS SEARCH
BASED ON:
44%
<1% OF MOBILE AUTOUSERS USE APPS
DEAL HUNTER> Asian male, 18-44> Income: $35-50k> Relies on brand sites and search
CIRCUMSTANTIAL USER> Caucasian female, 25-44> Income: $75-100K> Depends on quick auto info via search & familiar brands
Only 15%of mobile searchers
conduct monthlyauto searches
GEAR HEAD> African-American male, 25-54> Income: $100-150k> Accesses auto hobby info frequently
73%OF TABLET USERS
SEARCHING AT HOME
66%OF SMARTPHONE USERS
SEARCH ON THE GO
LOOK UP BUSINESSLOCATION
44%PRICE
COMPARISONS
43%LOOK UP PHONE
NUMBERS TOCONTACT BUSINESS
36%TOP MOBILE AUTO SEARCH ACTIVITIES
TABLET USERS ARE NEARLY 3X MORE LIKELY TO BEINFLUENCED BY GOOD REVIEWS THAN SMARTPHONE USERS
LOCALLY RELEVANT OFFERS TARGETED TO SEARCH FAMILIAR BRAND
36% OF SMARTPHONEUSERS CONVERT
WITHIN THE HOUR
ONLY 15% OFTABLET USERS LOOKTO TRANSACT WITHIN
THE HOUR.
STUDY REVEALS DUAL AUDIENCE: CAR SHOPPERS& AUTO SERVICE/PARTS BUYERS, WITH 4 UNIQUE USER PROFILES
FAMILIAR BRANDS
Auto Resource properties (e.g. Kelly
Blue Book) have highest combined
web-app reach
ONLY 1 OUT OF 3mobile auto users know exactly
what they’re looking for
OF SMARTPHONEUSERS SEARCHIN THEIR CAR
42%
TABLET
REVIEWS37%
PROMOTIONS37%
TABLET USERS SPEND MORETIME RESEARCHING REVIEWS
AND PROMOTIONS
SMARTPHONE
REVIEWS22%
PROMOTIONS24%
OF MOBILE AUTO SEARCHESLEAD TO A PURCHASE
>50%

In order to better understand the behaviors of our four Auto user profiles, we need to align their behaviors with the three content subcategories available in Automotive: General Automotive Information, Auto Manufacturers & Dealers, and Auto Parts & Services. Though there are three content areas in the Automotive category, our analysis revealed that mobile user behavior is driven by an intent to purchase either new or use vehicles or Auto parts and service.
The Automotive Info subcategory is full of resource-related properties including Kelley Blue Book, Edmunds and AutoTrader.com where Auto enthusiasts and shoppers go for info related to their hobbies and future purchases. Used frequently by all four identified mobile Auto user profiles, these resources are the basis for their Auto-related mobile interactions and remain popular in their desktop form as well. Because the information provided in this subcategory is an essential part of any Auto research function—whether there is an immediate need or more leisurely activity—we see a high percentage of use with the Auto Researcher, Gear Head, and Circumstantial User.
Engagement with the Auto Manufacturers & Dealers subcategory of properties reveals similar research-focused user behavior. Current car owners or shoppers interact with brand and local dealer-specific content including car giants such as Ford, Toyota, and Chevy. These users are either brand loyalists or have done their homework within the Auto Info subcategory and are now narrowing their search to specific brands. This subcategory is essential to the Auto Researcher as well as the Deal Hunter, who spends almost 80% of their Auto-related time interacting with various brands and dealerships via their mobile device. While interaction within this subcategory is still within the top portion of the purchase funnel, there is clear movement toward Auto-related purchases.
Mobile user interaction with the Auto Parts & Services subcategory is split between hobbyists and users demonstrating a much more immediate need. Circumstantial Users accessing Auto Parts and & Services content are usually reacting to vehicle malfunction or incident such as a car stalling, flat tire, or the need for an oil change. Due to the nature of the products and services involved in the subcategory, Circumstantial User purchase intent is much stronger and conducted within a much shorter timeframe. Therefore, by the time these users are in a pinch, it may be too late to reach them with a marketing message. As such, Auto marketers looking to connect with this audience must do so as they interact with everyday mobile content, as previously mentioned. As for the Gear Head, this group spends 66% of their time in the Auto category focused on Parts & Services. They are clearly Auto enthusiasts searching for vintage or luxury parts, sleek body kits, and local shops to upgrade their rides. Auto marketers have much more time to reach this group directly and affect their purchase decisions as they are the one group that demonstrates an inclusion of Auto content in their everyday activities.
The opportunity for marketers within these three subcategories lies in their ability to develop campaigns specific to each Auto User profile as well as user purchase motivations. Due to the variety of targeting combinations available in the Auto category as a whole, a broad one-size fits all approach to targeting would prove not only ineffective, but wasteful.
The xAd/Telmetrics Mobile Path to Purchase Study
7
COMBINED WEB-APP REACH % BY SUB-CATEGORY – AUTOMOTIVEUS, Android and iPhone Monthly Reach, April 2012
Kelley Blue BookAutoguide.com
EdmundsSIM AutomotiveAutoTrader.com
Yahoo! Auto
FordToyotaHonda
ChevroletInfinitiJeep
AutoZoneAdvanceautoparts.comAuto Parts Warehouse
O’Reilly Auto PartsTirerack.com
Pep Boys
Automotive Info Auto Manufacturers Auto Parts & Services
8.3%4.0% 3.0%
FOUR DISTINCT USERS. TWO UNIQUE OPPORTUNITIES.

Due to the split nature of the Auto category, mobile users’ stage in the purchase decision making process is an important factor to incorporate when planning a successful campaign. During the Study, we found that whether user activity occupied the top or bottom end of the purchase funnel, over one-third of mobile Auto users knew exactly what they were looking for, and 36% had a general idea during their decision-making process. This means that brand familiarity plays a key role in affecting the mobile path to purchase in the Auto category.
8
The xAd/Telmetrics Mobile Path to Purchase Study
STAGE IN DECISION
AUTO USER STAGE IN DECISION WHEN FIRST ACCESSING APP/WEBSITE BY DEVICE
Not sure/Don’t remember
I knew exactly what I was looking for I had narrowed down what I was looking for
I had a general idea of what I was looking for
I wasn’t looking for a specific brand, just browsing
I had no idea what I was looking for
20%
4%
0
20
40
60
80
100
0
20
40
60
80
100
18%
32%
6%
38%
4%2% 1%
3%
Smartphone
32%
40%
Tablet

Because mobile Auto users enter the path to purchase as a more informed group, it’s important for Auto marketers to influence and engage users in a more passive way, while they are active with a variety of mobile categories used on a more regular basis. Financial Services, News, Social Media, and Local Directories are all high frequency categories that are not only effective in user reach but also in targeting the (4) distinct mobile Auto sub-audiences as previously defined. Below are examples of top “feeder categories” that index high with each of the defined mobile Auto user profiles.
But from what we’ve learned about the four Auto user profiles, there are distinct feeder markets that translate best for each. Each of these categories represents an important platform from which Auto marketers can effectively reach each of the key mobile user profiles.
The xAd/Telmetrics Mobile Path to Purchase Study
9
INFLUENCING THE AUTO USER WITHIN FEEDER CATEGORIES
OVERALL MOBILE AUTO USER FEEDER CATEGORIES by index
SOCIAL NETWORKING, CHAT, BLOG
DIRECTORIES ENTERTAINMENT/LIFESTYLES
FINANCIALSERVICES
NEWS RETAIL/E-COMMERCE
SEARCH
150 143127
176 167
138 144
AUTO RESEARCHER
GEAR HEAD
DEAL HUNTER
CIRCUMSTANTIAL USER
255
159
236
118
246
97
246
112
375
124
260
141
216
108
FINANCIAL SERVICES
SEARCH
WEATHER
SOCIAL NETWORKING, CHAT, BLOG
RETAIL/E-COMMERCE
DIRECTORES
ENTERTAINMENT/LIFESTYLES
FINANCIAL SERVICES
ENTERTAINMENT/LIFESTYLES
WEATHER
SEARCH
SOCIAL NETWORKING, CHAT, BLOG
RETAIL/E-COMMERCE
DIRECTORES
FINANCIAL SERVICES
WEATHER
SEARCH
DIRECTORES
ENTERTAINMENT/LIFESTYLES
SOCIAL NETWORKING, CHAT, BLOG
RETAIL/E-COMMERCE
SEARCH
WEATHER
FINANCIAL SERVICES
SOCIAL NETWORKING, CHAT, BLOG
ENTERTAINMENT/LIFESTYLES
RETAIL/E-COMMERCE
DIRECTORES
213
184
180
158
231
211
183
612
602
499
705
710
651
591
Source: comScore MobiLens Audience Profile, August 2012

THE ROLE OF LOCATION IN THE MOBILE AUTO PATH TO PURCHASELOCATION OF USEAs seen in other categories, tablet access to Auto related content is typically conducted from home, whereas smartphone usage is more frequently on the go. Aligning with the urgent nature of some of the category users’ needs (Circumstantial Users or those looking to make a purchase within the day), over 40% of Smartphone usage is actually conducted while in a car.
EXPECTATION OF DISTANCE Mobile Auto users’ expectations of distance also mimics the context of the category with more than half of both smartphone and tablet users looking to engage offline with Auto businesses within local driving distance.
10
The xAd/Telmetrics Mobile Path to Purchase Study
Home Work OtherOutside Car
0
20
40
60
80
100
0
20
40
60
80
100
5%
11%
34%
42%
8%
4%9%
73%
8%6%
SMA
RTPHO
NE
TABLET
Within walking distance
Within a farther driving distance
Within local driving distance
No expectation of distance
0
20
40
60
80
100
0
20
40
60
80
100
48%
5%
23%
24%
49%
7%
21%
23%
SMA
RTPHO
NE
TABLET
AUTO USER LOCATION DURING USE OF APP/WEBSITE BY DEVICE
EXPECTATION OF LOCATION WHEN LOOKING FOR INFORMATION BY DEVICE
SMA
RTPH
ON
ESM
ART
PHO
NE
TAB
LET
TAB
LET
The xAd/Telmetrics Mobile Path to Purchase Study
11
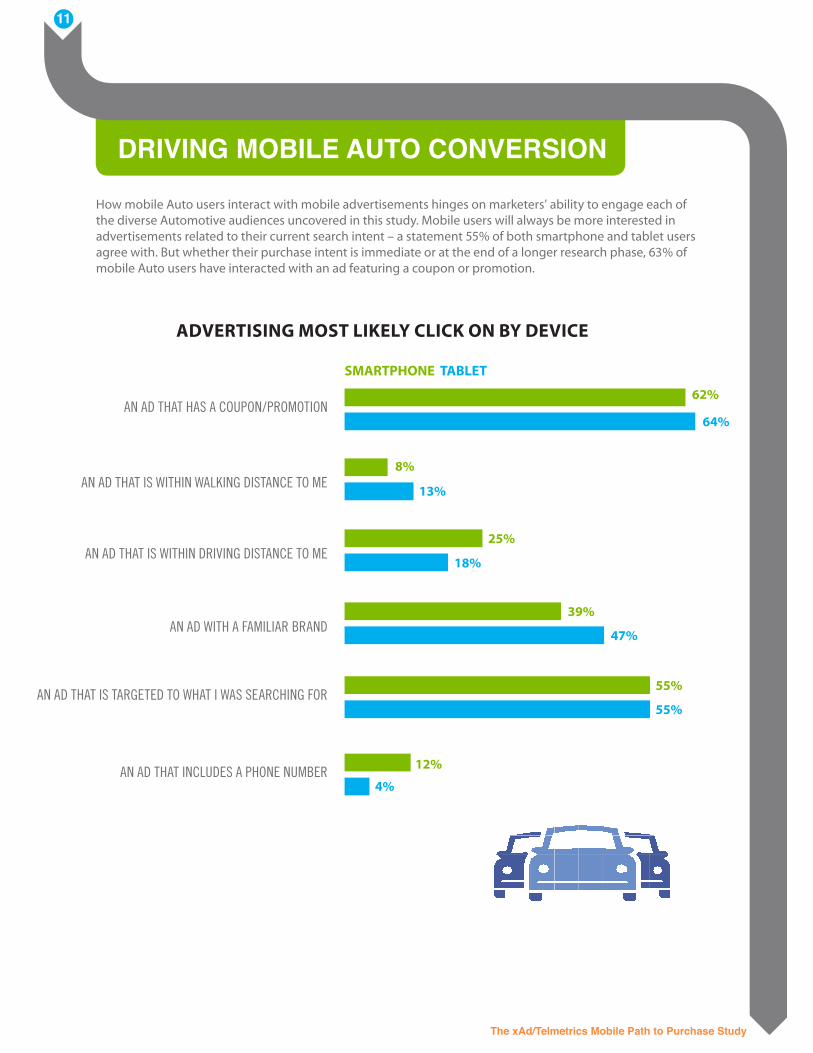
How mobile Auto users interact with mobile advertisements hinges on marketers’ ability to engage each of the diverse Automotive audiences uncovered in this study. Mobile users will always be more interested in advertisements related to their current search intent – a statement 55% of both smartphone and tablet users agree with. But whether their purchase intent is immediate or at the end of a longer research phase, 63% of mobile Auto users have interacted with an ad featuring a coupon or promotion.
DRIVING MOBILE AUTO CONVERSION
SMARTPHONE TABLET
ADVERTISING MOST LIKELY CLICK ON BY DEVICE
62%
8%
25%
39%
55%
12%
64%
13%
18%
47%
55%
4%
AN AD THAT HAS A COUPON/PROMOTION
AN AD THAT IS WITHIN WALKING DISTANCE TO ME
AN AD THAT IS WITHIN DRIVING DISTANCE TO ME
AN AD WITH A FAMILIAR BRAND
AN AD THAT IS TARGETED TO WHAT I WAS SEARCHING FOR
AN AD THAT INCLUDES A PHONE NUMBER

12
The xAd/Telmetrics Mobile Path to Purchase Study
Though we’ve seen that both tablet and smartphone users are active when it comes to initial ad engagement.User preferences by device ultimately affect the way an Auto-related purchase is completed. Smartphone users are 5% more likely to engage with Auto coupons than tablet users, and from there, smartphone users are also more likely to make an Auto purchase directly related to their ad engagement. Again demonstrating an overall longer path to purchase, tablet users are 6% more likely to search even further online for information related to an Auto advertisement.
MADE A PURCHASE RELATED TO VISIT ON APP/WEBSITE BY DEVICE
Regarding purchase activity, 50% of both smartphone and tablet users have made a purchase related to their mobile app or website interaction. This means that whether the Auto purchase reflects an immediate need, or it’s based on months of research, mobile Auto users are converting.
52%49%
yesno
48%51%
ACTIVITIES CONDUCTED AFTER ENCOUNTERING AN AUTO AD BY DEVICESMARTPHONE TABLET
11%
7%
12%
5%
4%
3%
7%
3%
6%
1%
13%
9%
7%
3%
5%
3%
8%
2%
12%
0%
I VISITED THE SITE THAT WAS ADVERTISED
I CONSIDERED BUYING THE ADVERTISED PRODUCT/SERVICE
I UTILIZED A COUPON/OFFER
I MADE A PURCHASE ON MY MOBILE DEVICE RELATED TO THE PRODUCT/SERVICE
I MADE A PURCHASE ON A DESKTOP/LAPTOP COMPUTER RELATED TO THE PRODUCT/SERVICE
I MADE A PURCHASE IN THE STORE RELATED THE PRODUCT/SERVICE
I VISITED THE RETAILER THAT WAS ADVERTISED
I ENTERED A CONTEST OR SWEEPSTAKES
I LOOKED ONLINE FOR MORE INFORMATION ABOUT THE ADVERTISED
I CALLED THE BUSINESS ADVERTISED
SMA
RTPH
ON
E
TABL
ET

The xAd/Telmetrics Mobile Path to Purchase Study
13
How can Auto marketers capture a greater portion of mobile conversions? By giving mobile Auto users targeted and timely information that provides them with real value throughout their Automotive-focused interaction. For mobile Auto users, this means clear communication of location and price, as well as ad targeting based on user search intent.
REASONS FOR MAKING AUTO-RELATED PURCHASE AFTER VISITING APP/WEBSITE BY DEVICE (TOP 3)
67%
65%
SMARTPHONE TABLET
68%
62%
37%
23%
15%
10%
8%
6%
53%
62%
36%
19%
16%
28%
6%
11%
CLOSE TO MY LOCATION
FIT WHAT I WAS LOOKING FOR
RIGHT PRICE
BUSINESS HAD AVAILABLE TIME
HAD COUPON/GIFT CARD/CREDIT
FOUND DEAL THAT NEEDED IMMEDIATE ACTION
GOOD REVIEWS
MADE IMPULSE DECISION
RECOMMENDED BY FRIEND/FAMILY MEMBER

14
The xAd/Telmetrics Mobile Path to Purchase Study
SUMMARYAs the final category researched in our Mobile Path to Purchase study this year, Automotive did not disappoint. The Auto category is split between interaction at both the top and bottom of the sales funnel, while Travel remained largely at the top and Restaurant user immediacy placed the category at the bottom. We found that mobile Auto users occupy four distinct user profiles, each behaving differently as they interact with either vehicle information or parts and service related subcategories. Needless to say this is not a one-size fits all category – not across device, and certainly not between subcategories.. But by taking into consideration each unique user profile, ad context, location, and user sense of immediacy, Auto marketers can effectively reach their mobile audiences – propelling mobile branding efforts to the next level.
STUDY METHODOLOGYThe xAd/Telmetrics Mobile Path to Purchase Study was conducted in conjunction with Nielsen. The results are based on data from an online survey of 1,500 U.S. smartphone and tablet users, as well as actual observed consumer behaviors from Nielsen’s Smartphone Analytics Panel of 6,000 Apple and Android users. Data from Nielsen’s Smartphone Analytics panel is included to supplement the survey results. Survey respondent totals are as follows (none of which are mutually exclusive): • Smartphone owners: 1,371 • Tablet owners: 738 • Restaurant users: 1,413 • Travel users: 931 • Automotive users: 674
TERMINOLOGYMobile Application/App: mobile content portal which does not require access via a mobile browser, though does still require internet access to reach.
Mobile Website/WAP: mobile content source accessible via a mobile browser such as Google or Safari, which requires internet access to reach. Desktop-accessible websites visited with a smartphone are then called mobile websites.
Mobile Property: for the sake of this report, this refers to a combination of both applications and mobile websites - as many large brands and businesses often have both available to consumers.
Local Directory Application/App: mobile content portal where users can search for businesses and information regarding a specific location. These include Yodle, Superpages, and the like.
Local Directory Website: mobile content source where users can search for businesses and information regarding a specific location, reachable via a mobile browser. These include Yellowpages.com, Local.Yahoo.com or the like.

The xAd/Telmetrics Mobile Path to Purchase Study
15
ABOUT THIS REPORT xAd and long-time partner Telmetrics joined to produce this proprietary study designed to better understand mobile activity among Travel, Restaurant, and Automotive users with the goal of more effectively reaching these industry consumers with mobile search and display advertising. This third installment from this multi-category research project, it focuses on mobile user behavior related to the Auto category.
Additional study details and findings can be found at www.MobilePathtoPurchase.com. For questions or to provide feedback, please contact us at 415.814.9837 or [email protected].
ABOUT XAD Since 2009, xAd has grown to become one of the largest mobile advertising networks in the U.S. and the only one offering the ability to target ads using a combination of accurate location signal and search context. Across its network, xAd aggregates and manages billions of monthly ad impressions from which it derives the largest supply of location based advertising inventory in the market. For over a million national and local advertisers, xAd delivers targeted mobile location@scale.
xAd is based in New York City with several satellite offices across the U.S and Internationally. For more information, visit xAd.com.
ABOUT TELMETRICSFor more than 20 years, Telmetrics has been the call measurement industry leader. Telmetrics’ call tracking solutions, which are available in North America and across Europe, enable marketers to evaluate consumer phone response to ads by providing valuable ad feedback and consumer call intelligence. With greater visibility into advertising performance across all media channels—digital, mobile, print and more—media publishers, agencies and advertisers can optimize the media mix for higher quality lead generation, resulting in increased revenues and a more complete picture of ROI across converging media. For more information, visit Telmetrics.com.
ABOUT NIELSENNielsen Holdings N.V. (NYSE: NLSN) is a global information and measurement company with leading market positions in marketing and consumer information, television and other media measurement, online intelligence, mobile measurement, trade shows and related properties. Nielsen has a presence in approximately 100 countries, with headquarters in New York, USA and Diemen, the Netherlands.