AUTOMOTIVE SOLUTIONS New auto sales are expected to jump 6.6% this year and will reach 16.2M units...
14
AUTOMOTIVE SOLUTIONS New auto sales are expected to jump 6.6% this year and will reach 16.2M units by 2015 AUTOMOTIVE INTENDERS 2014 DIGITAL EXTENSION ALLOCATION PROFILE • 62% of new vehicle registrations are A50+ • Older consumers are buying more cars as boomers try to retain their youth • 56% of consumers who visit automotive sites are A35-64 HABITS • 1 in 3 consumers who visited a dealer site purchased a vehicle • 3 in 5 will abandon a brand because of a poor online experience • 63% watched online videos as a part of the purchase experience • 81% decide on a vehicle within 3 months TRENDS • Brand loyalty in the auto industry is about 48%, ie., half of any OEM’s consumer base will defect to another brand • Millennials are driving less (about 23% fewer miles) and opting for alternative methods of getting around • 41 new vehicle launches are set for 2014, meaning more options for consumers • Consumers will now use 18+ digital sources (social media, manufacturer sites, auto content sites, mobile apps) before even getting to the dealership Mobile 48% Desktop 31% Video 21% *Local auto dealers in the US are diversifying their digital marketing budgets to stay in front of a multi- screen audience. *Leading the growth in Tier 3 digital marketing budgets is mobile – which has experienced a threefold increase from the first 6 months of 2013 compared to the same time period this year!
-
Upload
cornelia-andra-hines -
Category
Documents
-
view
213 -
download
0
Transcript of AUTOMOTIVE SOLUTIONS New auto sales are expected to jump 6.6% this year and will reach 16.2M units...

AUTOMOTIVE SOLUTIONSNew auto sales are expected to jump 6.6% this
year and will reach 16.2M units by 2015
AUTOMOTIVE INTENDERS
2014 DIGITAL EXTENSION ALLOCATION
PROFILE
• 62% of new vehicle registrations are A50+
• Older consumers are buying more cars as boomers try to retain their youth
• 56% of consumers who visit automotive sites are A35-64
HABITS • 1 in 3 consumers who visited a dealer site purchased a
vehicle
• 3 in 5 will abandon a brand because of a poor online experience
• 63% watched online videos as a part of the purchase experience
• 81% decide on a vehicle within 3 months
TRENDS
• Brand loyalty in the auto industry is about 48%, ie., half of any OEM’s consumer base will defect to another brand
• Millennials are driving less (about 23% fewer miles) and opting for alternative methods of getting around
• 41 new vehicle launches are set for 2014, meaning more options for consumers
• Consumers will now use 18+ digital sources (social media, manufacturer sites, auto content sites, mobile apps) before even getting to the dealership
Mobile48%
Desktop31%
Video21%
*Local auto dealers in the US are diversifying their digital marketing budgets to stay in front of a multi-screen audience.
*Leading the growth in Tier 3 digital marketing budgets is mobile – which has experienced a threefold increase from the first 6 months of 2013 compared to the same time period this year!
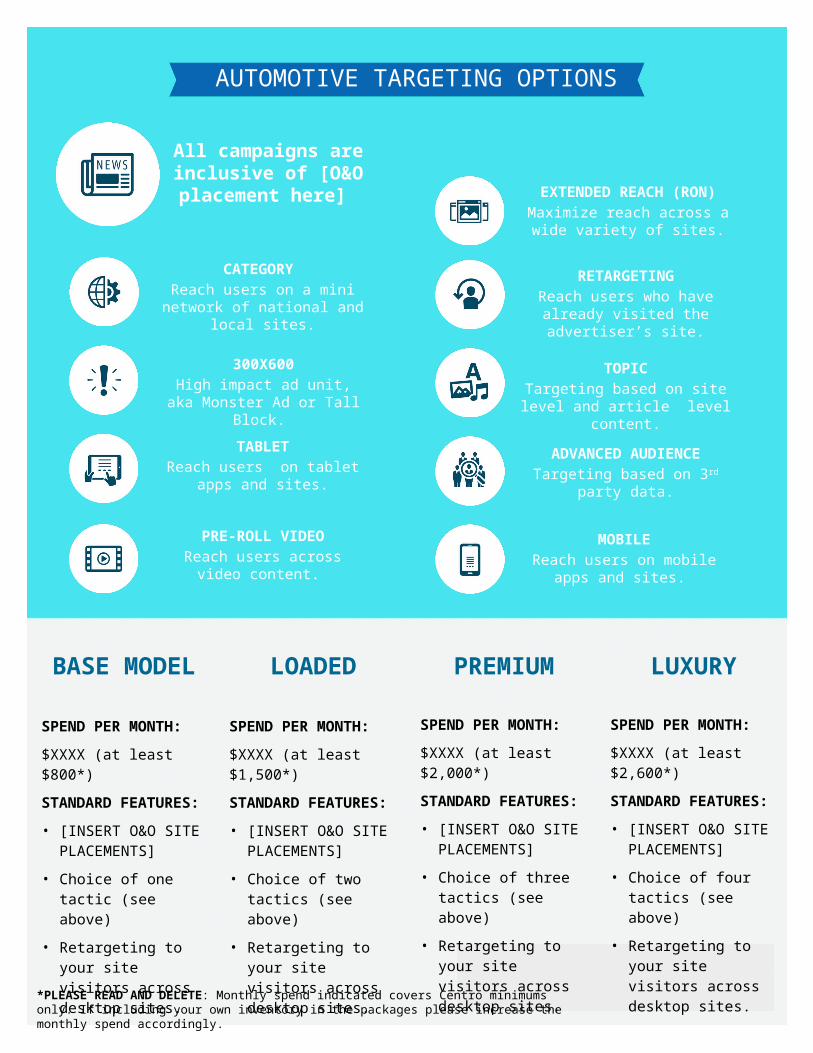
AUTOMOTIVE TARGETING OPTIONS
All campaigns are inclusive of [O&O placement here]
BASE MODEL
SPEND PER MONTH:
$XXXX (at least $800*)
STANDARD FEATURES:
• [INSERT O&O SITE PLACEMENTS]
• Choice of one tactic (see above)
• Retargeting to your site visitors across desktop sites.
LOADED
SPEND PER MONTH:
$XXXX (at least $1,500*)
STANDARD FEATURES:
• [INSERT O&O SITE PLACEMENTS]
• Choice of two tactics (see above)
• Retargeting to your site visitors across desktop sites.
PREMIUM
SPEND PER MONTH:
$XXXX (at least $2,000*)
STANDARD FEATURES:
• [INSERT O&O SITE PLACEMENTS]
• Choice of three tactics (see above)
• Retargeting to your site visitors across desktop sites.
RETARGETINGReach users who have
already visited the advertiser’s site.
ADVANCED AUDIENCETargeting based on 3rd party
data.
MOBILEReach users on mobile apps
and sites.
CATEGORY Reach users on a mini
network of national and local sites.
TOPICTargeting based on site level
and article level content.
PRE-ROLL VIDEOReach users across video
content.
EXTENDED REACH (RON)Maximize reach across a
wide variety of sites.
300X600High impact ad unit, aka Monster Ad or Tall Block.
TABLETReach users on tablet apps
and sites.
LUXURY
SPEND PER MONTH:
$XXXX (at least $2,600*)
STANDARD FEATURES:
• [INSERT O&O SITE PLACEMENTS]
• Choice of four tactics (see above)
• Retargeting to your site visitors across desktop sites.
*PLEASE READ AND DELETE: Monthly spend indicated covers Centro minimums only. If including your own inventory in the packages please increase the monthly spend accordingly.
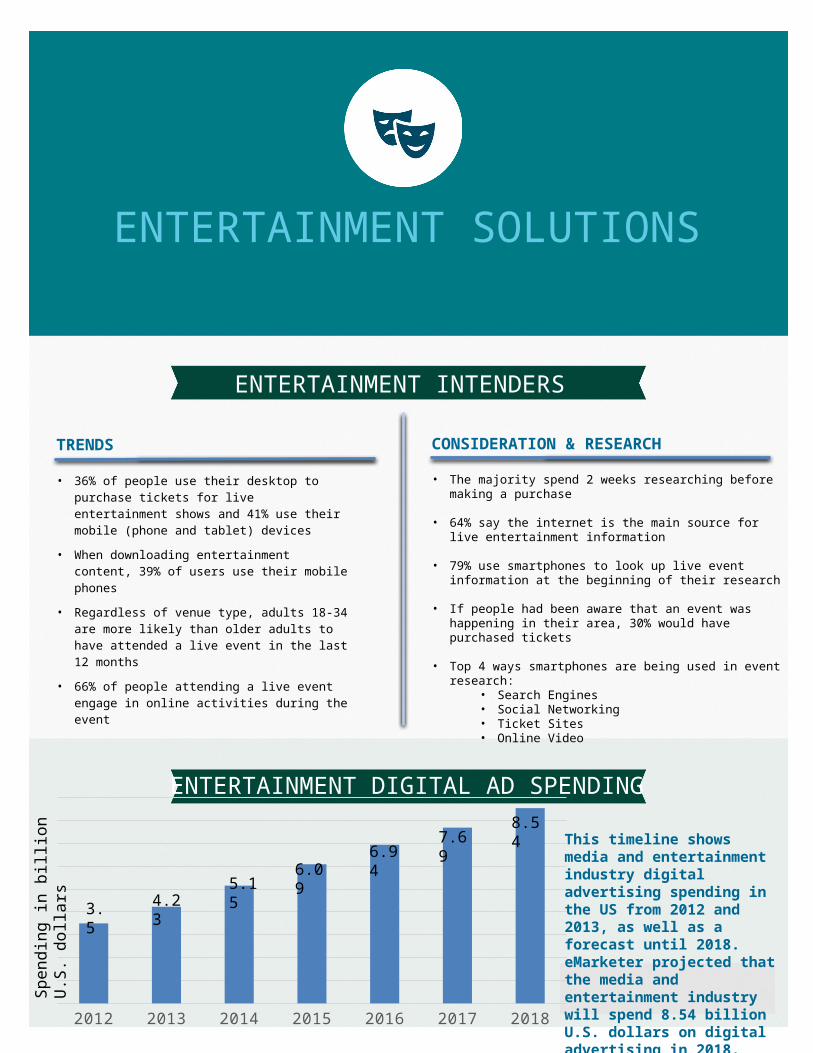
ENTERTAINMENT SOLUTIONS
ENTERTAINMENT INTENDERS
ENTERTAINMENT DIGITAL AD SPENDING
CONSIDERATION & RESEARCH
• The majority spend 2 weeks researching before making a purchase
• 64% say the internet is the main source for live entertainment information
• 79% use smartphones to look up live event information at the beginning of their research
• If people had been aware that an event was happening in their area, 30% would have purchased tickets
• Top 4 ways smartphones are being used in event research:
• Search Engines• Social Networking • Ticket Sites• Online Video
TRENDS
• 36% of people use their desktop to purchase tickets for live entertainment shows and 41% use their mobile (phone and tablet) devices
• When downloading entertainment content, 39% of users use their mobile phones
• Regardless of venue type, adults 18-34 are more likely than older adults to have attended a live event in the last 12 months
• 66% of people attending a live event engage in online activities during the event
2012 2013 2014 2015 2016 2017 2018
Spen
ding
in b
illio
n U
.S. d
olla
rs
3.5 4.235.15
6.096.94
7.698.54
This timeline shows media and entertainment industry digital advertising spending in the US from 2012 and 2013, as well as a forecast until 2018. eMarketer projected that the media and entertainment industry will spend 8.54 billion U.S. dollars on digital advertising in 2018.
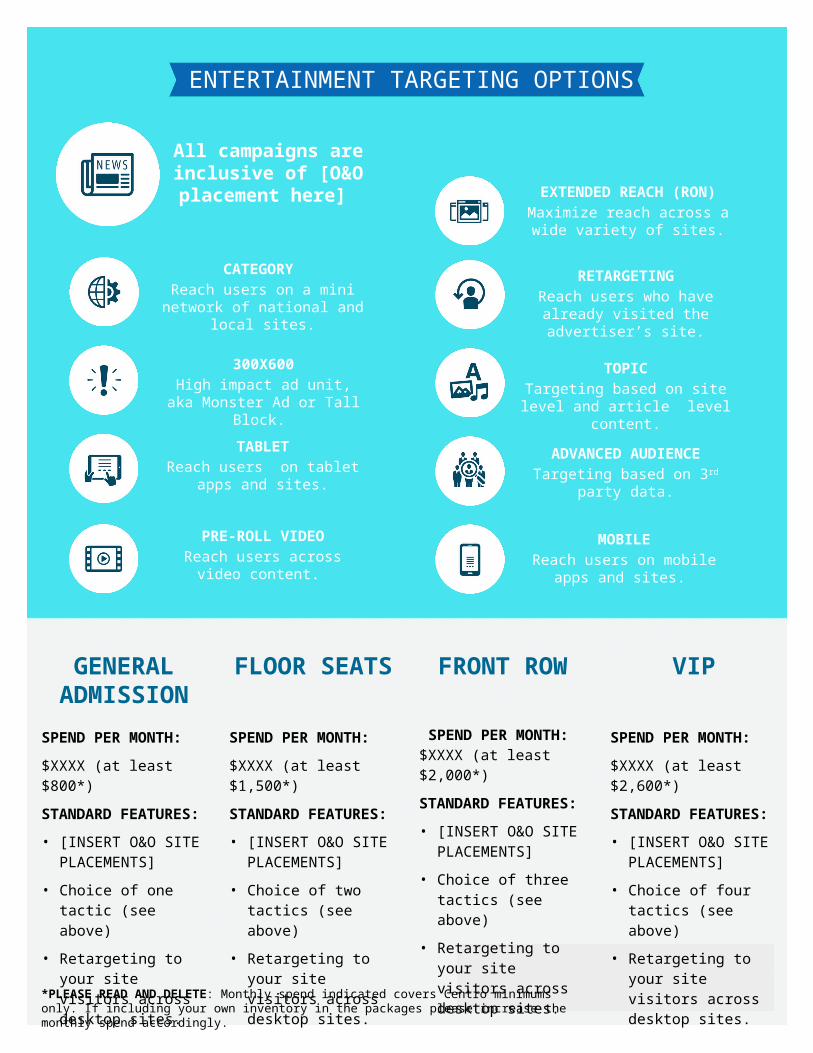
ENTERTAINMENT TARGETING OPTIONS
GENERAL ADMISSION
SPEND PER MONTH:
$XXXX (at least $800*)
STANDARD FEATURES:
• [INSERT O&O SITE PLACEMENTS]
• Choice of one tactic (see above)
• Retargeting to your site visitors across desktop sites.
FLOOR SEATS
SPEND PER MONTH:
$XXXX (at least $1,500*)
STANDARD FEATURES:
• [INSERT O&O SITE PLACEMENTS]
• Choice of two tactics (see above)
• Retargeting to your site visitors across desktop sites.
FRONT ROW
SPEND PER MONTH: $XXXX (at least $2,000*)
STANDARD FEATURES:
• [INSERT O&O SITE PLACEMENTS]
• Choice of three tactics (see above)
• Retargeting to your site visitors across desktop sites.
VIP
SPEND PER MONTH:
$XXXX (at least $2,600*)
STANDARD FEATURES:
• [INSERT O&O SITE PLACEMENTS]
• Choice of four tactics (see above)
• Retargeting to your site visitors across desktop sites.
All campaigns are inclusive of [O&O placement here]
RETARGETINGReach users who have
already visited the advertiser’s site.
ADVANCED AUDIENCETargeting based on 3rd party
data.
MOBILEReach users on mobile apps
and sites.
CATEGORY Reach users on a mini
network of national and local sites.
TOPICTargeting based on site level
and article level content.
PRE-ROLL VIDEOReach users across video
content.
EXTENDED REACH (RON)Maximize reach across a
wide variety of sites.
300X600High impact ad unit, aka Monster Ad or Tall Block.
TABLETReach users on tablet apps
and sites.
*PLEASE READ AND DELETE: Monthly spend indicated covers Centro minimums only. If including your own inventory in the packages please increase the monthly spend accordingly.

DIGITAL AUDIENCE SOLUTIONSThis year US adults will spend 5 hours and 46 minutes a day with Digital
Media
DIGITAL CONSUMPTION
THE [INSERT MARKET] CONSUMER
TRENDS
• Over 80% of American households have internet access – more than DOUBLE the number with internet access in 2000
• 49% of a consumer’s time spent online is on a mobile device
• 86% of mobile phone time is spent on apps
2014 TIME SPENT WITH MAJOR MEDIA
XXX Million XX%ONLINE CONSUMERS
IN OUR MARKET
[INSERT YOUR SITE] ALONE HELPS YOU TO REACH
OF THEM
WITH [INSERT
PROGRAMNAME]
WECAN
THE REST

DIGITAL TARGETING OPTIONS
TIER 1
SPEND PER MONTH:
$XXXX (at least $800*)
STANDARD FEATURES:
• [INSERT O&O SITE PLACEMENTS]
• Choice of one tactic (see above)
• Retargeting to your site visitors across desktop sites.
TIER 2
SPEND PER MONTH:
$XXXX (at least $1,500*)
STANDARD FEATURES:
• [INSERT O&O SITE PLACEMENTS]
• Choice of two tactics (see above)
• Retargeting to your site visitors across desktop sites.
TIER 3
SPEND PER MONTH:
$XXXX (at least $2,000*)
STANDARD FEATURES:
• [INSERT O&O SITE PLACEMENTS]
• Choice of three tactics (see above)
• Retargeting to your site visitors across desktop sites.
TIER 4
SPEND PER MONTH:
$XXXX (at least $2,600*)
STANDARD FEATURES:
• [INSERT O&O SITE PLACEMENTS]
• Choice of four tactics (see above)
• Retargeting to your site visitors across desktop sites.
All campaigns are inclusive of [O&O placement here]
RETARGETINGReach users who have
already visited the advertiser’s site.
ADVANCED AUDIENCETargeting based on 3rd party
data.
MOBILEReach users on mobile apps
and sites.
CATEGORY Reach users on a mini
network of national and local sites.
TOPICTargeting based on site level
and article level content.
PRE-ROLL VIDEOReach users across video
content.
EXTENDED REACH (RON)Maximize reach across a
wide variety of sites.
300X600High impact ad unit, aka Monster Ad or Tall Block.
TABLETReach users on tablet apps
and sites.
*PLEASE READ AND DELETE: Monthly spend indicated covers Centro minimums only. If including your own inventory in the packages please increase the monthly spend accordingly.

HEALTHCARE SOLUTIONSeMarketer predicts that the US healthcare and pharmaceutical industry will
spend $1.41 billion on paid digital media in 2014.
HEALTHCARE AD SPENDING
MOBILE OPPORTUNITY
TRENDS
• 56% of total ad spend will go toward direct response advertising with the remaining 44% will go toward branding-focused campaigns
• 12 million people are expected to buy insurance through healthcare exchanges in 2014
• US healthcare and pharmaceutical ad spend will reach $2.22 billion by 2018
26.5% of total healthcare and pharmaceutical ad spend will go toward mobile. With a continued emphasis on direct response for this industry, we expect this number to continue to rise.
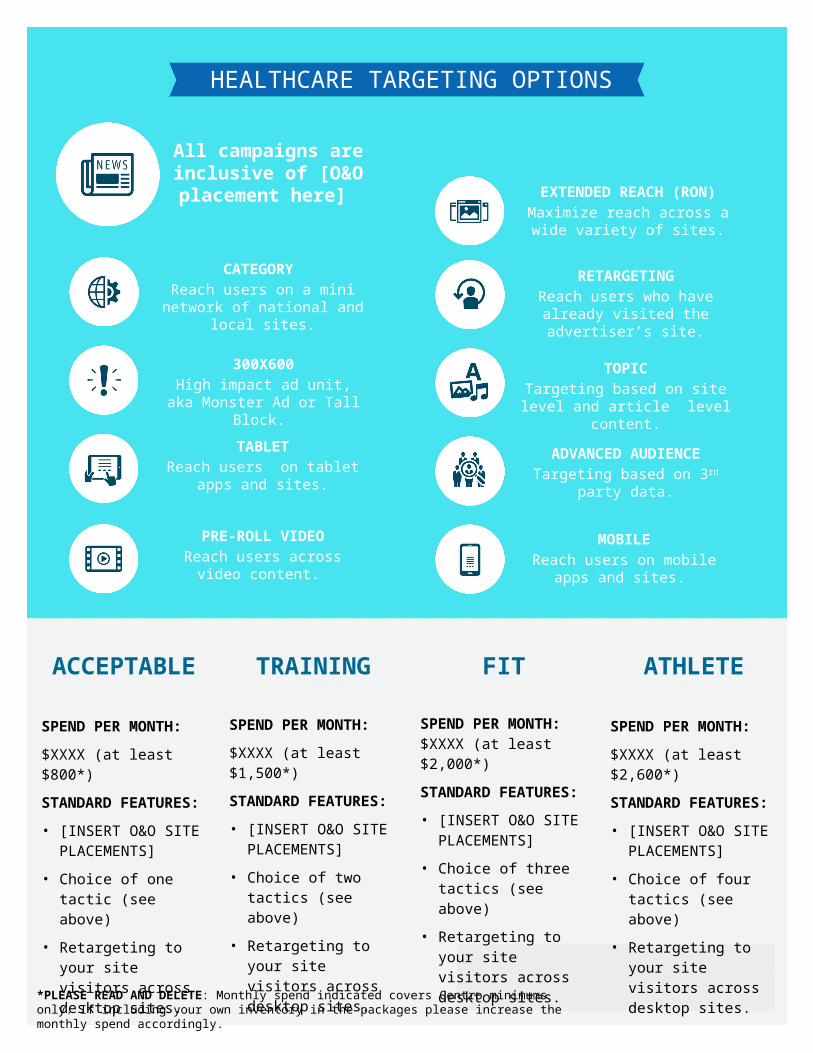
HEALTHCARE TARGETING OPTIONS
All campaigns are inclusive of [O&O placement here]
RETARGETINGReach users who have
already visited the advertiser’s site.
ADVANCED AUDIENCETargeting based on 3rd party
data.
MOBILEReach users on mobile apps
and sites.
CATEGORY Reach users on a mini
network of national and local sites.
TOPICTargeting based on site level
and article level content.
PRE-ROLL VIDEOReach users across video
content.
EXTENDED REACH (RON)Maximize reach across a
wide variety of sites.
300X600High impact ad unit, aka Monster Ad or Tall Block.
TABLETReach users on tablet apps
and sites.
ACCEPTABLE
SPEND PER MONTH:
$XXXX (at least $800*)
STANDARD FEATURES:
• [INSERT O&O SITE PLACEMENTS]
• Choice of one tactic (see above)
• Retargeting to your site visitors across desktop sites.
TRAINING
SPEND PER MONTH:
$XXXX (at least $1,500*)
STANDARD FEATURES:
• [INSERT O&O SITE PLACEMENTS]
• Choice of two tactics (see above)
• Retargeting to your site visitors across desktop sites.
FIT
SPEND PER MONTH: $XXXX (at least $2,000*)
STANDARD FEATURES:
• [INSERT O&O SITE PLACEMENTS]
• Choice of three tactics (see above)
• Retargeting to your site visitors across desktop sites.
ATHLETE
SPEND PER MONTH:
$XXXX (at least $2,600*)
STANDARD FEATURES:
• [INSERT O&O SITE PLACEMENTS]
• Choice of four tactics (see above)
• Retargeting to your site visitors across desktop sites. *PLEASE READ AND DELETE: Monthly spend indicated covers Centro minimums only. If
including your own inventory in the packages please increase the monthly spend accordingly.

REAL ESTATE SOLUTIONS90% of home buyers shopped online during their home buying process
REAL ESTATE INTENDERS
A CASE FOR RETARGETING
PROFILE
• The typical home buyer was 42 years old, while the typical first-time buyer was 31 and the typical repeat buyer was 52
• The 2012 median HHI of home buyers was $83,300
• 66% of recent home buyers were married couples
• The typical home buyer searched for 12 weeks
TRENDS
• For 42% of home buyers, the first step in the home-buying process was looking online for properties and 14% first looked online for information about the home buying process
• 51% of new home shoppers use their mobile devices to read general home information
• When researching new homes in their current residence, 77% of consumers will use their mobile device
• 36% of new home shoppers use mobile and TV at the same time
While 24% of new home shoppers take action on a real estate site the same day they began their research, the majority will conduct research for 60-120 days prior to taking action.
Additionally, 78% of new home shoppers visit 3+ sites prior to taking action on a real estate site
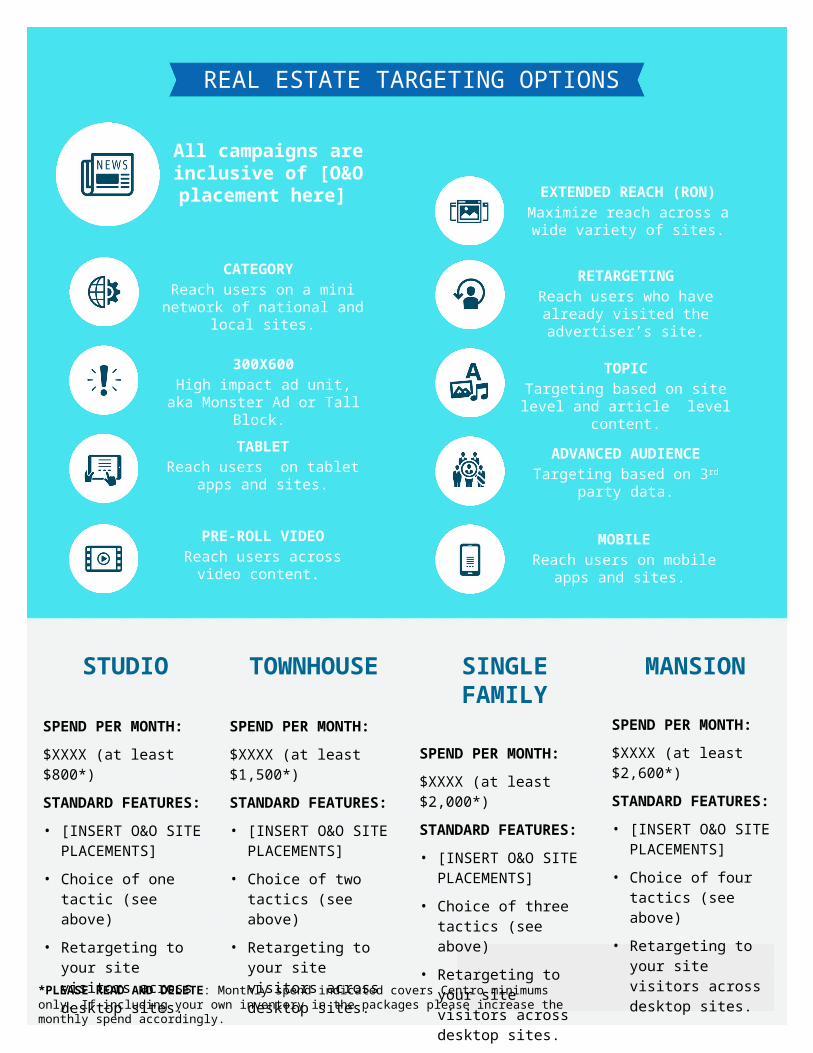
REAL ESTATE TARGETING OPTIONS
All campaigns are inclusive of [O&O placement here]
RETARGETINGReach users who have
already visited the advertiser’s site.
ADVANCED AUDIENCETargeting based on 3rd party
data.
MOBILEReach users on mobile apps
and sites.
CATEGORY Reach users on a mini
network of national and local sites.
TOPICTargeting based on site level
and article level content.
PRE-ROLL VIDEOReach users across video
content.
EXTENDED REACH (RON)Maximize reach across a
wide variety of sites.
300X600High impact ad unit, aka Monster Ad or Tall Block.
TABLETReach users on tablet apps
and sites.
STUDIO
SPEND PER MONTH:
$XXXX (at least $800*)
STANDARD FEATURES:
• [INSERT O&O SITE PLACEMENTS]
• Choice of one tactic (see above)
• Retargeting to your site visitors across desktop sites.
TOWNHOUSE
SPEND PER MONTH:
$XXXX (at least $1,500*)
STANDARD FEATURES:
• [INSERT O&O SITE PLACEMENTS]
• Choice of two tactics (see above)
• Retargeting to your site visitors across desktop sites.
SINGLE FAMILY
SPEND PER MONTH:
$XXXX (at least $2,000*)
STANDARD FEATURES:
• [INSERT O&O SITE PLACEMENTS]
• Choice of three tactics (see above)
• Retargeting to your site visitors across desktop sites.
MANSION
SPEND PER MONTH:
$XXXX (at least $2,600*)
STANDARD FEATURES:
• [INSERT O&O SITE PLACEMENTS]
• Choice of four tactics (see above)
• Retargeting to your site visitors across desktop sites. *PLEASE READ AND DELETE: Monthly spend indicated covers Centro minimums only. If
including your own inventory in the packages please increase the monthly spend accordingly.

RETAIL SOLUTIONSThe US retail industry’s advertising spending on paid digital media will
reach $11 billion in 2014 and rise to $17.4 billion by 2018.
ONLINE SHOPPERS
RETAIL MOBILE CLICKERS
THE OPPORTUNITY
• eMarketer estimates 120 million US consumers use their smartphones & tablets while shopping, browsing for new deals, research and buying products
• Retail continues to spend more than any other US industry digitally
• The US retail industry’s advertising spend represents a 12.8% compound annual growth rate between 2013 and 2018
TRENDS
• 42% of consumers chose finding a better price online as their reason for purchasing online after shopping in a store.
• En route to the store, 70% of smartphone shoppers use a store locator to plain their shopping trip
• 19% of consumers leave a store and look for lower prices online
One-third of tablet owners and nearly a quarter of smartphone owners were most likely to click on ads that were locally relevant.
For retailers using mobile, the “consideration” phase of the traditional funnel model is best expressed as engagement: consumers interacting with retailers.
Source: eMarketer

RETAIL TARGETING OPTIONS
BUDGET SHOPPER
SPEND PER MONTH:
$XXXX (at least $800*)
STANDARD FEATURES:
• [INSERT O&O SITE PLACEMENTS]
• Choice of one tactic (see above)
• Retargeting to your site visitors across desktop sites.
COUPON CLIPPER
SPEND PER MONTH:
$XXXX (at least $1,500*)
STANDARD FEATURES:
• [INSERT O&O SITE PLACEMENTS]
• Choice of two tactics (see above)
• Retargeting to your site visitors across desktop sites.
OCCASIONAL SPLURGE
SPEND PER MONTH:
$XXXX (at least $2,000*)
STANDARD FEATURES:
• [INSERT O&O SITE PLACEMENTS]
• Choice of three tactics (see above)
• Retargeting to your site visitors across desktop sites.
SHOPPING SPREE
SPEND PER MONTH:
$XXXX (at least $2,600*)
STANDARD FEATURES:
• [INSERT O&O SITE PLACEMENTS]
• Choice of four tactics (see above)
• Retargeting to your site visitors across desktop sites.
All campaigns are inclusive of [O&O placement here]
RETARGETINGReach users who have
already visited the advertiser’s site.
ADVANCED AUDIENCETargeting based on 3rd party
data.
MOBILEReach users on mobile apps
and sites.
CATEGORY Reach users on a mini
network of national and local sites.
TOPICTargeting based on site level
and article level content.
PRE-ROLL VIDEOReach users across video
content.
EXTENDED REACH (RON)Maximize reach across a
wide variety of sites.
300X600High impact ad unit, aka Monster Ad or Tall Block.
TABLETReach users on tablet apps
and sites.
*PLEASE READ AND DELETE: Monthly spend indicated covers Centro minimums only. If including your own inventory in the packages please increase the monthly spend accordingly.
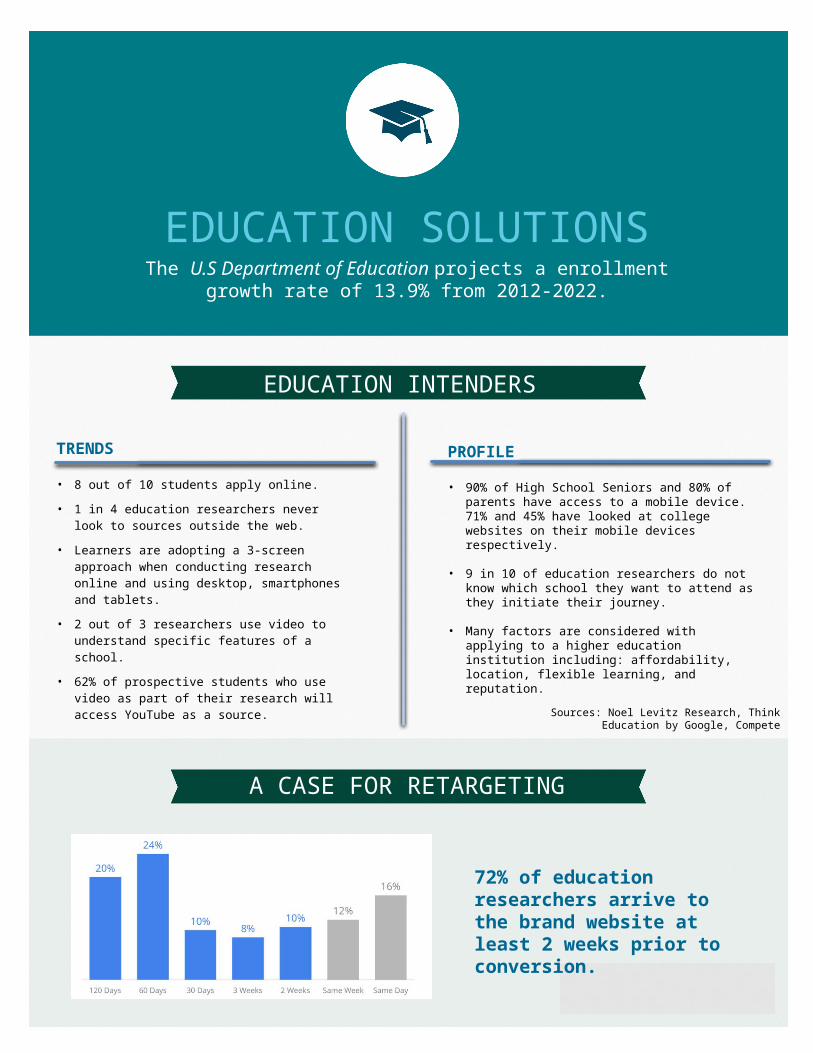
EDUCATION SOLUTIONS
EDUCATION INTENDERS
A CASE FOR RETARGETING
Sources: Noel Levitz Research, Think Education by Google, Compete
TRENDS
• 8 out of 10 students apply online.
• 1 in 4 education researchers never look to sources outside the web.
• Learners are adopting a 3-screen approach when conducting research online and using desktop, smartphones and tablets.
• 2 out of 3 researchers use video to understand specific features of a school.
• 62% of prospective students who use video as part of their research will access YouTube as a source.
72% of education researchers arrive to the brand website at least 2 weeks prior to conversion.
The U.S Department of Education projects a enrollment growth rate of 13.9% from 2012-2022.
PROFILE
• 90% of High School Seniors and 80% of parents have access to a mobile device. 71% and 45% have looked at college websites on their mobile devices respectively.
• 9 in 10 of education researchers do not know which school they want to attend as they initiate their journey.
• Many factors are considered with applying to a higher education institution including: affordability, location, flexible learning, and reputation.

EDUCATION TARGETING OPTIONS
All campaigns are inclusive of [O&O placement here]
RETARGETINGReach users who have
already visited the advertiser’s site.
ADVANCED AUDIENCETargeting based on 3rd party
data.
MOBILEReach users on mobile apps
and sites.
CATEGORY Reach users on a mini
network of national and local sites.
TOPICTargeting based on site level
and article level content.
PRE-ROLL VIDEOReach users across video
content.
EXTENDED REACH (RON)Maximize reach across a
wide variety of sites.
300X600High impact ad unit, aka Monster Ad or Tall Block.
TABLETReach users on tablet apps
and sites.
ELEMENTARY
SPEND PER MONTH:
$XXXX (at least $800*)
STANDARD FEATURES:
• [INSERT O&O SITE PLACEMENTS]
• Choice of one tactic (see above)
• Retargeting to your site visitors across desktop sites.
SECONDARY
SPEND PER MONTH:
$XXXX (at least $1,500*)
STANDARD FEATURES:
• [INSERT O&O SITE PLACEMENTS]
• Choice of two tactics (see above)
• Retargeting to your site visitors across desktop sites.
COLLEGE
SPEND PER MONTH:
$XXXX (at least $2,000*)
STANDARD FEATURES:
• [INSERT O&O SITE PLACEMENTS]
• Choice of three tactics (see above)
• Retargeting to your site visitors across desktop sites.
MASTERS
SPEND PER MONTH:
$XXXX (at least $2,600*)
STANDARD FEATURES:
• [INSERT O&O SITE PLACEMENTS]
• Choice of four tactics (see above)
• Retargeting to your site visitors across desktop sites. *PLEASE READ AND DELETE: Monthly spend indicated covers Centro minimums only. If
including your own inventory in the packages please increase the monthly spend accordingly.