AUTOMOTIVE Proactive Positioning - IHS...
37
© 2016 IHS Markit. All Rights Reserved. © 2016 IHS Markit. All Rights Reserved. Proactive Positioning Seeking Opportunity in a Low Growth Environment AUTOMOTIVE Mike Jackson, Senior Executive, North America, Vehicle Production Forecasting +1-248-465-2833, [email protected] 19 October, 2016 | Tokyo
Transcript of AUTOMOTIVE Proactive Positioning - IHS...

© 2016 IHS Markit. All Rights Reserved.© 2016 IHS Markit. All Rights Reserved.
Proactive PositioningSeeking Opportunity in a Low Growth Environment
AUTOMOTIVE
Mike Jackson, Senior Executive, North America, Vehicle Production Forecasting +1-248-465-2833, [email protected]
19 October, 2016 | Tokyo

© 2016 IHS Markit
Contents
North America Production Outlook
Product Mix: Cars, SUVs, Trucks
Market Dynamics
OEM Reviews
Summary
Contents

© 2016 IHS Markit. All Rights Reserved.
0
2
4
6
8
10
12
14
16
18
20
1970 1975 1980 1985 1990 1995 2000 2005 2010 2015 2020
Mill
ions
NA Production
Recession
Linear (NA Production)
Market Assessment Portfolio Review– Cycle Check– Goals– Risk Profile– Timeframe– Demand– Capabilities– Technology
Risk Mitigation– Customer Base
– Diversification
– Hedging
Action Plan– Assess
– Diagnose
– Execute
You Are Here
3
Automotive Conference – Tokyo | October 2016

© 2016 IHS Markit. All Rights Reserved.
L
Diversification
Targets&
Investments
Markets
Customer
Brand
Bodytype
Segment
Positioning
• Market
• Customer
• Product
• Technology
4
Automotive Conference – Tokyo | October 2016

© 2016 IHS Markit. All Rights Reserved.
5146201732 34
201926
2021North American Production
5
189 LAUNCH EVENTS
+9.4M+.8M +.6M
+10.2M1
5.8
15
.81
5.3
15
.11
2.6
8.6
11
.9 13
.1 15
.41
6.2
17
.01
7.5
18
.01
8.1
18
.21
8.6
18
.81
8.8
18
.71
8.6
0.0
4.0
8.0
12.0
16.0
20.0
2004 2008 2012 2016 2020
Mill
ion
s
5
Automotive Conference – Tokyo | October 2016

© 2016 IHS Markit. All Rights Reserved.6
0.00
0.25
0.50
Hyundai
VW
Tesla
Geely
Subaru
Atieva
BM
W
Honda
Faraday
Daim
ler
Mazda
Mill
ion
sNorth American OpportunityGainers Outpace Market: 2016 - 2023
241%1.5M
Automotive Conference – Tokyo | October 2016

© 2016 IHS Markit
North American Production
17.9 17.9 18.017.5
18.0 18.1 18.2
16.0
16.5
17.0
17.5
18.0
18.5
2015 2016 2017 2018
Mill
ion
s
Downside Production
2016• -50,000 units• Inventory
2017• -200,000 units• Inventory
2018• -200,000 units• Delays• Sourcing
Quality vs Quantity
Automotive Conference – Tokyo | October 2016

© 2016 IHS Markit 8
6.54.0
7.1 7.0 6.9 7.1 7.4 7.5
5.1
2.7
7.0 7.2 7.4 7.9 8.0 7.84.1
1.8
3.5 3.8 3.8 3.6 3.4 3.2
0
3
6
9
12
15
18
21
2004 2006 2008 2010 2012 2014 2016 2018 2020 2022
Mill
ion
s
Car SUV Truck
Cars Climb, SUVs Soar
Automotive Conference – Tokyo | October 2016

© 2016 IHS Markit
Portfolio Comparison 2015
9
OEM Units Car SUV Truck
GM 3,433 31% 36% 34%Ford 3,105 31% 32% 37%FCA 2,758 20% 58% 22%
Toyota 2,034 48% 36% 15%Honda 1,862 48% 52% 0%
Ren/Nissan 1,767 58% 29% 13%Hyundai 756 65% 35% 0%
BMW 400 0% 100% 0%Daimler 327 29% 64% 7%VW 545 100% 0% 0%
Other 771 60% 40% 0%Unit Vol ‐ 7,072 6,954 2,900NA Avg 17,495 40% 40% 20%
$
Automotive Conference – Tokyo | October 2016

© 2016 IHS Markit
Portfolio Comparison 2023
10
OEM Units Car SUV Truck
GM 3,440 33% 40% 27%Ford 3,030 26% 37% 37%FCA 2,226 10% 65% 25%
Toyota 2,145 49% 36% 14%Honda 2,013 48% 50% 2%
Ren/Nissan 1,645 59% 30% 12%Hyundai 1,221 67% 29% 3%
BMW 461 27% 73% 0%Daimler 379 18% 72% 10%VW 880 64% 36% 0%
Other 1534 54% 46% 0%Unit Vol ‐ 7,549 7,821 3,245NA Avg 18,615 41% 42% 17%
$
Automotive Conference – Tokyo | October 2016

© 2016 IHS Markit
ContentsPresentation Name / Month 2016
North American Production Outlook
Product Profiles: Cars, SUVs, Trucks
Market Dynamics
OEM Reviews
Summary

© 2016 IHS Markit
Car Output2016 - 2023
12
0.01.02.03.04.05.06.07.08.0
2015 2017 2019 2021 2023
Mill
ion
s
Small Midsize Fullsize
Car 2016 2019 2023
US3 2,305 1,976 2,152 -14% 9%
Asian4 3,585 3,673 3,818 2% 4%
German3 595 666 755 12% 13%
Other 504 826 824 64% 0%
Small 3,293 3,499 3,778
6% 8%
Midsize 3,293 3,316 3,420
1% 3%
Fullsize 402 327 351
-19% 7%
+485K
+127K
- 51K
+561K
Automotive Conference – Tokyo | October 2016

© 2016 IHS Markit
Regional Car Profile
13
20.0%
25.0%
30.0%
35.0%
40.0%
0.0
1.0
2.0
3.0
4.0
5.0
2013 2015 2017 2019 2021 2023
Mill
ion
s
Mexico Share % US Mexico Canada
United States
• Shift toward more SUVs
• Retooling
• Start-ups
Mexico
• Significant investment
• Greenfield
• Technology opportunity
Canada
• Shift toward more SUVs
Automotive Conference – Tokyo | October 2016

© 2016 IHS Markit
SUV Output2016 - 2023
14
0.01.02.03.04.05.06.07.08.0
2015 2017 2019 2021 2023
Mill
ion
s
Small Midsize Fullsize
SUV 2016 2019 2023
US3 3,939 4,095 3,914 4% -4%
Asian4 2,302 2,328 2,269 1% -3%
German3 664 983 928 48% -6%
Other 304 474 710 56% 50%
Small 1,965 2,369 2,334
21% -1%Midsize 2,771 3,133 3,263
13% 4%Fullsize 2,473 2,378 2,224
-4% -6%
+612K
+370K
+492K
-250K
SUV = SUV/CUV/MPV
Automotive Conference – Tokyo | October 2016

© 2016 IHS Markit
Truck Output2016 - 2023
15
0.00.51.01.52.02.53.03.54.0
2015 2017 2019 2021 2023
Mill
ion
s
Van Midsize Pickup Fullsize Pickup
Truck 2016 2019 2023
US3 3,088 2,952 2,631 -4% -11%
Asian4 674 629 578 -7% -8%
German3 41 36 36 -11% 0%
Other - - -- -
Van 451 378 365
-16% -3%Midsize Pickup 630 715 632
14% -12%FullsizePickup 2,723 2,525 2,248
-7% -11%
‐558K
- 85K-
- 475K
Truck = Pickup, Van (LCV)
Automotive Conference – Tokyo | October 2016

© 2016 IHS Markit 16
Midsize Surge
• 2010 = 361,000• 2015 = 511,000• 2020 = 700,000
+36%
2013 20232016 2019
RangerCompact Pickup
Santa Cruz
CanyonColorado
RidgelineFrontierTacoma
Automotive Conference – Tokyo | October 2016

© 2016 IHS Markit
ContentsPresentation Name / Month 2016
North American Production Outlook
Product Profiles: Cars, SUVs, Trucks
Market Dynamics
OEM Reviews
Summary

© 2016 IHS Markit 18
050
100150200250300350
Ford
VW
GM
Hyundai
Toyota
Daim
ler
BM
W
Mazda
Honda
Mexico Production OpportunityGainers Outpace Market: 2016 - 2023
230%1.5M
Automotive Conference – Tokyo | October 2016

© 2016 IHS Markit
Mexico Output
19
0.0
1.0
2.0
3.0
4.0
5.0
2015 2017 2019 2021 2023
Mill
ion
s
Car SUV Truck
Mexico 2016 2019 2023
US3 1,602 2,137 2,145 33% 0%
Asian4 1,287 1,616 1,627 26% 1%
German3 441 824 953 87% 16%
Other 164 155 182 -6% 18%
Car 1,988 2,481 2,808
25% 13%SUV 561 1,366 1,361
121% 0%Truck 945 886 739
0% -17%
+819K
+800K
-207K
+1.4M
Automotive Conference – Tokyo | October 2016

© 2016 IHS Markit 20
Global EV Production
0.0
.1
0.6
0.4
1.8
0%
10%
20%
30%
40%
50%
60%
0.0
0.5
1.0
1.5
2.0
2.5
2012 2014 2016 2018 2020 2022
Mill
ion
s
NA EV ROW EV NA EV Share China EV Share
CAGR = 27.5%2023: 1.1M
CAGR = 28.3%2023: .6M
19 Nameplates
146 Nameplates
Automotive Conference – Tokyo | October 2016

© 2016 IHS Markit 21
Disruptive
ToyotaHondaNissanFordBMW
VolkswagenChevrolet
AudiLexusMazda
© 2016 IHS Markit
Automotive Conference – Tokyo | October 2016

© 2016 IHS Markit
New mobility manufacturers
0
100
200
300
400
500
600
2007 2012 2017 2022NA Production
TeslaModel 3
Issues• Tesla• Atieva• Faraday• Apple• Google
Actions• Conquest dependent• Financial hurdles• Size and scale• Technology risk• Competition
When?
Automotive Conference – Tokyo | October 2016

© 2016 IHS Markit
ContentsPresentation Name / Month 2016
North American Production Outlook
Product Profiles: Cars, SUVs, Trucks
Market Dynamics
OEM Reviews
Summary
© 2016 IHS Markit
0.00.51.01.52.02.53.03.54.0
2013 2015 2017 2019 2021 2023
Mill
ion
s
Car SUV Truck
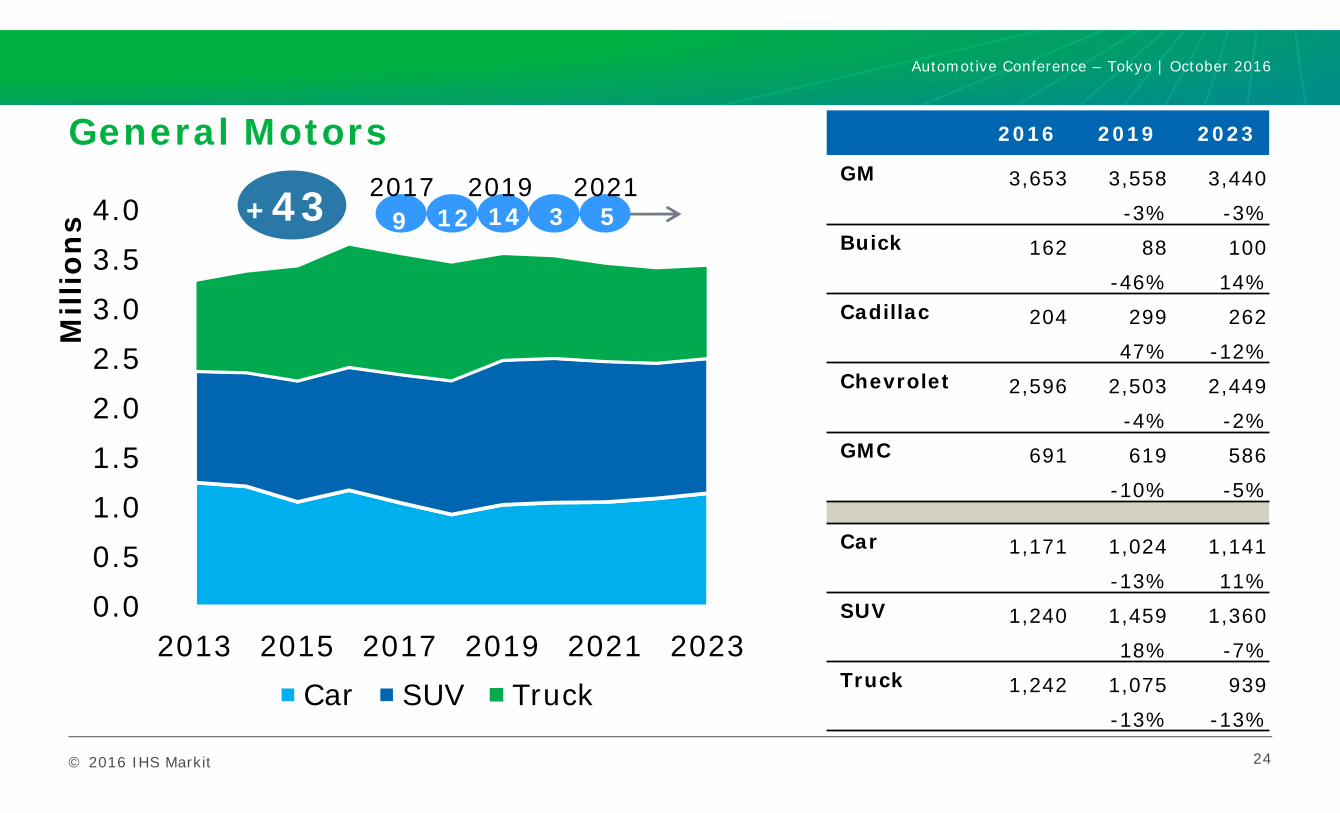
General Motors
24
2016 2019 2023
GM 3,653 3,558 3,440 -3% -3%
Buick 162 88 100 -46% 14%
Cadillac 204 299 262 47% -12%
Chevrolet 2,596 2,503 2,449 -4% -2%
GMC 691 619 586 -10% -5%
Car 1,171 1,024 1,141-13% 11%
SUV 1,240 1,459 1,36018% -7%
Truck 1,242 1,075 939-13% -13%
+43 9 12 14 3 52017 2019 2021
Automotive Conference – Tokyo | October 2016

© 2016 IHS Markit
Ford
25
0.0
0.5
1.0
1.5
2.0
2.5
3.0
3.5
2013 2015 2017 2019 2021 2023
Mill
ion
s
Car SUV Truck
2016 2019 2023
FMC 3,078 2,958 3,030 -4% 2%
Ford 2,908 2,786 2,849 -4% 2%
Lincoln 170 172 181 1% 5%
Car 805 733 788-9% 8%
SUV 1,090 1,027 1,111-6% 8%
Truck 1,183 1,199 1,1311% -6%
2 2 6 8 22017 2019 2021
+20
Automotive Conference – Tokyo | October 2016

© 2016 IHS Markit
Fiat Chrysler Automobiles
26
0.0
0.5
1.0
1.5
2.0
2.5
3.0
2013 2015 2017 2019 2021 2023
Mill
ion
s
Car SUV Truck
2016 2019 2023
FCA 2,601 2,508 2,226
-4% -11%Chrysler 246 378 342
54% -10%Dodge 612 290 215
-53% -26%Jeep 1,066 1,192 1,121
12% -6%Ram 664 644 549
-3% -15%
Car 328 220 223
-33% 2%SUV 1,609 1,609 1,442
0% -10%Truck 664 678 560
2% -17%
+183 7 3 5 -
2017 2019 2021
Automotive Conference – Tokyo | October 2016

© 2016 IHS Markit
Toyota
27
0.0
0.5
1.0
1.5
2.0
2.5
2013 2015 2017 2019 2021 2023
Mill
ion
s
Car SUV Truck
2016 2019 2023
TMC 2,176 2,117 2,145 -3% 1%
Lexus 161 144 147 -11% 3%
Toyota 2,015 1,973 1,997 -2% 1%
Car 1,040 941 1,060-10% 13%
SUV 780 828 7766% -6%
Truck 356 348 309-2% -11%
20172 3 7 2
20191
2021+15
Automotive Conference – Tokyo | October 2016

© 2016 IHS Markit
Honda
28
0.0
0.5
1.0
1.5
2.0
2.5
2013 2015 2017 2019 2021 2023
Mill
ion
s
Car SUV Truck
2016 2019 2023
HMC 1,962 1,999 2,013 2% 1%
Acura 195 186 185 -5% -1%
Honda 1,767 1,813 1,828 3% 1%
Car 923 934 9671% 4%
SUV 1,005 1,029 1,0062% -2%
Truck 34 36 404% 12%
+18 4 2 1 7 42017 2019 2021
Automotive Conference – Tokyo | October 2016

© 2016 IHS Markit
Renault-Nissan
29
0.0
0.4
0.8
1.2
1.6
2.0
2013 2015 2017 2019 2021 2023
Mill
ion
s
Car SUV Truck
2016 2019 2023
Ren-Nis 1,846 1,668 1,645 -10% -1%
Infiniti 52 119 150 126% 26%
Nissan 1,793 1,547 1,493 -14% -3%
Renault 1 3 2 184% -12%
Car 1,046 984 967-6% -2%
SUV 517 472 487-9% 3%
Truck 284 212 191-25% -10%
+18 20175 3 4 2
20194
2021
Automotive Conference – Tokyo | October 2016

© 2016 IHS Markit
Hyundai
30
0.0
0.2
0.4
0.6
0.8
1.0
1.2
1.4
2013 2015 2017 2019 2021 2023
Mill
ion
s
Car SUV Truck
2016 2019 2023
HMC 851 1,223 1,221 44% 0%
Hyundai 496 694 695 40% 0%
Kia 355 529 526 49% -1%
Car 576 813 82341% 1%
SUV 275 376 35937% -5%
Truck 0 34 38- 13%
+14 20172 5 1 3
20193
2021
Automotive Conference – Tokyo | October 2016

© 2016 IHS Markit
Volkswagen
31
0.0
0.2
0.4
0.6
0.8
1.0
2013 2015 2017 2019 2021 2023
Mill
ion
s
Car SUV Truck
2016 2019 2023
VW 530 841 880 59% 5%
Audi 12 128 162 928% 26%
VW 517 713 718 38% 1%
Car 517 492 561-5% 14%
SUV 12 350 3192699% -9%
Truck 0 0 0- -
+9 20172 2 1 -
20194
2021
Automotive Conference – Tokyo | October 2016

© 2016 IHS Markit
BMW
32
0.0
0.1
0.2
0.3
0.4
0.5
2013 2015 2017 2019 2021 2023
Mill
ion
s
Car SUV Truck
2016 2019 2023
BMW 409 415 4611% 11%
Car 0 40 125- 216%
SUV 409 375 336-8% -10%
Truck 0 0 0- -
+7 20171 3 2 -
20191
2021
Automotive Conference – Tokyo | October 2016

© 2016 IHS Markit
Daimler
33
0.0
0.1
0.2
0.3
0.4
0.5
2013 2015 2017 2019 2021 2023
Mill
ion
s
Car SUV Truck
2016 2019 2023
Daimler 360 430 37919% -12%
Car 77 135 7075% -48%
SUV 242 258 2727% 6%
Truck 41 36 36-11% 0%
+7 2017- 2 5 -
2019-
2021
Automotive Conference – Tokyo | October 2016

© 2016 IHS Markit 34
0.00.20.40.60.81.01.21.41.6
2013 2015 2017 2019 2021 2023
Mill
ion
s
Car SUV Truck
Other Manufacturers2016 2019 2023
Subaru 286 430 398 50% -8%
Mazda 164 155 182 -6% 18%
Tesla 82 265 386 224% 46%
Car 504 826 82464% 0%
SUV 304 474 71056% 50%
Truck 0 0 0- -
20171 1 6 2
20191
2021+7
Automotive Conference – Tokyo | October 2016

© 2016 IHS Markit
ContentsPresentation Name / Month 2016
North American Production Outlook
Product Profiles: Cars, SUVs, Trucks
Market Dynamics
OEM Reviews
Summary

© 2016 IHS Markit
Summary: Proactive Positioning
• Mitigate Risk: Lower Growth Leads to Higher Risk Behavior
• Take Calculated Risks Over A Set Investment Horizon
• Proactively manage business portfolio; transition ahead of inflection point
• Audit: Align Future Strategy with Core Capabilities and Risk Profile
• Increased launch and investment activity at reduced volumes – drives a profit squeeze
• Leverage: Seize Sound Opportunities to Grow As Market Stress Rises• Window of Opportunity to take action as market maintains momentum
• Diversification: Requires Global Perspective• Embrace global opportunities to develop expertise; Chinese OEMs & Suppliers are actively working to
make inroads, offering risk and reward
Automotive Conference – Tokyo | October 2016

IHS MarkitTM COPYRIGHT NOTICE AND DISCLAIMER © 2016 IHS Markit.
No portion of this presentation may be reproduced, reused, or otherwise distributed in any form without prior written consent of IHS Markit. Content reproduced or redistributed with IHS Markit permission must display IHS Markit legal notices and attributions of authorship. The information contained herein is from sources considered reliable, but its accuracy and completeness are not warranted, nor are the opinions and analyses that are based upon it, and to the extent permitted by law, IHS Markit shall not be liable for any errors or omissions or any loss, damage, or expense incurred by reliance on information or any statement contained herein. In particular, please note that no representation or warranty is given as to the achievement or reasonableness of, and no reliance should be placed on, any projections, forecasts, estimates, or assumptions, and, due to various risks and uncertainties, actual events and results may differ materially from forecasts and statements of belief noted herein. This presentation is not to be construed as legal or financial advice, and use of or reliance on any information in this publication is entirely at your own risk. IHS Markit and the IHS Markit logo are trademarks of IHS Markit.
IHS Markit Customer Care:[email protected]: +1 800 IHS CARE (+1 800 447 2273)Europe, Middle East, and Africa: +44 (0) 1344 328 300Asia and the Pacific Rim: +604 291 3600
Thank You!