AUTOMOTIVE MOLDAVIA MOROCCO BRAKE...
21
1 Automobile market analysis 2016-2020 R&D department BOSNIA AND HERZEGOVINA CROATIA MOROCCO MOLDAVIA AUTOMOTIVE GERMANY USA SLOVENIA RUSSIA FRANCE NEOFACTURE ORIGINALS ORIGINALS MOBILITY TEXTILES FOAMS GLASS GERMANY SHIPBUILDING BOSNIA AND HERZEGOVINA EPP PROTECTIVE CLOTHING ROMANIA AUSTRIA DECOR DECOR SAFETY SAFETY BRAZIL DEVELOPMENT BRAKE DISCS LAMINATIO COMFORT BRAKE DISCS MOLDAVIA
Transcript of AUTOMOTIVE MOLDAVIA MOROCCO BRAKE...

R&D Department 2016, November 1Copyright © 2011 Prevent Group. All rights reserved.
Automobile market analysis 2016-2020R&D department
BOSNIA AND HERZEGOVINA
CROATIA
MOROCCOMOLDAVIAAUTOMOTIVE
GERMANYUSA SLOVENIARUSSIAFRANCE
NEOFACTURE
ORIGINALSORIGINALS
MOBILITYTEXTILESF O A M S GLASSGERMANYSHIPBUILDING
BOSNIA AND HERZEGOVINA
EPP
PROTECTIVE CLOTHING
ROMANIAA U S T R I A
D E C O R
D E C O R
S A F E T Y
S A F E T Y
BRAZILD E V E L O P M E N TBRAKE DISCS
LAMINATIO
COMFORT
BRAKE DISCS
MOLDAVIA

R&D Department 2016, November 2
Basic Market information
Statistics for Europe, America and Asia Market
Review of Top 20 manufacturers and models
New model overview 2017-2018
Competition overview
Global Trends
Automotive seating and Interior Trends
Content
03
05
07
10
11
13
17
R&D Department 2016, November 3
Basic Market information
Worldwide
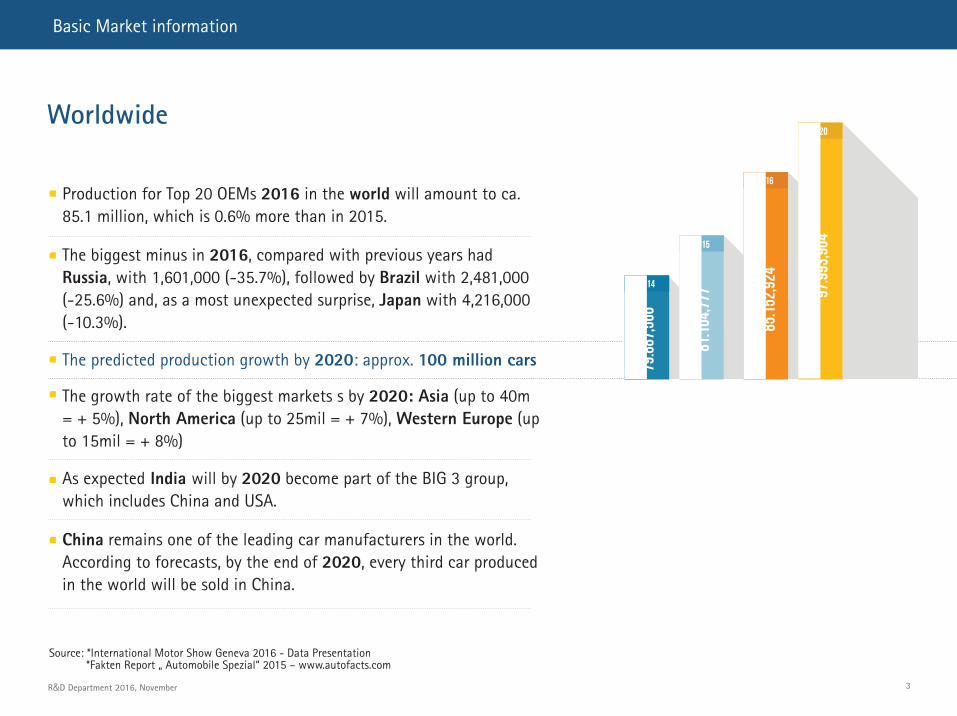
Production for Top 20 OEMs 2016 in the world will amount to ca. 85.1 million, which is 0.6% more than in 2015.
The biggest minus in 2016, compared with previous years had Russia, with 1,601,000 (-35.7%), followed by Brazil with 2,481,000 (-25.6%) and, as a most unexpected surprise, Japan with 4,216,000 (-10.3%).
The predicted production growth by 2020: approx. 100 million cars
The growth rate of the biggest markets s by 2020: Asia (up to 40m = + 5%), North America (up to 25mil = + 7%), Western Europe (up to 15mil = + 8%)
As expected India will by 2020 become part of the BIG 3 group, which includes China and USA.
China remains one of the leading car manufacturers in the world. According to forecasts, by the end of 2020, every third car produced in the world will be sold in China.
79.887,566
81.104,777
85.152,924
97.993,904
2014
2015
2016
2020
Source: *International Motor Show Geneva 2016 - Data Presentation *Fakten Report „ Automobile Spezial“ 2015 – www.autofacts.com

R&D Department 2016, November 4
Basic Market information
Europe
The European car market the first half of 2016 will write as generous since 2008. Total upward trend until 2020 strongly support the stronger markets, new products and more demanding customers.
Total production forecast for 2020 approx. 22 mill.
2016 Europe’s biggest car market, Germany, on the 4th place in the world (3rd place Japan), with 3,206,000 and a solid increase (+ 5.6%), which applies to the sixth ranked English 2,634,000 (+ 6.3%) and the French eight ranked 1,917,000 (+ 6.8%).
The state with the largest increase in Spain with 1,034,000 (+ 20.9%), and Italy with 1.575 million (+ 15.8%).
Russian car market by 2020, to overcome the current crisis and is predicted to reach the level of the German, which will become one of the largest markets in Europe.
Source: *International Motor Show Geneva 2016 - Data Presentation *Fakten Report „ Automobile Spezial“ 2015 – www.autofacts.com

EIZ Department 2016, November 5
Europe Top 10 Producing countries
R&D Department 2016, November
Germany, Spain and France the Top 3 manufacturer in Europe.
Germany remains the No.1 – according to forecast by PricewaterhouseCoopers(PwC) in 2020 as well as today - more than six million cars/Vehicles more produced in comparision to Spain and France together.
Total production in Europe: 2016: approx. 19,2 mil. 2020: approx 21.9 mil
Total production (in Mio.) TOP MANUFACTURER (in Thousand)
2016 (2,72); 2020 (3,00)
2016 (1,89); 2020 (2,05)
2016 (1,33); 2020 (1,47)
2016 (1,27); 2020 (1,12)
2016 (0,88); 2020 (1,00)
2016 (0,88); 2020 (1,24)
2016 (0,79); 2020 (0,84)
2016 (0,42); 2020 (0,44)
2016 (6,03); 2020 (6,27)
2016 (1,75); 2020 (1,80)
GermanyVW (861), Audi (563), Ford (393)
SpainSeat (488), PSA (422), Opel (398)
FrancePSA in 3. locations (361, 228, 221)
Great BritainNissan (470), Tata (251), BMW (205)
TurkeyRenault (335), Tofas (258), Hyundai (206)
Czech RepublicVW (574), Hyundai (337), TPCA (220)
ItalyFiat Crysler with 2 locations (354, 171), Sevel Sud-Fiat Ducato, Peugeot, Citroen (217)
SlovakiaVW (342), Hyundai (284), PSA (230)
PolandFiat Crysler (310), General Motors (196), VW (173)
HungarySuzuki (175), VW/Audi (156), Daimler (142)
SPAIN
FRANCE
TURKEY
CZECH REPUBLIC
ITALY
SLOVAKIA
POLANDHUNGARY
GERMANY
GREAT BRITAIN
Source: *International Motor Show Geneva 2016 - Data Presentation *Fakten Report „ Automobile Spezial“ 2015 – www.autofacts.com
6
America and Asia Production
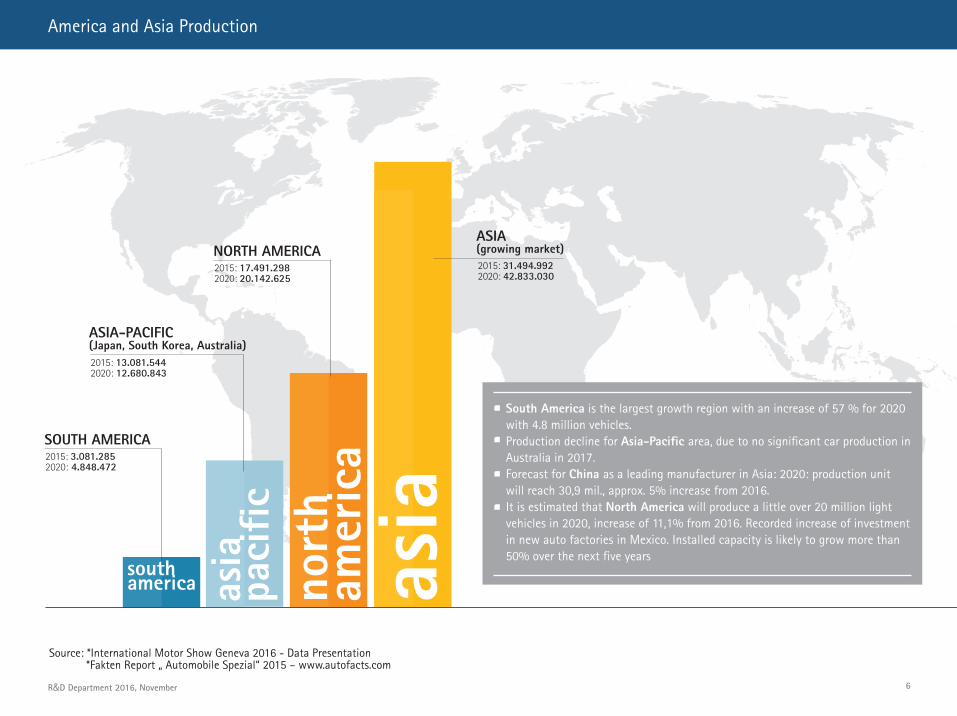
2015: 17.491.2982020: 20.142.625
2015: 3.081.2852020: 4.848.472
asia
nort
h am
eric
a
asia
paci
fic
southamerica
NORTH AMERICA
SOUTH AMERICA
2015: 13.081.5442020: 12.680.843
ASIA-PACIFIC(Japan, South Korea, Australia)
2015: 31.494.9922020: 42.833.030
ASIA(growing market)
South America is the largest growth region with an increase of 57 % for 2020 with 4.8 million vehicles.Production decline for Asia-Pacific area, due to no significant car production in Australia in 2017.Forecast for China as a leading manufacturer in Asia: 2020: production unit will reach 30,9 mil., approx. 5% increase from 2016.It is estimated that North America will produce a little over 20 million light vehicles in 2020, increase of 11,1% from 2016. Recorded increase of investment in new auto factories in Mexico. Installed capacity is likely to grow more than 50% over the next five years
R&D Department 2016, November
Source: *International Motor Show Geneva 2016 - Data Presentation *Fakten Report „ Automobile Spezial“ 2015 – www.autofacts.com

7
Review of Top 20 manufacturers and models
TOP 20 Manufacturers
MANUFACTURERS Toyota GroupVolkswagen-KonzernGeneral MotorsRenault-NissanHyndai-KiaFord GroupFiat Chrysler AutomobilesHonda GroupPSA GroupSuzuki GroupBMW GroupDaimlerMazdaChangan GroupMitsubishi GroupGeely GroupTata GroupFuji GroupBAICDongfeng
2015
10.021.1299.763.5379.612.3648.204.1697.842.0266.413.7654.888.2944.730.6383.293.6582.847.9542.418.9242.252.9911.632.9951.253.0861.156.5921.042.9331.000.453
963.185926.511839.573
2016
10.348.06310.095.64410.167.9318.987.3558.064.7406.952.4905.112.7884.994.1573.343.1762.969.7532.448.6172.348.8601.727.2901.336.9001.208.7751.102.7461.069.080
931.019990.820952.720
2020
11.194.24012.271.71111.702.64210.494.6139.064.3148.111.2272.798.4505.776.4383.819.2353.286.9393.020.3392.810.5851.836.9611.371.8041.306.4351.302.3361.661.7951.050.2941.020.0931.093.453
Increase (%) 2016-2020
8,1821,5515,0916,7712,7716,6713,4115,6614,2410,6823,3519,666,352,618,0818,1055,4412,812,9514,77
R&D Department 2016, November
Source: *International Motor Show Geneva 2016 - Data Presentation *Fakten Report „ Automobile Spezial“ 2015 – www.autofacts.com
8
Review of Top 20 manufacturers and models
TOP 20 Models
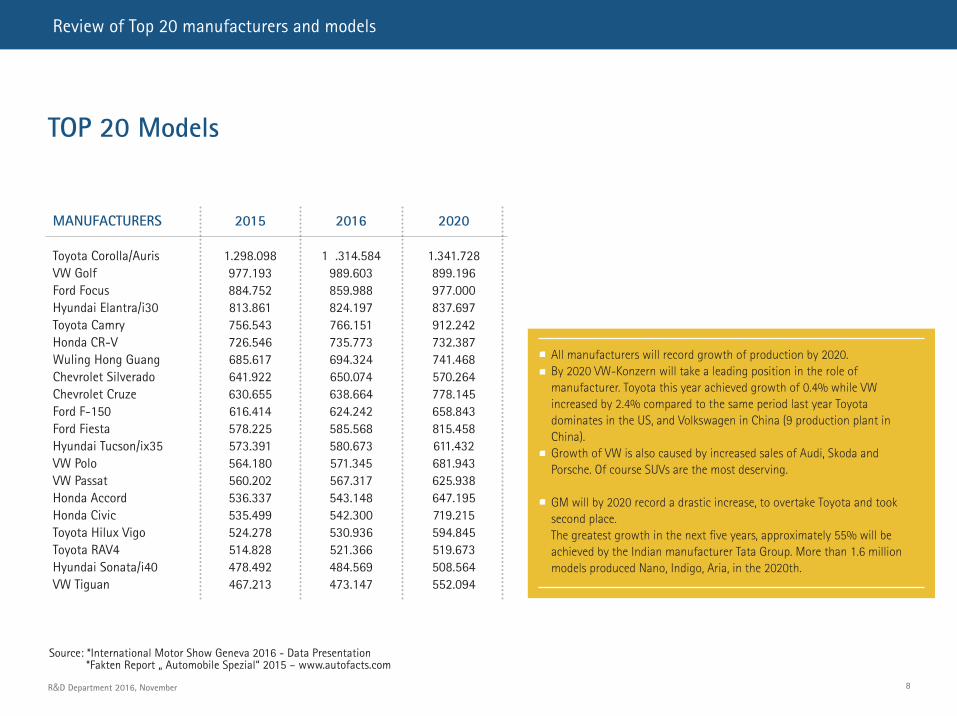
MANUFACTURERS Toyota Corolla/Auris VW Golf Ford Focus Hyundai Elantra/i30 Toyota Camry Honda CR-V Wuling Hong Guang Chevrolet Silverado Chevrolet Cruze Ford F-150 Ford Fiesta Hyundai Tucson/ix35 VW Polo VW Passat Honda Accord Honda Civic Toyota Hilux Vigo Toyota RAV4 Hyundai Sonata/i40 VW Tiguan
2015
1.298.098977.193884.752813.861756.543726.546685.617641.922630.655616.414578.225573.391564.180560.202536.337535.499524.278514.828478.492467.213
2016
1 .314.584989.603859.988824.197766.151735.773694.324650.074638.664624.242585.568580.673571.345567.317543.148542.300530.936521.366484.569473.147
2020
1.341.728899.196977.000837.697912.242732.387741.468570.264778.145658.843815.458611.432681.943625.938647.195719.215594.845519.673508.564552.094
All manufacturers will record growth of production by 2020.By 2020 VW-Konzern will take a leading position in the role of manufacturer. Toyota this year achieved growth of 0.4% while VW increased by 2.4% compared to the same period last year Toyota dominates in the US, and Volkswagen in China (9 production plant in China).Growth of VW is also caused by increased sales of Audi, Skoda and Porsche. Of course SUVs are the most deserving.
GM will by 2020 record a drastic increase, to overtake Toyota and took second place.The greatest growth in the next five years, approximately 55% will be achieved by the Indian manufacturer Tata Group. More than 1.6 million models produced Nano, Indigo, Aria, in the 2020th.
R&D Department 2016, November
Source: *International Motor Show Geneva 2016 - Data Presentation *Fakten Report „ Automobile Spezial“ 2015 – www.autofacts.com
9
Review of manufacturers and models
TOP Manufacturers worldwide
TOP Models worldwide
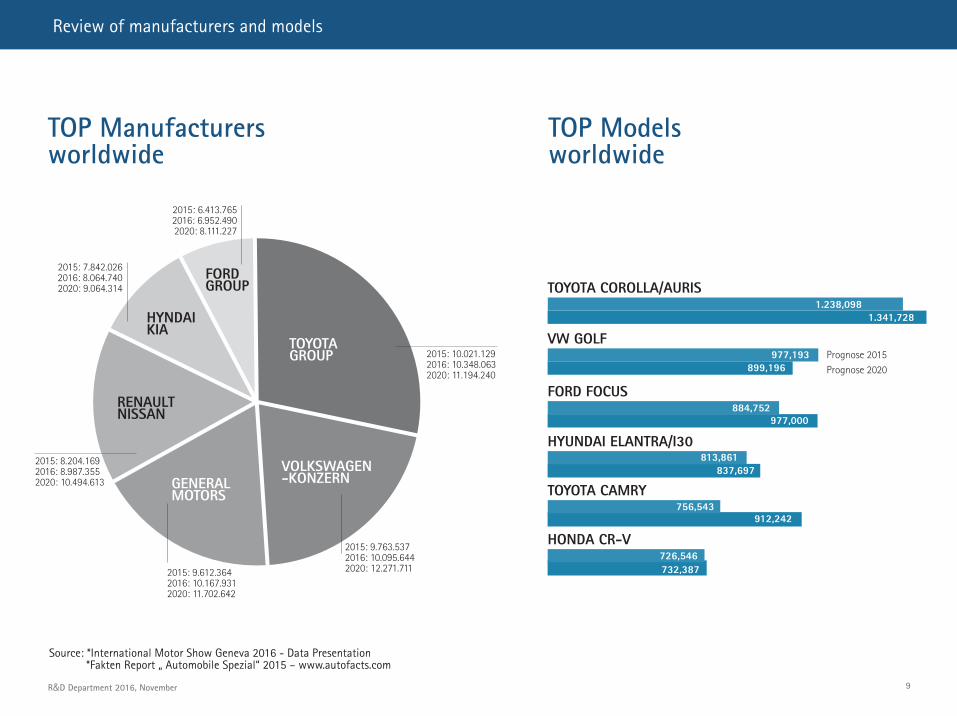
2015: 10.021.1292016: 10.348.0632020: 11.194.240
2015: 8.204.1692016: 8.987.3552020: 10.494.613
2015: 9.763.5372016: 10.095.6442020: 12.271.7112015: 9.612.364
2016: 10.167.9312020: 11.702.642
2015: 7.842.0262016: 8.064.7402020: 9.064.314
2015: 6.413.7652016: 6.952.4902020: 8.111.227
TOYOTAGROUP
FORDGROUP TOYOTA COROLLA/AURIS
VW GOLF
FORD FOCUS
HYUNDAI ELANTRA/I30
TOYOTA CAMRY
HONDA CR-V
VOLKSWAGEN-KONZERNGENERAL
MOTORS
RENAULTNISSAN
HYNDAIKIA
1.341,728
977,193
884,752977,000
813,861837,697
756,543912,242
726,546732,387
Prognose 2015Prognose 2020899,196
1.238,098
R&D Department 2016, November
Source: *International Motor Show Geneva 2016 - Data Presentation *Fakten Report „ Automobile Spezial“ 2015 – www.autofacts.com

10
New models review (2017 and 2018)
10
Q8 185.000A1 800.000A8 (D5) 200.000A6 2.000.000A5 Cabriolet 140.000
Yeti 80.000Octavia FL 1.100.000Citigo FL 210.000
MANUFACTURER MANUFACTURERMODEL 2017 QUANTITY (LT) MODEL 2017 QUANTITY (LT)MODEL 2018 QUANTITY (LT) MODEL 2018 QUANTITY (LT)
Tuareg 570.000Polo 6.700.000CC 600.000
Fiesta 6.000.000
Ibiza 1.200.000
I8 Spyder 18.500X2 1.000.000X3 650.000M5 2.300.000
Alpine 20.0000Koleos
Insignia 1.000.000Meriva (b-segment) 560.000Bolt Derivat e-auto 300.000
C3 Picasso 1.000.000
5008 450.000
Spider 37.000Alfetta 40.000
i30 4.950.000i30N
Micra 3.000.000Z 200.000
AMG GT Roadster 3.000.000GLC Brenstoffzelle 800.000E-Klasse 2.200.000
Q3 1.350.000A6 Avant 570.000A7 140.000A9 250.000Q6 e-tron 440.000
SUV Coupe Fabia FL 70.000Rapid FL 480.000
Golf VIII 4.850.000up! 1.680.000Tiguan Coupe 4.500.000Peathon E-Auto 56.000
Focus 8.000.000
Alhambra 200.000Mii 220.000
x4 210.000Z4 260.000Dreier Limousine 3.400.000Sechser 150.000
Megane RS
x4 210.000Z4 260.000Dreier Limousine 3.400.000Sechser 150.000
E-Auto 800.000Berlingo 3.000.000
Partner 1.820.000508 910.000208 2.000.000
Sportcoupe 12.000Giulietta 350.000Kompakt SUV 40.000
Tuscson Brenstoffzelle 4.130.000i40
Juke 560.000Leaf 400.000
A-Klasse 2.200.000B-Klase 1.000.000CLS 210.000GLE 900.000
R&D Department 2016, November

11
Competition overwiev
CUT & SEWWorld Market
TrimCut & Sew
40%OTHERS
30%ADIENT10%
LEAR
9%PREVENT
7%FAURECIA
3%TOYOTABOSHOKU
ADIENT
LEAR
PREVENT
FAURECIA
TOYOTA BOSHOKU
R&D Department 2016, November

12
Competition overwiev
Innovation Challenges
SMARTER CLEANER SAFER LIGHTERComfort, Convenienceand Connectivity
Efficiency andSustainability
Active and PassiveSafety
Lightweight Materialand Science
Make the entire vehicle intelligent and convenient to improve life onboard for drivers and passengers.
Use the earth’s energy most efficiently with the smallest impact to the environment over the entire vehicle lifecycle.
Create Systems to protect drivers, passengers and pedestrians in all driving situations.
Engineer the vehicle as mass efficient as possible and optimize use of raw materials.
R&D Department 2016, November

13
Global Trends
Improving the experience of a world in motionIndustrie Trends
AUTONOMOUS DRIVING (make passenger enjoys)
CONNECTIVITY (new players-Connected car: a fully digitized vehicle with Wi-Fi)
ELECTRIFICATION (Full battery electric vehicles to achieve significant worldwide success
CAR SHARING (The number of cars shared will explode from roughly 125,000 in 2016, to more than 1.3 million in 2020 in Europe alone.
SLIM & LIGHTWEIGHTSmart materialsSafety
R&D Department 2016, November

14
Global Trends
Where we are heading...
FunctionalityCOMFORT
LuxuryOffice
(passenger experience)
R&D Department 2016, November

15
Global Trends
The Industry is Shifting...
TRADITIONAL MANUFACTURERS...
><
...AND THE NEW PLAYERS
Connected car: a fully digitized vehicle with Wi-Fi; advanced infotainment systems and apps; vehicle-to-vehicle communications that let cars on the road “talk” to each other, exchanging basic safety data such as speed and position; real-time location services and routing based on traffic conditions; and networked Web links that facilitate vehicle diagnostics and repairs.
R&D Department 2016, November

16
Global Trends
Eco friendly cars becoming more popular and more common due to sevral advantages
Eco-friendly cars will remain a big hit
ENVIRONMENTALLY FRIENDLY (reduces the dependence on fossil fuels and lowers your carbon imprint on the environment.
LESS DEPENDANCE ON FOSSIL FUELS,BUILT FROM LIGHT MATERIALS (saves much energy)
FINANCIAL BENEFITS (Lower annual tax bills and exemption from congestion charges
DISADVANTAGES:Higher Maintenance Costs Lack of expertiseLack of infrastructure
R&D Department 2016, November

17
Automotive seating and Interiors Trend
Shaping the future of automotive seating
360°swivel mechanisms Lightweight seats High-end comfort adjustment for second row
GLOBALLY LEADING MECHANISMS CAPABILITIES FOR MULTI-FUNCTIONAL SEAT CONCEPTS:
Lightweight seat construction and cover materials
Advanced safety and comfort feature integration
R&D Department 2016, November

18
Automotive seating and Interiors Trend
Shaping the future of automotive interiors
SEASON COVERS (SUMMER/WINTER) CONCEPT
2 covers per seat: one for cushion and for beckrest
Base material for side and back stays the same
Covers should be exchangeable by Customer
Washable, Removable, Exchageable
WELDING-JOINT MATERIALS
new concept of making upholstery and assembling
Technology at an early stage of research and development
TECHNICAL MATERIALS for different usage like season materials (summer, winter)
WELDINGJOINTMATERIALS
R&D Department 2016, November

19
Automotive seating and Interiors Trend
New business models will demand for individualized differentiators
R&D Department 2016, November

20
Prevent Group Company Presentation in BiH Potential new market
20
Opportunities in new markets Growing outside traditional auto markets
Commercial Vehicle Seating Railway Seating Aircraft Seating
R&D Department 2016, November
21
Prevent BH d.o.o. Development Department
Topuzovo PoljeVisokoBosnia and Herzegovina
Thank youfor your attention
R&D Department 2016, November