Automotive LNG Technology
18
Automotive LNG Technology Industrial Minerals - Frac Sands Conference September 24th, 2013
Transcript of Automotive LNG Technology

Automotive LNG Technology Industrial Minerals - Frac Sands Conference September 24th, 2013

2
© 2013 PLS Logistics Services
PLS Logistics Services
PLS is the leader in industrial
logistics management services – Outsourced logistics management
– Freight Brokerage
– $600mm Freight under management
– 1,000,000+ loads annually
Network Operations Centers: – Pittsburgh, Jacksonville, Houston
Energy Services Division – Energy.plslogistics.com
Network of 22,000 Carriers
PLS Shipment Network, 12 months ending June 2013

3
© 2013 PLS Logistics Services
Motor Carrier Transportation Market Trends
4
© 2013 PLS Logistics Services
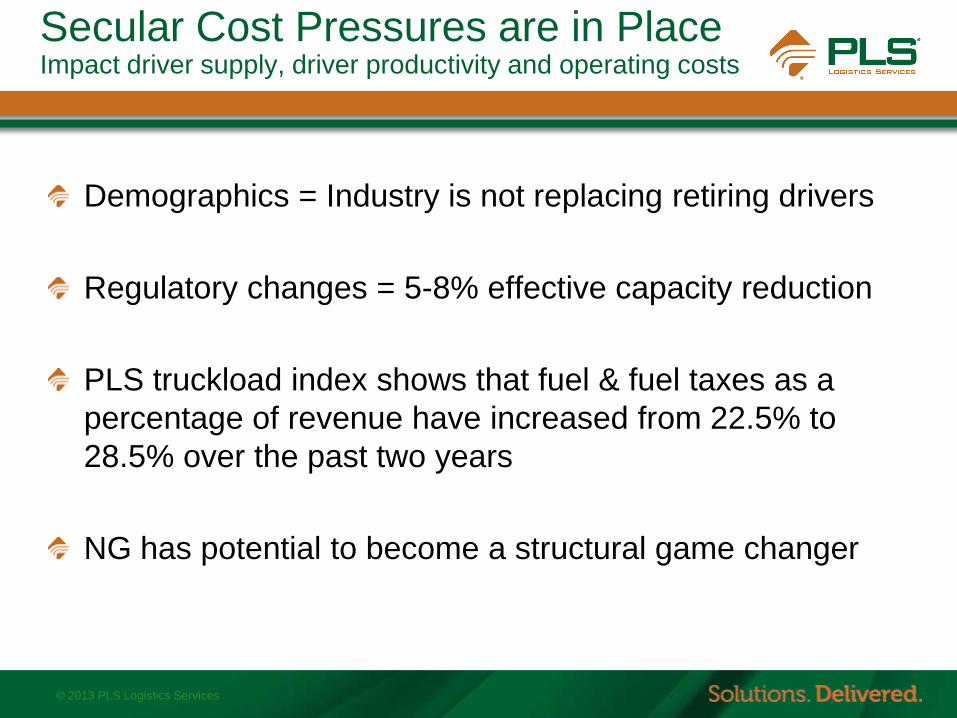
Secular Cost Pressures are in Place Impact driver supply, driver productivity and operating costs
Demographics = Industry is not replacing retiring drivers
Regulatory changes = 5-8% effective capacity reduction
PLS truckload index shows that fuel & fuel taxes as a
percentage of revenue have increased from 22.5% to
28.5% over the past two years
NG has potential to become a structural game changer

5
© 2013 PLS Logistics Services
Driver Shortage Major Constraint to Fleet Expansion
Source: Global Insight

6
© 2013 PLS Logistics Services
Diesel Fuel is a key cost
Range of fuel surcharge

7
© 2013 PLS Logistics Services
Average Rate Trends
0.90
1.00
1.10
1.20
1.30
1.40
1.50
1.60
1.70
1.80
1.90
JAN
20
10
FEB
MA
R
AP
R
MA
Y
JUN
JUL
AU
G
SEP
OC
T
NO
V
DEC
JAN
20
11
FEB
MA
R
AP
R
MA
Y
JUN
JUL
AU
G
SEP
OC
T
NO
V
DEC
JAN
20
12
FEB
MA
R
AP
R
MA
Y
JUN
JUL
AU
G
SEP
OC
T
NO
V
DEC
JAN
20
13
FEB
MA
R
AP
R
MA
Y
JUN
National Average Truckload Van & Flatbed Linehaul Rates Transcore's Truckload Rate Index
Van Contract Flatbed Contract

8
© 2013 PLS Logistics Services
Natural Gas Vehicles Adoption & Challenges in Over The Road Trucking
Technology
– NG Engines add $30,000- $80,000 to tractor costs
– LNG has driving range needed for over-the-road trucking
LNG Infrastructure
– Currently limited in the U.S.
• As of August, 75 LNG Stations (Source: DOE)
– America’s Natural Gas Highway
• CleanEnergy commitment to build a 150-station network by the end
of 2013
Trade-offs
– Additional Weight
– Lower power
– Increased maintenance

9
© 2013 PLS Logistics Services
PLS Carrier Survey: Natural Gas Vehicles 1Q 2013

10
© 2013 PLS Logistics Services
PLS Carrier Base Survey Titles/Roles of Survey Respondents
Source: PLS Logistics 2013 LNG Survey

11
© 2013 PLS Logistics Services
PLS Carrier Base Survey Fleet Sizes
Source: PLS Logistics 2013 LNG Survey

12
© 2013 PLS Logistics Services
PLS Carrier Base Survey Carrier View of LNG Impact in Over the Road Trucking
Source: PLS Logistics 2013 LNG Survey

13
© 2013 PLS Logistics Services
PLS Carrier Base Survey Carrier View of LNG Impact in Over the Road Trucking
Source: PLS Logistics 2013 LNG Survey
14
© 2013 PLS Logistics Services
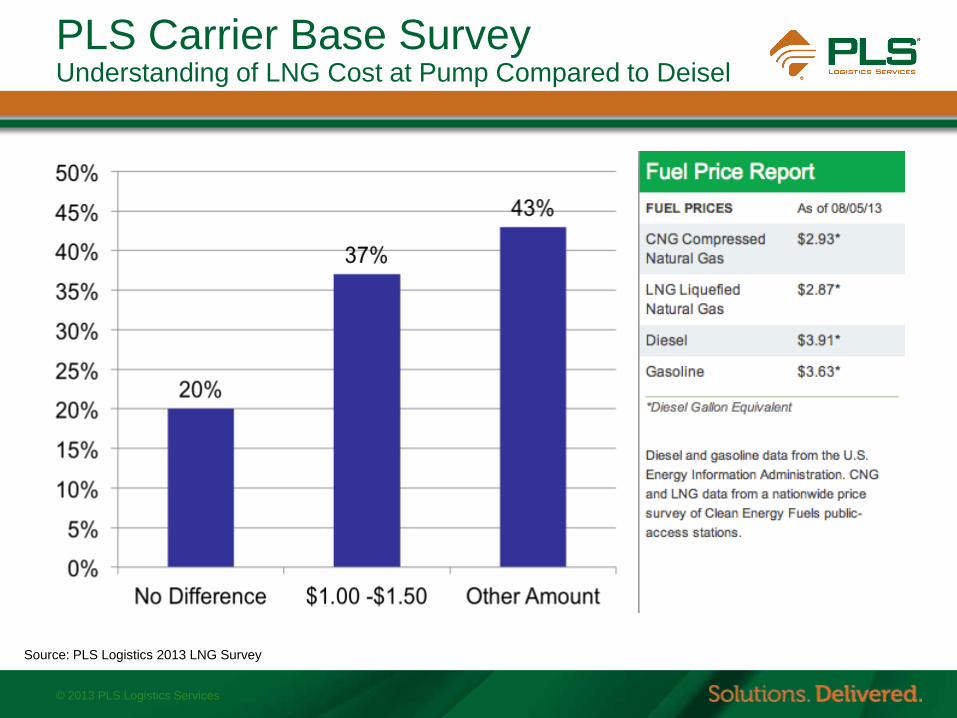
PLS Carrier Base Survey Understanding of LNG Cost at Pump Compared to Deisel
Source: PLS Logistics 2013 LNG Survey
15
© 2013 PLS Logistics Services
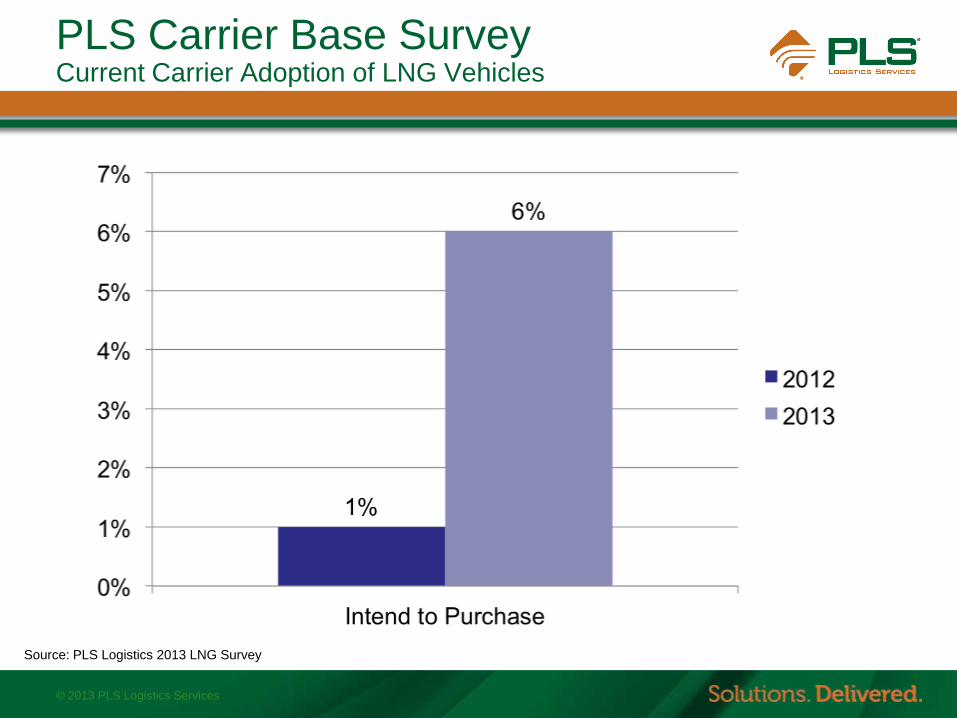
PLS Carrier Base Survey Current Carrier Adoption of LNG Vehicles
Source: PLS Logistics 2013 LNG Survey
16
© 2013 PLS Logistics Services
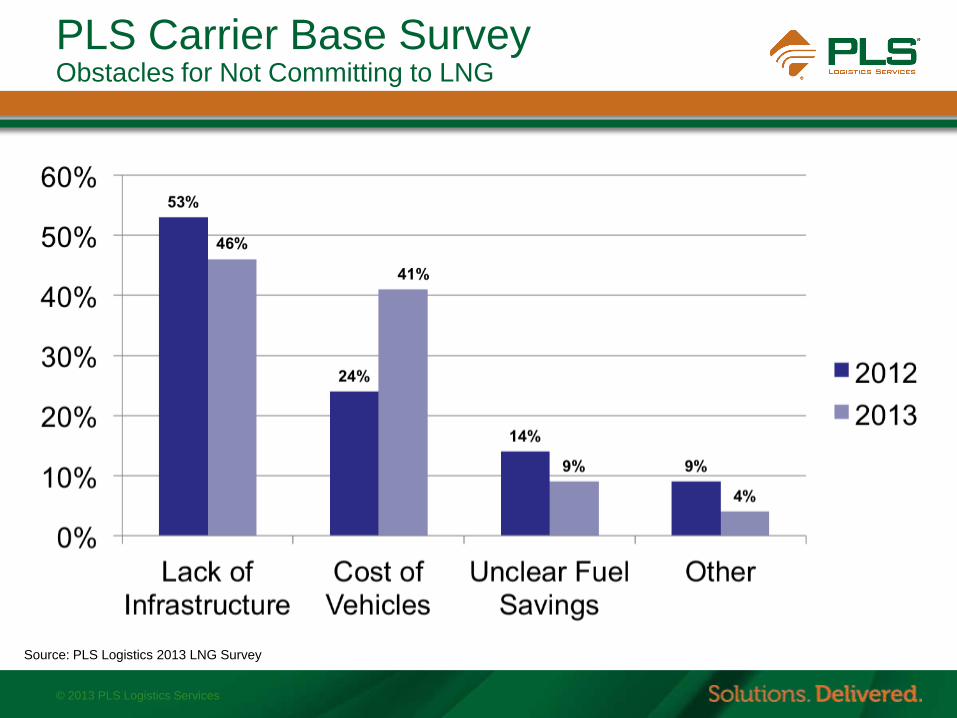
PLS Carrier Base Survey Obstacles for Not Committing to LNG
Source: PLS Logistics 2013 LNG Survey

17
© 2013 PLS Logistics Services
PLS Carrier Base Survey How Carriers View Shipper Perspective
Source: PLS Logistics 2013 LNG Survey

18
© 2013 PLS Logistics Services
Q&A
Visit us on the web at: energy.plslogistics.com
Michael Ceravolo
Director of Energy Services