Automotive Crash Box Performance Analysis and ….pdf · This paper addresses performance of crash...
7
International Journal of Science and Research (IJSR) ISSN (Online): 2319-7064 Impact Factor (2012): 3.358 Volume 3 Issue 9, September 2014 www.ijsr.net Licensed Under Creative Commons Attribution CC BY Automotive Crash Box Performance Analysis and Simulation during Frontal Rigid Barrier Crash Gangadhar Biradar 1 , Anjan Babu V.A 2 1 Assistant Professor, Mechanical Engineering Department, Guru Nanak Dev Engineering College Bidar, Karnataka, India 2 Assistant Professor, Mechanical Engineering Department, East Point College of Engineering & Technology Bangalore, Karnataka, India Abstract: In automobile design, crash and structural analysis are the two most important engineering processes in developing a high quality vehicle. Computer simulation technologies have greatly enhanced the safety, reliability, and comfort of today’s automobiles. A Rectangular cross-section Crash box was modeled in CATIA V5R14, meshed in HYPERMESH-9 and simulated in LS DYNA.The result is post processed to determine the displacement levels and energy absorption characteristics for different material models, various velocities and for different wall thickness for particular material model in the crash box, and energy management during the event. The project addresses the applicability and importance of Crash box in an automobile car. The project is carried out for three cases and they are Different Material models, Different Velocities for particular selected Material model and Different Wall thickness for particular selected Material model. This paper addresses performance of crash box in the vehicle crash worthiness applications, also its effect on energy absorbing capacity by increasing its wall thickness and the behavior of the crash box at various velocities. Keywords: Crash box, Frontal Rigid Barrier, LS DYNA. 1. Introduction The number one concern for drivers and passengers is safety. People expect driving or riding in cars to be very safe. A vehicle is expected to provide adequate protection to driver and passengers in a not so serious accident. The goal of engineering effort in the field of crashworthiness is to satisfy, or, to the extent possible, exceed the safety requirements mandated by the Federal Motor Vehicle Safety Standards (FMVSS) and administered by the National Highway Traffic Safety Administration (NHTSA). To protect the occupants of a car, there are many new tangible safety features such as airbags, crash box, seat belts, ABS brakes. Surviving a crash is all about kinetic energy. When your body is moving, it has a certain amount of kinetic energy. After the crash, when you come to a complete stop, you will have zero kinetic energy. To minimize risk of injury, you would like to remove the kinetic energy as slowly and evenly as possible. In frontal collisions, the body structure performs different functions. The front is designed to act as a crumple zone, managing and absorbing crash energy by collapsing in a controlled manner, so that the impact affects the car and not the occupants. Since the prototype laboratory tests are very costly in the design process, computer operation has been strongly demanded. In the last ten years or so, CAE (computer aided engineering) has developed a new branch Crash Simulation. The successful applications of finite element methods in this area are the key. The simulations are cheaper and faster than the real tests. Only a small number of real tests are performed for validating the simulation results and because the law requires them. Crashworthiness is a measure of the vehicle’s structural ability to plastically deform and yet maintain a sufficient survival space for its occupants in survivable crashes. This project aim is to study the Crashworthiness of a crash energy absorbing car structure. Figure 1: Bumper and Crash box The figure [1.] shows the bumper and the Crash absorber (crash box), the crash box is the main area of interest in this project work. 2. Crash Mechanics 2.1 Physical Crash Test In actual crash test the car will be made to hit the barrier at a speed of 41kph(25 mph).The car will be equipped with many accessories like dummies and Crash test mountings like accelerometers, sensors to record the crash pulse during the collision. After peak dynamic crush occurs, the vehicle rebounds from the barrier. During this period, the occupant compartment continues to experience an acceleration in the same direction as the acceleration present while crushing of the vehicle was occurring. The effects on the occupant are precisely the same as if the acceleration experienced by the occupant compartment were being produced by additional crushing of the vehicle without rebound An additional "pseudo" crush can be added to the peak dynamic crush to give a total crush. The "pseudo" crush is the amount of additional crush that would be required to produce the additional deceleration experienced by the Paper ID: SEP14383 1431
Transcript of Automotive Crash Box Performance Analysis and ….pdf · This paper addresses performance of crash...
International Journal of Science and Research (IJSR) ISSN (Online): 2319-7064
Impact Factor (2012): 3.358
Volume 3 Issue 9, September 2014 www.ijsr.net
Licensed Under Creative Commons Attribution CC BY
Automotive Crash Box Performance Analysis and Simulation during Frontal Rigid Barrier Crash
Gangadhar Biradar1, Anjan Babu V.A 2
1Assistant Professor, Mechanical Engineering Department, Guru Nanak Dev Engineering College Bidar, Karnataka, India
2Assistant Professor, Mechanical Engineering Department, East Point College of Engineering & Technology Bangalore, Karnataka, India
Abstract: In automobile design, crash and structural analysis are the two most important engineering processes in developing a high quality vehicle. Computer simulation technologies have greatly enhanced the safety, reliability, and comfort of today’s automobiles. A Rectangular cross-section Crash box was modeled in CATIA V5R14, meshed in HYPERMESH-9 and simulated in LS DYNA.The result is post processed to determine the displacement levels and energy absorption characteristics for different material models, various velocities and for different wall thickness for particular material model in the crash box, and energy management during the event. The project addresses the applicability and importance of Crash box in an automobile car. The project is carried out for three cases and they are Different Material models, Different Velocities for particular selected Material model and Different Wall thickness for particular selected Material model. This paper addresses performance of crash box in the vehicle crash worthiness applications, also its effect on energy absorbing capacity by increasing its wall thickness and the behavior of the crash box at various velocities. Keywords: Crash box, Frontal Rigid Barrier, LS DYNA. 1. Introduction The number one concern for drivers and passengers is safety. People expect driving or riding in cars to be very safe. A vehicle is expected to provide adequate protection to driver and passengers in a not so serious accident. The goal of engineering effort in the field of crashworthiness is to satisfy, or, to the extent possible, exceed the safety requirements mandated by the Federal Motor Vehicle Safety Standards (FMVSS) and administered by the National Highway Traffic Safety Administration (NHTSA). To protect the occupants of a car, there are many new tangible safety features such as airbags, crash box, seat belts, ABS brakes. Surviving a crash is all about kinetic energy. When your body is moving, it has a certain amount of kinetic energy. After the crash, when you come to a complete stop, you will have zero kinetic energy. To minimize risk of injury, you would like to remove the kinetic energy as slowly and evenly as possible. In frontal collisions, the body structure performs different functions. The front is designed to act as a crumple zone, managing and absorbing crash energy by collapsing in a controlled manner, so that the impact affects the car and not the occupants. Since the prototype laboratory tests are very costly in the design process, computer operation has been strongly demanded. In the last ten years or so, CAE (computer aided engineering) has developed a new branch Crash Simulation. The successful applications of finite element methods in this area are the key. The simulations are cheaper and faster than the real tests. Only a small number of real tests are performed for validating the simulation results and because the law requires them. Crashworthiness is a measure of the vehicle’s structural ability to plastically deform and yet maintain a sufficient
survival space for its occupants in survivable crashes. This project aim is to study the Crashworthiness of a crash energy absorbing car structure.
Figure 1: Bumper and Crash box
The figure [1.] shows the bumper and the Crash absorber (crash box), the crash box is the main area of interest in this project work. 2. Crash Mechanics 2.1 Physical Crash Test In actual crash test the car will be made to hit the barrier at a speed of 41kph(25 mph).The car will be equipped with many accessories like dummies and Crash test mountings like accelerometers, sensors to record the crash pulse during the collision. After peak dynamic crush occurs, the vehicle rebounds from the barrier. During this period, the occupant compartment continues to experience an acceleration in the same direction as the acceleration present while crushing of the vehicle was occurring. The effects on the occupant are precisely the same as if the acceleration experienced by the occupant compartment were being produced by additional crushing of the vehicle without rebound An additional "pseudo" crush can be added to the peak dynamic crush to give a total crush. The "pseudo" crush is the amount of additional crush that would be required to produce the additional deceleration experienced by the
Paper ID: SEP14383 1431
International Journal of Science and Research (IJSR) ISSN (Online): 2319-7064
Impact Factor (2012): 3.358
Volume 3 Issue 9, September 2014 www.ijsr.net
Licensed Under Creative Commons Attribution CC BY
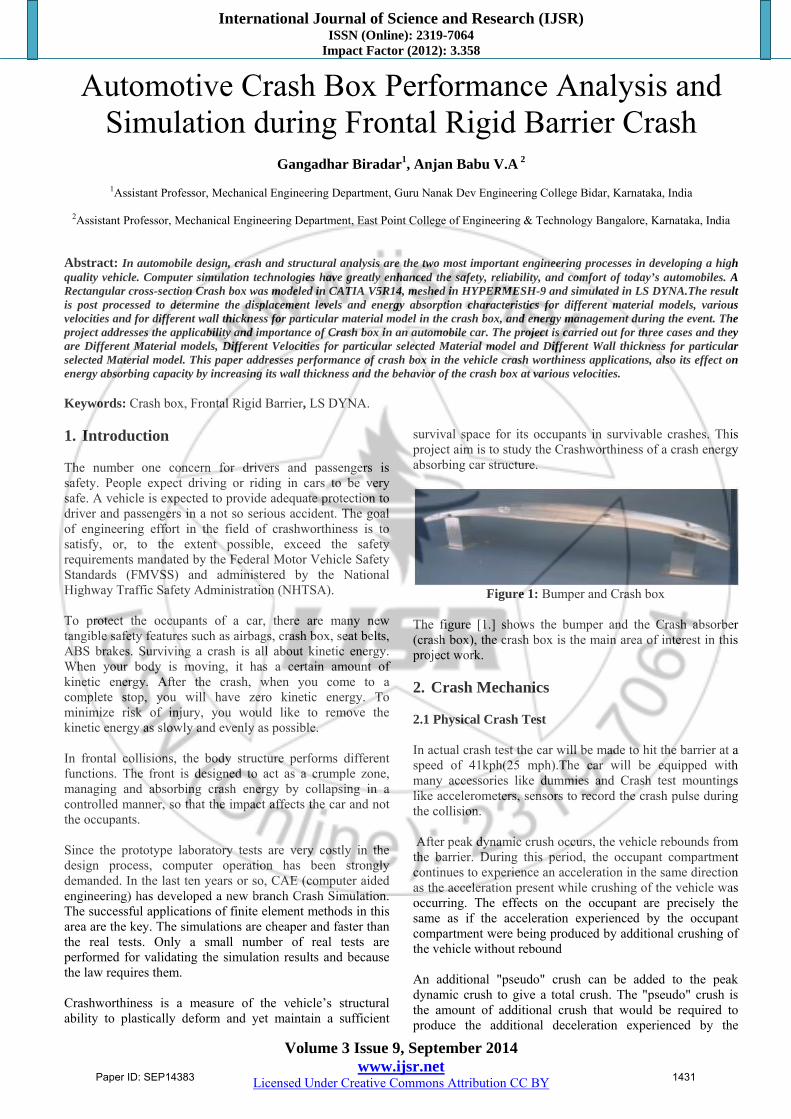
occupant compartment during the time period after the vehicle reaches zero forward velocity and the time the vehicle reaches maximum rebound velocity relative to the barrier. The amount of "pseudo" crush produced during rebound can be evaluated by considering the amount of additional area under the velocity versus time curve
produced up to the time that maximum rebound velocity is reached. It is necessary to consider only the effects up to the time of maximum rebound velocity in the actual test because this is the time period related to significant potential for injury.
Figure 2: Total Crush Concept
The occupant will be safe if the rebound velocity is decreased. And this is possible only if there is an effective crush in the frontal part of the car. This gives raise to the concept of crumple zones. 2.2 Crumple Zone and Its Importance Literature explained the purpose of a crumple zone as to increase the amount of time it takes the car to come to a complete stop in comparison to object the car hits. By increasing the time it takes for a car to come to stop after it hits the object, the force is spread over a longer period of time. Crumple zones yield during a crash, changing energy from the crash, into heat and sound, which in turn reduces the chances that the passengers in the car will be hurt. A steel block travels at a constant velocity towards a cement wall, representing an automobile without crumple zones. Initially, the block has kinetic energy, represented by the expression, mv2/2. As the block collides with the wall, it exerts a force on the wall, after which the wall exerts an equal and opposite force on the block. The magnitude of this force is illustrated by the amount of kinetic energy regained by the block. At the moment of impact, the steel block immediately rebounds in an elastic manner, regaining nearly all of its kinetic energy, and experiencing a large force. Aluminum can travels at a constant velocity towards a cement wall, representing an automobile with crumple zones. As the can collides with the wall, it does not regain all of its initial kinetic energy. Instead, some of the kinetic
energy is transferred into heat and sound energy, resulting in a smaller force experienced by the can. The energy equation governing the previous example is as follows: ½( m1v0
2) + ½( m2v02) = ½( m1vf
2) + ½( m2vf2) + KENC 2.1
Where m is mass, vo is initial velocity, and vf is the final velocity of objects 1 and 2. NC refers to non-conservative kinetic energy, or the sound and heat energy lost in the collision. This phenomenon is expressed more formally through the application of Newton's second law of motion, or:
F=ma………………………………………….. 2.2 Where a can be represented by the change in velocity over the change in time Δt, or:
a = (Vf – Vo)/Δt……………………………………2.3 m is mass, vo is initial velocity, and vf is the final velocity Substituting the previous equation for a in Newton's second law yields:
F = m{(Vf – Vo)/Δt }………………………………2.4
From this equation, it is clear that as the time of the collision decreases, the force experienced by the automobile increases dramatically. The resulting negative sign indicates direction of the force.
Paper ID: SEP14383 1432
International Journal of Science and Research (IJSR) ISSN (Online): 2319-7064
Impact Factor (2012): 3.358
Volume 3 Issue 9, September 2014 www.ijsr.net
Licensed Under Creative Commons Attribution CC BY
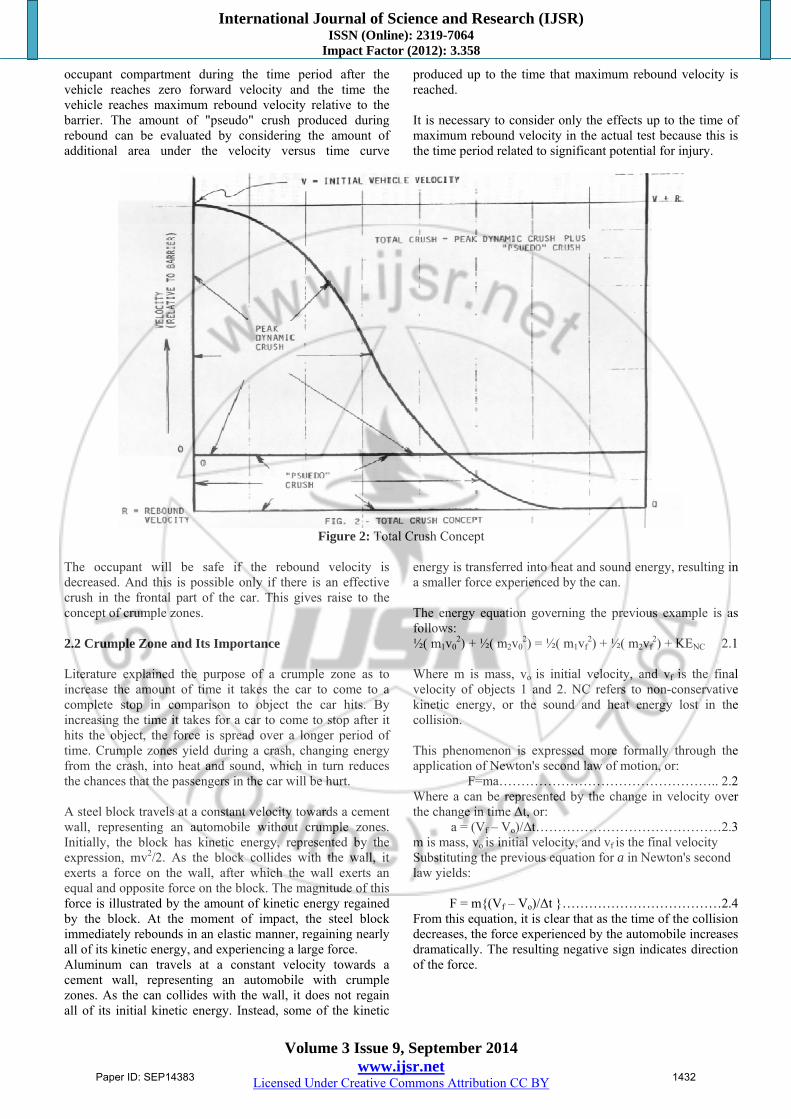
Figure 3: Effect of Crumple Zones
3. FE Model -Validation Using Bench Mark
Test A Bench mark test of impacting a rigid ball on a deformable plate is simulated. Matching the energy plots and acceleration plots will ensures the right material models and element types for the type of analysis. Bench mark test model contain a deformable plate and a rigid ball. Physical parameters of the model are. Deformable plate of size 150mm X150mm X 2.5mm Rigid Ball of 76 mm dia. and Mass: 1.769Kg. 3.1 Material Details for the Model
Table 1: Material Details for the Bench mark Model
Component Material E
( N/mm2 ) Nu
Rho ( N/mm2 )
Plate Steel 2.00E+5 0.3 7.80E-9
Ball Rigid 2.05E+5 0.3 Negligible
3.2 FE Details for Deformable plate and Rigid ball The model is prepared using Hypermesh pre-processor the deformable plate is meshed by Quad 4 noded element and Rigid ball meshed with Hexa 8 noded element, which is
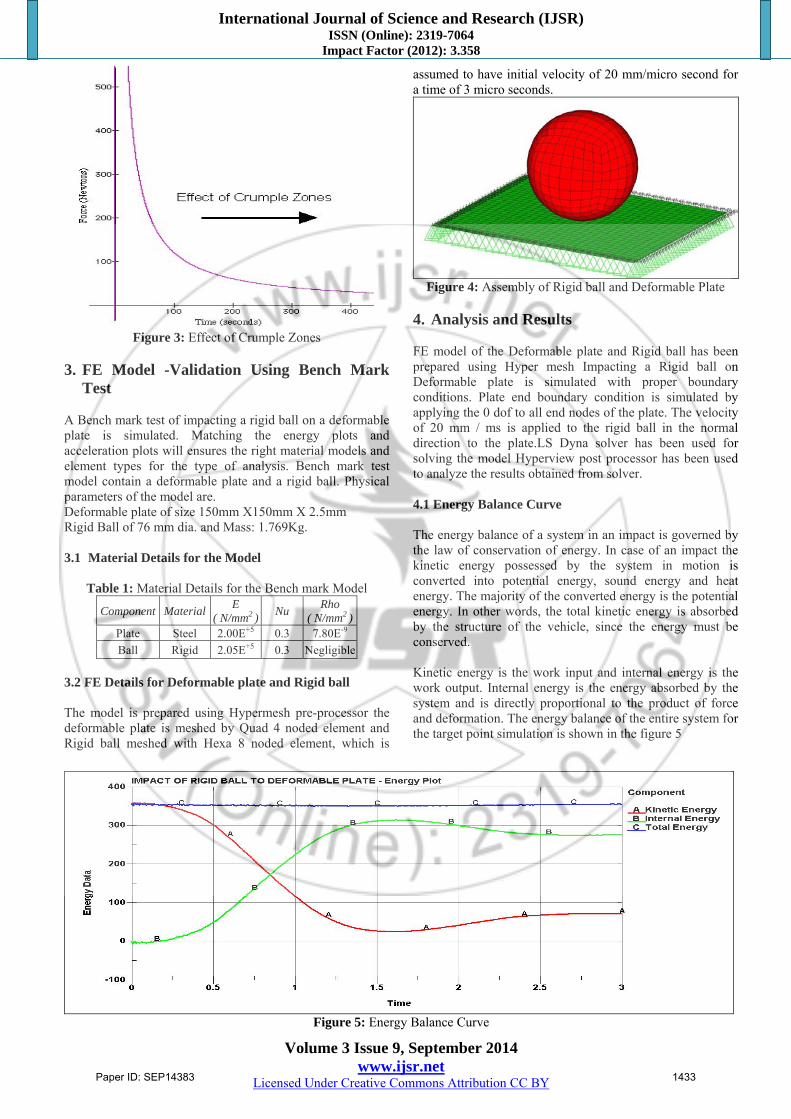
assumed to have initial velocity of 20 mm/micro second for a time of 3 micro seconds.
Figure 4: Assembly of Rigid ball and Deformable Plate
4. Analysis and Results FE model of the Deformable plate and Rigid ball has been prepared using Hyper mesh Impacting a Rigid ball on Deformable plate is simulated with proper boundary conditions. Plate end boundary condition is simulated by applying the 0 dof to all end nodes of the plate. The velocity of 20 mm / ms is applied to the rigid ball in the normal direction to the plate.LS Dyna solver has been used for solving the model Hyperview post processor has been used to analyze the results obtained from solver. 4.1 Energy Balance Curve The energy balance of a system in an impact is governed by the law of conservation of energy. In case of an impact the kinetic energy possessed by the system in motion is converted into potential energy, sound energy and heat energy. The majority of the converted energy is the potential energy. In other words, the total kinetic energy is absorbed by the structure of the vehicle, since the energy must be conserved. Kinetic energy is the work input and internal energy is the work output. Internal energy is the energy absorbed by the system and is directly proportional to the product of force and deformation. The energy balance of the entire system for the target point simulation is shown in the figure 5
Figure 5: Energy Balance Curve
Paper ID: SEP14383 1433
International Journal of Science and Research (IJSR) ISSN (Online): 2319-7064
Impact Factor (2012): 3.358
Volume 3 Issue 9, September 2014 www.ijsr.net
Licensed Under Creative Commons Attribution CC BY
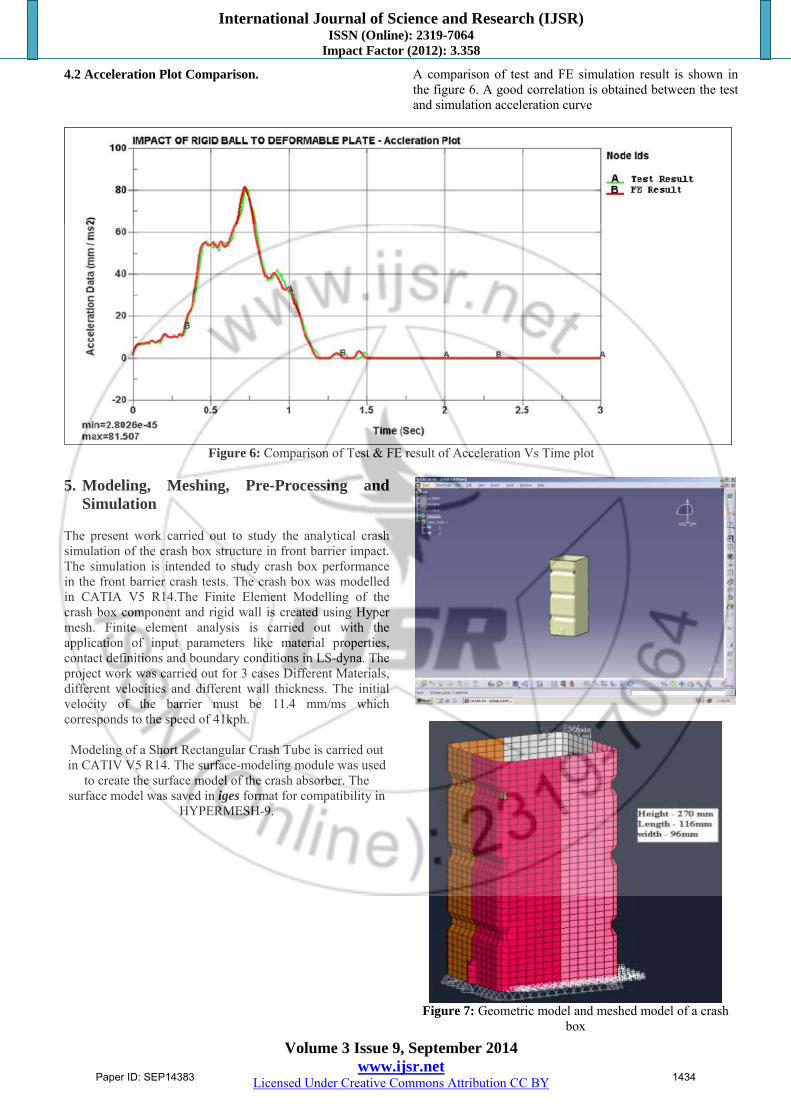
4.2 Acceleration Plot Comparison. A comparison of test and FE simulation result is shown in the figure 6. A good correlation is obtained between the test and simulation acceleration curve
Figure 6: Comparison of Test & FE result of Acceleration Vs Time plot
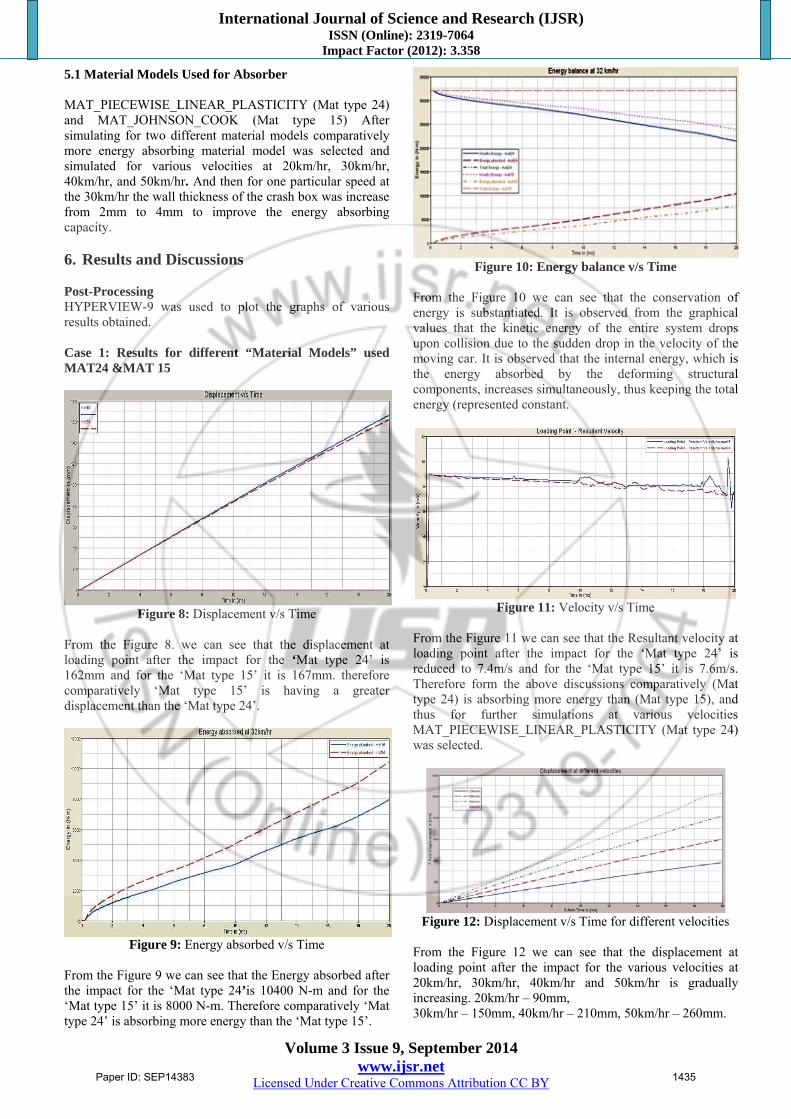
5. Modeling, Meshing, Pre-Processing and
Simulation The present work carried out to study the analytical crash simulation of the crash box structure in front barrier impact. The simulation is intended to study crash box performance in the front barrier crash tests. The crash box was modelled in CATIA V5 R14.The Finite Element Modelling of the crash box component and rigid wall is created using Hyper mesh. Finite element analysis is carried out with the application of input parameters like material properties, contact definitions and boundary conditions in LS-dyna. The project work was carried out for 3 cases Different Materials, different velocities and different wall thickness. The initial velocity of the barrier must be 11.4 mm/ms which corresponds to the speed of 41kph. Modeling of a Short Rectangular Crash Tube is carried out in CATIV V5 R14. The surface-modeling module was used
to create the surface model of the crash absorber. The surface model was saved in iges format for compatibility in
HYPERMESH-9.
Figure 7: Geometric model and meshed model of a crash
box
Paper ID: SEP14383 1434
International Journal of Science and Research (IJSR) ISSN (Online): 2319-7064
Impact Factor (2012): 3.358
Volume 3 Issue 9, September 2014 www.ijsr.net
Licensed Under Creative Commons Attribution CC BY
5.1 Material Models Used for Absorber MAT_PIECEWISE_LINEAR_PLASTICITY (Mat type 24) and MAT_JOHNSON_COOK (Mat type 15) After simulating for two different material models comparatively more energy absorbing material model was selected and simulated for various velocities at 20km/hr, 30km/hr, 40km/hr, and 50km/hr. And then for one particular speed at the 30km/hr the wall thickness of the crash box was increase from 2mm to 4mm to improve the energy absorbing capacity. 6. Results and Discussions Post-Processing HYPERVIEW-9 was used to plot the graphs of various results obtained. Case 1: Results for different “Material Models” used MAT24 &MAT 15
Figure 8: Displacement v/s Time
From the Figure 8. we can see that the displacement at loading point after the impact for the ‘Mat type 24’ is 162mm and for the ‘Mat type 15’ it is 167mm. therefore comparatively ‘Mat type 15’ is having a greater displacement than the ‘Mat type 24’.
Figure 9: Energy absorbed v/s Time
From the Figure 9 we can see that the Energy absorbed after the impact for the ‘Mat type 24’is 10400 N-m and for the ‘Mat type 15’ it is 8000 N-m. Therefore comparatively ‘Mat type 24’ is absorbing more energy than the ‘Mat type 15’.
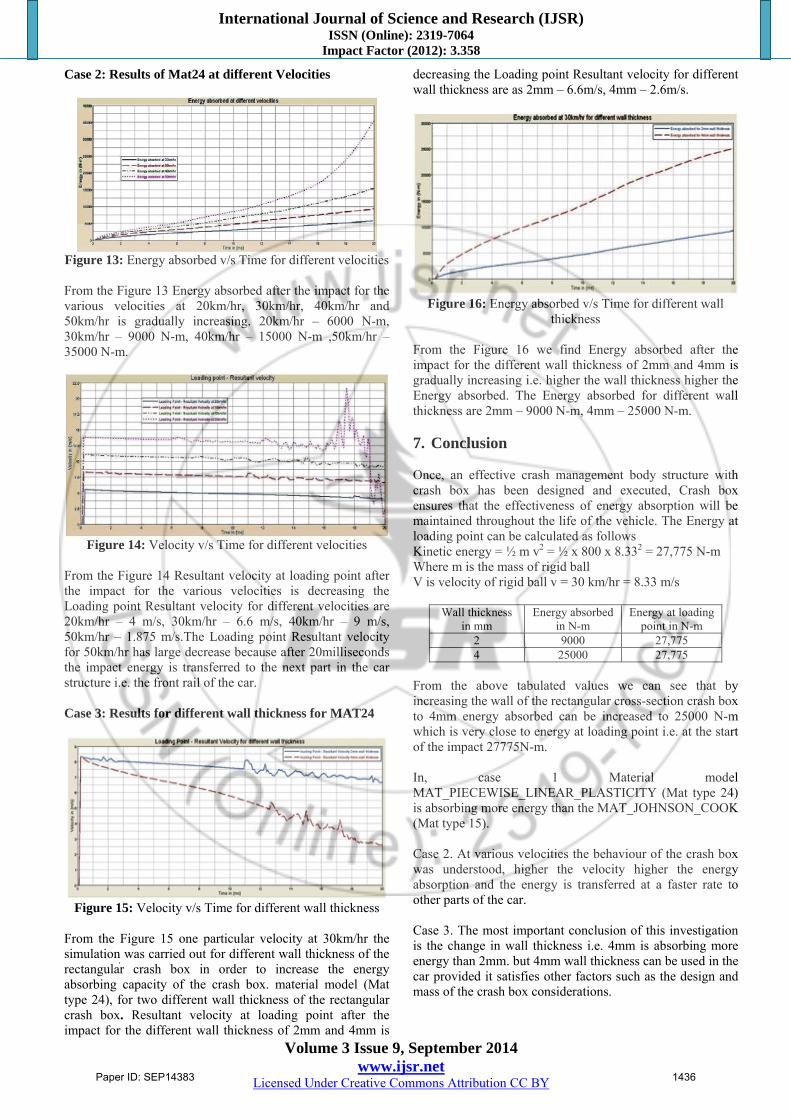
Figure 10: Energy balance v/s Time
From the Figure 10 we can see that the conservation of energy is substantiated. It is observed from the graphical values that the kinetic energy of the entire system drops upon collision due to the sudden drop in the velocity of the moving car. It is observed that the internal energy, which is the energy absorbed by the deforming structural components, increases simultaneously, thus keeping the total energy (represented constant.
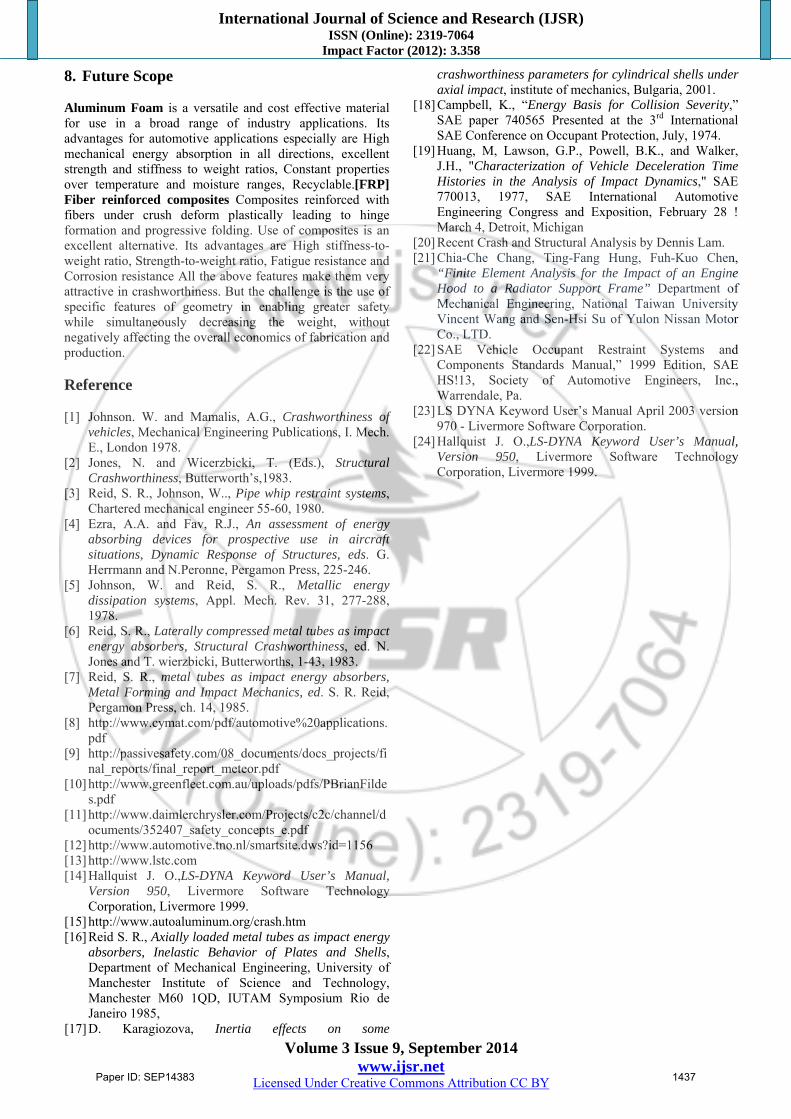
Figure 11: Velocity v/s Time
From the Figure 11 we can see that the Resultant velocity at loading point after the impact for the ‘Mat type 24’ is reduced to 7.4m/s and for the ‘Mat type 15’ it is 7.6m/s. Therefore form the above discussions comparatively (Mat type 24) is absorbing more energy than (Mat type 15), and thus for further simulations at various velocities MAT_PIECEWISE_LINEAR_PLASTICITY (Mat type 24) was selected.
Figure 12: Displacement v/s Time for different velocities
From the Figure 12 we can see that the displacement at loading point after the impact for the various velocities at 20km/hr, 30km/hr, 40km/hr and 50km/hr is gradually increasing. 20km/hr – 90mm, 30km/hr – 150mm, 40km/hr – 210mm, 50km/hr – 260mm.
Paper ID: SEP14383 1435
International Journal of Science and Research (IJSR) ISSN (Online): 2319-7064
Impact Factor (2012): 3.358
Volume 3 Issue 9, September 2014 www.ijsr.net
Licensed Under Creative Commons Attribution CC BY
Case 2: Results of Mat24 at different Velocities
Figure 13: Energy absorbed v/s Time for different velocities From the Figure 13 Energy absorbed after the impact for the various velocities at 20km/hr, 30km/hr, 40km/hr and 50km/hr is gradually increasing. 20km/hr – 6000 N-m, 30km/hr – 9000 N-m, 40km/hr – 15000 N-m ,50km/hr – 35000 N-m.
Figure 14: Velocity v/s Time for different velocities
From the Figure 14 Resultant velocity at loading point after the impact for the various velocities is decreasing the Loading point Resultant velocity for different velocities are 20km/hr – 4 m/s, 30km/hr – 6.6 m/s, 40km/hr – 9 m/s, 50km/hr – 1.875 m/s.The Loading point Resultant velocity for 50km/hr has large decrease because after 20milliseconds the impact energy is transferred to the next part in the car structure i.e. the front rail of the car. Case 3: Results for different wall thickness for MAT24
Figure 15: Velocity v/s Time for different wall thickness
From the Figure 15 one particular velocity at 30km/hr the simulation was carried out for different wall thickness of the rectangular crash box in order to increase the energy absorbing capacity of the crash box. material model (Mat type 24), for two different wall thickness of the rectangular crash box. Resultant velocity at loading point after the impact for the different wall thickness of 2mm and 4mm is
decreasing the Loading point Resultant velocity for different wall thickness are as 2mm – 6.6m/s, 4mm – 2.6m/s.
Figure 16: Energy absorbed v/s Time for different wall
thickness From the Figure 16 we find Energy absorbed after the impact for the different wall thickness of 2mm and 4mm is gradually increasing i.e. higher the wall thickness higher the Energy absorbed. The Energy absorbed for different wall thickness are 2mm – 9000 N-m, 4mm – 25000 N-m. 7. Conclusion Once, an effective crash management body structure with crash box has been designed and executed, Crash box ensures that the effectiveness of energy absorption will be maintained throughout the life of the vehicle. The Energy at loading point can be calculated as follows Kinetic energy = ½ m v2 = ½ x 800 x 8.332 = 27,775 N-m Where m is the mass of rigid ball V is velocity of rigid ball v = 30 km/hr = 8.33 m/s
Wall thickness in mm
Energy absorbed in N-m
Energy at loading point in N-m
2 9000 27,775 4 25000 27,775
From the above tabulated values we can see that by increasing the wall of the rectangular cross-section crash box to 4mm energy absorbed can be increased to 25000 N-m which is very close to energy at loading point i.e. at the start of the impact 27775N-m. In, case 1 Material model MAT_PIECEWISE_LINEAR_PLASTICITY (Mat type 24) is absorbing more energy than the MAT_JOHNSON_COOK (Mat type 15). Case 2. At various velocities the behaviour of the crash box was understood, higher the velocity higher the energy absorption and the energy is transferred at a faster rate to other parts of the car. Case 3. The most important conclusion of this investigation is the change in wall thickness i.e. 4mm is absorbing more energy than 2mm. but 4mm wall thickness can be used in the car provided it satisfies other factors such as the design and mass of the crash box considerations.
Paper ID: SEP14383 1436
International Journal of Science and Research (IJSR) ISSN (Online): 2319-7064
Impact Factor (2012): 3.358
Volume 3 Issue 9, September 2014 www.ijsr.net
Licensed Under Creative Commons Attribution CC BY
8. Future Scope Aluminum Foam is a versatile and cost effective material for use in a broad range of industry applications. Its advantages for automotive applications especially are High mechanical energy absorption in all directions, excellent strength and stiffness to weight ratios, Constant properties over temperature and moisture ranges, Recyclable.[FRP] Fiber reinforced composites Composites reinforced with fibers under crush deform plastically leading to hinge formation and progressive folding. Use of composites is an excellent alternative. Its advantages are High stiffness-to-weight ratio, Strength-to-weight ratio, Fatigue resistance and Corrosion resistance All the above features make them very attractive in crashworthiness. But the challenge is the use of specific features of geometry in enabling greater safety while simultaneously decreasing the weight, without negatively affecting the overall economics of fabrication and production. Reference
[1] Johnson. W. and Mamalis, A.G., Crashworthiness of
vehicles, Mechanical Engineering Publications, I. Mech. E., London 1978.
[2] Jones, N. and Wicerzbicki, T. (Eds.), Structural Crashworthiness, Butterworth’s,1983.
[3] Reid, S. R., Johnson, W.., Pipe whip restraint systems, Chartered mechanical engineer 55-60, 1980.
[4] Ezra, A.A. and Fav, R.J., An assessment of energy absorbing devices for prospective use in aircraft situations, Dynamic Response of Structures, eds. G. Herrmann and N.Peronne, Pergamon Press, 225-246.
[5] Johnson, W. and Reid, S. R., Metallic energy dissipation systems, Appl. Mech. Rev. 31, 277-288, 1978.
[6] Reid, S. R., Laterally compressed metal tubes as impact energy absorbers, Structural Crashworthiness, ed. N. Jones and T. wierzbicki, Butterworths, 1-43, 1983.
[7] Reid, S. R., metal tubes as impact energy absorbers, Metal Forming and Impact Mechanics, ed. S. R. Reid, Pergamon Press, ch. 14, 1985.
[8] http://www.cymat.com/pdf/automotive%20applications.pdf
[9] http://passivesafety.com/08_documents/docs_projects/final_reports/final_report_meteor.pdf
[10] http://www.greenfleet.com.au/uploads/pdfs/PBrianFildes.pdf
[11] http://www.daimlerchrysler.com/Projects/c2c/channel/documents/352407_safety_concepts_e.pdf
[12] http://www.automotive.tno.nl/smartsite.dws?id=1156 [13] http://www.lstc.com [14] Hallquist J. O.,LS-DYNA Keyword User’s Manual,
Version 950, Livermore Software Technology Corporation, Livermore 1999.
[15] http://www.autoaluminum.org/crash.htm [16] Reid S. R., Axially loaded metal tubes as impact energy
absorbers, Inelastic Behavior of Plates and Shells, Department of Mechanical Engineering, University of Manchester Institute of Science and Technology, Manchester M60 1QD, IUTAM Symposium Rio de Janeiro 1985,
[17] D. Karagiozova, Inertia effects on some
crashworthiness parameters for cylindrical shells under axial impact, institute of mechanics, Bulgaria, 2001.
[18] Campbell, K., “Energy Basis for Collision Severity,” SAE paper 740565 Presented at the 3rd International SAE Conference on Occupant Protection, July, 1974.
[19] Huang, M, Lawson, G.P., Powell, B.K., and Walker, J.H., "Characterization of Vehicle Deceleration Time Histories in the Analysis of Impact Dynamics," SAE 770013, 1977, SAE International Automotive Engineering Congress and Exposition, February 28 ! March 4, Detroit, Michigan
[20] Recent Crash and Structural Analysis by Dennis Lam. [21] Chia-Che Chang, Ting-Fang Hung, Fuh-Kuo Chen,
“Finite Element Analysis for the Impact of an Engine Hood to a Radiator Support Frame” Department of Mechanical Engineering, National Taiwan University Vincent Wang and Sen-Hsi Su of Yulon Nissan Motor Co., LTD.
[22] SAE Vehicle Occupant Restraint Systems and Components Standards Manual,” 1999 Edition, SAE HS!13, Society of Automotive Engineers, Inc., Warrendale, Pa.
[23] LS DYNA Keyword User’s Manual April 2003 version 970 - Livermore Software Corporation.
[24] Hallquist J. O.,LS-DYNA Keyword User’s Manual, Version 950, Livermore Software Technology Corporation, Livermore 1999.
Paper ID: SEP14383 1437


![Perancangan Dan Pengembangan Produk Crash Box [Makalah][Revisi]](https://static.fdocuments.net/doc/165x107/55cf96ec550346d0338ead0c/perancangan-dan-pengembangan-produk-crash-box-makalahrevisi.jpg)