Automation of Capture and Labelling of Cancer Cells with ...
9
1 INTRODUCTION AIM This application note describes the use of Fluigent Aria – a software-assisted instrument capable of delivering of up to 10 different solutions – for the automation of a complete protocol of capture and labelling of MDA-MB-231 breast cancer cells including surface treatment, injection of antibodies-coated beads and cell suspension, and immunostaining steps. CONTEXT Cell capture and labelling are usually time consuming processes that can last for several hours, and often require exposure to multiple fluids. As an example, typical staining protocols usually require more than 5 consecutive solutions. Cell labelling, cell manipulation, drug screening or perfusion also demand very precise injection volumes with the use of controlled flow rates (ranging from 1 µL/min to 1 000 µL/min) in order to perform reproducible experiments. Smooth fluid control is also recommended as uncontrolled flow rates can create high shear stresses, subsequently affecting cell functional properties and damaging samples. Aria is the perfect instrument to address these concerns and automate fluid delivery protocols. Specific needs for circulating tumor cell sorting: Metastases occur frequently and are responsible for about 90% of cancer deaths 1 . They result from the breakout of malignant cells, named Circulating tumor cells (CTCs), from the primary tumour site. CTC enter AUTOMATION OF CAPTURE AND LABELLING OF CANCER CELLS WITH ARIA Figure 1: CTCs pathway, Capture and Analysis of Circulating Tumor Cells in Microfluidics: From Conception to Clinica Validation, Julien Autebert, Physico-Chimie Curie, UMR168, 2013 the blood through an intravasation process, disseminate into distant organs and initiate new metastasis 2 (Figure 1). Because blood can be easily sampled and analyzed, CTCs are particularly interesting as metastasis-related biomarkers 3 . Further-more, CTC count is used as a dynamic biomarker correlated to treatment efficacy of breast cancer patients 4 . However, the search for CTCs in blood is a strong challenge as their concentration is extremely low: in 1 milliliter of blood, about 1 CTC is found among ten million white blood cells and billions of red blood cells 1 .
Transcript of Automation of Capture and Labelling of Cancer Cells with ...

1
INTRODUCTIONAIMThis application note describes the use of Fluigent Aria – a software-assisted instrument capable of delivering of up to 10 different solutions – for the automation of a complete protocol of capture and labelling of MDA-MB-231 breast cancer cells including surface treatment, injection of antibodies-coated beads and cell suspension, and immunostaining steps.
CONTEXT Cell capture and labelling are usually time consuming processes that can last for several hours, and often require exposure to multiple fluids. As an example, typical staining protocols usually require more than 5 consecutive solutions. Cell labelling, cell manipulation, drug screening or perfusion also demand very precise injection volumes with the use of controlled flow rates (ranging from 1 µL/min to 1 000 µL/min) in order to perform reproducible experiments. Smooth fluid control is also recommended as uncontrolled flow rates can create high shear stresses, subsequently affecting cell functional properties and damaging samples. Aria is the perfect instrument to address these concerns and automate fluid delivery protocols.
Specific needs for circulating tumor cell sorting: Metastases occur frequently and are responsible for about 90% of cancer deaths1. They result from the breakout of malignant cells, named Circulating tumor cells (CTCs), from the primary tumour site. CTC enter
AUTOMATION OF CAPTURE AND LABELLING OF CANCER CELLS WITH ARIA
Figure 1: CTCs pathway, Capture and Analysis of Circulating Tumor Cells in Microfluidics: From Conception to Clinica Validation, Julien Autebert,
Physico-Chimie Curie, UMR168, 2013
the blood through an intravasation process, disseminate into distant organs and initiate new metastasis2 (Figure 1).
Because blood can be easily sampled and analyzed, CTCs are particularly interesting as metastasis-related biomarkers3. Further-more, CTC count is used as a dynamic biomarker correlated to treatment efficacy of breast cancer patients4. However, the search for CTCs in blood is a strong challenge as their concentration is extremely low: in 1 milliliter of blood, about 1 CTC is found among ten million white blood cells and billions of red blood cells1.

2
Various techniques for capture and analysis of CTCs have been proposed. Many capture devices make use of antibodies directed against cancer cell membrane to capture tumor cells. A commonly used capture molecule is the EpCAM (Epithelial Cell Adhesion Molecule) antibody: a transmembrane glycoprotein mediating Ca2+-independent homotypic cell–cell adhesion in epithelia. As EpCAM is overexpressed by CTC’s and not expressed by white and red blood cells, it can be used as diagnostic marker for various cancers in blood samples.
CHALLENGE We describe the automation of a rare cell capture and detection method including surface treatment, beads and cells solution injections, and immunostaining using precise volume control using Aria and its related automation software. We use the EPHESIA microfluidic chip from Institut Curie and MDA-MB-231 breast cancer cell line as a demonstration of system function and utility.
MATERIALS AND METHODS
APPLICATION NOTE
Figure 2: System setup. Aria and a valve are connected to the EPHESIA microfluidic chip, which is placed in a coil. Visualization of the chip channels is performed using an optical mi-croscope in bright field or fluorescence mode
Aria is connected to a pressure source and a computer for real-time flow control. Aria comes with a valve that directs the flow either to the chip or to the waste. The microfluidic chip is connected to Aria via 1/16 in. transparent tubes with PEEK fittings. The tubing is cut in order that the system is as close as possible to the chip to reduce swept volume. The microfluidic chip is placed in a water-cooled electro-magnetic coil (Figure 3) and the microfluidic channels are visualized using an optical microscope in bright field or fluorescence mode.
The fluidic delivery protocol of the experiment is entirely automated using the Aria Automation Software: allowing to set injection parameters based on time or volume, and desired flow-rate values.
Figure 3: Microfluidic chip placed in an electromagnetic coil and
connected to the tubing
SYSTEM SETUP

3
APPLICATION NOTE
EPHESIA:A MICROFLUIDIC DEVICE FOR CANCER CELLS CAPTURE AND ANALYSIS To achieve sufficient sensitivity and sensibility, Institut Curie has developed the “EPHESIA” microfluidic device shown in Figure 5. CTC capture is based on the specific EpCam antigen-antibody reaction. EpCam coated magnetic beads are arranged into a sieve of columns inside the chip to increase the probability of contact with CTC (Figure 4). The sample to analyze is pumped through the chip and the CTC’s captured on the columns are counted and analyzed. Another substantial added value of magnetic beads is the possibility to retrieve the CTC’s captured at the end of the experiment to perform additionnal analysis. EPHESIA chips have a specific architecture. The channel geometry is a tree-like architecture that splits the flow into multiple channels in order to increase the flow velocity uniformity within main chambers. The two-layered chip is made of COC (cyclic olefin copolymer). The top layer contains the microfluidic channels as well as the inlet and outlet ports. The bottom section is made of two capture zones which contain 48 000 holes that will contain the anchor magnetic beads. Each hole is filled with approximately ten beads before bonding the two layers of the chip together. Anchored beads withstand hydrodynamic flow and maintain column stability during the capture and analysis process.
Figure 4: Schematic illustration of the capture of cells in a self-assembled array of magnetic beads guided by a magnetic pattern6
Figure 5: Diagram and photography of the EPHESIA cell capture chip5
The microfluidic chip is placed in an electro-magnetic coil to generate a uniform magnetic field in the center of the chip. A suspension containing EpCAM coated magnetic beads is injected, and magnetic columns are formed on the anchorage arrays. It is then possible to inject cell solutions. Cells expressing EpCAM antigen will specifically bind to EpCAM-coated beads (Figure 4). Captured cells can be visualized and counted using fluorescence microscopy.

4
APPLICATION NOTE
IMMUNOFLUORESCENCE Cells were labelled with Hoechst to stain the nucleus, and Phalloidin to visualize actin filaments. Cells were previously genetically modified to express GFP in the area of damaged DNA within the nucleus.
AUTOMATED CELL CAPTURE AND LABELLING The complete fluidic delivery protocol of the experiment is presented in Figure 7.
Figure 6: Scheme representing the microfluidic setup and the solutions injected during the protocolFigure 7: Sequential injection automated protocol using Aria Automation Software
VALVES

5
APPLICATION NOTE
Protocol Steps
Setup preparation and surface treatment: Before injecting the various liquids, a prefill step using PBS is required to fill empty tubing of the system and calibrate Aria. Once the prefill is completed, the chip is flushed with ethanol using a flow-rate of 200 µL/min for 2 minutes to wet the microfluidic channels and create a sterile environment for cell manipulation. The system is next flushed with distilled water using a flow-rate of 200 µL/min for 1 minute. A surface treatment is then performed to prevent non-specific adsorption of beads, cells or proteins: Pluronic acid F-127 is injected in the chip using a flow-rate of 200 µl/min for 1 minute and incubated for 1 hour. In Aria’s software the function “Wait” was used to set 1 hour incubation time before automatically restarting, as shown in Figure 8. A washing step follows: PBS + 1% BSA is injected using a flow-rate of 50 µL/min for 2 minutes
Figure 8: Software snapshot of the protocol showing the “Wait” feature
Beads injection and column self-assembly: After the sur-face treatment is performed, anti-EpCAM antibodies-coated beads are injected in the mi-crofluidic chip using a flow-rate of 200 µL/min for 1 minute. A magnetic field perpendicular to the chip bottom layer is turned on. The magnetic beads self-assemble into columns that are spontaneously anchored on the magnetic patterns. The result is a sieve made of magnetic bead columns.
Cells injection and capture: Once columns are formed within the microfluidic chip, a 300 µL solution containing ~15 000 MDA-MB-231 cells is subsequently injected using a flow-rate of 50 µL/min for 2 minutes. Injection flow rate has been optimized to avoid destruction of the sieve of magnetic beads.
Fixation, permeabilization and staining: Paraformaldehyde is injected in the chip to fix captured cells. After a programmed incubation time of 20 minutes, a permeabilization step follows: Triton-X is injected at 50 µL/min for 4 minutes. It is possible to observe the stable flow-rate injection of Triton-X in Figure 9.
Figure 9: Triton X injection step and related flow-rate control
6
APPLICATION NOTE
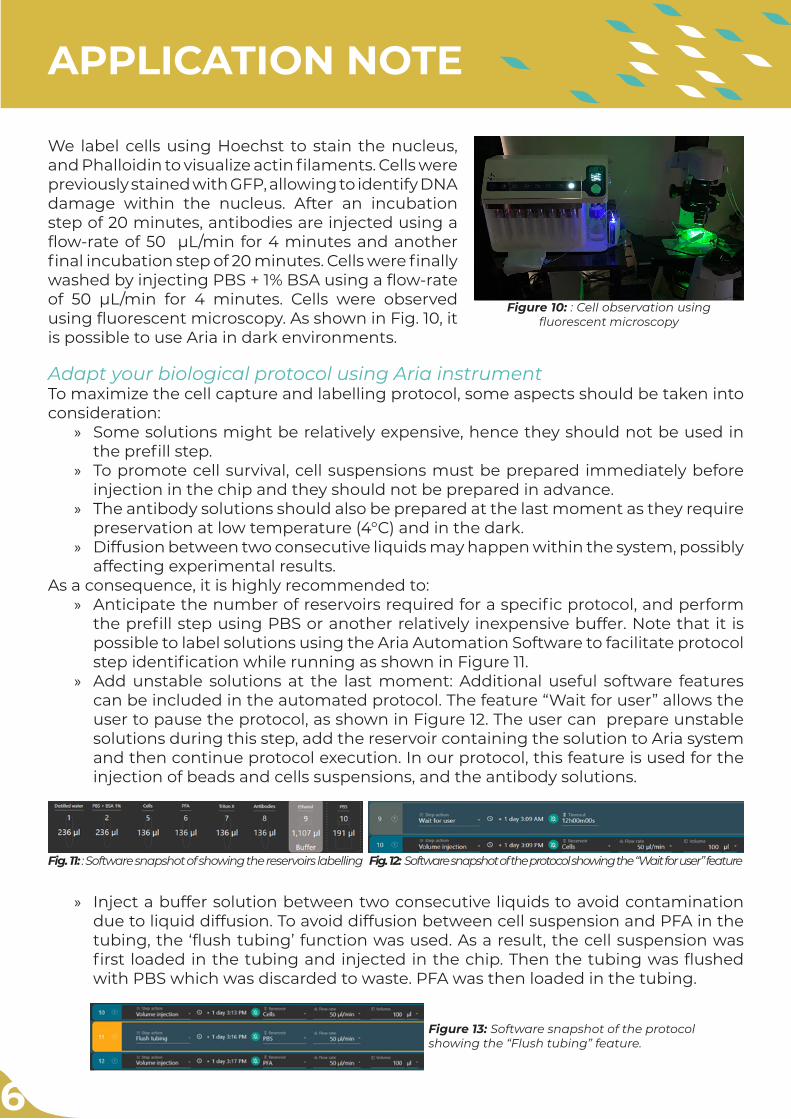
We label cells using Hoechst to stain the nucleus, and Phalloidin to visualize actin filaments. Cells were previously stained with GFP, allowing to identify DNA damage within the nucleus. After an incubation step of 20 minutes, antibodies are injected using a flow-rate of 50 µL/min for 4 minutes and another final incubation step of 20 minutes. Cells were finally washed by injecting PBS + 1% BSA using a flow-rate of 50 µL/min for 4 minutes. Cells were observed using fluorescent microscopy. As shown in Fig. 10, it is possible to use Aria in dark environments.
Figure 10: : Cell observation using fluorescent microscopy
Adapt your biological protocol using Aria instrument To maximize the cell capture and labelling protocol, some aspects should be taken into consideration:
» Some solutions might be relatively expensive, hence they should not be used in the prefill step.
» To promote cell survival, cell suspensions must be prepared immediately before injection in the chip and they should not be prepared in advance.
» The antibody solutions should also be prepared at the last moment as they require preservation at low temperature (4°C) and in the dark.
» Diffusion between two consecutive liquids may happen within the system, possibly affecting experimental results.
As a consequence, it is highly recommended to: » Anticipate the number of reservoirs required for a specific protocol, and perform
the prefill step using PBS or another relatively inexpensive buffer. Note that it is possible to label solutions using the Aria Automation Software to facilitate protocol step identification while running as shown in Figure 11.
» Add unstable solutions at the last moment: Additional useful software features can be included in the automated protocol. The feature “Wait for user” allows the user to pause the protocol, as shown in Figure 12. The user can prepare unstable solutions during this step, add the reservoir containing the solution to Aria system and then continue protocol execution. In our protocol, this feature is used for the injection of beads and cells suspensions, and the antibody solutions.
» Inject a buffer solution between two consecutive liquids to avoid contamination due to liquid diffusion. To avoid diffusion between cell suspension and PFA in the tubing, the ‘flush tubing’ function was used. As a result, the cell suspension was first loaded in the tubing and injected in the chip. Then the tubing was flushed with PBS which was discarded to waste. PFA was then loaded in the tubing.
Fig. 11: : Software snapshot of showing the reservoirs labelling Fig. 12: Software snapshot of the protocol showing the “Wait for user” feature
Figure 13: Software snapshot of the protocol showing the “Flush tubing” feature.

7
APPLICATION NOTE
RESULTSBEADS INJECTIONAfter the surface treatment, anti-EpCAM antibodies-coated beads are injected through the microfluidic chip. As the magnetic field is turned on, beads self-assemble into columns that are spontaneously anchored on the magnetic patterns. Figure 14 a/ and b/ show respectively micrographs of coated beads attached to the columns with focus on patterned columns or coated-beads, confirming the proper functionin of the beads injection protocol.
Figure 14: Micrographs of self-assembled injected beads on the patterned columns focused on a/ columns b/ beads
Fig. 15: Micrograph of MDA-MB-231 cells captured on the columns
CELL CAPTURE AND LABELLINGOnce columns are formed within the microfluidic chip, the solution containing MDA-MB-231 cells was subsequently injected. We can observe in Figure 15 several cells that specifically bind to the anti-EpCAM coated columns.
Finally, captured cells were stained with different dyes following the protocol from the automated cell capture and labelling section. We can observe in Figure 16 cells that bind to the EpCAM coated columns, exhibiting green, blue and orange fluorescence. Note that the columns formed by the magnetic beads display a weak orange fluorescence, as Phalloidin binds to EpCAM. Figure 17 shows a composite micrograph of cells attached to a column using higher magnification. We can distincly observe orange fluorescence indicating stained actin filaments, blue fluorescence indicating stained nucleus and green fluorescence indicating damaged DNA within the nucleus. These results confirm the proper function of the staining injection protocol.
a/ b/

8
APPLICATION NOTE
We have demonstrated the use of Aria and its related software for the automated delivery of different liquids for the capture and labelling of breast cancer cells using a complex microfluidic setup. This protocol included 10 different liquid injections, surface treatment, beads injection, cells injection, capture and labelling in a sequential and automated manner. We also demonstrate how Aria can adapt to specific protocols by making use of its specific software features, allowing for the optimization of complex protocols.
Aria provides key features for performing this application as it brings to the user:
» Reduced manipulation time and timed exposure to antibodies, fluorophores, DNA probes with automated and timed protocols
» Reduced handling for minimal contamination< or changes to cell conditions
» Higher reproducibility compared to manual methods, hence more reliable results
CONCLUSION
Figure 16: Composite image of the three micrographs from the same area using blue, orange and green fluorescent filters
Figure 17: Composite image of the three micrographs from the same area using blue, orange and green fluorescent filters

9
APPLICATION NOTE
For additional information, contact us by email : [email protected] or consult our website : www.fluigent.com
REFERENCES1. Autebert, J. et al. 2015 High purity microfluidic sorting and analysis of circulating
tumor cells: towards routine mutation detection. Lab Chip 15, 2090–2101 (2015).
2. Kim, M. Y. et al. Tumor Self-Seeding by Circulating Cancer Cells. Cell 139, 1315–1326 (2009).
3. Cabel, L. et al. Clinical potential of circulating tumour DNA in patients receiving anticancer immunotherapy. Nat. Rev. Clin. Oncol. 15, 639–650 (2018).
4. Bidard, F. C. et al. Clinical validity of circulating tumour cells in patients with me-tastatic breast cancer: A pooled analysis of individual patient data. Lancet Oncol. 15, 406–414 (2014).
5. Saias, L., Autebert, J., Malaquin, L. & Viovy, J.-L. 2011 Design, modeling and characte-rization of microfluidic architectures for high flow rate, small footprint microfluidic systems. Lab Chip 11, 822–32 (2011).
6. Bernacka-wojcik, I. 2014 Design and development of a microfluidic platform for use with colorimetric gold nanoprobe assays. (Universidade Nova de Lisboa, 2014)
This study has been made in collaboration with Emile Lakis, PhD from Institut Curie, Team Pierga, Circulating Cancer Biomarkers