Automating LC-MS and MS/MS based Large Metabolomic …Automating LC-MS and MS/MS based Large...
1
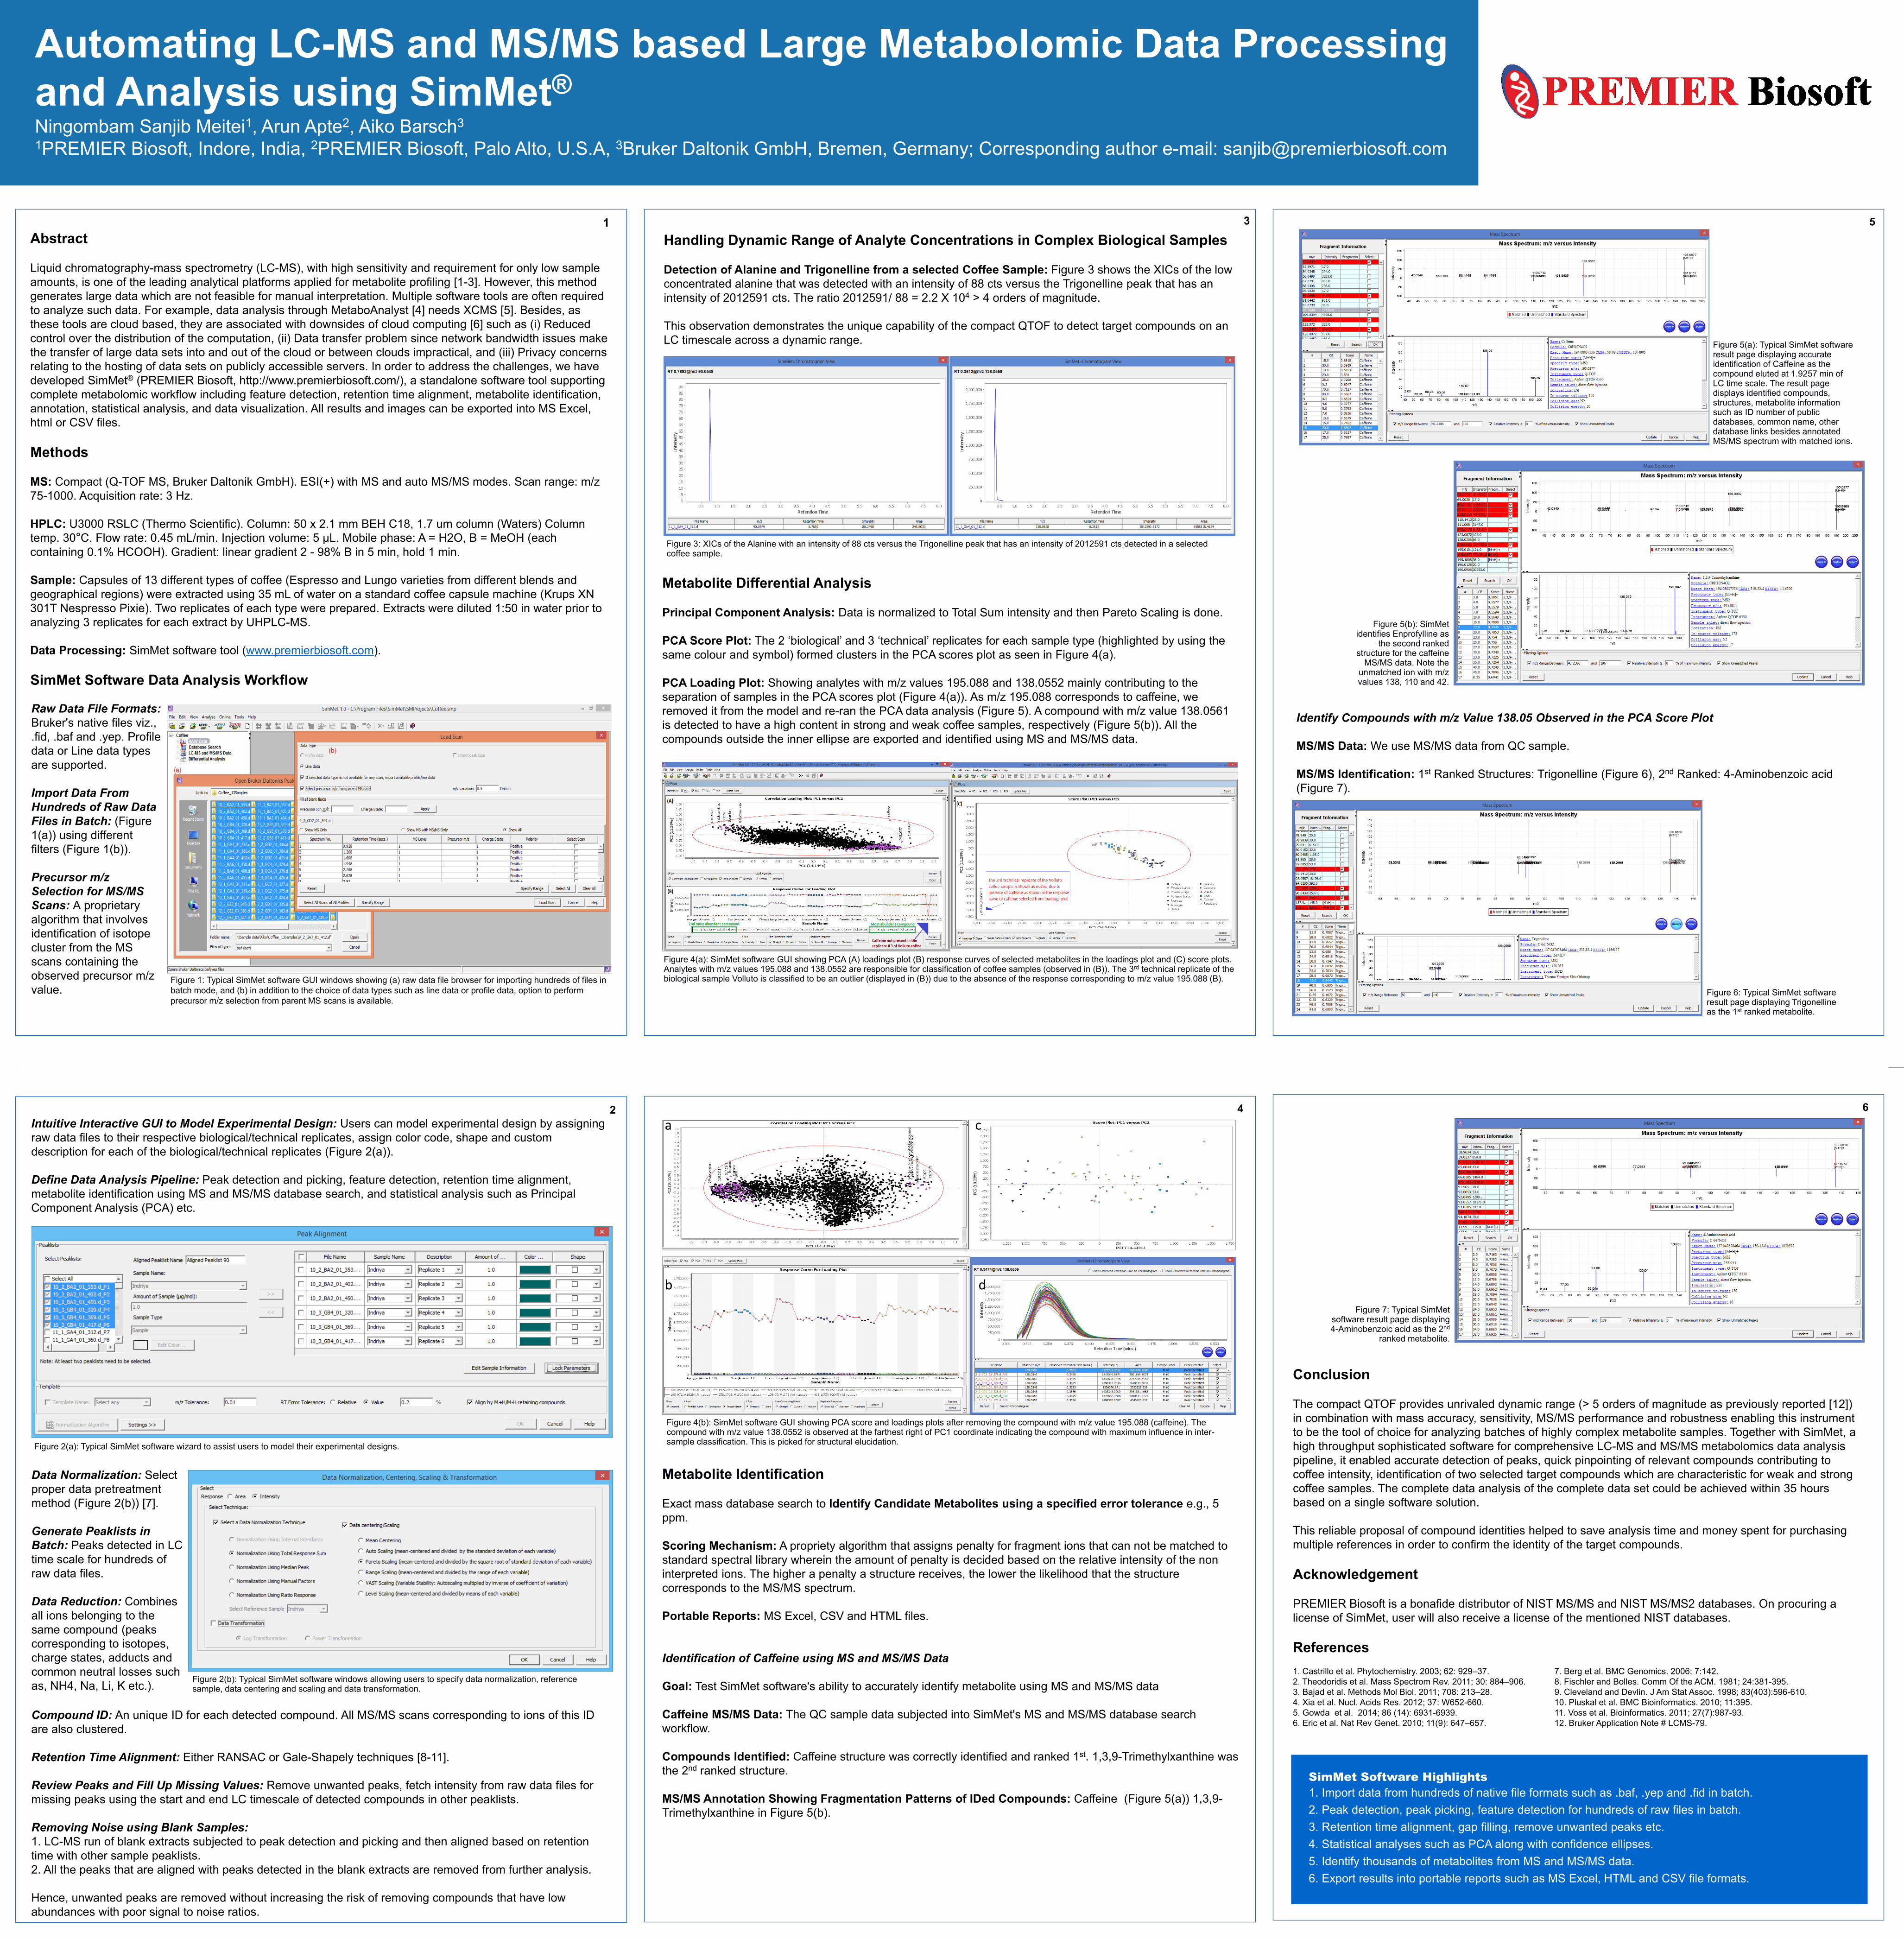
Automating LC-MS and MS/MS based Large Metabolomic Data Processing and Analysis using SimMet ® Ningombam Sanjib Meitei 1 , Arun Apte 2 , Aiko Barsch 3 1 PREMIER Biosoft, Indore, India, 2 PREMIER Biosoft, Palo Alto, U.S.A, 3 Bruker Daltonik GmbH, Bremen, Germany; Corresponding author e-mail: [email protected] 1 Abstract Liquid chromatography-mass spectrometry (LC-MS), with high sensitivity and requirement for only low sample amounts, is one of the leading analytical platforms applied for metabolite profiling [1-3]. However, this method generates large data which are not feasible for manual interpretation. Multiple software tools are often required to analyze such data. For example, data analysis through MetaboAnalyst [4] needs XCMS [5]. Besides, as these tools are cloud based, they are associated with downsides of cloud computing [6] such as (i) Reduced control over the distribution of the computation, (ii) Data transfer problem since network bandwidth issues make the transfer of large data sets into and out of the cloud or between clouds impractical, and (iii) Privacy concerns relating to the hosting of data sets on publicly accessible servers. In order to address the challenges, we have developed SimMet ® (PREMIER Biosoft, http://www.premierbiosoft.com/), a standalone software tool supporting complete metabolomic workflow including feature detection, retention time alignment, metabolite identification, annotation, statistical analysis, and data visualization. All results and images can be exported into MS Excel, html or CSV files. Methods MS: Compact (Q-TOF MS, Bruker Daltonik GmbH). ESI(+) with MS and auto MS/MS modes. Scan range: m/z 75-1000. Acquisition rate: 3 Hz. HPLC: U3000 RSLC (Thermo Scientific). Column: 50 x 2.1 mm BEH C18, 1.7 um column (Waters) Column temp. 30°C. Flow rate: 0.45 mL/min. Injection volume: 5 μL. Mobile phase: A = H2O, B = MeOH (each containing 0.1% HCOOH). Gradient: linear gradient 2 - 98% B in 5 min, hold 1 min. Sample: Capsules of 13 different types of coffee (Espresso and Lungo varieties from different blends and geographical regions) were extracted using 35 mL of water on a standard coffee capsule machine (Krups XN 301T Nespresso Pixie). Two replicates of each type were prepared. Extracts were diluted 1:50 in water prior to analyzing 3 replicates for each extract by UHPLC-MS. Data Processing: SimMet software tool (www.premierbiosoft.com ). SimMet Software Data Analysis Workflow 6 Conclusion The compact QTOF provides unrivaled dynamic range (> 5 orders of magnitude as previously reported [12]) in combination with mass accuracy, sensitivity, MS/MS performance and robustness enabling this instrument to be the tool of choice for analyzing batches of highly complex metabolite samples. Together with SimMet, a high throughput sophisticated software for comprehensive LC-MS and MS/MS metabolomics data analysis pipeline, it enabled accurate detection of peaks, quick pinpointing of relevant compounds contributing to coffee intensity, identification of two selected target compounds which are characteristic for weak and strong coffee samples. The complete data analysis of the complete data set could be achieved within 35 hours based on a single software solution. This reliable proposal of compound identities helped to save analysis time and money spent for purchasing multiple references in order to confirm the identity of the target compounds. Acknowledgement PREMIER Biosoft is a bonafide distributor of NIST MS/MS and NIST MS/MS2 databases. On procuring a license of SimMet, user will also receive a license of the mentioned NIST databases. References 1. Castrillo et al. Phytochemistry. 2003; 62: 929–37. 7. Berg et al. BMC Genomics. 2006; 7:142. 2. Theodoridis et al. Mass Spectrom Rev. 2011; 30: 884–906. 8. Fischler and Bolles. Comm Of the ACM. 1981; 24:381-395. 3. Bajad et al. Methods Mol Biol. 2011; 708: 213–28. 9. Cleveland and Devlin. J Am Stat Assoc. 1998; 83(403):596-610. 4. Xia et al. Nucl. Acids Res. 2012; 37: W652-660. 10. Pluskal et al. BMC Bioinformatics. 2010; 11:395. 5. Gowda et al. 2014; 86 (14): 6931-6939. 11. Voss et al. Bioinformatics. 2011; 27(7):987-93. 6. Eric et al. Nat Rev Genet. 2010; 11(9): 647–657. 12. Bruker Application Note # LCMS-79. Figure 1: Typical SimMet software GUI windows showing (a) raw data file browser for importing hundreds of files in batch mode, and (b) in addition to the choice of data types such as line data or profile data, option to perform precursor m/z selection from parent MS scans is available. Data Normalization: Select proper data pretreatment method (Figure 2(b)) [7]. Generate Peaklists in Batch: Peaks detected in LC time scale for hundreds of raw data files. Data Reduction: Combines all ions belonging to the same compound (peaks corresponding to isotopes, charge states, adducts and common neutral losses such as, NH4, Na, Li, K etc.). Compound ID: An unique ID for each detected compound. All MS/MS scans corresponding to ions of this ID are also clustered. Retention Time Alignment: Either RANSAC or Gale-Shapely techniques [8-11]. Review Peaks and Fill Up Missing Values: Remove unwanted peaks, fetch intensity from raw data files for missing peaks using the start and end LC timescale of detected compounds in other peaklists. Removing Noise using Blank Samples: 1. LC-MS run of blank extracts subjected to peak detection and picking and then aligned based on retention time with other sample peaklists. 2. All the peaks that are aligned with peaks detected in the blank extracts are removed from further analysis. Hence, unwanted peaks are removed without increasing the risk of removing compounds that have low abundances with poor signal to noise ratios. Metabolite Differential Analysis Principal Component Analysis: Data is normalized to Total Sum intensity and then Pareto Scaling is done. PCA Score Plot: The 2 ‘biological’ and 3 ‘technical’ replicates for each sample type (highlighted by using the same colour and symbol) formed clusters in the PCA scores plot as seen in Figure 4(a). PCA Loading Plot: Showing analytes with m/z values 195.088 and 138.0552 mainly contributing to the separation of samples in the PCA scores plot (Figure 4(a)). As m/z 195.088 corresponds to caffeine, we removed it from the model and re-ran the PCA data analysis (Figure 5). A compound with m/z value 138.0561 is detected to have a high content in strong and weak coffee samples, respectively (Figure 5(b)). All the compounds outside the inner ellipse are exported and identified using MS and MS/MS data. 2 3 5 Figure 2(a): Typical SimMet software wizard to assist users to model their experimental designs. Figure 2(b): Typical SimMet software windows allowing users to specify data normalization, reference sample, data centering and scaling and data transformation. Intuitive Interactive GUI to Model Experimental Design: Users can model experimental design by assigning raw data files to their respective biological/technical replicates, assign color code, shape and custom description for each of the biological/technical replicates (Figure 2(a)). Define Data Analysis Pipeline: Peak detection and picking, feature detection, retention time alignment, metabolite identification using MS and MS/MS database search, and statistical analysis such as Principal Component Analysis (PCA) etc. Raw Data File Formats: Bruker's native files viz., .fid, .baf and .yep. Profile data or Line data types are supported. Import Data From Hundreds of Raw Data Files in Batch: (Figure 1(a)) using different filters (Figure 1(b)). Precursor m/z Selection for MS/MS Scans: A proprietary algorithm that involves identification of isotope cluster from the MS scans containing the observed precursor m/z value. Figure 3: XICs of the Alanine with an intensity of 88 cts versus the Trigonelline peak that has an intensity of 2012591 cts detected in a selected coffee sample. Figure 4(a): SimMet software GUI showing PCA (A) loadings plot (B) response curves of selected metabolites in the loadings plot and (C) score plots. Analytes with m/z values 195.088 and 138.0552 are responsible for classification of coffee samples (observed in (B)). The 3 rd technical replicate of the biological sample Volluto is classified to be an outlier (displayed in (B)) due to the absence of the response corresponding to m/z value 195.088 (B). Figure 4(b): SimMet software GUI showing PCA score and loadings plots after removing the compound with m/z value 195.088 (caffeine). The compound with m/z value 138.0552 is observed at the farthest right of PC1 coordinate indicating the compound with maximum influence in inter- sample classification. This is picked for structural elucidation. Metabolite Identification Exact mass database search to Identify Candidate Metabolites using a specified error tolerance e.g., 5 ppm. Scoring Mechanism: A propriety algorithm that assigns penalty for fragment ions that can not be matched to standard spectral library wherein the amount of penalty is decided based on the relative intensity of the non interpreted ions. The higher a penalty a structure receives, the lower the likelihood that the structure corresponds to the MS/MS spectrum. Portable Reports: MS Excel, CSV and HTML files. Identification of Caffeine using MS and MS/MS Data Goal: Test SimMet software's ability to accurately identify metabolite using MS and MS/MS data Caffeine MS/MS Data: The QC sample data subjected into SimMet's MS and MS/MS database search workflow. Compounds Identified: Caffeine structure was correctly identified and ranked 1 st . 1,3,9-Trimethylxanthine was the 2 nd ranked structure. MS/MS Annotation Showing Fragmentation Patterns of IDed Compounds: Caffeine (Figure 5(a)) 1,3,9- Trimethylxanthine in Figure 5(b). Figure 5(b): SimMet identifies Enprofylline as the second ranked structure for the caffeine MS/MS data. Note the unmatched ion with m/z values 138, 110 and 42. Identify Compounds with m/z Value 138.05 Observed in the PCA Score Plot MS/MS Data: We use MS/MS data from QC sample. MS/MS Identification: 1 st Ranked Structures: Trigonelline (Figure 6), 2 nd Ranked: 4-Aminobenzoic acid (Figure 7). Figure 6: Typical SimMet software result page displaying Trigonelline as the 1 st ranked metabolite. SimMet Software Highlights 1. Import data from hundreds of native file formats such as .baf, .yep and .fid in batch. 2. Peak detection, peak picking, feature detection for hundreds of raw files in batch. 3. Retention time alignment, gap filling, remove unwanted peaks etc. 4. Statistical analyses such as PCA along with confidence ellipses. 5. Identify thousands of metabolites from MS and MS/MS data. 6. Export results into portable reports such as MS Excel, HTML and CSV file formats. Figure 7: Typical SimMet software result page displaying 4-Aminobenzoic acid as the 2 nd ranked metabolite. Handling Dynamic Range of Analyte Concentrations in Complex Biological Samples Detection of Alanine and Trigonelline from a selected Coffee Sample: Figure 3 shows the XICs of the low concentrated alanine that was detected with an intensity of 88 cts versus the Trigonelline peak that has an intensity of 2012591 cts. The ratio 2012591/ 88 = 2.2 X 10 4 > 4 orders of magnitude. This observation demonstrates the unique capability of the compact QTOF to detect target compounds on an LC timescale across a dynamic range. 4 Figure 5(a): Typical SimMet software result page displaying accurate identification of Caffeine as the compound eluted at 1.9257 min of LC time scale. The result page displays identified compounds, structures, metabolite information such as ID number of public databases, common name, other database links besides annotated MS/MS spectrum with matched ions. a c b d
Transcript of Automating LC-MS and MS/MS based Large Metabolomic …Automating LC-MS and MS/MS based Large...
Automating LC-MS and MS/MS based Large Metabolomic Data Processing
and Analysis using SimMet®
Ningombam Sanjib Meitei1, Arun Apte2, Aiko Barsch3
1PREMIER Biosoft, Indore, India, 2PREMIER Biosoft, Palo Alto, U.S.A, 3Bruker Daltonik GmbH, Bremen, Germany; Corresponding author e-mail: [email protected]
1
Abstract
Liquid chromatography-mass spectrometry (LC-MS), with high sensitivity and requirement for only low sample
amounts, is one of the leading analytical platforms applied for metabolite profiling [1-3]. However, this method
generates large data which are not feasible for manual interpretation. Multiple software tools are often required
to analyze such data. For example, data analysis through MetaboAnalyst [4] needs XCMS [5]. Besides, as
these tools are cloud based, they are associated with downsides of cloud computing [6] such as (i) Reduced
control over the distribution of the computation, (ii) Data transfer problem since network bandwidth issues make
the transfer of large data sets into and out of the cloud or between clouds impractical, and (iii) Privacy concerns
relating to the hosting of data sets on publicly accessible servers. In order to address the challenges, we have
developed SimMet® (PREMIER Biosoft, http://www.premierbiosoft.com/), a standalone software tool supporting
complete metabolomic workflow including feature detection, retention time alignment, metabolite identification,
annotation, statistical analysis, and data visualization. All results and images can be exported into MS Excel,
html or CSV files.
Methods
MS: Compact (Q-TOF MS, Bruker Daltonik GmbH). ESI(+) with MS and auto MS/MS modes. Scan range: m/z
75-1000. Acquisition rate: 3 Hz.
HPLC: U3000 RSLC (Thermo Scientific). Column: 50 x 2.1 mm BEH C18, 1.7 um column (Waters) Column
temp. 30°C. Flow rate: 0.45 mL/min. Injection volume: 5 μL. Mobile phase: A = H2O, B = MeOH (each
containing 0.1% HCOOH). Gradient: linear gradient 2 - 98% B in 5 min, hold 1 min.
Sample: Capsules of 13 different types of coffee (Espresso and Lungo varieties from different blends and
geographical regions) were extracted using 35 mL of water on a standard coffee capsule machine (Krups XN
301T Nespresso Pixie). Two replicates of each type were prepared. Extracts were diluted 1:50 in water prior to
analyzing 3 replicates for each extract by UHPLC-MS.
Data Processing: SimMet software tool (www.premierbiosoft.com).
SimMet Software Data Analysis Workflow
6
Conclusion
The compact QTOF provides unrivaled dynamic range (> 5 orders of magnitude as previously reported [12])
in combination with mass accuracy, sensitivity, MS/MS performance and robustness enabling this instrument
to be the tool of choice for analyzing batches of highly complex metabolite samples. Together with SimMet, a
high throughput sophisticated software for comprehensive LC-MS and MS/MS metabolomics data analysis
pipeline, it enabled accurate detection of peaks, quick pinpointing of relevant compounds contributing to
coffee intensity, identification of two selected target compounds which are characteristic for weak and strong
coffee samples. The complete data analysis of the complete data set could be achieved within 35 hours
based on a single software solution.
This reliable proposal of compound identities helped to save analysis time and money spent for purchasing
multiple references in order to confirm the identity of the target compounds.
Acknowledgement
PREMIER Biosoft is a bonafide distributor of NIST MS/MS and NIST MS/MS2 databases. On procuring a
license of SimMet, user will also receive a license of the mentioned NIST databases.
References
1. Castrillo et al. Phytochemistry. 2003; 62: 929–37. 7. Berg et al. BMC Genomics. 2006; 7:142.
2. Theodoridis et al. Mass Spectrom Rev. 2011; 30: 884–906. 8. Fischler and Bolles. Comm Of the ACM. 1981; 24:381-395.
3. Bajad et al. Methods Mol Biol. 2011; 708: 213–28. 9. Cleveland and Devlin. J Am Stat Assoc. 1998; 83(403):596-610.
4. Xia et al. Nucl. Acids Res. 2012; 37: W652-660. 10. Pluskal et al. BMC Bioinformatics. 2010; 11:395.
5. Gowda et al. 2014; 86 (14): 6931-6939. 11. Voss et al. Bioinformatics. 2011; 27(7):987-93.
6. Eric et al. Nat Rev Genet. 2010; 11(9): 647–657. 12. Bruker Application Note # LCMS-79.
Figure 1: Typical SimMet software GUI windows showing (a) raw data file browser for importing hundreds of files in
batch mode, and (b) in addition to the choice of data types such as line data or profile data, option to perform
precursor m/z selection from parent MS scans is available.
Data Normalization: Select
proper data pretreatment
method (Figure 2(b)) [7].
Generate Peaklists in
Batch: Peaks detected in LC
time scale for hundreds of
raw data files.
Data Reduction: Combines
all ions belonging to the
same compound (peaks
corresponding to isotopes,
charge states, adducts and
common neutral losses such
as, NH4, Na, Li, K etc.).
Compound ID: An unique ID for each detected compound. All MS/MS scans corresponding to ions of this ID
are also clustered.
Retention Time Alignment: Either RANSAC or Gale-Shapely techniques [8-11].
Review Peaks and Fill Up Missing Values: Remove unwanted peaks, fetch intensity from raw data files for
missing peaks using the start and end LC timescale of detected compounds in other peaklists.
Removing Noise using Blank Samples:
1. LC-MS run of blank extracts subjected to peak detection and picking and then aligned based on retention
time with other sample peaklists.
2. All the peaks that are aligned with peaks detected in the blank extracts are removed from further analysis.
Hence, unwanted peaks are removed without increasing the risk of removing compounds that have low
abundances with poor signal to noise ratios.
Metabolite Differential Analysis
Principal Component Analysis: Data is normalized to Total Sum intensity and then Pareto Scaling is done.
PCA Score Plot: The 2 ‘biological’ and 3 ‘technical’ replicates for each sample type (highlighted by using the
same colour and symbol) formed clusters in the PCA scores plot as seen in Figure 4(a).
PCA Loading Plot: Showing analytes with m/z values 195.088 and 138.0552 mainly contributing to the
separation of samples in the PCA scores plot (Figure 4(a)). As m/z 195.088 corresponds to caffeine, we
removed it from the model and re-ran the PCA data analysis (Figure 5). A compound with m/z value 138.0561
is detected to have a high content in strong and weak coffee samples, respectively (Figure 5(b)). All the
compounds outside the inner ellipse are exported and identified using MS and MS/MS data.
2
3 5
Figure 2(a): Typical SimMet software wizard to assist users to model their experimental designs.
Figure 2(b): Typical SimMet software windows allowing users to specify data normalization, reference sample, data centering and scaling and data transformation.
Intuitive Interactive GUI to Model Experimental Design: Users can model experimental design by assigning
raw data files to their respective biological/technical replicates, assign color code, shape and custom
description for each of the biological/technical replicates (Figure 2(a)).
Define Data Analysis Pipeline: Peak detection and picking, feature detection, retention time alignment,
metabolite identification using MS and MS/MS database search, and statistical analysis such as Principal
Component Analysis (PCA) etc.
Raw Data File Formats:
Bruker's native files viz.,
.fid, .baf and .yep. Profile
data or Line data types
are supported.
Import Data From
Hundreds of Raw Data
Files in Batch: (Figure
1(a)) using different
filters (Figure 1(b)).
Precursor m/z
Selection for MS/MS
Scans: A proprietary
algorithm that involves
identification of isotope
cluster from the MS
scans containing the
observed precursor m/z
value.
Figure 3: XICs of the Alanine with an intensity of 88 cts versus the Trigonelline peak that has an intensity of 2012591 cts detected in a selected coffee sample.
Figure 4(a): SimMet software GUI showing PCA (A) loadings plot (B) response curves of selected metabolites in the loadings plot and (C) score plots. Analytes with m/z values 195.088 and 138.0552 are responsible for classification of coffee samples (observed in (B)). The 3rd technical replicate of the biological sample Volluto is classified to be an outlier (displayed in (B)) due to the absence of the response corresponding to m/z value 195.088 (B).
Figure 4(b): SimMet software GUI showing PCA score and loadings plots after removing the compound with m/z value 195.088 (caffeine). The compound with m/z value 138.0552 is observed at the farthest right of PC1 coordinate indicating the compound with maximum influence in inter-sample classification. This is picked for structural elucidation.
Metabolite Identification
Exact mass database search to Identify Candidate Metabolites using a specified error tolerance e.g., 5
ppm.
Scoring Mechanism: A propriety algorithm that assigns penalty for fragment ions that can not be matched to
standard spectral library wherein the amount of penalty is decided based on the relative intensity of the non
interpreted ions. The higher a penalty a structure receives, the lower the likelihood that the structure
corresponds to the MS/MS spectrum.
Portable Reports: MS Excel, CSV and HTML files.
Identification of Caffeine using MS and MS/MS Data
Goal: Test SimMet software's ability to accurately identify metabolite using MS and MS/MS data
Caffeine MS/MS Data: The QC sample data subjected into SimMet's MS and MS/MS database search
workflow.
Compounds Identified: Caffeine structure was correctly identified and ranked 1st. 1,3,9-Trimethylxanthine was
the 2nd ranked structure.
MS/MS Annotation Showing Fragmentation Patterns of IDed Compounds: Caffeine (Figure 5(a)) 1,3,9-
Trimethylxanthine in Figure 5(b).
Figure 5(b): SimMet identifies Enprofylline as
the second ranked structure for the caffeine
MS/MS data. Note the unmatched ion with m/z values 138, 110 and 42.
Identify Compounds with m/z Value 138.05 Observed in the PCA Score Plot
MS/MS Data: We use MS/MS data from QC sample.
MS/MS Identification: 1st Ranked Structures: Trigonelline (Figure 6), 2nd Ranked: 4-Aminobenzoic acid
(Figure 7).
Figure 6: Typical SimMet software result page displaying Trigonelline as the 1st ranked metabolite.
SimMet Software Highlights
1. Import data from hundreds of native file formats such as .baf, .yep and .fid in batch.
2. Peak detection, peak picking, feature detection for hundreds of raw files in batch.
3. Retention time alignment, gap filling, remove unwanted peaks etc.
4. Statistical analyses such as PCA along with confidence ellipses.
5. Identify thousands of metabolites from MS and MS/MS data.
6. Export results into portable reports such as MS Excel, HTML and CSV file formats.
Figure 7: Typical SimMet software result page displaying 4-Aminobenzoic acid as the 2nd
ranked metabolite.
Handling Dynamic Range of Analyte Concentrations in Complex Biological Samples
Detection of Alanine and Trigonelline from a selected Coffee Sample: Figure 3 shows the XICs of the low
concentrated alanine that was detected with an intensity of 88 cts versus the Trigonelline peak that has an
intensity of 2012591 cts. The ratio 2012591/ 88 = 2.2 X 10⁴ > 4 orders of magnitude.
This observation demonstrates the unique capability of the compact QTOF to detect target compounds on an
LC timescale across a dynamic range.
4
Figure 5(a): Typical SimMet software result page displaying accurate identification of Caffeine as the compound eluted at 1.9257 min of LC time scale. The result page displays identified compounds, structures, metabolite information such as ID number of public databases, common name, other database links besides annotated MS/MS spectrum with matched ions.
a c
b d


![Systems Metabolomic Lecture[1]](https://static.fdocuments.net/doc/165x107/546af5e0b4af9f486b8b45b1/systems-metabolomic-lecture1.jpg)