AUTOMATIC SEGMENTATION OF SPEECH INTO SENTENCE-LIKE
192
University of West Bohemia in Pilsen Faculty of Applied Sciences AUTOMATIC SEGMENTATION OF SPEECH INTO SENTENCE-LIKE UNITS Ing. Jáchym Kolář A dissertation submitted for the degree of Doctor of Philosophy in Cybernetics Major Advisor: Prof. Ing. Josef Psutka, CSc. Department: Department of Cybernetics Pilsen, 2008
Transcript of AUTOMATIC SEGMENTATION OF SPEECH INTO SENTENCE-LIKE

University of West Bohemia in PilsenFaculty of Applied Sciences
AUTOMATIC SEGMENTATION OF SPEECH
INTO SENTENCE-LIKE UNITS
Ing. Jáchym Kolář
A dissertation submitted for the degree of
Doctor of Philosophy
in Cybernetics
Major Advisor: Prof. Ing. Josef Psutka, CSc.
Department: Department of Cybernetics
Pilsen, 2008

Automatic Segmentation of Speech into Sentence-like Units. c© Jáchym Kolář 2008. Revised version.

Západočeská univerzita v PlzniFakulta aplikovaných věd
AUTOMATICKÁ SEGMENTACE MLUVENÉ
ŘEČI DO VĚTNÝCH JEDNOTEK
Ing. Jáchym Kolář
disertační práce
k získání akademického titulu doktor
v oboru Kybernetika
Školitel: Prof. Ing. Josef Psutka, CSc.
Katedra: Katedra kybernetiky
Plzeň, 2008


Declaration of Originality
I hereby declare that this thesis is my own work and has not been submitted in any formfor another degree or diploma at any university or other institute of tertiary education. Anyhelp that I have received in my research work and the preparation of the thesis itself hasbeen acknowledged. In addition, I certify that all information sources and literature used areindicated in the thesis.
Pilsen, August 7, 2008
Ing. Jáchym Kolář


Dedicated to my parents and all my true friends.


Acknowledgments
First of all, I would like to thank my advisor, Prof. Josef Psutka, for providing me withthe opportunity to do this interesting research and for academic guidance throughout mypostgraduate study at the Department of Cybernetics, University of West Bohemia in Pilsen.
I also gratefully acknowledge Elizabeth Shriberg for giving me excellent research guidanceduring my internship at the International Computer Science Institute in Berkeley. She has beena great source of scientific inspiration. In particular, my work on speaker-specific modelingfor sentence segmentation of speech presented in Chapter 9 was largely inspired by her ideas.Furthermore, I thank her for useful comments on drafts of Chapters 2 and 3.
I am much obliged to Yang Liu at University of Texas at Dallas for always being willingto answer all the questions in my numerous emails. She has been my counselor in manyareas ranging from scientific writing to machine learning and natural language processingtechniques. She also provided me with her models for the TnT tagger, which I used for part-of-speech tagging of the ICSI meeting corpus. In addition, I thank her for valuable commentson a draft of this thesis.
Several people deserve acknowledgment for helping me create the Czech MDE corpora:Stephanie Strassel and Christopher Walker from the Linguistic Data Consortium helped meunderstand all the subtle details of the MDE annotation, Dagmar Kozlíková gave me valuableadvice about some detailed features of Czech syntax, and Jan Švec implemented the annotationtool.
Jan Švec also helped me with the implementation of prosodic feature extraction. Fur-thermore, Aleš Pražák and Josef Psutka Jr. converted my ASR models into the UWB speechrecognizer, and Drahomíra “johanka” Spoustová at Charles University in Prague helped mewith automatic morphological tagging of Czech speech transcripts.
In addition, I acknowledge all my colleagues at University of West Bohemia and ICSI whohave somehow contributed to my research – by giving me useful advice, showing me how touse various software toolkits, or just by being kind and helpful colleagues and neighbors. Lastbut not least, I thank my family and friends for their support (not only) during my work onthis thesis.
The research presented in this thesis was financially supported by the Ministry of Educa-tion of the Czech Republic (projects No. 2C06020, LC536, and ME909), and by the EuropeanUnion 6th FWP ISR Integrated Project AMI (FP6-506811). The access to the METACentrumcomputing facilities provided under the research program MSM6383917201 was also appreci-ated. The views expressed in the thesis are those of the author, and not the funding agencies.


Contents
Abstract in English v
Abstract in Czech vii
List of Figures ix
List of Tables xi
Glossary of Abbreviations and Acronyms xiii
1 Introduction 1
1.1 Motivation . . . . . . . . . . . . . . . . . . . . . . . . . . . . . . . . . . . . . . 11.2 General Task and Approach . . . . . . . . . . . . . . . . . . . . . . . . . . . . . 21.3 Scope of the Thesis . . . . . . . . . . . . . . . . . . . . . . . . . . . . . . . . . . 31.4 Thesis Organization . . . . . . . . . . . . . . . . . . . . . . . . . . . . . . . . . 3
2 Linguistic Background 5
2.1 Structural Units in Spoken and Written Language . . . . . . . . . . . . . . . . 52.2 Prosody . . . . . . . . . . . . . . . . . . . . . . . . . . . . . . . . . . . . . . . . 7
2.2.1 Suprasegmental Information in Speech . . . . . . . . . . . . . . . . . . . 72.2.2 Levels of Prosody Description . . . . . . . . . . . . . . . . . . . . . . . . 82.2.3 Prosodic Terminology . . . . . . . . . . . . . . . . . . . . . . . . . . . . 82.2.4 Prosodic Boundaries in Speech . . . . . . . . . . . . . . . . . . . . . . . 10
2.3 Spontaneous Speech . . . . . . . . . . . . . . . . . . . . . . . . . . . . . . . . . 102.3.1 Disfluencies in Spontaneous Speech . . . . . . . . . . . . . . . . . . . . . 112.3.2 Prosody in Spontaneous Speech . . . . . . . . . . . . . . . . . . . . . . . 13
2.4 Chapter Summary . . . . . . . . . . . . . . . . . . . . . . . . . . . . . . . . . . 14
3 Related Work 15
3.1 Survey of Psycholinguistic Studies about Realization and Perception of ProsodicBoundaries . . . . . . . . . . . . . . . . . . . . . . . . . . . . . . . . . . . . . . 153.1.1 Studies about Preboundary Lengthening . . . . . . . . . . . . . . . . . . 163.1.2 Studies about Pausing . . . . . . . . . . . . . . . . . . . . . . . . . . . . 163.1.3 Studies about Local Coding of Prosodic Boundaries . . . . . . . . . . . 173.1.4 Studies about Prosodic Boundaries in Czech . . . . . . . . . . . . . . . . 173.1.5 Studies about Relation between Syntactic and Prosodic Boundaries . . 18
3.2 Survey of Related Work on Sentence Segmentation and Automatic Punctuationof Speech . . . . . . . . . . . . . . . . . . . . . . . . . . . . . . . . . . . . . . . 18
i

Contents
3.2.1 Evaluation Metrics for Sentence Segmentation . . . . . . . . . . . . . . . 183.2.2 Signal-Based Approaches Not Using Textual Information . . . . . . . . 193.2.3 Text-Based Approaches . . . . . . . . . . . . . . . . . . . . . . . . . . . 203.2.4 Approaches Combining Textual and Prosodic Cues . . . . . . . . . . . . 22
3.3 Chapter Summary . . . . . . . . . . . . . . . . . . . . . . . . . . . . . . . . . . 27
4 Thesis Objectives 29
5 Design, Creation, and Analysis of Czech Speech Corpora with StructuralMetadata Annotation 31
5.1 Speech Data . . . . . . . . . . . . . . . . . . . . . . . . . . . . . . . . . . . . . . 315.1.1 Czech Broadcast News Corpus . . . . . . . . . . . . . . . . . . . . . . . 315.1.2 Radioforum – Czech Broadcast Conversation Corpus . . . . . . . . . . . 325.1.3 Audio Data . . . . . . . . . . . . . . . . . . . . . . . . . . . . . . . . . . 325.1.4 Speech Transcription . . . . . . . . . . . . . . . . . . . . . . . . . . . . . 33
5.2 Annotation of Spontaneous Speech Structure . . . . . . . . . . . . . . . . . . . 345.2.1 Related Work on Spontaneous Speech Annotation . . . . . . . . . . . . 345.2.2 Structural Metadata Annotation Approach . . . . . . . . . . . . . . . . 35
5.3 Structural Metadata Annotation for Czech . . . . . . . . . . . . . . . . . . . . . 365.3.1 Fillers . . . . . . . . . . . . . . . . . . . . . . . . . . . . . . . . . . . . . 375.3.2 Edit Disfluencies . . . . . . . . . . . . . . . . . . . . . . . . . . . . . . . 415.3.3 SUs . . . . . . . . . . . . . . . . . . . . . . . . . . . . . . . . . . . . . . 415.3.4 Technical Aspects of MDE Annotation . . . . . . . . . . . . . . . . . . . 52
5.4 Analysis of Czech Structural Metadata Corpora . . . . . . . . . . . . . . . . . . 535.4.1 Inter-Annotator Agreement on Czech MDE Annotation . . . . . . . . . 535.4.2 Statistics about Fillers . . . . . . . . . . . . . . . . . . . . . . . . . . . . 545.4.3 Statistics about Edit Disfluenscies . . . . . . . . . . . . . . . . . . . . . 555.4.4 Statistics about SUs . . . . . . . . . . . . . . . . . . . . . . . . . . . . . 58
5.5 Chapter Summary and Conclusions . . . . . . . . . . . . . . . . . . . . . . . . . 59
6 Prosodic Features for Classification 61
6.1 Feature Extraction Regions . . . . . . . . . . . . . . . . . . . . . . . . . . . . . 626.2 Pause Features . . . . . . . . . . . . . . . . . . . . . . . . . . . . . . . . . . . . 626.3 Pitch Features . . . . . . . . . . . . . . . . . . . . . . . . . . . . . . . . . . . . 63
6.3.1 Pitch Tracking . . . . . . . . . . . . . . . . . . . . . . . . . . . . . . . . 636.3.2 Octave Error Correction . . . . . . . . . . . . . . . . . . . . . . . . . . . 636.3.3 Automatic Pitch Contour Stylization . . . . . . . . . . . . . . . . . . . . 646.3.4 Pitch Normalization . . . . . . . . . . . . . . . . . . . . . . . . . . . . . 656.3.5 Pitch Feature Types . . . . . . . . . . . . . . . . . . . . . . . . . . . . . 67
6.4 Duration Features . . . . . . . . . . . . . . . . . . . . . . . . . . . . . . . . . . 676.4.1 Duration Normalization . . . . . . . . . . . . . . . . . . . . . . . . . . . 676.4.2 Duration Feature Types . . . . . . . . . . . . . . . . . . . . . . . . . . . 68
6.5 Energy Features . . . . . . . . . . . . . . . . . . . . . . . . . . . . . . . . . . . 696.6 Other Features . . . . . . . . . . . . . . . . . . . . . . . . . . . . . . . . . . . . 696.7 Feature Selection . . . . . . . . . . . . . . . . . . . . . . . . . . . . . . . . . . . 706.8 Chapter Summary . . . . . . . . . . . . . . . . . . . . . . . . . . . . . . . . . . 70
ii

Contents
7 Statistical Models for Sentence Segmentation of Speech 73
7.1 HMM-Based Approach . . . . . . . . . . . . . . . . . . . . . . . . . . . . . . . . 737.1.1 N -gram Language Models . . . . . . . . . . . . . . . . . . . . . . . . . . 747.1.2 Hidden Markov Models . . . . . . . . . . . . . . . . . . . . . . . . . . . 777.1.3 Hidden Event Language Model . . . . . . . . . . . . . . . . . . . . . . . 787.1.4 Prosodic Model Based on Decision Trees with Ensemble Bagging . . . . 787.1.5 Combination of Language and Prosodic Model . . . . . . . . . . . . . . 81
7.2 Maximum Entropy Approach . . . . . . . . . . . . . . . . . . . . . . . . . . . . 827.2.1 General Method . . . . . . . . . . . . . . . . . . . . . . . . . . . . . . . 827.2.2 Textual Features for MaxEnt . . . . . . . . . . . . . . . . . . . . . . . . 847.2.3 Prosodic Features for MaxEnt . . . . . . . . . . . . . . . . . . . . . . . . 85
7.3 Boosting-Based Approach (BoosTexter) . . . . . . . . . . . . . . . . . . . . . . 867.3.1 General Method . . . . . . . . . . . . . . . . . . . . . . . . . . . . . . . 867.3.2 Prosodic and Textual Features for BoosTexter . . . . . . . . . . . . . . 87
7.4 Chapter Summary . . . . . . . . . . . . . . . . . . . . . . . . . . . . . . . . . . 88
8 Dialog Act Segmentation of Multiparty Meetings in English 89
8.1 Speech Data . . . . . . . . . . . . . . . . . . . . . . . . . . . . . . . . . . . . . . 898.1.1 Particularities of Meeting Speech . . . . . . . . . . . . . . . . . . . . . . 898.1.2 ICSI Meeting Corpus . . . . . . . . . . . . . . . . . . . . . . . . . . . . . 908.1.3 Dialog Act Markup . . . . . . . . . . . . . . . . . . . . . . . . . . . . . . 90
8.2 Related Work on Segmentation of Meetings . . . . . . . . . . . . . . . . . . . . 918.3 Segmentation Task for Meetings . . . . . . . . . . . . . . . . . . . . . . . . . . 928.4 Experimental Setup . . . . . . . . . . . . . . . . . . . . . . . . . . . . . . . . . 938.5 DA Segmentation Based on Textual Information . . . . . . . . . . . . . . . . . 94
8.5.1 Textual Features . . . . . . . . . . . . . . . . . . . . . . . . . . . . . . . 948.5.2 Experimental Results . . . . . . . . . . . . . . . . . . . . . . . . . . . . 95
8.6 DA Segmentation Based on Prosodic Information . . . . . . . . . . . . . . . . . 988.6.1 Experimental Results for Prosodic Models . . . . . . . . . . . . . . . . . 988.6.2 Prosodic Feature Usage . . . . . . . . . . . . . . . . . . . . . . . . . . . 99
8.7 DA Segmentation Using Both Textual and Prosodic Information . . . . . . . . 1008.7.1 Results in Reference Conditions . . . . . . . . . . . . . . . . . . . . . . . 1008.7.2 Results in ASR Conditions . . . . . . . . . . . . . . . . . . . . . . . . . 101
8.8 Combination of All Three Modeling Approaches . . . . . . . . . . . . . . . . . 1028.9 Chapter Summary and Conclusions . . . . . . . . . . . . . . . . . . . . . . . . . 103
9 Speaker-Dependent Modeling for Dialog Act Segmentation of Meetings 105
9.1 Speaker-Dependent Prosodic Modeling . . . . . . . . . . . . . . . . . . . . . . . 1059.1.1 Motivation and Goals . . . . . . . . . . . . . . . . . . . . . . . . . . . . 1059.1.2 Method . . . . . . . . . . . . . . . . . . . . . . . . . . . . . . . . . . . . 1069.1.3 Results and Discussion . . . . . . . . . . . . . . . . . . . . . . . . . . . . 107
9.2 Speaker-Dependent Language Modeling . . . . . . . . . . . . . . . . . . . . . . 1119.2.1 Motivation and Goals . . . . . . . . . . . . . . . . . . . . . . . . . . . . 1119.2.2 Method . . . . . . . . . . . . . . . . . . . . . . . . . . . . . . . . . . . . 1129.2.3 Results and Discussion . . . . . . . . . . . . . . . . . . . . . . . . . . . . 113
9.3 Chapter Summary and Conclusions . . . . . . . . . . . . . . . . . . . . . . . . . 115
iii

Contents
10 Sentence Unit Segmentation of Czech Corpora 117
10.1 Differences between Czech and English . . . . . . . . . . . . . . . . . . . . . . . 11710.2 Related Work on Czech . . . . . . . . . . . . . . . . . . . . . . . . . . . . . . . 11810.3 Data and Experimental Setup . . . . . . . . . . . . . . . . . . . . . . . . . . . . 119
10.3.1 Segmentation Task for Czech Data . . . . . . . . . . . . . . . . . . . . . 11910.3.2 Experimental Setup . . . . . . . . . . . . . . . . . . . . . . . . . . . . . 11910.3.3 Speech Recognition System for Czech . . . . . . . . . . . . . . . . . . . 120
10.4 SU Segmentation Based on Textual Information . . . . . . . . . . . . . . . . . . 12110.4.1 Textual Features . . . . . . . . . . . . . . . . . . . . . . . . . . . . . . . 12110.4.2 Experimental Results . . . . . . . . . . . . . . . . . . . . . . . . . . . . 123
10.5 SU Segmentation Based on Prosodic Information . . . . . . . . . . . . . . . . . 12710.5.1 Experimental Results for Prosodic Models . . . . . . . . . . . . . . . . . 12710.5.2 Prosodic Feature Usage . . . . . . . . . . . . . . . . . . . . . . . . . . . 129
10.6 SU Segmentation Using Both Textual and Prosodic Information . . . . . . . . . 13210.6.1 Results for BN Corpus . . . . . . . . . . . . . . . . . . . . . . . . . . . . 13210.6.2 Results for RF Corpus . . . . . . . . . . . . . . . . . . . . . . . . . . . . 13310.6.3 Result Comparison across Corpora . . . . . . . . . . . . . . . . . . . . . 133
10.7 Combination of All Three Modeling Approaches . . . . . . . . . . . . . . . . . 13410.7.1 Results for BN Corpus . . . . . . . . . . . . . . . . . . . . . . . . . . . . 13510.7.2 Results for RF Corpus . . . . . . . . . . . . . . . . . . . . . . . . . . . . 13510.7.3 Result Comparison across Corpora . . . . . . . . . . . . . . . . . . . . . 135
10.8 Chapter Summary and Conclusions . . . . . . . . . . . . . . . . . . . . . . . . . 136
11 Conclusion 139
11.1 Contributions . . . . . . . . . . . . . . . . . . . . . . . . . . . . . . . . . . . . . 13911.2 Summary and Main Conclusions . . . . . . . . . . . . . . . . . . . . . . . . . . 140
11.2.1 Creation and Analysis of Czech Data Resources . . . . . . . . . . . . . . 14011.2.2 Development and Evaluation of Automatic Sentence Segmentation Systems141
11.3 Future Work . . . . . . . . . . . . . . . . . . . . . . . . . . . . . . . . . . . . . 144
A Annotation Tool for Czech MDE 147
B List of Prosodic Features 149
C Examples of Automatically Segmented Speech Transcripts 153
C.1 ICSI Meeting Data . . . . . . . . . . . . . . . . . . . . . . . . . . . . . . . . . . 154C.2 Czech BN Data . . . . . . . . . . . . . . . . . . . . . . . . . . . . . . . . . . . . 155C.3 Czech RF Data . . . . . . . . . . . . . . . . . . . . . . . . . . . . . . . . . . . . 156
Bibliography 157
List of Publications 167
iv

Abstract
Current automatic speech recognition (ASR) systems are able to transcribe large volumes ofspeech data with reasonable accuracy. However, automatic transcripts produced by these sys-tems often do not have a form convenient for subsequent processing. The problem is thatstandard speech recognizers output only a raw stream of words, leaving out important struc-tural information such as locations of sentence or dialog act boundaries. Natural languageprocessing techniques used in downstream processing (e.g., text summarization, informationextraction, machine translation) are typically trained on well-formatted text, and fail on un-structured streams of words. This thesis deals with the problem of automatic segmentationof speech recognition output into sentence-like units. The work is focused on two languages –English and Czech.
Since no Czech speech corpora with appropriate annotation of sentence-like units had beenavailable, they had to be prepared as part of this thesis. I describe creation of two Czechspeech corpora with structural metadata annotation in two different domains: broadcast news(mostly read-aloud speech) and broadcast conversations (spontaneous speech). The employedannotation scheme creates boundaries between natural breakpoints in the flow of speech, flagsnon-content words for optional removal, and identifies sections of disfluent speech. Then Ipresent a detailed analysis of the annotated corpora in terms of structural metadata statistics.
The main goal of this work is to develop automatic systems for dialog act segmentation ofEnglish multiparty meetings and sentence unit segmentation of the two new Czech corpora. Iuse and compare three modeling approaches – hidden Markov models, maximum entropy, anda boosting-based algorithm called BoosTexter. All of these approaches rely on two informationsources – recognized words (what was said) and prosody (how it was said).
Features extracted from the recognized words describe lexical patterns associated withsentence-external and sentence-internal interword boundaries. I explore features capturingword identities, parts of speech, and automatically induced word classes. Prosodic featuresare used to reflect breaks in temporal, intonational, and loudness contours in an utterance.In the approaches I employ in this thesis, prosodic features for automatic classification areextracted directly from the speech signal based on ASR time alignments, without any needfor hand-labeling of prosodic events.
All methods are evaluated on two types of speech transcripts – manual transcripts (ref-erence conditions) and automatically-generated transcripts (ASR conditions). The resultsindicate that superior performance is achieved when the three statistical models are combinedvia posterior probability interpolation. Furthermore, feature analysis reveals that English andCzech slightly differ in overall feature usage patterns. In addition to experiments in a stan-dard speaker-independent fashion, I also explore speaker-dependent modeling for the Englishmultiparty meeting domain. The experimental results show that speaker adaptation of bothprosodic and language models yields modest yet significant improvement for sentence-like unitsegmentation.
v


Abstrakt
Systémy automatického rozpoznávání řeči (automatic speech recognition, ASR) jsou již dnesschopny přepisovat velké objemy řečových dat s uspokojivou přesností. Problémem ale je, žetyto automatické přepisy nemají formu vhodnou pro následné zpracování. Standardní ASR sys-témy generují pouze nestrukturovaný proud slov, který neobsahuje žádnou interpunkci. Tentofakt nejenom snižuje čitelnost těchto přepisů, ale také způsobuje problémy při jejich následnémautomatickém zpracování. Systémy zpracování přirozeného jazyka (např. automatická suma-rizace textu, automatická extrakce informací, automatický překlad) jsou obvykle natrénoványna formátovaném textu, a proto na automatických přepisech nezřídka selhávají. Tato diser-tační práce se zabývá problémem automatické segmentace těchto přepisů do větných jednotek.Zaměřuje se na dva jazyky – angličtinu a češtinu.
Jelikož nebyly k dispozici žádné české řečové korpusy s vhodnou anotací hranic větnýchjednotek, musely být připraveny v rámci této práce. Byly vytvořeny dva české korpusy sanotací tzv. strukturálních metadat. Tyto korpusy obsahují řeč ze dvou rozdílných oblastí –rozhlasových a televizních zpráv (převážně čtená řeč) a diskusních pořadů (převážně spontánnířeč). Použité anotační schéma v řeči definuje hranice syntakticko-sémantických jednotek, oz-načuje výplňová slova a vymezuje oblasti neplynulé řeči. V práci dále porovnávám četnostivýskytu jednotlivých druhů strukturálních událostí v obou korpusech.
Hlavním cílem práce je vytvořit systémy pro automatickou segmentaci řeči do větnýchjednotek pro tři různé korpusy – anglický korpus pracovních schůzek a dva výše zmíněné českékorpusy. V práci používám a srovnávám tři statistické modely – skrytý Markovův model,model maximální entropie a boostingový model BoosTexter. Všechny tři modely využívajídva základní zdroje informací – rozpoznaná slova (co bylo řečeno) a prozódii (jak to bylořečeno).
Klasifikační příznaky získané z rozpoznaných slov popisují mimo slovních tvarů také je-jich morfologické značky. Dále využívám i metody automatického shlukování slov do tříd.Prozodické příznaky zachycují nespojitosti v melodických, hlasitostních a temporálních kon-turách řeči. Všechny prozodické příznaky jsou získány přímo z řečového signálu na základěčasových značek získaných ze systému ASR. Pro trénování systému tedy nejsou třeba data sruční anotací prozodických jevů.
Všechny použité metody jsou vyhodnoceny na dvou druzích řečových přepisů – ručních aautomatických. Výsledky ukazují, že největší přesnosti segmentace je dosaženo, když jsouvšechny tři zkoumané statistické modely zkombinovány pomocí interpolace aposteriorníchpravděpodobností. Analýza použitých příznaků dále odhaluje, že angličtina a čeština se mírněliší v tom, jaké příznaky jsou pro jejich segmentaci nejdůležitější. Mimo standardních ex-perimentů nezávislých na řečníkovi zkoumám také možnosti adaptace modelů na konkrétníhořečníka, která je zajímavá pro oblast pracovních schůzek, ve kterých se obvykle řečníci opakují.Experimentální výsledky signalizují, že adaptace jazykových i prozodických modelů přinášímalé, ale statisticky významné zlepšení celkové přesnosti segmentace do větných jednotek.
vii


List of Figures
1.1 Diagram of the sentence segmentation task . . . . . . . . . . . . . . . . . . . . 2
2.1 Structure of an edit disfluency . . . . . . . . . . . . . . . . . . . . . . . . . . . . 11
3.1 Schematic diagram of the direct prosody modeling approach . . . . . . . . . . . 23
5.1 Relative frequencies of Czech POS in all data, DelRegs, and corrections . . . . 57
6.1 Prosodic feature extraction region spanning the previous, the current, and thefollowing word . . . . . . . . . . . . . . . . . . . . . . . . . . . . . . . . . . . . 62
6.2 LTM model for F0 . . . . . . . . . . . . . . . . . . . . . . . . . . . . . . . . . . 646.3 Raw and stylized F0 contours . . . . . . . . . . . . . . . . . . . . . . . . . . . . 666.4 Scheme of pitch preprocessing for feature extraction . . . . . . . . . . . . . . . 66
7.1 Example of a CART-style decision tree for sentence segmentation . . . . . . . . 80
8.1 DA segmentation error rates for individual models in dependence on used knowl-edge sources . . . . . . . . . . . . . . . . . . . . . . . . . . . . . . . . . . . . . . 101
9.1 Relative usage of prosodic feature groups for native and nonnative speakers . . 109
10.1 Prosodic feature group usage for Czech corpora (BN and RF) . . . . . . . . . . 13010.2 SU segmentation error rates for individual models in dependence on used knowl-
edge sources . . . . . . . . . . . . . . . . . . . . . . . . . . . . . . . . . . . . . . 134
ix


List of Tables
5.1 Basic numbers about Czech Broadcast News corpus (BN) and Radioforum cor-pus (RF) . . . . . . . . . . . . . . . . . . . . . . . . . . . . . . . . . . . . . . . 32
5.2 Frequencies of filled pauses . . . . . . . . . . . . . . . . . . . . . . . . . . . . . 545.3 Proportions of discourse markers and discourse responses . . . . . . . . . . . . 555.4 Most frequent discourse markers . . . . . . . . . . . . . . . . . . . . . . . . . . 555.5 Statistics about A/Ps and EETs . . . . . . . . . . . . . . . . . . . . . . . . . . 565.6 Most frequent explicit editing terms . . . . . . . . . . . . . . . . . . . . . . . . 565.7 Statistics about edit disfluencies . . . . . . . . . . . . . . . . . . . . . . . . . . 575.8 Relative frequencies of SU symbols . . . . . . . . . . . . . . . . . . . . . . . . . 585.9 Average length of complete and incomplete SUs . . . . . . . . . . . . . . . . . . 595.10 Average length of individual SU subtypes . . . . . . . . . . . . . . . . . . . . . 59
8.1 DA segmentation error rates for LMs with various textual features . . . . . . . 968.2 DA segmentation error rates for prosodic models . . . . . . . . . . . . . . . . . 998.3 Feature usage for individual groups of prosodic features . . . . . . . . . . . . . 1008.4 DA segmentation error rates for models combining textual and prosodic features 1008.5 DA segmentation error rates for a combination of HMM, MaxEnt, and BoosTexter102
9.1 Data set sizes for individual speakers . . . . . . . . . . . . . . . . . . . . . . . . 1079.2 DA segmentation error rates by pause-only and rich prosody models for indi-
vidual speakers . . . . . . . . . . . . . . . . . . . . . . . . . . . . . . . . . . . . 1089.3 DA segmentation performance comparison of SI, SD, and SI+SD prosodic mod-
els in reference conditions . . . . . . . . . . . . . . . . . . . . . . . . . . . . . . 1099.4 DA segmentation performance comparison of SI, SD, and SI+SD prosodic mod-
els in ASR conditions . . . . . . . . . . . . . . . . . . . . . . . . . . . . . . . . 1109.5 Overall DA segmentation error rates for SI, SD, and SI+SD prosodic models . 1119.6 DA segmentation error rates of speaker-independent and speaker-adapted LMs
for individual speakers in reference conditions . . . . . . . . . . . . . . . . . . . 1139.7 DA segmentation error rates of speaker-independent and speaker-adapted LMs
for individual speakers in ASR conditions . . . . . . . . . . . . . . . . . . . . . 1149.8 Overall DA segmentation error rates of speaker-independent and speaker-
adapted LMs . . . . . . . . . . . . . . . . . . . . . . . . . . . . . . . . . . . . . 114
10.1 Data set sizes for Czech corpora . . . . . . . . . . . . . . . . . . . . . . . . . . 12010.2 Description of individual tag positions in PDT tagset . . . . . . . . . . . . . . . 12210.3 SU segmentation error rates for LMs with various textual features . . . . . . . 12410.4 SU segmentation error rates for prosodic models . . . . . . . . . . . . . . . . . 128
xi

List of Tables
10.5 Prosodic feature usage for the BN corpus . . . . . . . . . . . . . . . . . . . . . 12910.6 Prosodic feature usage for the RF corpus . . . . . . . . . . . . . . . . . . . . . 13010.7 SU segmentation error rates for models combining textual and prosodic features 13210.8 SU segmentation error rates for a combination of HMM, MaxEnt, and BoosTexter135
xii

Glossary of Abbreviations andAcronyms
A/P . . . . . . Aside/ParentheticalAIC . . . . . . Automatically Induced ClassesASR . . . . . . Automatic Speech RecognitionAuxWords . . . . . . Auxiliary WordsBER . . . . . . Boundary Error RateBL . . . . . . BaselineBN . . . . . . Broadcast NewsCART . . . . . . Classification and Regression TreeCRF . . . . . . Conditional Random FieldCTS . . . . . . Conversational Telephone SpeechDA . . . . . . Dialog ActDelReg . . . . . . Deletable RegionDM . . . . . . Discourse MarkerDR . . . . . . Discourse ResponseEET . . . . . . Explicit Editing TermEM . . . . . . Expectation-MaximizationEARS . . . . . . Effective, Affordable, Reusable Speech-to-TextEq. . . . . . . EquationF . . . . . . F-measureF0 . . . . . . Fundamental FrequencyFig. . . . . . . FigureFP . . . . . . Filled PauseGALE . . . . . . Global Autonomous Language ExploitationGMM . . . . . . Gaussian Mixture ModelHELM . . . . . . Hidden Event Language ModelHMM . . . . . . Hidden Markov ModelIAA . . . . . . Inter-Annotator AgreementICSI . . . . . . International Computer Science InstituteIP . . . . . . Interruption Point
xiii

Glossary of Abbreviations and Acronyms
L-BFGS . . . . . . Limited Memory Broyden-Fletcher-Goldfarb-Shanno MethodLDC . . . . . . Linguistic Data ConsortiumLM . . . . . . Language ModelLTM . . . . . . Lognormal Tied MixtureLVCSR . . . . . . Large Vocabulary Continuous Speech RecognitionMaxEnt . . . . . . Maximum EntropyMDE . . . . . . Metadata ExtractionMLP . . . . . . Multi-Layer PerceptronMRDA . . . . . . Meeting Recorder Dialog ActMT . . . . . . Machine TranslationNCCF . . . . . . Normalized Cross Correlation FunctionNIST . . . . . . National Institute of Standards and TechnologyNLP . . . . . . Natural Language ProcessingP . . . . . . PrecisionPC . . . . . . Personal ComputerPDT . . . . . . Prague Dependency TreebankPLP . . . . . . Perceptual Linear PredictionPOS . . . . . . Part of SpeechPOSmix . . . . . . Parts of Speech mixed with wordsPWL . . . . . . Piece-Wise LinearR . . . . . . RecallRAPT . . . . . . Robust Algorithm for Pitch TrackingREF . . . . . . Reference ConditionsRF . . . . . . Radioforum CorpusRMS . . . . . . Root Mean SquareRT . . . . . . Rich TranscriptionSD . . . . . . Speaker-DependentSDA . . . . . . Sequential Dependency AnalysisSI . . . . . . Speaker-IndependentSTT . . . . . . Speech To TextSU . . . . . . Sentence/Syntactic/Semantic/Slash UnitSVM . . . . . . Support Vector MachineToBI . . . . . . Tone and Break IndicesTTS . . . . . . Text To SpeechTV . . . . . . TelevisionUWB . . . . . . University of West BohemiaWER . . . . . . Word Error RateWHG . . . . . . Word Hypotheses Graph
xiv

Chapter 1
Introduction
For me, the big chore is always the same:how to begin a sentence, how to continue it,how to complete it.
Claude Simon
1.1 Motivation
Recent years have witnessed significant progress in the area of automatic speech recogni-tion (ASR). Nowadays, large volumes of audio data can be transcribed automatically withreasonable accuracy. However, automatic transcripts often do not have a form convenient forsubsequent processing. The problem is that standard ASR systems output only a raw streamof words, leaving out important structural information such as locations of sentence or dialogact boundaries. Such locations are overt in standard text via punctuation and capitalization,but “hidden” in speech.
As shown by a number of studies, the absence of sentence boundaries is confusing bothfor humans and computers. For example, Jones et al. [1] demonstrated that sentence breaksare critical for legibility of speech transcripts. Moreover, missing sentence segmentation makesmeaning of some utterances ambiguous. If an automatic speech recognizer outputs the streamof words “no jobs are running”, it is not clear what was said – whether it is “No jobs arerunning.” or “No. Jobs are running.” The two possible interpretations have completelyopposite meaning.
Likewise, missing sentence boundaries cause significant problems to automatic downstreamprocesses. Many natural language processing (NLP) techniques (e.g., parsing, automatic sum-marization, information extraction and retrieval, machine translation) are typically trainedon well-formatted input, such as text, and fail when dealing with unstructured streams ofwords. For instance, Kahn et al. [2] achieved a significant error reduction in parsing perfor-mance by using an automatic sentence boundary detection system, Furui et al. [3] reportedthat speech summarization improved when sentence boundaries were provided, and Matusovet al. [4] showed that the use of sentence boundaries is beneficial for machine translation.Thus, automatic segmentation of speech into sentence-like units is, without a doubt, a veryimportant task that is essential for linking automatic speech recognition and downstream NLPprocesses.
1

Chapter 1. Introduction
Figure 1.1: Diagram of the sentence segmentation task
1.2 General Task and Approach
The previous section outlined the motivation for this thesis. In this section, I take a closerlook at the general task of this work. First of all, note that the sentence segmentation taskshould not be confused with cepstrum-based signal segmentation tasks such as automaticspeech/non-speech detection. Automatic speech/non-speech detectors are only able to splitthe speech signal into segments based on a non-speech region duration threshold. This kindof speech segmentation is quite easy to obtain, however, it does not meet the requirements onsyntactic and semantic completeness imposed by the downstream NLP processes. Thus, thegoal of this work is to segment speech into linguistic (defined as syntactically and semanticallycoherent) units, instead of acoustic units (defined as bounded by silence on either end).
When addressing the sentence segmentation task, it must be taken into account that speech(especially spontaneous) is not as clearly structured as written text. In conversational speech,“sentence” is not a straightforward notion because spontaneous utterances do not consist ofsentences as we know them from prose. The linguistic units into which I aim to segmentspeech can generally be referred to as sentence-like units. Hence, the official title of thisthesis is Automatic Segmentation of Speech into Sentence-like Units. In the following text,I sometimes also use a shorter term “sentence segmentation” in place of “segmentation intosentence-like units” for the sake of brevity. Exact definitions of sentence-like units slightly differfor individual data sets used in this thesis. They are always precisely defined in correspondingchapters.
A diagram of the automatic sentence segmentation task is shown in Fig. 1.1. It is assumedthat a speech signal and an ASR output containing recognized words with correspondingtimestamps are available to be used to solve the task. The goal is to create an enrichedspeech transcript containing automatically inserted sentence unit boundaries. Therefore, theproblem is addressed as a post-processing step that generates the structural information afterthe recognition results are produced. The segmentation task can be viewed as a two-wayclassification problem, in which each inter-word boundary has to be labeled as either a within-unit boundary, or a boundary between two units.
There are two basic sources of information that can be used to solve this task — recognizedwords (what was said) and prosody (how it was said). By prosody we mean informationabout temporal, pitch, and energy characteristics of utterances. This information is basicallyindependent of word identities. To detect possible sentence boundaries in the recognized wordstream, we utilize prosodic features extracted from the speech signal, and combine them withtextual cues obtained from the word string. The question is how to model and combine theavailable knowledge sources to find the most accurate hypotheses.
The first issue is how to exploit the information contained in the word sequence. It isobvious that, in some word contexts, sentence boundaries are more probable than in others. Forexample, the English pronoun I is a strong indicator of the beginning of a new sentence. Thissubtask is referred to as language or lexical modeling. On the other hand, prosodic modeling
2

1.3. Scope of the Thesis
aims to find acoustic-prosodic contexts indicating sentence boundaries. Such examples includelong pauses or marked pitch falls. The final issue is how to effectively combine prosodic andlanguage models. It is not only possible to combine two independent models, but we can alsoconsider joint lexical and prosodic modeling.
1.3 Scope of the Thesis
The thesis deals with sentence segmentation of speech in two languages – Czech and English.For English, there has been quite a lot of material to build upon, while the starting pointfor Czech was completely different. At the time I started my research, no related previouswork in Czech had been published and no corpora with appropriate annotation were available.Hence, I had to start everything from scratch. My work on Czech not only included buildingan automatic sentence segmentation system, but also a design and creation of Czech speechcorpora with appropriate annotation.
I decided to create two corpora corresponding to two distinct speaking styles: a readspeech (broadcast news) corpus and a spontaneous speech (broadcast conversation) corpus.The first corpus was created by enriching an existing Czech broadcast news corpus, whereasthe preparation of the latter started from scratch. The annotation scheme I used went farbeyond labeling of sentence-like unit boundaries – speech disfluencies, filler words, and someother spontaneous speech phenomena were also annotated. Although automatic detectionof the additionally annotated phenomena exceeds the planned scope of this work, I wantedto prepare corpora useful for studying a broad spectrum of spontaneous speech phenomena.After the corpora had been prepared, I used them to create a sentence segmentation systemfor Czech and performed a number of various experiments.
For English, the scope of the work was a bit different. I focused on the meeting domain,which is an area of growing interest in the spoken language technology community. For allexperiments, I used the publicly available ICSI meeting corpus. In addition to experiments ina standard speaker-independent fashion, I also explored speaker-dependent modeling for themultiparty meeting domain.1
All sentence segmentation models used in this thesis are statistical, i.e. trained from datausing machine learning methods. The segmentation systems for Czech and English are trainedon different data, however, they share a common modeling groundwork. For example, theyemploy the same prosodic feature extraction methods and combine the same statistical mod-eling techniques. Three different statistical models have been explored – a hidden Markovmodel, a maximum entropy model, and a boosting-based model called Boostexter.
1.4 Thesis Organization
The remainder of this thesis is organized as follows. The text consists of eleven chaptersand three appendices. Chapter 2 summarizes important linguistic topics – differences betweenstructure of spoken and written language, prosody, and spontaneous speech. Chapter 3 surveysliterature about perception of prosodic boundaries and automatic sentence segmentation ofspeech. Chapter 4 explicitly lists goals of this thesis.
After four introductory chapters, Chapter 5 presents design, creation, and analysis ofCzech corpora with structural metadata annotation. Chapter 6 describes implementationof prosodic features used for automatic classification. Chapter 7 overviews three statistical
1Note that an explicit list of this thesis objectives is presented in a separate chapter (Chapter 4), as requiredby the dissertation guidelines of our department.
3

Chapter 1. Introduction
models used in this work – hidden Markov model, maximum entropy, and BoosTexter. Chap-ter 8 reports automatic dialog act segmentation of English multiparty meetings. Chapter 9investigates speaker-specific modeling for dialog act segmentation of meetings. Chapter 10describes experiments with sentence unit segmentation of Czech data. Finally, Chapter 11draws conclusions.
The main part of the thesis is followed by an appendix part. Appendix A introduces thesoftware tool used for metadata annotation of Czech corpora. Appendix B shows a completelist of all implemented prosodic features. Appendix C presents examples of automaticallysentence segmented speech transcripts. At the end of the text, there is a complete list ofreferences and a list of my publications.
4

Chapter 2
Linguistic Background
Thought is the fountain of speech.Chrysippus
The pen is the tongue of the mind.Miguel de Cervantes
This chapter briefly presents linguistic background important for this thesis. The chap-ter describes differences between structure of spoken and written language, suprasegmental(prosodic) features of speech, and particularities of spontaneous speech. Although these top-ics may seem to be disparate, all pertain to the sentence segmentation task. Since this workaims to automatically segment speech into units that have primarily been defined for text, itis important to note differences between linguistic units into which we can decompose spo-ken utterances and text. Speech prosody is overviewed here since I use prosodic features asimportant cues for automatic sentence boundary detection. Spontaneous speech is describedbecause two of the three corpora used in this thesis contain spontaneous conversations and itis important to know which phenomena we should expect to observe.
The chapter is organized as follows. Section 2.1 compares linguistic structural units inspoken and written language. Section 2.2 describes prosody and prosodic terminology. Notethat this section focuses mainly on a qualitative description of prosody. A description ofprosodic features as used for automatic classification is presented in Chapter 6. Section 2.3 isdevoted to the particularities of spontaneous speech. Finally, Section 2.4 gives a summary ofthe whole chapter.
2.1 Structural Units in Spoken and Written Language
Language has two basic forms: spoken (speech) and written (text). In this section, I brieflycompare linguistic unit hierarchies of the two forms of language. Because the main goal of thisthesis is to automatically segment speech into units primarily defined for written language, itis important to be aware of the differences between spoken and written language units.
In terms of a formal description, both forms of natural language can be viewed as hierar-chical systems of symbols. It is possible to represent them as a set of mutually separated unitsand a set of their relations. Elements of higher orders are composed of lower order elementsand boundaries of the higher order segments are typically consistent with the lower orderboundaries. Given the different natures of speech and text, these hierarchies are not identical.The written form of language is a system of discrete symbols. In most languages, strings of
5

Chapter 2. Linguistic Background
these symbols are interrupted at word boundaries. On the other hand, speech is a continuousacoustic signal. For the recipient, it is much more difficult to divide it into meaningful lin-guistic segments since the majority of their boundaries is not explicitly marked in the speechsignal [5].
Spoken language is directly dependent on speech production physiology. Thus, its hierarchydepends on the way an utterance is produced. The smallest segmental unit of speech is aphoneme, however, the smallest stretch of speech into which a speaker is able to divide his/herutterance is a syllable. Syllables are often considered the phonological “building blocks” ofwords. The general structure of a syllable consists of onset, nucleus, and coda. The nucleus(sometimes also called peak) is the central part of the syllable and typically consists of a vowel.The onset is the syllable part preceding the nucleus, whereas the coda comprises all consonantsounds that follow the nucleus. The final part of each syllable (nucleus plus coda) is called arhyme.
The smallest lingual unit that carries a semantic interpretation is a morpheme. Examplesof morphemes are prefixes, suffixes, or roots. They are defined in both spoken and writtenlanguage. It is not possible to specify whether morphemes are on the higher or lower levelthan syllables in the spoken language unit hierarchy. Their boundaries may overlap sincemorphemes can be smaller than a syllable as well as span over several syllables; phonologicand semantic boundaries apparently do not have to coincide.
In continuous speech, syllables tend to form rhythmical groups of similar lengths. Suchgroups are typically indicated by stress, the relative emphasis given to certain syllables. Inthe linguistic literature, these groups are referred to as feet, stress-groups, prosodic words, orphonemic words. Several feet fluently pronounced one after another form a larger intonationalunit – intonational phrase. Speakers indicate relationships of different intensities between theintonational phrases to express their mutual relation.
A compact group of intonational phrases compose an utterance unit (or sentence-like unit).In spoken language as well as in text, it is also possible to define units larger than a sentence.For instance, a portion of speech in a dialog uttered by a single speaker while he/she holdsthe floor is defined as a turn. Likewise, a stretch of speech relating to a single topic may in alonger monolog may, in analogy with text, be marked as a paragraph. It has been shown thatboundaries between topics are signalized in speech [6, 7, 8, 9]. An utterance is the unit on thehighest level of the hierarchy.
Written language shows a different hierarchy. The smallest segmental unit is a grapheme(character), however, analogous to spoken language, the smallest unit that carries semanticmeaning is a morpheme. While in spoken language, morphemes are composed of phones, inwritten language, they are composed of graphemes. By joining morphemes we get words, wordsconstitute clauses and sentences, sentences form paragraphs, and a sequence of paragraphs istext.
The alignment between the two language unit hierarchies may be outlined as follows. Onthe segment level, there are phonemes vs. graphemes. The degree of agreement between themdiffers language to language. For example, in Czech, there is a tight agreement given thephonetically-based spelling rules, whereas for English, which does not have exact letter-to-sound rules, the correspondence is not that good. On further levels, there is a relationshipbetween feet and words. For instance in Czech, feet are often identical with written words,but also may comprise several words (e.g., a preposition plus a noun). Intonational phrasestypically have an equal or shorter length than clauses, however, in some special cases theymay span over two clauses. The average length of an intonational phrase in Czech is betweentwo and three feet. The relationship of written and spoken “paragraphs” has already beenmentioned above, text and utterance are well-corresponding units on the highest level of the
6

2.2. Prosody
hierarchy.For this work, a critical part of the comparison is the alignment of written sentences and
spoken sentence-like units. While a sentence is a clearly defined notion for text, the notion“sentence-like unit” does not have a standardized definition in the literature. In particular, itis often difficult to distinguish between boundaries of compound clauses within a sentence andboundaries between two (compound) “sentences” in speech. I use two distinct definitions ofsentence-like units in this thesis. For English meeting data, these units are defined as dialogacts (DAs), while for Czech broadcast corpora, they are defined as syntactic-semantic units(SUs) according to the MDE standard (detailed definition is presented in Chapter 5). Althoughthe two definitions differ slightly (in particular, some types of grammatically subordinateclauses may form a complete DA, but not a complete SU), both of them rely on the idea ofdividing speech into meaningful units having a minimal possible length. Thus, we can say thatthese units are typically shorter (or at most equally long) than sentences in standard text.
2.2 Prosody
The description of prosody is useful for this work because prosodic cues are important indica-tors of sentence-like unit boundaries in speech, and may be employed in automatic sentencesegmentation systems. In this section, I describe the most important prosodic phenomena andalso overview standard prosodic terminology.
2.2.1 Suprasegmental Information in Speech
A speaker’s utterance contain more information than just identities of the uttered words.It is not only important to know what was said, but also how it was said. This additionalinformation which may not be encoded by grammar is referred to as prosody. A typical featureof prosody is that it is linked to stretches of speech larger than a segment (phoneme), i.e.syllables, words, phrases, or entire utterances. That is why we also refer to prosodic featuresas suprasegmental features of speech. Among others, prosody may convey to the listener thefollowing information:
• Whether an utterance is a question, a statement, or an imperative;
• Speaker’s state of mind;
• Whether the speaker is being sarcastic or ironic;
• Which word(s) in the message carry the most important information;
• Syntactic structure of an ambiguous utterance;
• Locations of word, phrase, and sentence boundaries.
The term prosody is derived from the Greek word πρoσωδια, which is a musical termmeaning something like “song sung to music” or “sung accompaniment”. In more recent usage,the term has come to be used to refer to rhythmical structure of verse in poetry. Linguistics hastaken over the term prosody to refer to “musical” features of actual language utterances [10].
In the area of automatic speech processing, prosody has largely been used in Text-to-Speech(TTS) synthesis. Since monotonic speech sounds highly unnatural, generating prosodically richspeech is critical for success of TTS systems. In recent years, speech scientists have also startedto more often use prosody in speech recognition and understanding applications. The tasks
7

Chapter 2. Linguistic Background
for which use of prosodic features has been studied include linguistic segmentation of speech(focus of this thesis), fast endpointing in spoken dialog systems, emotion recognition, or speechrecognition itself.
2.2.2 Levels of Prosody Description
Suprasegmental features perceived by the listener include length, pitch, loudness, rhythm, andspeaking rate. It is not possible to measure these human-perceived features from a speechsignal directly; we can only measure their correlates. For instance, loudness is correlated withshort term energy of the speech signal and pitch is correlated with fundamental frequency (F0)of the signal [11]. Thus, we should distinguish the acoustic (measurable) and psychoacoustic(perceived) level of prosody.
Prosody also has a linguistic description. In this description, we only take into accountthose features that are “linguistically significant”. These are only those that represent speaker’slinguistic intention and can be recorded as a sequence of symbols [12]. Such features aretypically expressed as a combination of several acoustic features. These combinations are notexactly determined since the same linguistic intention may be expressed using different means– less expressive use of one acoustic feature may be compensated by stronger use of another.
Prosody is also influenced by paralinguistic events. These phenomena are defined as allnonlinguistic and nonverbal elements of communication, regardless whether they are percep-tible from voice (voice quality, voice color) or not (gestures, facial expressions). They expressan emotional and visceral state of the speaker by affecting realization of the verbal message.
2.2.3 Prosodic Terminology
The following subsections overview the most important terms of prosodic terminology. Theterminology is not standardized in the literature. A number of terms have varying definitionsand some terms (such as intonation or melody) are used to refer to more than one phenomenon.Thus, I find important to clarify here in which meaning the prosodic terms are used in thisthesis.
2.2.3.1 Stress, Accent, Rhythm
In phonology, stress is a relative emphasis given to certain syllables in a word. We oftendistinguish two terms: stress and accent (or pitch-accent). The term stress usually denotesa “potential feature”, while the term accent stands for a realized emphasis [5, 13]. However,some other authors use these two terms as synonyms.
The accent is a complex event comprising intensity, pitch, and duration. An accentedsyllable is typically not recognized based on absolute values of acoustic-prosodic quantities,but rather based on contrast with syllables in its vicinity. In other words, the accented syllablemay show, for instance, either a lower or higher pitch than the surrounding syllables. We canalso observe that phonemes in accented syllables are usually more carefully articulated [14].
A placement of stress within a foot may either be fixed to a given syllable (Czech, Finnish– stress always on the first syllable, Polish – always on the penult syllable, etc.), or comes aspart of the word and must be memorized (so called lexical stress – English or Italian). Besidethe primary stress, longer feet may also show secondary (less prominent) stress. Overalldistribution of stressed syllables within an utterance sets the rhythm (or timing) of speech.
The timing is determined by segmentation of the continuous stream of syllables into groupshaving similar length and acoustic characteristics. There are two basic ways in which languagesdistribute syllables across time: stress timing and syllable timing. In syllable-timed languages,
8

2.2. Prosody
every syllable is perceived as taking up roughly the same amount of time (e.g., Czech orFrench). By contrast, syllables in stress-timed languages may have different duration, but thereis a roughly constant time period between each pair of adjacent stressed syllables (e.g., Englishor German).
2.2.3.2 Focus
Besides word accent, we also recognize semantic accent – focus (also focal accent). This accentis not linked with words but with sentences or clauses. It does not indicate prominence of asyllable but prominence of a word. The emphasized word usually shows a stronger stressedsyllable with higher or lower pitch, or eventually it is longer or shorter. In Czech, it is usualthat focus is on the last foot of the sentence. By changing its placement, the speaker maymodify meaning of the utterance as it is outlined in the following example.
A better result was achieved by Czech women. (in contrast to Czech men)A better result was achieved by Czech women. (in contrast to Slovak women)
2.2.3.3 Melody, Intonation, Intonation Patterns
The term melody of speech refers to a pitch curve within an utterance. The term intonationis also often used as a synonym of melody. One way how to formally describe a melody of anutterance is to disarticulate its pitch curve into abstract melodic patterns – intonation patterns(cadenza). Linguists particularly focus on intonation patterns of sentence-final intonationphrases. The following patterns are usually distinguished: falling, rising, flat, falling-rising,and rising-falling. This classification system is phonemic – it is meant to express contrastsin a succinct manner rather than specify the realization. More information on the concept ofintonation patterns is given, among others, in [5].
2.2.3.4 Pitch Declination, Pitch Reset
When analyzing the pitch contour within a single utterance unit, in general we observe agradual pitch lowering. In other words, running averages of F0 are higher on the beginningof an utterance unit than on the end. This feature of speech is usually denoted as a pitchdeclination. There are many ways how to quantitatively describe the declination. Most fre-quently it is displayed as a line connecting local pitch peaks (topline) or local pitch minima(baseline). Alternatively it can be captured using linear regression from all F0 values [15]. Thedeclination trend does not necessarily have to be linear, rarely we also observe an exponentialdeclination [16].
So-called pitch reset is often observed at utterance unit (sentence, paragraph) boundaries.The speaker returns to higher F0 values and the declination slope is usually changed. It wasshown that stronger pitch resets usually correspond with more significant boundaries. Forinstance, there typically occur stronger pitch resets at paragraph boundaries than at sentenceboundaries [8, 17, 18]. An important finding is that a breath is not necessary for pitch resets,and vice versa, a breath does not imply a pitch reset [19].
An issue is whether the pitch declination is phonetically-motivated (caused by a decrease ofair pressure in the lungs and a consequent decrease of sub-glottal pressure) or phonologically-motivated (intentionally controlled by the speaker). Since several experiments showed thatshorter sentences have a steeper slope of declination, it is considered that the declination israther purposeful although physiological causes may not be neglected [20].
9

Chapter 2. Linguistic Background
The form of the declination depends on speaking style. The differences are rather quan-titative than qualitative. A steeper declination and larger pitch reset is usually observed inread-aloud speech, however, even in spontaneous speech, we may observe correlations betweenresets and linguistic unit boundaries.
2.2.4 Prosodic Boundaries in Speech
Speakers typically join words (feet) into phrases separated by prosodic means. These into-national phrases are defined as groups of feet perceived as compact intonational units. Theircompactness is most typically based on prosodic marking of their boundaries [5, 21]. If anutterance is short, the intonational phrase may correspond to the entire utterance. On theother hand, longer utterance units cannot be uttered as a single intonation unit. Even if itwas possible, it would only make understanding harder for the listener.
As was mentioned above, intonational phrases are primarily marked by their boundaries.In general, we distinguish several types of boundaries in speech. In the literature about Czechprosody, the only recognized type of a prosodic phrase is an intonation phrase (frequentlyreferred to as an “utterance stretch”). By contrast, English literature also recognizes smallerphrasal units – intermediate phrases. In this theory, intonation phrases consist of one or severalintermediate phrases and a boundary tone.
A most frequently used standard for annotation of English intonation is called ToBI (Tonesand Break Indices) [22]. When using the ToBI annotation scheme, an index number reflectingstrength of prosodic juncture with the following word is assigned to each word in an utterance.These so-called break indices range from 0 (the strongest juncture – boundary within a cliticgroup) to 4 (the weakest juncture – boundary of an intonational phrase). More informationon the ToBI labeling system is given, for example, in [13].
The placement of prosodic boundaries is influenced by syntactic and semantic structure ofthe utterance. Speakers generally tend to realize their utterances as a sequence of intonationunits that are linguistically meaningful. In most of languages, prosodic phrasing is morerelated to syntax than to semantics. Besides these two factors, the phrasing is also influencedby rhythmic constraints. If all these three factors are in harmony and lead the speaker tothe same prosodic structure, then this structure is more markedly prosodically expressed inthe produced utterance. On the other hand, if they are not in harmony, the speaker has todeal with their discrepancy and decide which of them to prefer. While the prosodic structurefollowing semantic and syntactic structure of the message is more convenient for listeners, forthe speaker, it is easier to follow the rhythmic constraints.
2.3 Spontaneous Speech
The quality and fluency of speech is highly dependent on whether the utterance is preparedbeforehand or not. The most fluent speech is typically produced when it is read-aloud froma paper or screen, while the least fluent utterances are usually produced when the speaker iscompletely surprised by an unexpected question or unforeseen situation and has to respondspontaneously. According to the level of spontaneity, we distinguish planned and spontaneousspeech.
There is no general agreement on the spontaneous speech definition in the ASR literature.Most typically, all speech that is not read-aloud is considered to be spontaneous. When usingthis definition, we must be aware of the fact that it includes a number of distinct speakingstyles with different levels of spontaneity [23]. On the one hand, this definition includesjust repeating some prompted words, while, on the other hand, it also includes completely
10

2.3. Spontaneous Speech
I believe it’s not︸ ︷︷ ︸
Reparandum
* uh pardon me︸ ︷︷ ︸
Editing Phase
it is︸ ︷︷ ︸
Correction
a significant difference.
Figure 2.1: Structure of an edit disfluency. The asterisk (*) denotes the interruption point.
unprepared spontaneous conversations. For the remainder of this thesis, the term “spontaneousspeech” will stand for such utterances which were not prepared in detail in advance.
Spontaneous speech is described here because two of the three corpora used in this thesiscontain spontaneous conversations and it is good to know which phenomena we can expect toobserve. The description herein primarily focus on the most prominent spontaneous speechphenomenon – speech disfluencies. I also mention differences between prosody in planned andspontaneous speech.
2.3.1 Disfluencies in Spontaneous Speech
Involuntary speaker’s lapses disturbing a fluent flow of speech are referred to as speech dis-fluencies. These failures may show themselves as filled or unfilled pauses, word repetitions,corrections, or false starts. According to the terminology introduced by Shriberg in [24],disfluencies consist of the following four parts:
• Reparandum – stretch of speech that was later revised (i.e., repeated, corrected, orabandoned), and may be deleted without losing an “important” piece of information.
• Interruption Point (IP) – interword location at which point fluent speech becomes dis-fluent.
• Editing phase – temporal region spanning from the end of the reparandum to the onsetof the correction phase which may contain filled or silent pauses and/or explicit editingterm.
• Corrrection – stretch of speech that “repairs” the material in the reparandum.
The structure of disfluency is displayed in Fig. 2.1. This structure may be used to describecomplex disfluencies such as repairs or false starts as well simpler disfluencies such as filledpauses. In the latter case, the reparandum as well as the correction are empty [25].
Shriberg also showed that the probability of observing a disfluency grows exponentiallywith the length of the uttered sentence [26]. It also has been shown that disfluencies occurmore frequently in the initial part of the sentence than in the final part. The number ofdisfluencies also differ between monologs and dialogs. The disfluencies occur more often indialogs since they are more difficult to be managed by the speakers. An interesting observationis that speakers produce less disfluencies when speaking with computers than with humans.However, this is expected to change when automatic spoken dialog systems become morenatural.
Despite all the difficulties in producing spontaneous speech, we cannot say that it representan inferior form of communication than read-aloud speech. For example, professional TV andradio anchors try to speak spontaneously when interviewing their guests in studio. Thus,spontaneous speech is not a synonym for sloppy speech [27]. The following subsections describethe most frequent types of disfluencies.
11

Chapter 2. Linguistic Background
2.3.1.1 Filled Pauses
If a speaker gets in trouble and does not know which word should he/she use at the moment,an inarticulate sound filling a pause in the utterance is usually produced. It signals that thespeaker is not done, and wants to keep holding the floor. In English, we recognize two typicalinstances of filled pauses (FPs): “um” (longer with a nasal component), and “uh” (shorterwithout a nasal component). Speakers often pronounce filled pauses with a lower pitch andtheir duration is longer than standard duration of the spectrally most similar phonemes [7].Since it has turned out that filled pauses discomfort machines more than people, spokenlanguage processing researchers have increased their attention to them in recent years. Anexample of an utterance with an FP follows.
This has already been reported by * uh︸︷︷︸
Editing Phase
Ivanov.
FPs can occur separately as well as in editing phases of various complex disfluencies.Freestanding FPs are frequently produced when the speaker searches for a proper word. Insuch cases, the filled pause is typically followed by a highly informative word or phrase. Filledpauses also frequently appear at the very beginning of an utterance when the speaker holdsthe floor but does not know how to start. Another typical occurrence locations are boundariesbetween syntactic constituents since speakers tend to produce their utterances in consistentunits [28]. Filled pauses may also mark start of a new topic in a longer stretch of speech [27].For spoken English, it has also been reported that um is more frequently used at utteranceunit boundaries, while uh is typically used inside a unit [24]. A detailed survey on using uhand um in spontaneous English is given in [29].
A frequently discussed problem is how listeners use filled pauses for processing and un-derstanding of an utterance. The view that listeners “ignore” them was prevailed by theestimation that they perceive their communication function. This finding is in correspondencewith the theory of the full-value of spontaneous speech. FP locations may be important fea-tures for automatic linguistic segmentation of speech, however, the problem is that their useis strongly dependent on an individual speaking style. Fox Tree [30] argued that ums seem toaid comprehension by directing listeners’ attention to the upcoming phase, while, by contrast,uhs have no effect on human word recognition, possibly because the effects were masked bypausing.
Beside by FPs, a disfluency may also be signaled by a silent pause. Such disfluencies areespecially overt at places where there is no syntactic or semantic motivation for a silent pauseor where the pause is inadequately long.
2.3.1.2 Repetitions
Repetition disfluencies occur when a speaker repeats a word or phrase. By repeating, thetalker gains some additional time to plan the rest of the utterance. In our disfluency notation,the reparandum of the repetition disfluency contains all but the last repetition and the editingphase contains a filled pause or is empty. If there is more than just one repetition, we candescribe its structure using nested disfluencies. The number of editing phases and IPs is thenequal to the number of times the phrase is repeated. Thus, the ultimate repair only containsthe last repetition.
Repetitions in spontaneous speech were analyzed by Clark and Wasow [31]. They dividedrepeats into four stages: initial commitment, suspension of speech, hiatus, and restart of the
12

2.3. Spontaneous Speech
constituent. In the notation used in this thesis, these stages correspond to reparandum, in-terruption point, editing phase, and correction. In a so-called commit-and-restore model ofrepeated words, Clark and Wasow hypothesized that the more complex is a constituent, themore likely a talker is to suspend it after an initial commitment to it. Moreover, they claimedthat speakers prefer to produce constituents with a continuous delivery, and that speakersmake a preliminary commitment to constituents, expecting to suspend them later. Their hy-potheses are supported by the finding that in spontaneous English, function words are repeatedmore frequently than content words. An example of a repetition disfluency follows.
So let’s︸ ︷︷ ︸
Reparandum
* uh︸︷︷︸
Editing Phase
let’s︸ ︷︷ ︸
Correction
do it the other way round.
2.3.1.3 Corrections
Corrections are the most typical examples of a disfluency. A typical example of a correctionhas already been displayed in Fig. 2.1.
2.3.1.4 False starts
False starts occur when a talker decides not to repair an inaccurate part of the utterance,but rather abandons it completely and starts to reformulate the message from the beginning.The false starts apparently aggravate speech understanding [30]. An example of a false startdisfluency follows.
This is really * really︸ ︷︷ ︸
Reparandum
* uh︸︷︷︸
Editing Phase
you can see that it works︸ ︷︷ ︸
Correction
.
2.3.1.5 Disfluencies with Explicit Editing Terms
Talkers sometimes utter words or phrases not relating to the semantic content of the utterancebut having a different metalinguistic function. Explicit editing terms are examples of suchphrases. These terms may appear in disfluency editing phases to explicitly indicate that thespeaker made a mistake in his/her utterance. An example of a disfluency with an explicitediting term follows.
I know the kids︸ ︷︷ ︸
Reparandum
∗ uh or rather︸ ︷︷ ︸
Editing Phase
some of the kids︸ ︷︷ ︸
Correction
will like this idea.
2.3.2 Prosody in Spontaneous Speech
When reading aloud, speakers know how long sentences they are going to read and thus mayplan their prosody in advance. On the other hand, when speaking spontaneously, the planningof prosody is much more difficult. Moreover, prosody of spontaneous speech is largely affectedby disfluencies disrupting continuity of prosodic trends. Consequently, we can conclude thatspontaneous prosody is much less regular than prosody of planned speech. Various linguisticliterature [11, 15, 32, 33, 34, 35] reports the following particular differences between prosodyof planned and spontaneous speech:
• Differences in pausing – pauses are more frequent in spontaneous speaking and they alsooccur at locations where they do not have syntactic or semantic motivation.
13

Chapter 2. Linguistic Background
• Differences in pitch declination – the declination is less steep (or completely missing) inspontaneous speech and pitch resets are less perceptible.
• Differences in mean pitch – average of pitch values is usually lower in spontaneous speech.
• Differences in duration – preboundary lengthening is not that regular and expressive inspontaneous speaking as well as its relation with the strength of a boundary may differ;regularity of segment duration may be disrupted by disfluencies, duration of segmentsin corrections is usually shorter.
2.4 Chapter Summary
In this chapter, I have presented linguistic background to aid understanding of my thesis,particularly for non-linguists. First, I described differences between linguistic structural unitsin spoken and written language. These differences must be taken into account since the goalof this thesis is to automatically segment speech into units that have primarily been definedfor text.
Second, I overviewed suprasegmental features of speech – prosody. The description ofprosody is useful herein because prosody is an important indicator of sentence-like unit bound-aries in speech. I described the most important prosodic phenomena and also overviewedprosodic terminology. This description is referred to in Chapter 6, which is devoted to extrac-tion of prosodic features useful for automatic classification.
Third, I summarized phenomena typical for spontaneous speech. Spontaneous speech isdescribed here because two of the three speech corpora used in this thesis contain sponta-neous conversations and it is important to know which phenomena we can expect to observe.The presented description was primarily focused on the most prominent spontaneous speechphenomenon – speech disfluencies. Differences between prosody in planned and spontaneousspeech were also mentioned.
14

Chapter 3
Related Work
If I have seen further, it is by standingon the shoulders of giants.
Isaac Newton
In recent years, a substantial amount of research has been conducted in the areas relating toautomatic segmentation of speech into linguistic units. In this chapter, I survey the literaturepresenting that research. Because I have tried to make the survey as exhaustive as possible,I have also included some very recent papers that have been published parallel with my ongo-ing work. Some specific research performed in the domains that are investigated in this thesis(corpora with structural metadata, dialog act segmentation of meetings, and sentence segmen-tation of spoken Czech) is not presented here but in the respective chapters (Chapters 5, 8,and 10), in order to enhance their readability. The survey in this chapter is categorized basedon what knowledge sources and modeling approaches have been used.
The chapter is structured as follows. Section 3.1 surveys important psycholinguistic stud-ies on perception of intonational boundaries in speech. In that section, separate subsectionsoverview studies about preboundary lengthening, pausing, local coding of prosodic bound-ary information, prosodic boundaries in Czech, and relations between syntactic and prosodicstructures. Section 3.2 refers to technology-motivated research. Before presenting results of in-dividual research groups, Subsection 3.2.1 overviews scoring metrics used for evaluation of thetasks related to sentence segmentation. Subsection 3.2.2 summarizes signal-based approachesto sentence segmentation that do not rely on speech recognition output. In contrast, Sub-section 3.2.3 describes approaches only relying on recognized words. Section 3.2.4 presentsapproaches combining textual and prosodic knowledge. Finally, Section 3.3 gives a summaryof the whole chapter.
3.1 Survey of Psycholinguistic Studies about Realization andPerception of Prosodic Boundaries
Studies about realization and perception of prosodic boundaries are important for this thesissince they provide insights that may be useful for design of prosodic features for automaticsentence segmentation systems. A number of papers has been published about perception ofprosodic boundaries in various languages – in particular English, French, Swedish, and Dutch.Although this thesis focuses only on Czech and English, I report interesting results for otherlanguages as well. Part of these results is directly applicable since some prosodic featuresare language-independent. The inter-language similarity is caused by physiologic properties
15

Chapter 3. Related Work
of vocal organs that are common for all speakers. Prosodic differences among individuallanguages are mainly displayed in the rhythm, the relation among prosodic cues, and the wayof expressing of overlapping prosodic events [16, 36].
3.1.1 Studies about Preboundary Lengthening
A lot of effort has been put into analyses of segmental duration before the boundaries. Thesephenomena are referred to as final or preboundary lengthening. It is considered that the regionin which this lengthening is most prominently displayed is the final rhyme of the last wordbefore a boundary. The final lengthening is considered not to be inborn, but the speaker has tolearn it. This view is based on the finding that children do not use it. Thus, it is necessary tostudy it for each language individually. An interesting fact is that the final lengthening do notonly appear in human speech, but is also present in bird singing, cicada chirp, or music [16].
Wightman et al. [37] reported that the lengthening in spoken English is progressive. Itmeans that the last consonant in a word (if present) is relatively more lengthened than thepreceding vowel. For spoken Swedish (radio stock market reports), it was shown that thelengthening is affected by the presence or absence of the semantic accent on the sentence-finalword since the stressed words are lengthened more [38]. The authors also reported a negativecorrelation of the final lengthening and pause duration. In such cases, a compensation ruleis applied – prosodic events may be marked using different means and less intensive use ofone mean may be compensated by stronger use of another. Another finding of that workwas that a longer lengthening corresponds to a stronger boundary. In contrast, Heldner andMegyesi [39] got contradictory results for spontaneous Swedish – the lengthening was moreprominent before weaker boundaries, while stronger boundaries were usually marked by longerpauses.
Strangert analyzed features of intonational phrases in spontaneous Swedish [40]. She foundthat 80% of intonational phrase boundaries were syntactically motivated. Most of other bound-aries occurred after function words on onsets of syntactic constituents. Moreover, she alsostudied preboundary lengthening. The lengthening of final rhymes was more prominent pre-ceding weaker boundaring. On the other hand, pauses were longer after stronger boundaries.It was also found that the lengthening was more prominent in shorter intonational phrases.
Yang [41] focused on an analysis of occurrences of pauses and final lengthening in variousforms of English broadcast news. Regarding preboundary lengthening, it was reported thatthe syllables before boundaries are the longest and syllable duration is decreasing toward aphrase onset. The lengthening usually began on the fifth syllable before the boundary.
3.1.2 Studies about Pausing
A substantial amount of research has been conducted to analyze pausing. Pauses are withouta doubt the most expressive instruments for marking of strong boundaries. Their expressivepower is strong enough to override all other prosodic means [9]. Megyesi [35] reported that,as expected, pauses were more frequent in spontaneous speech. In the already mentionedpaper [41], Yang reported that the pauses marking boundaries were longer than other pauses.The percentage of phrases separated by a pause was ranging from 35% in a spontaneousinterview to 75% in a radio story read by a single speaker. Moreover, it was found that longerpauses correspond to stronger boundaries. Van Donzel and Koopmans reported that clause,sentence and paragraph boundaries are realized using silent pauses and high boundary tonesin spontaneous Dutch [42, 43].
16

3.1. Psycholinguistic Studies on Realization and Perception of Prosodic Boundaries
3.1.3 Studies about Local Coding of Prosodic Boundaries
Interesting experiments were performed by Grosjean [44, 45]. He let a single speaker read fourEnglish sentences of different lengths. These sentences were special in that a shorter sentencewas always identical with the beginning of a longer sentence. The shared sentence-initial partwas in individual sentences followed by zero, three, six, and nine words, respectively. In aperception experiment, the author replayed the common part of the sentences to a group ofsubjects. He found that the listeners were able to guess whether the sentence ends after the lastreplayed word, and even to predict how many words come after in a particular recording. Ina consecutive experiment, he found that the subjects were also able to do the same predictionwhen they only heard last words of particular recordings. In that case, the predictions wereonly slightly less accurate. Later, he repeated the same experiment with using French sentencesinstead of English to study language-dependency. Then, the listeners were also able to tellwhether the replayed word is the last one in a sentence, but were not able to recognize howmany words would follow.
In a similar study, Carlson, Swerts, and Hirschberg focused on the issue whether speakersprosodically mark boundaries “in advance”, that is whether the listener has to hear prosodyafter the last word before the boundary to recognize the boundary [46, 47]. To analyze it, theyused a radio interview in Swedish. The subjects had to recognize the boundaries from stimulicomprising either only a single word or a two second stretch of speech. Thus, the listeners couldnot use pause duration or pitch resets as cues. Despite this fact the results showed that thelisteners were able to successfully predict the boundaries. An interesting finding was that usingthe longer, two-second stimuli did not yield a prediction improvement. It motivates a questionwhether the listeners use lexico-grammatical information at all. Hence, they repeated the sameexperiments with American subjects who did not have any knowledge of Swedish. The resultwas that the American group of listeners was in predicting the boundaries almost as good asthe Swedish group. These results as well as findings of Grosjean support the hypothesis that asignificant amount of prosodic information is contained in the last word before the boundary.It implies that it is possible to achieve good results in automatic boundary detection onlyusing local prosodic features.
3.1.4 Studies about Prosodic Boundaries in Czech
There is not a lot of published work on perception of prosodic boundaries in spoken Czech.An interesting study was done by Palková [5] who evaluated listening tests and reportedthe following findings regarding boundaries of intonational phrases. The subjects marked asstrongest the boundaries that were marked both by a pause and a characteristic intonationpattern (falling or rising). If the pause was not present, the perceptual recognition of boundarybecome more difficult. In that case, the intonation tone had to be much stronger. Otherprosodic means were not that heavily utilized and usually were only used as an accompanimentof the basic two means. For instance, slowing down toward the boundary was frequently usedtogether with a less emphatic melodic change. Another finding was that structuring theutterance into intonational phrases facilitates its understanding. Moreover, non-professionaltalkers tended to structure their speech into stretches having a roughly constant length andonly rarely used intonational phrases containing just one foot. The listeners were also able torecognize intonational phrases in spontaneous speech – the inter-subject agreement was 80 %.
17

Chapter 3. Related Work
3.1.5 Studies about Relation between Syntactic and Prosodic Boundaries
Finally, I also cite here work analyzing relations between syntactic structure and prosody.This relationship was explored by Fach [48]. He used a large broadcast speech corpus whichwas annotated by an automatic syntactic parser and measured collocations of syntactic andprosodic boundaries. The comparison of syntactic and prosodic structure is not easy to performbecause while the syntactic structure is hierarchical, the prosodic structure is considered tobe linear. Fach solved the problem by leaving the problematic segments in the syntactic treeunattached. After adjusting the data for disagreements caused by individual speaking style, heobserved that 84 % of syntactic boundaries were in correspondence with prosodic boundaries.However, although these results are interesting, the alignment of prosody and syntax remainsa debated area requiring further research.
3.2 Survey of Related Work on Sentence Segmentation andAutomatic Punctuation of Speech
3.2.1 Evaluation Metrics for Sentence Segmentation
Several different evaluation metrics have been used for performance scoring of automatic sen-tence segmentation systems. In general, there is no measure considered as a standard. In-stead, various metrics have been used in various projects. The most straightforward metric isa “boundary error rate”1 (BER) [49] defined as the number of incorrectly classified samplesdivided by the total number of samples
BER =I +MNW
[%] (3.1)
where I denotes the number of false DA boundary insertions, M the number of misses, andNW the number of words (thus also interword boundaries) in the test set. A complement ofBER defined as Acc = 100%−BER, called Classification Accuracy, is often used as well.
When using BER for performance measuring, one must be aware of the fact that a strongmajority of words (approximately 80–95% depending on the speaking style and genre) in speechtranscripts are not followed by sentence unit boundaries. Hence, relatively low absolute errorrates may be achieved by simply classifying all test samples as “non-sentence” boundaries.Thus, we always should report a “chance error rate”. This error rate coresponds to an imaginarymodel that classifies all test samples as belonging to the class having the highest prior (i.e.“no-boundary” in all our tasks). An advantage of BER is that it has a clear interpretation. Thedifferences in performance between two systems may easily be tested for statistical significance,e.g. using the Sign test [50].
Another frequently used measure is the NIST error rate, which was used for evaluation inthe DARPA EARS project. For sentence boundary detection, the NIST error rate is definedas the number of misclassified boundaries divided by the total number of sentence boundariesin the reference
NIST =I +MNSU
[%] (3.2)
where NSU denotes the number of sentence unit boundaries in reference. The difference be-tween BER and NIST is only in the denominator. While BER has the total number of wordboundaries in the denominator, the NIST metric only calculates the number of sentence bound-aries. An unnatural feature of the NIST error rate is that its values may exceed 100%. Another
1Sometimes also referred to as Classification Error Rate.
18

3.2. Related Work on Sentence Segmentation and Automatic Punctuation of Speech
drawback of this scoring method is that we cannot directly use any standard statistical testfor testing of differences in NIST for statistical significance because this metric is not basedon consistent segments [51].
Yet another popular scoring approach evaluates performance using a pair of complementarymeasures – precision (P ) and recall (R). These measures are well-known from informationretrieval systems where it is also necessary to deal with a highly skewed prior distribution.Let TP denote the number of true positives, TN true negatives, FP false positives, and FNfalse negatives. Then, precision, defined as a measure of the proportion of the detected eventlabels that the system got right, may be expressed as
P =TP
TP + FP(3.3)
Recall, defined as the proportion of the detected event labels that the system found, may beexpressed as
R =TP
TP + FN(3.4)
Precision reflects substitution and insertion errors (purity of retrieval), while recall reflectssubstitution and deletion errors (completeness of retrieval). The higher precision and recallscores are, the better we consider the evaluated system. There is typically a trade-off relationbetween P and R; for example, many empirical studies of information retrieval performancehave shown a tendency for precision to decline as recall increases.
It is often favorable to express system performance by a single number. Then, we can usea metric called F -measure, which is the harmonic mean of P and R
F =2PRP +R
[%] (3.5)
F -measure is a very popular metric in the NLP community. However, it also has some draw-backs. If we detect more than one event (for example in automatic punctuation), we must beaware of the fact that F -measure deweights deletion and insertion errors in comparison withsubstitution errors by a factor of two, as shown by Makhoul et al. [52]. Nevertheless, thisproblem is not relevant to sentence segmentation where there are no substitution errors sincewe only detect sentence boundaries. Thus, using F -measure for scoring sentence segmentationsystems is well-founded.
3.2.2 Signal-Based Approaches Not Using Textual Information
Some research has been conducted on segmentation of speech into sentence units without usingan ASR system. These methods are based on analyzing pitch, energy, and spectral features ofspeech signal. In certain conditions, these techniques may be useful since they are not affectedby speech recognition errors.
Haase et al. [53] developed a method for determining utterance unit boundaries in Ger-man broadcast news using F0 contours and energy envelopes. They employed an interestingapproach in which classified units were voiceless regions of the speech signal. For each suchregion, a set of features relating to normalized F0 and RMS energy values was extracted.These features were then used in a decision tree classifier. In the first classification step, it wasdecided whether there was a boundary or not. If yes, it was determined whether the boundarycorresponded to sentence, paragraph, or “article”. The authors reported a boundary detectionprecision of 85 % at a recall of 84 %. For determining type of the boundary, they achieved aprecision 93 % and recall 88 %.
19

Chapter 3. Related Work
A sentence boundary detection method based on prosodic features aligned with automati-cally recognized vowels, consonants, and pauses (V/C/P) was introduced by Wang et al. [54].They proposed the following technique. First, the V/C/P classification based on energy andspectral features and tracked F0 was performed. Then, sentence boundary candidates werefound in the segmented speech signal according to pause durations. Subsequently, a set offeatures corresponding to each boundary candidate was extracted. The feature set includedspeaking rate (syllables per second), pause duration, and pitch-related features (F0 range,F0 maximum and minimum, F0 onset and offset). These features were used in an AdaBoostclassifier. The achieved classification accuracy was 77.8%.
A multipass linear fold algorithm for sentence segmentation based on using discontinuitiesin the F0 contour was proposed by Wang2 and Narayanan [55]. At first, F0 was measuredfrom the speech signal. Regions in which F0 was undefined (so-called pitch breaks) werethen sorted in the ascending order with respect to their durations. In the sorted pitch breakmap, it was possible to recognize two clusters: the first one corresponded to most of unvoicedregions of speech and interword boundaries; the second corresponded to sentence boundariesand disfluencies. The two clusters were identified using a single approach smoothing the datapoints with a two-piece linear function. All pitch breaks preceding the line break were thenexcluded and the same algorithm was applied on the remaining data points. This procedurewas repeated until only a small group of sentence boundary candidates remained. Then,sentence boundaries were identified in this candidate group by applying a set of heuristic rulesreflecting typical features of sentence boundaries and disfluencies. For example, disfluenciesmore frequently occur close to sentence beginnings, sentences have approximately the samelength, sentence boundaries are typically not close to each other, pitch resets occur at sentenceboundaries, and so on. The method was tested on a subset of the Switchboard corpus anda classification accuracy of 75.0 % was achieved. This accuracy corresponds to a precision ofP = 83.8 % at a recall of R = 92.8 %. The results are interesting because only pitch-basedfeatures were employed; adding other prosodic features and textual information from an ASRsystem should yield further improvement.
3.2.3 Text-Based Approaches
Several techniques only based on using “recognized words”3 have been proposed in the lit-erature. Although I refer to these approaches as text-based, the term text is considered interms of unstructured ASR output. Hence, no features relating to text formatting (such ascapitalization or punctuation) are used in any of the methods overviewed in this section.
Gavalda et al. [56] was inspired by Palmer and Hearst’s method for sentence boundarydetection in standard text [57]. Their goal was to find clause boundaries in the speech tran-scripts from the Switchboard corpus. Their features were based on “trigger” words (30 mostfrequent words occurring at clause and sentence boundaries) and parts-of-speech. A multi-layer perceptron with two neurons in the hidden layer was employed for classification. Thebest results in terms of precision and recall (P = 84.5 %, R = 86.0 % and F = 85.2 %) wereachieved when the features were extracted from a window containing six surrounding words(three words in each direction).
Beeferman et al. introduced an automatic punctuation system called Cyberpunc [58].Their system was only focused on automatic insertion of commas, assuming predeterminedsentence boundaries. Thus, their setup largely differed from my sentence segmentation task.
2It is not the same person as Wang mentioned in the previous paragraph.3However, note that although these methods have primarily been proposed for use in speech processing
systems, many of them have only been tested on true words, ignoring word errors in speech recognition.
20

3.2. Related Work on Sentence Segmentation and Automatic Punctuation of Speech
The system searched for the optimal locations of commas maximizing the overall probabilityin the HMM framework. The authors achieved a precision P = 78.4 %, recall R = 65.6 %, andF -measure F = 70.2 %, using the Wall Street Journal corpus.
Stevenson and Gaizauskas [59] reported some experiments with sentence segmentationof transcripts from the Wall Street Journal corpus. They used a memory-based learningalgorithm. They used a bunch of text-related features including a probability that a currentword starts or ends a sentence. The achieved performance was only P = 36 and R = 35 whencase information was removed from testing transcripts. In contrast, the results significantlyimproved (P = 78 and R = 75) when capitalization information was accessible for their system.It implies that their approach is not very suitable for ASR conditions.
In order to aid automatic speech understanding, Gupta et al. [60] developed an automaticsystem for splitting strings of recognized words into clauses. Moreover, their system was alsoidentifying edit disfluencies. In successive steps, the recognized text was divided into sentences,cleaned of edit disfluencies, and split into clauses. The segmentation was viewed as a taggingproblem and a boosting based approach was employed. Their features included three wordsand POS tags in both directions from the boundary of interest, and numbers of identicalwords and tags in the analyzed window. The method was tested on reference transcripts fromthe Switchboard corpus. For the clause segmentation subtask, they reported P = 63.8 %,R = 58.5%, and F = 61.1%. They also compared their method with a baseline trigram modeland reported improved F -measure by 21.4 % absolute.
Same as Beeferman et al., Shieber and Tao [61] focused on automatic comma restorationfor English speech transcripts. However, in contrast with Cyberpunc, their method employedparsing. They found that the presence of comma is correlated with a number of syntacticsubtrees having their left boundary at the same place. By adding this information into theirlanguage model, the number of correctly annotated sentences raised from 47 % to 58 %.
Mrozinski et al. [62] employed a combination of word- and class-based N -gram LMs forautomatic sentence segmentation of speech. Instead of using standard Viterbi search algorithm,they employed a procedure in which local probabilities were combined with matching recursivepaths by keeping track of N2 most probable paths leading from wi−N to wi. However, the twosearch methods were not compared so that no conclusions about their efficiency could have beendrawn. The method was tested on broadcast news data as well as on spontaneous conferencelectures. They also showed that proper automatic sentence segmentation was essential toachieve good results with automatic speech summarization systems.
Lee at al. [63] used text-based automatic punctuation restoration as part of their automaticspeech-to-speech translation system. In their approach, sentence boundaries were alreadyknown, so only commas were predicted. They used a very simple method in which a commawas recognized if its N -gram probability given the word context exceeded a fixed threshold.
A number of papers have been published on text-based segmentation of spoken Japanese.However, given a specific syntactic structure of Japanese language (clause boundaries aremarked by conjugated forms of verb phrases or conjunctive particles, so various types ofboundaries may be identified quite precisely by referring to POS tags), it seems not to bepossible to easily port these methods to other languages. For example, Takanashi et al. [64]developed a semi-automatic method for identification of clause boundaries in spontaneousJapanese. Their approach was to detect boundaries using a set of conversion rules referring toPOS tags.
A sentence boundary detector based on the Structured Language Model (SLM) [65] wasdeveloped by Mori et al. [66]. SLMs are LMs based on a combination of parsing and N -gram models using a probabilistic parametrization of a shift-reduced parser. The idea behindthe SLMs is that the next word can be more accurately predicted from words on which it
21

Chapter 3. Related Work
potentially depends rather than from simple N -grams. In the first step of Mori’s sentenceboundary detection method, sentence boundary candidates were found according to pausedurations (threshold 300 ms). These sentence boundary candidates were then classified usingSLMs. The authors reported a slight performance improvement compared to an N -gram modeltesting on a Japanese radio lecture corpus.
A text-based sentence boundary detector for Japanese relying on using sequential depen-dency analysis (SDA) combined with automatic chunking was presented by Oba et al. [67].The proposed SDA method extracts a dependency structure of unsegmented word sequencesusing a subsidiary mechanism of sentence boundary detection. To reflect local properties ofword sequences as well as their appropriateness to form a sentence, the SDA method wascombined with automatic chunking in the conditional random field framework. The methodwas only tested on human transcriptions from the Corpus of Spontaneous Japanese, so it isnot clear how sensitive it is to word errors.
3.2.4 Approaches Combining Textual and Prosodic Cues
3.2.4.1 SRI-ICSI Approach Based on HMMs
In the past decade, a substantial amount of research on automatic sentence segmentation ofspeech has been conducted by Shriberg, Stolcke, and their colleagues at SRI and later at theInternational Computer Science Institute (ICSI). Their methods are based on the idea of directmodeling of prosody [68]. In this approach, prosodic features relating to detected events areextracted directly from the speech signal and ASR output, and the estimation of prosodicmodel parameters is done via a machine learning algorithm. The prosodic model directlyoutputs detected event posteriors. The direct modeling approach is in contrast with theapproaches utilizing prosodic information via some abstract prosodic labels (such as ToBI).In those “indirect” approaches, prosodic classifiers are used to automatically recognize theprosodic labels [69, 70], that are subsequently used as features in a downstream classifier [71,72, 73].
The direct modeling approach has several advantages. First, building such models is lesstime consuming since it does not involve any hand-labeling of prosodic events in training data.In addition, it simply bypass potential problems with subjective perception of prosody byhuman labelers. Moreover, this approach is not only labor saving but also yields good results.It benefit from the fact that the prosodic model is optimized for detection of predicted eventsrather than for automatic assignment of prosodic labels. Besides sentence segmentation ofspeech, the direct modeling approach has also been applied to classification of dialog acts,emotion recognition, disfluency detection, and speaker verification. A diagram of a systembased on the direct modeling approach is displayed in Fig. 3.1.
Shriberg, Stolcke et al. originally proposed to combine lexical and prosodic features in theHMM framework [49]. The HMM-based approach is one of the approaches I employ in mywork. Since the combination approach itself will in detail be described in Chapter 7, alongwith other used techniques, I only summarize the results achieved by this approach in thissection.
The SRI-ICSI group tested the HMM approach both in read-aloud and spontaneous speechcorpora [74, 49]. They utilized prosodic features relating to pause, phone, and rhyme dura-tions, and pitch and energy. Their results demonstrated that the combined model employingboth lexical and prosodic features generally outperforms models utilizing just one informationsource. They also showed that for testing on real ASR transcripts, word recognition errors gen-erally cause more degradation for lexical than for prosodic features. For broadcast news data,the overall BER was 3.3% in reference conditions (forced alignment of human transcripts) and
22

3.2. Related Work on Sentence Segmentation and Automatic Punctuation of Speech
Figure 3.1: Schematic diagram of the direct prosody modeling approach. White boxes indicateprocessing in standard ASR systems, gray boxes indicate processing added in the prosody modelingapproach [68].
10.8% in ASR conditions (fully automatic transcripts). For the telephone speech corpus, theyreported BER = 4.0% in reference and BER = 22.2% in ASR conditions.
It was also found that usage of individual prosodic features is corpus-dependent. Thoughpause duration was always the most used feature, other top features differed across corpora.While F0 features prevailed for read-aloud speech, duration features dominated in the conver-sational speech corpus.
More recent results of the same team using the HMM approach were published by Liu et al.in [75]. However, the results are difficult to compare with the original experiments because: (1)they only reported results in the NIST metric; (2) the experimental setup including a sentenceboundary definition differed from the original experiments. The reported NIST error rateswere 48.7% and 55.4% for Broadcast News, and 31.5% and 43.0% for telephone conversations,respectively.
Hillard et al. [76] extended the HMM approach by leveraging multiple ASR hypotheses inorder to provide more robustness to ASR errors. Posterior probabilities for each hypothesizedword sequence were estimated via HMMs, and subsequently, the hypotheses were combinedusing confusion networks to determine the overall most likely sequence of events. Moderatebut statistically significant improvement was reported for conversational speech. On the otherhand, for broadcast news no significant improvement was achieved.
The HMM approach with CART-style decision trees for prosody modeling was also adoptedby Kim and Woodland [77]. They experimented with automatic punctuation detection inbroadcast news speech. The authors measured performance of their system using modifiedP ,R, and F . In their measure, a half score was given when a punctuation mark was locatedcorrectly but recognized as a different type of punctuation. Two series of experiments wereperformed. The first one was focused on automatic punctuation annotation in reference manualtranscripts. For this setup, they reported P = 76%, R = 80%, and F = 78%. In the secondseries of experiments, punctuation generation was directly integrated into the ASR system byadding punctuation marks as pseudo-words into the recognizer’s vocabulary (with acousticbaseforms corresponding to silence). In this setup, prosodic information was also used forASR lattice rescoring. Automatic punctuation performance within this integrated system wasreported as P = 58%, R = 35%, and F = 44%. In addition, a small reduction in WER was
23

Chapter 3. Related Work
achieved by using the prosodic rescoring.
3.2.4.2 VERBMOBIL Approach
VERBMOBIL was a research project funded by the German government in years 1996–2000.The goal of this program was to develop a mobile automatic translator able to translatespontaneous speech from a limited domain (appointment scheduling) in real-time. The targetlanguages were German, English, and Japanese. An essential subtask of the system wasto automatically detect various linguistic boundaries. I particularly describe the results ofVERBMOBIL herein in more detail because it was the first end-to-end application in whichprosody modeling was successfully employed.
From the viewpoint of this thesis, the most interesting part of the system is the prosodymodule. The task of the module was to automatically annotate accents, sentence mood (ques-tion vs. non-question), and acoustic-prosodic and syntactic-prosodic boundaries. For referenceannotation of syntactic and prosodic boundaries, a very complex annotation scheme distin-guishing acoustic-prosodic, syntactic, syntactic-prosodic, and dialog act boundaries has beendeveloped [78]. Input to the prosodic module was a speech signal and a Word HypothesesGraph (WHG),4, while module output was a WHG annotated with the above mentioned“prosodic information”. This prosodically annotated WHG was consequently used in otherVERBMOBIL modules (such as the syntactic analysis module or the semantic module). Asopposed to off-line segmentation experiments conducted by the SRI-ICSI group, VERBMOBILoperated in real-time. On the other hand, it only worked with a much smaller vocabulary froma limited domain.
The VERBMOBIL approach to dialog act segmentation (and classification) was basedon using multi-layer perceptrons for prosodic classification (MLPs), polygram language mod-els [79], and an A∗-based search algorithm [80, 81]. The MLP classifier had two neurons in theoutput layer, one for DA boundaries and one for other word boundaries. Output scores fromthese two neurons were normalized in order to obtain posterior probabilities. The polygramlanguage model was a set of interpolated N -grams with varying N . The polygrams for bound-ary detection modeled the probability P (wi−2, wi−1, wi, ei, wi+1, wi+2) where ei correspondsto the classified boundary and wi−2, . . . , wi+2 to surrounding words. The optimal boundarysequence was then found using the A∗-based search algorithm combining the scores from theMLP and polygrams. This approach directly enabled them to join the DA segmentation withDA classification. For German data, the authors reported R = 80% for DA boundaries, andR = 96% for non-DA boundaries.
Gallwitz et al. from the same team proposed a method for simultaneous generation ofword hypothesis and linguistic boundaries [82, 83]. In this method, the language model of thespeech recognizer treated linguistic boundaries as pseudo-words, and the acoustic model wasaugmented by special HMMs representing acoustic realizations of recognized boundaries (e.g.,loud breath, filled pause, silence). In addition, a special HMM with one emitting state withouta loop corresponded to boundaries that were not acoustically marked. To combine spectraland prosodic features, they employed a hybrid architecture that joined the MLP with semi-continuous HMMs. It involved using a soft vector quantization based on a Gaussian codebook.The output of the integrated system was an annotated WHG. The system was tested on aspontaneous speech database and the results showed modest improvement in WER. More-over, the authors evaluated detection of syntactic-prosodic boundaries. In comparison with aprosody-only boundary detection model, recall improved from 75.1% to 88.2%, and precision
4In other words, it was an ASR lattice.
24

3.2. Related Work on Sentence Segmentation and Automatic Punctuation of Speech
improved from 75.3% to 78.5%. Unfortunately, a comparison with a system combining prosodyand language model was not reported.
3.2.4.3 Other Work Combining Textual and Prosodic Cues
Earlier than Gallwitz et al., Chen [84] used a combined approach of synchronous speech recog-nition and punctuation generation. His target set of punctuation was quite broad, includingcomma, full-stop, question mark, exclamation mark, colon, and semicolon. He found thatpauses in speech were closely related to punctuation, and thus decided to treat punctuationmarks as pseudo-words in the vocabulary. In his most successful experiment on a businessletter corpus, Chen achieved punctuation detection accuracy of 57%, and correct punctuationplacement (independent of punctuation type) accuracy of 83%.
Gotoh and Renals [85] presented a sentence boundary detector for broadcast news speech.They used an N -gram language model in which a label ci indicating the presence of a sentenceboundary was assigned to each word wi. The only used feature was pause duration si. Thecombination of the language and prosodic model was performed via an approximation inthe form P(s
m1 , w
m1 , cm1 ) =
∏mi=1 PPM (wi, ci|si)λ · P (wi, ci|wi−1
i−N+1, ci−1i−N+1). This score was
maximized using the Viterbi search. On ASR data with WER = 26%, their model performedsentence boundary detection at F = 70%.
The work of Gotoh and Renals was extended by Christensen et al. [86]. The followersfocused on automatic punctuation annotation in broadcast news speech. They used a richerprosodic feature set including phone duration and pitch features. The finite state automatonapproach combining the prosody and language model was adopted. The results indicated thatpause duration had significant impact on full-stop detection, but only a little influence on de-tection of other punctuation marks. Overall, F = 40% was the best result on an automaticallyrecognized broadcast news corpus with WER = 23%.
Huang and Zweig [13] investigated a maximum entropy (MaxEnt) based approach for au-tomatic punctuation from speech. Their motivation for using MaxEnt was that it allows anatural combination of lexical and prosodic features within a single model. The punctuationdetection task was viewed as a tagging problem in which one of the allowed punctuation sym-bols (comma, period, question mark, and empty symbol) was assigned to each word. Theirlexical features were extracted from the context including wi, wi+1, wi+2, wi−1, wi−2, ti−1, ti−2
(where wx correspond to words, and tx correspond to punctuation marks) using special un-igram and bigram feature templates. The lexical features were extended by pause durationfeatures measured with a precision of 10 ms. The third group of features combined wordidentities and pause durations directly on the feature level. The method was tested on theSwitchboard database, both in reference and ASR conditions (WER = 20%). To achieve accu-rate evaluation, automatic transcripts were manually punctuated. The results indicated thatcommas could not be reliably detected using just pause information since they were heavilydependent on lexical information. It was also shown that question marks were often confusedwith periods. Using ASR output instead of human transcripts decreased overall F -measurefrom 80% to 73%.
Srivastava and Kubala [87] focused on sentence segmentation of Arabic broadcast news.They experimented with an MLP having input consisting of 47 prosodic features extractedfrom a one-second window around the boundary of interest. For language modeling, a trigrammodel combined with prosodic scores in a way similar to [86] was employed. The authorsreported “detection error rate” (sum of false alarms and false rejections) to be 50.38%.
In [88], Liu et al. compared generative and posterior probability models (namely an HMMand MaxEnt) for sentence boundary detection in speech. Both models combined lexical,
25

Chapter 3. Related Work
syntactic, and prosodic information. Features for the MaxEnt model involved word N -grams,POS N -grams, class N -grams, chunking tags, speaker change flags. In addition, in order tocombine prosodic and lexical features in a single model, prosodic decision tree posteriors werediscretized in a cumulative fashion to form binary features. The methods were compared ontelephone coversations and broadcast news speech in both reference and ASR conditions. Theresults indicated that the MaxEnt model slightly outperformed HMM in STT conditions, whilethe HMM was better in STT conditions. The combination of the two approaches achievedthe best performance for all reported tasks. The MaxEnt model showed much better accuracythan the HMM in dealing with lexical information. On the other hand, the HMM made moreeffective use of prosodic features, which were more robust to word errors.
In [89], Liu et al. extended their work by using Conditional Random Fields (CRFs), whichcombine the benefits of HMM and MaxEnt models. The features used for CRF training wereidentical with the features used in the MaxEnt model. For conversational speech, the CRFmodel was slightly superior to both the HMM and the MaxEnt model. The gain from usingCRFs was highest when only using the N -gram features were used. The differences amongindividual models diminished when also other features were added. In contrast, the CRFshowed less gain on broadcast news data. When all features were used, the CRF performancewas identical with performance of the HMM. Across all conditions, the overall best resultswere achieved by three-way voting among the classifiers.
Roark et al. [72] presented a sentence segmentation method based on reranking of N -bestlists. First, the N -best lists were generated based using a baseline system. Then, the listswere reranked using a MaxEnt reranker. The features were mainly based on outputs from anumber of parsers, but the authors also used prosody in terms of automatically predicted ToBIlabels, N -gram scores, and some other features. The empirical results on conversational datashowed 2.6 % gain in NIST error rate for reference conditions, and a modest, yet statisticallysignificant improvement for ASR conditions.
For sentence boundary detection and classification in conversational telephone speech,Tomalin and Woodland [90] exploited prosodic classifiers based on discriminatively trainedGaussian mixture models. In their approach, fourgram LMs were combined with the prosodymodel in a lattice-based 1-best Viterbi decoding framework using empirically determined gram-mar scaling factors. The probabilities obtained from the prosody model were divided by eventpriors, and the resulting likelihoods were placed on the arcs of initial lattices, which were thenexpanded using the LMs in the HTK lattice tools [91]. The prosodic posteriors were generatedusing two different approaches. The first approach was based on using CART-style decisiontrees, the latter on the dicriminatively trained GMMs. For each SU subtype (statement, ques-tion, backchannel, incomplete, no-boundary), GMMs were built using maximum likelihoodtraining. Then, the GMMs were reestimated using Maximum Mutual Information training.The results indicated that the GMMs performed as well as decision trees, and, when bothmodels were interpolated, the NIST error rate dropped by 0.8% absolute over the decision treebaseline.
Zimmermann et al. [92] presented a multilingual system for sentence segmentation of En-glish and Mandarin broadcast programs. They tested several different models, including hiddenevent LM, MaxEnt, decision trees, and BoosTexter5 [93], however, their comparison was onlycomplete for lexical and pause features because a richer prosodic feature set was only testedwith the BoosTexter model. The comparison showed that the best results were achieved whenthe BoosTexter model was combined with the hidden event LM. The reported results wereNIST = 62.4% and F = 67.3% for English and NIST = 58.7% and F = 70.8% for Mandarin.
Matusov et al. [94] presented a sentence segmentation and punctuation prediction system5BoosTexter model will be discussed in more detail in Section 7.3.
26

3.3. Chapter Summary
tailored for spoken language translation. The method was based on a log-linear combinationof several independent models. The language model probability was factored into a productof a segment start, segment internal, and segment end probability. The pause model reflectednormalized pause duration at the hypothesized word boundary. Other prosodic features werenot utilized, but the authors claimed these could be added with a separate scaling factor,assuming they would provide a single posterior of a segment boundary. The authors also in-cluded an explicit sentence length probability feature having a log-normal distribution withparameters determined via a maximum likelihood estimate. Finally, a recursive search algo-rithm was employed to determine the globally optimal sentence segmentation of the document.The obtained results were slightly better than results achieved by the HMM approach trainedon the same data.
In a later paper [4], in order to couple the segmentation with the predictive power ofthe phrase translation model, the same team introduced a novel feature – phrase coverage.They also performed comma prediction to produce commas as “soft boundaries” constrainingreordering in the MT search. They concluded that the best translation results were achievedwhen segmentation algorithms were directly optimized for translation quality.
Batista et al. [95] developed an automatic punctuation restoration module as part of aPortuguese broadcast news transcription system. They focused on full stops and commas andemployed a MaxEnt approach. Their features captured word and POS information, pauseduration, and speaker changes. For sentence boundary detection, they reported P = 76%,R = 69%, and F = 73% for reference, and P = 69%, R = 48%, and F = 56% for ASRtranscripts
Once again, there is also some specific work on Japanese. Shitaoka and his colleagues [96]presented two methods for sentence boundary detection in spontaneous Japanese. The firstmethod was based on dependency information, the latter was based on SVMs viewing sentenceboundary detection as a text chunking problem. The latter method, which was found tobe superior, used the following features: morphological information of three preceding andsubsequent words (character strings, pronunciation, POS, inflection type, inflection form),normalized pause duration, clause boundary information, and dependency probabilities of thetarget bunsetsu.6 In a more recent paper, Akita et al. [97] adopted very similar approaches,and tested them on real ASR output. Again, the SVM-based method performed better thanthe statistical language model alone. As expected, the SVM-based method was also morerobust to ASR errors.
3.3 Chapter Summary
In this chapter, I have reviewed studies about perception of prosodic boundaries as well aspast work on automatic sentence segmentation of speech. First, I should point out the workof Grosjean followed by the joint work by Carlson, Swerts, and Hirschberg. Their listeningtests showed that a significant amount of prosodic boundary markup is contained in the lastword before the boundary. This finding has important implications for automatic boundaryprediction systems since it suggests that good results may be achieved even if only localprosodic features are used. Noticeable results were also presented by Fach, who showed thatmost syntactic boundaries were in correspondence with prosodic boundaries in broadcast newsspeech. However, although his results were interesting, the alignment of prosody and syntaxremains a debated area requiring further research.
A number of papers studied the phenomenon of preboundary lengthening. Some results
6Bunsetsu is a Japanese phrasal unit.
27

Chapter 3. Related Work
of perception tests were contradictory. For example, while a positive correlation of strengthof boundary and lengthening was reported for broadcast speech, a negative correlation wasobserved in spontaneous speech. Regarding pausing, it was reported that pauses are morefrequent in spontaneous conversations, in which they also often appear without a syntacticmotivation.
In the second section, I have presented a survey of automatic sentence segmentation sys-tems categorized based on what knowledge sources have been used. Among the signal-basedapproaches not relying on textual information, the multipass linear fold algorithm by Wangand Narayanan deserves most attention. They achieved encouraging results only using pitch-related features. The text-only based systems are apparently suboptimal since at least pauseinformation is essential to achieve good results. However, some of them, such as Cyberpunc,are also worth mentioning since they introduced some ideas upon which more recent researchhas been build.
Past work on automatic sentence boundary detection have shown that both lexical andprosodic cues are important and should be combined. In this thesis, I largely build upon theframework proposed by Shriberg and Stolcke. They introduced a “direct modeling” approachin which prosodic features are extracted directly from the speech signal automatically alignedwith speech recognition output. They had originally proposed to combine lexical and prosodicfeatures in HMMs but later also used other combination approaches.
A mobile speech-to-speech translator VERBMOBIL was the first end-to-end applicationin which prosody and language modeling was successfully combined. From the viewpoint ofthis thesis, the most interesting part of the system is the prosody module. The task of themodule was to automatically annotate accents, sentence modalities, and acoustic-prosodic andsyntactic-prosodic boundaries. The VERBMOBIL approach to dialog act segmentation andclassification was based on using MLPs for prosodic classification, polygram language models,and an A∗-based search algorithm.
I also got inspired by the MaxEnt approach as used by Huang and Zweig, and later, ina different fashion, by Liu et al. Furthermore, same as Zimmermann et al., I also employthe BoosTexter algorithm in my work. I also should highlight the work by Roark et al. Theircomplex approach is particularly interesting by using parsing features for hypotheses reranking.The parsing features should generally be helpful for sentence segmentation of speech, but theirdrawback is that parsing performance is largely affected by ASR errors.
Finally, note that a lot of the work summarized in this chapter has only been tested onmanual transcripts. Even though such studies may provide interesting insights, the goal of thisthesis is to develop robust methods also working well with real ASR output that contains worderrors. Thus, my experiments in this thesis are evaluated using both human and automaticallygenerated speech transcripts.
28

Chapter 4
Thesis Objectives
From now on, ending a sentence with a prepositionis something up with which I will not put.
Winston Churchill
The three preceding chapters, outlining my motivation, important linguistic background, andthe state of the art in automatic sentence segmentation of speech, represented an introductorypart of the thesis. Before describing my own work, this chapter explicitly lists particularobjectives of this thesis. The objectives can be divided into two groups – Creation and analysisof data resources and Development of automatic sentence-like unit segmentation systems.
Since a suitable English corpus has already been available, the data creation part of thiswork only focuses on Czech. The objective of this part is the following:
1. Prepare and analyze Czech speech corpora with appropriate annotation of sentence-likeunit boundaries. In order to analyze difference between planned and spontaneous speech,it was decided to create two distinct corpora – one in the domain of broadcast newsand the other in the domain of broadcast conversations. The employed annotationscheme goes far beyond just marking sentence-like unit boundaries since it also includesannotation of fillers and edit disfluencies. This work is described in Chapter 5.
In the experimental part, I deal with both English and Czech. Since my work in both lan-guages builds upon similar modeling approaches, before presenting the experiments themselves,I first describe the methods for prosodic feature extraction (Chapter 6), and the statisticalmodels used for automatic sentence segmentation (Chapter 7). The experiments focusing onEnglish were performed on the publicly available ICSI meeting corpus, whereas my experi-ments with spoken Czech used the new corpora created as part of this thesis. The explicitobjectives in the experimental part are the following:
2. Explore dialog act segmentation of multiparty meetings in English. The automatic pro-cessing of multiparty meetings is an area of growing interest. Since prior to this work,this domain has not been well explored for sentence or dialog act segmentation, thishas been done as part of this thesis. Besides standard speaker-independent experiments(Chapter 8), I have also focused on investigating speaker-specific modeling in this domain(Chapter 9).
3. Develop and evaluate a baseline sentence unit segmentation system for Czech. In thissubtask, the goal is to design a sentence-like unit segmentation system and evaluate itusing the corpora created in Objective 1. This work is described in Chapter 10.
29


Chapter 5
Design, Creation, and Analysis ofCzech Speech Corpora withStructural Metadata Annotation
Words are the coins making up the currency of sentences,and there are always too many small coins.
Jules Renard
One of the main goals of this thesis was to create a sentence boundary detection system forspoken Czech. However, at the time when this work started, no speech corpora with annotationof sentence-like units necessary for training and testing Czech sentence segmentation systemswere available. Hence, such corpora had to be prepared as a very important part of this work.I decided to create two corpora in two different domains: broadcast news (mostly read-aloudspeech) and broadcast conversations (mostly spontaneous speech). The first corpus was created“just” by enriching an existing broadcast news corpus with structural metadata annotation,whereas the second had to be created from scratch.
The annotation scheme I use is based on the LDC’s “Simple Metadata Annotation Specifi-cation”. This structural annotation goes far beyond just labeling of sentence-like unit bound-aries. Speech disfluencies, filler words, and some other phenomena were also annotated sinceI wanted to create corpora useful for studying a broad spectrum of spoken language phenom-ena. In this chapter, I also present a detailed analysis of the annotated corpora in terms ofstructural metadata statistics.
This chapter is organized as follows. Section 5.1 describes the used audio data and brieflyoutlines how the data were transcribed. Section 5.2 overviews approaches to annotating struc-ture of spontaneous utterances and states the reasons why I chose to adopt the structural meta-data annotation approach. Section 5.3 presents the structural metadata annotation guidelinesfor Czech. Section 5.4 analyzes a number of structural metadata statistics relating to the twoannotated corpora. Section 5.5 summarizes the whole chapter.
5.1 Speech Data
5.1.1 Czech Broadcast News Corpus
The broadcast news (BN) speech data I used for this work were taken from the Czech BroadcastNews Corpus. This corpus was recorded at UWB and is publicly available from the Linguistic
31

Chapter 5. Czech Speech Corpora with Structural Metadata Annotation
Table 5.1: Basic numbers about Czech Broadcast News corpus (BN) and Radioforum corpus (RF)
BN RF
Number of shows 342 52Number of word tokens 234.2k 207.8kNumber of unique words 31.9k 25.3kDuration of transcr. speech 26.7h 24.0hTotal number of speakers 284 94— male speakers 188 77— female speakers 96 17
Data Consortium (LDC) [98]. The corpus is spanning the period February 1, 2000 throughApril 22, 2000. During this time, news broadcasts on 3 TV channels and 4 radio stations wererecorded. The whole corpus contains over 60 hours of audio stored on 342 waveform files,which yield more than 26 hours of pure transcribed speech.1 The recordings do not containweather forecasts, sport news, and traffic announcements. The signal is single channel. Itwas originally sampled at 44.10 kHz with 16-bit resolution, but for the official release, thewaveforms were downsampled to 22.05 kHz. Basic numbers about the BN corpus are listed inTable 5.1. Details about corpus orthographic transcriptions were given in [99].
5.1.2 Radioforum – Czech Broadcast Conversation Corpus
The UWB speech research group has mainly gained its Czech spontaneous speech processingexperience within the MALACH project [100]. However, at the time this work started, thetestimonies of Holocaust survivors that comprise this corpus could not be freely distributed.Hence, a new corpus was recorded to support broader research on the problem of spontaneousCzech.
5.1.3 Audio Data
The newly recorded spontaneous speech database consists of 52 recordings of a radio discussionprogram called Radioforum (RF), which is broadcast by Czech Radio 1 every weekday evening.Radioforum is a live talk show where invited guests (most often politicians but also journalists,economists, doctors, teachers, soldiers, crime victims, and so on) spontaneously answer topicalquestions asked by one or two interviewers. The number of interviewees in a single programranges from one to three. Most frequently, one interviewer and two interviewees appear in oneshow. The material includes passages of interactive dialog, but longer stretches of monolog-likespeech slightly prevail.
Although the corpus was recorded from public radio where standard (literary) Czech wouldbe expected, many speakers, especially those not used to talking on the radio, use colloquiallanguage as well. Literary and colloquial word forms are often mixed in a single sentence.The usage of colloquial language, however, is not as frequent as in unconstrained informalconversations.
1Because of copyright issues, only 286 of the 342 recorded shows yielding 22.8 hours of transcribed speechcould have been published at the LDC. However, I used all 342 recordings for all my experiments described inthis thesis.
32

5.1. Speech Data
The recordings were acquired during the period from February 12, 2003 through June 6,2003. The signal is single channel, sampled at 44 kHz with 16-bit resolution. Typical durationof a single discussion is 33–35 minutes (shortened to 26–29 minutes after removing compactsegments of telephonic questions asked by radio listeners, which were not transcribed). Somebasic numbers about the corpus are presented in the third column of Table 5.1.
5.1.4 Speech Transcription
The recorded shows were manually transcribed based on detailed annotation guidelines. Thegoal of the transcription was to produce precise time-aligned verbatim transcripts of the audiorecordings. The transcription guidelines for this Czech corpus were based on the guidelinespublished in [99, 12]. However, the original guidelines were adjusted to better accommodatespecifics of the recorded spontaneous speech corpus. Some of the modifications were inspiredby the LDC’s “Guidelines for RT-04 Transcription” [101]. For example, in order to increaseinter-labeler consistency, the number of tags for labeling speaker and background noises wassignificantly reduced. For the same reason, I also changed the rules for transcription of filledpauses because the original rules had been too vague. The filled pause issue is discussed inmore detail below in Section 5.3.1.1.
Among others, the transcription guidelines instructed annotators how to deal with thefollowing phenomena:
• Speaker turns – a corresponding time stamp and speaker ID are inserted every time thereis a speaker change in the audio.
• Turn-internal breakpoints – to break up long turns, breakpoints roughly correspondingto “sentence” boundaries within a speaker turn are inserted.
• Overlapping speech – an overlapping speech region is recognized when more than onespeaker talks simultaneously; within this region, each speaker’s speech is transcribedseparately (if intelligible).
• Background noises – [NOISE] tags are used to mark noticeable background noises.
• Speaker noises – speaker-produced noises are identified with one of the following tags:[LOUD_BREATH], [COUGH], [LAUGHTER], [CLICK].
• Filled pauses – filled pauses produced by a speaker to indicate hesitation or to main-tain control of a conversation are transcribed either as [EE-HESITATION] or as [MM-HESITATION], based on their pronunciation.
• Interjections – certain interjections typically used as backchannels or to express speaker’sagreement or disagreement are transcribed using the [MHM] (disagreement) and [HM](agreement or backchannel) tags.
• Unintelligible speech – regions of unintelligible speech are marked with a special symbol.
• Numbers – all numerals are transcribed as complete words.
• Foreign names – foreign names in the transcript are marked using special symbols; ifpronunciation of a foreign language name differs from that expected by Czech spellingrules, it is added to the transcript as a comment.
33

Chapter 5. Czech Speech Corpora with Structural Metadata Annotation
• Mispronounced words – mispronounced words (reading errors, slips of the tongue) aretranscribed in the spelling corresponding to their pronunciation in the audio (i.e., theincorrect pronunciation is represented2) and marked with a special symbol.
• Word fragments – the pronounced part of the word is transcribed and a single dash isused to indicate point at which word was broken off.
• Punctuation – standard punctuation (limited to commas, periods, and question marks)is used to enhance transcript readability.
The verbatim transcripts of this corpus were created by a large number of annotators. To keepthem maximally correct and consistent, all submitted annotations were manually revised.
5.2 Annotation of Spontaneous Speech Structure
In the previous section, the creation of time-aligned verbatim transcripts was described. Thisannotation is usually sufficient for training and testing standard ASR systems. However,raw streams of words do not convey complete information because the structural informationbeyond the words (metadata) is equally important as the words themselves. As mentioned inthe Introduction, structural information is critical to both increasing human readability of thetranscripts and allowing application of downstream NLP methods, which typically require afluent and formatted input.
This thesis is focused on automatic generation of rich speech transcripts3 which not onlycontain words but also boundaries of sentence-like units. Thus, the key problem is how toannotate sentence boundaries in speech. In principle, there are two basic options. The firstoption is to use standard punctuation, whereas the other is to employ a special annotationscheme tailored for spoken language. Although the former approach is quite convenient forread speech, its convenience for spontaneous speech is at least questionable.
Because spontaneous utterances are not as well-structured as read speech and writtentext, there exist a number of reasons why annotating structure by simply making referenceto standard punctuation is inadequate for many applications. First, there are no agreed-uponrules for punctuating faulty syntactic structures, which are quite frequent in spontaneousspeech. Second, punctuation marks are ambiguous; commas may indicate several differentstructural/syntactic events (e.g., clausal break, apposition, parenthesis, etc.). Third, even forwritten text, the rules for applying punctuation are quite variable; for instance commas are op-tional in many cases. Fourth, standard punctuation does not convey all structural informationcontained in spontaneous speech. Spontaneous utterances are often incomplete or disfluent.Since dealing with the specific spontaneous speech phenomena is crucial to spontaneous speechunderstanding, more precise annotation of disfluencies and other structural phenomena is re-quired. On the other hand, we must take into account that special annotation of spontaneousspeech phenomena is extremely labor-intensive and thus expensive.
5.2.1 Related Work on Spontaneous Speech Annotation
Several different annotation schemes has been presented for similar annotation tasks. Earliestefforts include the Meteer manual for disfluency tagging of the Switchboard corpus [102]. Adetailed annotation scheme for the Trains dialog corpus was proposed by Heeman [103]. His
2Unlike English, this is possible in Czech since spelling rules are phonetically based.3Besides sentence boundaries, such rich transcripts may also include speaker diarization (who speaks when),
disfluency annotation, or other structural information.
34

5.2. Annotation of Spontaneous Speech Structure
annotation scheme included labeling of intonational boundaries within the ToBI framework,identification of discourse markers, and a very detailed annotation of speech repairs.
Within the VERBMOBIL project, Batliner et al. [78] presented a syntactic-prosodic la-beling system for large spontaneous speech databases called “M”. This annotation was onlybased on word transcripts; the annotators did not have access to audio recordings. Using arough syntactic analysis, each word in a turn was assigned to one of 25 “M” classes. De-pending on the target task, these 25 classes were grouped either into 3 main M classes (M3 -clause boundary, M0 - clause internal, MU - boundaries that cannot be determined withoutlistening to audio or knowing particular pragmatic context), or into 5 syntactic classes (S0 -no boundary, S1 - boundary after a particle, S2 - phrase boundary, S3 - clause boundary, S4 -sentence boundary). An apparent drawback of this approach is that the annotation scheme isvery complex and requires experienced linguist annotators.
At the time I started my work on this task, there was no similar annotation system forCzech. In addition, there was almost no published work focusing on syntax of conversationalCzech. The exception is a treatise by Müllerová [104]. This monograph describes syntacticphenomena specific for conversational Czech, surveys various types of speech repairs, andbriefly discusses Czech discourse markers. Although Müllerová’s work is interesting, it doesnot offer any clear clues to explicit annotation of sentence-like units in spoken Czech. Thedefinitions provided in this work are too vague to be applicable to NLP tasks; the author onlystudies spoken Czech in terms of a qualitative linguistic description.
Müllerová argues that it is often impossible to decide whether neighboring syntactic con-stituents correspond to a compound sentence or to a pair of independent syntactic structures.She proposes to distinguish four types of syntactic boundaries: (1) overt sentence boundarieswithout any valence ambiguity; (2) subordinate boundaries delimited by subordinate conjunc-tions; (3) boundaries with ambiguous syntactic constituents (not clear whether linked to thepreceding or the following predicate); and (4) boundaries in regions with ill-formed syntacticstructure.
In addition to the above mentioned syntactic boundaries, Müllerová also defines content-pragmatic units. She defines these units as syntactically and semantically coherent segments,which correspond to elementary illocutionary acts. Boundaries between these units are rec-ognized based on semantic and pragmatic features. Although this general definition of thecontent-pragmatic units is in good agreement with our definition of SUs (presented below inSection 5.3.3), the author herself admits that boundaries of these units are often ambiguous,and, again, does not give any clear clues how to identify them with satisfactory consistency.
5.2.2 Structural Metadata Annotation Approach
For my work, I have decided to adopt the “Simple Metadata Annotation” approach [105], whichwas introduced by the LDC as part of the DARPA EARS (Efficient, Affordable, ReusableSpeech-to-Text) program [106]. This annotation was defined for the EARS Metadata Ex-traction (MDE) subtask [107]. The goal of MDE is to create automatic transcripts that aremaximally readable. This readability may be achieved in a number of ways: creating bound-aries between natural breakpoints in the flow of speech; flagging non-content words like filledpauses and discourse markers for optional removal; and identifying sections of disfluent speech.
The word “simple” in the name of the approach only emphasizes a contrast with an earlyMDE definition known as “Full MDE”. Since a pilot annotation study had revealed a numberof problems with consistency of the “full” annotation, LDC developed the “simple” definitionthat eliminated some annotation tasks entirely and simplified others. As a result, the currentMDE annotation can be performed by non-linguist annotators with reasonable consistency.
35

Chapter 5. Czech Speech Corpora with Structural Metadata Annotation
I have chosen to adopt the simple MDE approach for the following reasons:
• Because of the EARS project, the MDE annotation has become widely accepted as anannotation scheme for spontaneous speech.
• In comparison with other annotation schemes, the MDE system is relatively simple,which makes annotator training easier.
• It is not domain- or style-dependent, so that it can directly be used for both broadcastnews and conversations.
• Speech transcripts segmented according to the MDE standard have already been suc-cessfully tested in downstream NLP applications (speech summarization, informationretrieval, machine translation, etc.).
Although this thesis primarily focus on segmentation of speech into sentence-like units inthis work, we decided to create corpora with complete MDE annotation in order to supportfuture research of other spontaneous speech phenomena. Besides its importance to MDEresearch, the MDE-annotated corpora may also be useful for linguistic analysis of spontaneousCzech. In spite of the fact that the MDE annotation guidelines were primarily designed forspontaneous speech, the same guidelines may also be used for annotation of broadcast newscorpora. Planned speech only makes the annotation easier since utterances that are difficultto annotate are much less frequent. Thus, the same guidelines were used for both the RF andBN corpus.
5.3 Structural Metadata Annotation for Czech
Originally, the structural MDE annotation standard was defined for English. When developingstructural metadata annotation guidelines for Czech, I tried to follow the LDC guidelines forEnglish as much as possible. However, it would not be correct to simply translate and copy allconventions from one language to another. Individual rules must be adjusted to accommodatespecific phenomena of the target language. The language-dependent modifications are mainlybased on the description of syntax of Czech compound and complex sentences as given by [108].I also used two other Czech syntax handbooks [109, 110].
In the following text, all illustrative examples are presented in Czech and then in theirEnglish translations. Note that, because of significant differences between Czech and English,it is often impossible to present a good verbatim translation. I tried to use English translationsthat best illustrate the linguistic phenomena of interest. Also note that SU symbols in allEnglish translations are not displayed as based on the English MDE standard, but ratherillustrate their placement with respect to the Czech guidelines. Furthermore, the examplesdo not contain standard punctuation but only SU symbols. All examples are typed in atypewriter font. If an example represents a conversation, the speakers are distinguished usingcapital letter IDs (A:, B:).
In all examples in this section, I use a notation that is very similar to the notation used inthe original English guidelines [105]. The notation is the following:4
Fillers:
word – “word” is a filler (discourse marker or explicit editing term){ word } – “word” is an Aside/Parenthetical
4In this introductory section, I just list the employed MDE symbols. Their meaning is explained below incorresponding sections.
36

5.3. Structural Metadata Annotation for Czech
Edit Disfluencies:
[ word ] * – “word” is a Deletable Region; * denotes an interruption pointword – “word” is the corrected portion of a disfluency
SUs:
/. – statement SU break/? – question SU break/- – incomplete SU break – arbitrarily abandoned/∼ – incomplete SU break – interrupted/& – coordination break/, – clause break⊘ – no break at a place where one might be expected
The remainder of this section is organized as follows. Section 5.3.1 describes annotation offillers, Section 5.3.2 presents annotation of edit disfluencies, and Section 5.3.3 is devoted toannotation of syntactic-semantic units (SUs).
5.3.1 Fillers
Fillers are words, short phrases, or non-verbal hesitation sounds that do not alter the proposi-tional content of the utterance in which they are inserted. Their characteristic feature is thatthey do not depend on identities of surrounding words. In general, fillers are those parts of theutterance which could be removed from its transcript without losing any “important” piece ofinformation. Four types of fillers are distinguished within the MDE system:
• Filled Pauses (FP),
• Discourse Markers (DM),
• Explicit Editing Terms (EET),
• Asides/Parentheticals (A/P).
Annotating fillers consists of identifying the filler words and assigning them an appropriatelabel.
5.3.1.1 Filled Pauses
FP is a non-verbal hesitation sound produced by speakers (either intentionally or not) to in-dicate uncertainty or to keep control of a conversation while thinking what to say next. Ingeneral, FPs can appear anywhere in the flow of speech. By their definition, they make no con-tribution to the semantic proposition of the utterance. Thus, FPs should not be confused withcertain interjections that function to express agreement or disagreement, or as backchannels(such as English uh-huh). FP as a linguistic phenomenon was mentioned in Section 2.3.1.1.
An important (and also very interesting) fact about FPs is that they vary across languages.For instance, FPs in American English are known as uh and um, while Japanese speakers useahh, ano, or eto, and French talkers most frequently vocalize a sound similar to euh [111].
37

Chapter 5. Czech Speech Corpora with Structural Metadata Annotation
No thorough linguistic study on FPs has been conducted for Czech. Consequently, thereis no general agreement on how to transcribe them in text – their transcription differs corpusto corpus. For instance, Kaderka and Svobodová [112] propose to distinguish ten non-verbalsounds, six of which correspond to FPs5 (e, ee, eee, eh, ehm, em). The first three FPs fromthis list differ only in length, the other three differ in phonetic makeup. My opinion is that todistinguish six different FPs is too many.
When developing transcription rules for FPs, one must be aware of the fact that thereis always a trade off relation between transcription accuracy and consistency. If we choosetoo many categories, annotators will not be consistent in their recognition. On the otherhand, too broad categories might cluster FPs that are wholly different both phonetically andfunctionally.
In order to be able to design annotation guidelines for Czech FPs, I spent a lot of timelistening to Czech spontaneous speech recordings. Based on this experience, I decided todistinguish the following two FP categories:
• EE – this FP category is most typically represented by sounds similar to Czech é, butin my annotation guidelines, it also includes all hesitation sounds that are phoneticallycloser to vowels than consonants – for example, sounds similar to Czech long vowel áalso may function as FPs. Also note that EEs are sometimes accompanied with a creakyvoice quality.
• MM – this FP category contains all hesitation sounds that are phonetically more similarto consonants or mumble-like sounds. The most frequent hesitation sound from thisgroup is similar to mmm. Another not infrequent example of an MM is an FP resemblinga lengthened Czech consonant v. MMs typically pronounced with a closed (or almostclosed) mouth – openness of mouth is also a good feature distinguishing MMs from EEs.
Overall, EEs are significantly more frequent than MMs. Experience with annotation of thetwo Czech corpora presented herein indicates that these two categories very well cover a vastmajority of all FPs occurring in spontaneous Czech. Moreover, our annotators felt comfortablewith using these two FP labels. Besides the positive experience, the number of recognized FPcategories is also in line with the number of FP categories in American English.
The only problematic instances of FPs in terms of this transcription approach are thosesimilar to emm. In such FPs, vowel-like and consonant-like components immediately followeach other. Since such FPs are really rare in spontaneous Czech, I decided not to introducea special tag for them. However, I had to prepare instructions specifying their transcription.Annotators were instructed as follows. Only the MM symbol is used when the vowel-likecomponent is much shorter than a dominant consonant-like component. By analogy, only theEE tag is used when the vowel-like component is strongly dominant. When both componentsare strong, the FP is transcribed using both symbols as EE MM. This notation is also usedwhen instances of EE and MM appear separated by a pause. An example of an FP-annotatedutterance follows.
To je EE jenom EE MM jeho sen /.
This is EE just EE MM his dream /.
Since I did not allow annotators to transcribe FPs using other words or symbols thanEE and MM, the MDE annotation of FPs was in principle performed during the verbatimtranscription stage. However, the annotators in the MDE annotation stage had the right to
5They do not discriminate between interjections altering content and hesitations in their guidelines.
38

5.3. Structural Metadata Annotation for Czech
insert or change FP symbols. I find this two-pass annotation setup useful because FPs arequite often missed by human transcribers.
Note that the presented novel approach to annotating FPs was only used for the RF corpus.The verbatim transcripts of the BN corpus had been created earlier using an FP annotationbased on different guidelines. These guidelines paid only little attention to description of FPtypes. The vast majority of FPs in this corpus were transcribed as ERs.6 Annotators couldalso use another English FP transcription, UM, but this symbol occurs only several times inthe transcripts – apparently because FPs of this type are very rare in Czech.
5.3.1.2 Discourse Markers
DMs are words or phrases, such as the well-known “you know”, that function primarily asstructuring elements of spoken language. They do not carry separate meaning but signal suchactivities as a change of speaker, taking or holding control of the floor, giving up the floor, orbeginning of a new topic. There exists a number of diverse definitions of DMs in the linguisticliterature. Within MDE, we are only interested in such DMs whose presence in the utteranceis unnecessary and whose cleanup do not lead to loss of “important” structuring information.Thus, structuring units such as “Za prvé, . . . ” (“First, . . . ”) do not receive DM labels. Ifmultiple DMs occur in succession, each DM is tagged separately, rather than labeling one longDM spanning over all successive DM instances. An example of DM annotation follows.
Tak já jako nevím /.
So I like don’t know /.
For any language, it is not possible to create a closed list of possible DMs. The of use DMsis dependent on a dialectal variation and rhetorical style of a particular talker. The list ofpopular DMs in Czech includes: dobře (well), jako (like), jaksi (sort of), no (well), podívejtese (you see), prostě (simply), tak (so), takže (thus), tedy (then), víte (you know), víte co (youknow what), vlastně (actually), v podstatě (basically), among others.
Some of the frequent DM words and phrases also have other literal meanings, which some-times makes identification of DMs more difficult. For example, it is often difficult to decidewhether the word takže serves as a DM or not. When annotating instances of this word, onemust analyze whether the speaker intented to express relation to his/her preceding proposi-tion, or to mark a discourse boundary. Another ambiguous word is jako, as illustrated in thefollowing example. In the first sentence, it expresses a comparison, while in the second, itfunctions as a DM.
Je rychlý jako blesk /.vs.To jako není nic neobvyklého /.
He is fast like lightning /.vs.It is like nothing unusual /.
Besides general DMs, the MDE annotation system also recognizes its special case – Dis-course Response (DR). DRs are DMs that are employed to express an active response to whatanother speaker said, in addition to mark the discourse structure. For instance, a speaker mayalso initiate his/her attempt to take the floor. DRs typically occur turn-initially. Importantly,
6Er is a British variant of American uh.
39

Chapter 5. Czech Speech Corpora with Structural Metadata Annotation
DRs should not be confused with direct answers to questions. Distinction between DRs anddirect responses to questions is discussed below in Section 5.3.3.14. An example of a DRfollows.
A: Já bych to tak udělal /.B: Hele já si tím nejsem tak jistej /.
A: I’d do it that way /.B: See I’m not that sure about it /.
5.3.1.3 Asides/Parentheticals
Asides and parentheticals occur when the speaker utters a short side comment and then returnsto the original sentence pattern. Asides are comments on a new topic, while parentheticals areon the same topic as the main utterance. For annotation purposes, asides and parentheticalsare not distinguished but treated as a single filler type. A/Ps are often prosodically marked.Speakers usually pause or shift their intonation. Strictly speaking, A/Ps are not fillers, butbecause as with other filler types, annotators must identify the full span of text functioning asan A/P, they are included with fillers in the guidelines. An example of an A/P follows.
Potom k němu přišel { moment musím si vypnout telefon } s tím velkýmpsem /.
Then he came to him { moment I must switch off my cell phone } with thebig dog /.
Some very common Czech words or short phrases that can be denoted as “lexicalizedparentheticals” (e.g., řekněme (say),myslím (I think)) are not annotated as A/Ps. They usuallylack the prosodic features that typically accompany A/Ps. In order to ensure a high IAA, apreliminary illustrative list of those “lexicalized parentheticals” was prepared. In addition, themaximal allowed length of a lexicalized parenthetical was limited to two words.
An important restriction of A/Ps within our MDE guidelines is that they cannot occur asSU-initial or SU-final. Such grammatical parentheticals occurring not in the middle of an SUbut on their onset or end should rather be separated by an SU symbol (clausal break or anSU-external break).
Je to sto hlasů i s tím ministrem /, jak jsme dneska četli /.
It’s one hudred votes including the minister /, as we read today /.
5.3.1.4 Explicit Editing Terms
Another type of fillers, EET, may only occur accompanying an edit disfluency. EETs areexplicit expressions by which speakers signal that they are aware of the existence of a disfluencyon their part. Basically, they can appear anywhere within the disfluency, but most frequentlyoccur right after the end of the reparandum. EETs are rather rare in actual conversationallanguage. Typical Czech EETs are e.g., nebo (or), či (or), spíše (rather), vlastně (actually),or chtěl jsem říct (I wanted to say).
Tohle je naše [ koherentní ]* EE spíše konzistentní stanovisko /.
This is our [ coherent ]* EE rather consistent statement /.
40

5.3. Structural Metadata Annotation for Czech
5.3.2 Edit Disfluencies
Edit disfluencies are portions of speech in which a speaker corrects or alters his/her utterance,or abandons it entirely. Annotation of edit disfluencies within the MDE scheme respects theirstructure described in Section 2.3.1, but individual phases of a disfluency are denoted using aslightly different naming convention. Herein, the phases of an edit disfluency are referred to asDeletable Region (DelReg, speaker’s initial attempt to formulate an utterance that later getscorrected), interruption point (IP, the point at which the speaker breaks off the DelReg withan EET, repetition, revision or restart), optional explicit editing terms (an overt statementfrom the speaker recognizing the existence of a disfluency), and correction (portion of speech inwhich speaker corrects or alters the DelReg). Whereas corrections were not explicitly taggedwithin the English MDE project, I decided to label them in order to obtain relevant data forfurther research of spontaneous Czech. Their labeling is not very time consuming and theobtained data may be very useful – some typical correction patterns may be learned. Anexample of an edit disfluency follows:
Naše děti milují [ kočku ]* EE vlastně psa pana Krause /.
Our children love [ the cat ]* EE actually the dog of Mr Kraus /.
Moreover, it often happens that a speaker produces several disluencies in succession, eitheras serial or nested. In case of serial disfluencies, we simply mark the maximal extent of thedisfluency as a single DelReg with multiple IPs that are explicitly tagged.
Ale [ ta * myšl- * ten * ten zlej ]* ten podivnej pocit to se nedádobře popsat /.
But [ the * ide- * the * the bad ]* the strange feeling it can’t bedescribed well /.
Nested disfluencies (some component of the disfluency is disfluent itself) are more difficultto annotate. To keep annotation as simple as possible, the MDE standard does not allow usingnested disfluency labels, so that all such disfluencies must be annotated using just simple,non-nested DelRegs. The following example shows a correction that contains an additionaldisfluency.
Přijel jsem [ do Brna ]* do [Plz- ]* Plzně dnes ráno /.
I arrived [ to Brno ]* to [Pil- ]* Pilsen today morning /.
Since Czech disfluencies have the same pattern as English, the rules about complex disfluenciesfrom [105] can basically be directly applied to Czech. Thus, I do not survey all particular rulesfor annotating complex disfluencies herein because interested readers may consult the originalEnglish guidelines.
5.3.3 SUs
Dividing the stream of words into sentence-like units is a crucial component of the MDEannotation. The goal of this part of annotation is to improve transcript readability andprocessability by presenting it in small coherent chunks rather than long unstructured turns.Because speakers often tend to use long continuous compound sentences in spontaneous speech,it is nearly impossible to identify the end-of-sentence boundary with consistency using only avague notion of a “conversational equivalent” of a written sentence – strict segmentation rules
41

Chapter 5. Czech Speech Corpora with Structural Metadata Annotation
are necessary. Past experience with similar annotation problems indicates that acceptableinter-annotator agreement (IAA) can only be achieved in the context of rules grounded in“surface features”, i.e. mainly syntax and prosody. Semantic features have not proved to bereliable.
One possible solution to the “conversational sentence” definition problem is to divide theflow of speech into “minimal meaningful units” functioning to express one complete idea onthe speaker’s part. It means that we divide the stream of words wherever it is grammaticallypossible and meaningful. The resulting units are either shorter or equally long as sentences instandard writing. These smaller units also seem to be convenient for downstream automaticapplications. For example, speech translation applications usually prefer to process shortersegments [113].
The target utterance units are called SUs within the MDE task. In the MDE def-inition, the abbreviation SU may stand for one of the following possibilities: Senten-tial/Syntactic/Semantic/Slash Unit. Every word within the discourse is assigned to an SU(each word contained between two SU boundaries is considered part of the same SU), and allSUs are classified according to their function within the discourse. The following list showsthe employed SU symbols (breaks) along with brief descriptions of their meaning:
• /. – Statement break – end of a complete SU functioning as a declarative statement(Kate loves roses /.)
• /? – Question break – end of an interrogative(Do you like roses /?)
• /, – Clausal break – identifies non-sentence clauses joined by subordination(If it happens again /, I’ll try a new cable /.)
• /& – Coordination break – identifies coordination of either two dependent clauses ortwo main clauses that cannot stand alone(Not only she is beautiful /& but also she is kind /.)
• /- – Incomplete (arbitrary abandoned) SU(Because my mother was born in Russia /, I know a lot about the /-They must fight the crime /.)
• /∼ – Incomplete SU interrupted by another speaker(A: Tell me about /∼ B: Just a moment /.)
In contrast to the English MDE, we do not use an SU symbol for backchannels becauseboth Czech corpora are single-channel. Therefore, backchannels that do not overlap with wordsuttered by the dominant speaker, and thus can be captured in a single-channel transcript7,are treated as a special type of a filler.8 In the illustrative examples below, I also use a specialsymbol “⊘” which denotes “no break” at places where one might be expected. This symbol isonly used for illustration purposes herein, and does not occur in real MDE annotations.
The SU symbols may be divided into two categories: sentence-internal (/& and /,) andsentence-external (others). Sentence-external breaks are fundamental and directly supportthe SU research task. They are used to indicate the presence of a main (independent) clause.These independent main clauses can stand alone as a sentence and do not depend directly onthe surrounding clauses for their meaning. Sentence-level breaks may also appear after a short
7Overlapping backchannels are treated as noises since they cannot be explicitly transcribed within thedominant speaker turn.
8Since these non-overlapping backchannels are extremely rare in the corpus, I did not present their annotationin a separate section.
42

5.3. Structural Metadata Annotation for Czech
phrase that nonetheless functions as a “complete” sentence. In many cases, these breaks wouldbe represented in standard writing with end-of-sentence punctuation. Sentence-internal breaksare secondary and have mainly been introduced to support IAA. However, it should be notedthat it is important to have these symbols in the MDE annotations since some future taskmay require them to be automatically detected. Sentence-internal breaks delimit units thatare smaller than a main clause and cannot stand alone as a complete sentence. In standardwriting, these breaks often correspond to commas.
In SU annotation, the fundamental problem is to determine when to insert a new SUboundary and when to place two segments within the same SU. External breaks are insertedbetween SU boundaries, internal breaks (if exist) may further refine each SU. Besides a fewexceptions9, candidate locations for both sentence-internal and sentence-external SU labels areusually boundaries between two adjacent clauses. Thus, the key problem is to recognize thetype of each clause boundary.
The above presented set of SU symbols corresponds to the original MDE standard. How-ever, I did not use it as it was originally defined but introduced two significant modifications.Both modifications are language-independent. First, the original set contains only one symbolfor incomplete SUs, but I propose to distinguish two types of incomplete SUs: /- — indicatingthat the speaker abandoned the SU arbitrary; and /∼— indicating that the speaker was inter-rupted by another speaker. This distinction of incompletes is very useful since their patternsdiffer significantly in prosody, semantics, and syntax.
Second, in order to identify some “core boundaries” that could be both easier to detectautomatically based on prosodic cues, and also relevant for spontaneous discourse analysis, Iintroduced two new symbols: //. and //? — the double slashes indicate a strong prosodicmarking on the SU boundary, i.e. pause, final lengthening, and/or strong pitch fall/rise. Theadditional annotation refinement does not seem to cause a corresponding growth in annotationcomplexity. A rule of thumb instructs annotators to use the double-slash SU symbols when indoubt. IAA for this additional subtask is evaluated in Section 5.4.1. Note that, in contrast toToBI-like systems, our system only involves labeling prosodic boundaries on SU boundaries,rather than on all word boundaries, which is much less time-consuming.
The proposed guideline modifications did not only include changes in the SU symbol set.Another modification pertains to the pause threshold. In the English SimpleMDE V6.2 stan-dard, in order to support IAA, the pause longer than 0.5 sec automatically induces the endof a speaker turn and thereby requires a corresponding SU-external break. But the 0.5 secthreshold is problematic because some speakers produce long pauses in places where otherspeakers might produce filled pauses. Hence, I decided to drop the threshold rule and to relysolely on syntax. Likewise, I do not require the presence of a noticeable pause after incomplete(abandoned) SU breaks (/-) when syntax provides an overt evidence of incompleteness.
The following subsections provide descriptions of particular rules for SU annotation. Tokeep the description reasonably long, I only present the most important examples – especiallythose that emphasize differences between Czech and English. Full annotation guidelines maybe found at http://www.mde.zcu.cz.10
5.3.3.1 Short Stand-alone Phrases Not Containing Verbs
SUs do not necessarily have to contain a verb. Even though some phrases do not constitutegrammatically complete sentences, they may function as a complete utterance. To identify
9These are mentioned in the following sections.10Unfortunately, the full guidelines are available only in Czech.
43

Chapter 5. Czech Speech Corpora with Structural Metadata Annotation
them correctly, annotators must be sure that the phrases are not syntactically connected withthe previous SU.
Vítejte u Radiofóra /. Hosté Jan Novák poslanec a Pavel Kučera stínovýministr obrany /.
Welcome to Radioforum /. Guests Jan Novák a deputy and Pavel Kučera ashadow minister of defense /.
These stand-alone phrases often occur following a question – talkers sometimes repeat thequestion’s topic to establish common ground before answering.
A: Jsou pro vás Glasgow Rangers těžkým soupeřem /?B: No Rangers /. My jsme s losem spokojeni /.
A: Are Glasgow Rangers a tough opponent for you /?B: Well Rangers /. We are satisfied with the draw /.
Another examples are headline news in broadcast news data which should also be annotatedas individual SUs even if they do not form a complete clause.
Mušaraf neoficiálním vítězem pákistánských prezidentských voleb /.Německo ochromeno stávkou železničářů /. Madelaine Albrightováv exkluzivním interview pro Českou televizi /.
Musharraf the unofficial winner of Pakistan’s presidential vote /.Germany paralyzed by rail strike /. Madelaine Albright in an exclusiveinterview for the Czech TV /.
All these rules are identical to the corresponding English rules.
5.3.3.2 Juxtaposition of Clauses
In general, juxtaposition means an absence of linking elements in a group of words that arelisted together. As juxtaposition of an “introductory clause”, we understand a connectionof two main clauses that cannot be classified using any of the standard semantic relationsdefined by normative Czech grammar (copulative, disjunctive, etc.). The second clause issyntactically and semantically determined by the preceding clause, but there is no formalsyntactic relationship. Thus, it is a kind of parenthetical clause in terms of grammar. Inmost of the cases, such clauses could be connected using the Czech conjunction “že (lit. that)”without any change of meaning. In English, this phenomenon does not have a separate rulesince, unlike Czech, dropping of the conjunction that is standard. Czech guidelines instructannotators to separate the clauses in juxtaposition using a clausal break.
Já vím /, vy to nemáte rád /.
I know /, you don’t like it /.
44

5.3. Structural Metadata Annotation for Czech
5.3.3.3 Quotations
Since no quotation marks are used within the MDE annotation, direct or indirect quotationsimpose clausal breaks. The quote and its attribution typically form a single SU. This rule isidentical to the corresponding English rule.
Půjdu tam /, řekl David /.Martin řekl /, že tam nepůjde /.
I’ll go there /, David said /.Martin said /, that he wouldn’t go there /.
If the quote is long and the quoted portion of the utterance contains several sentences, addi-tional SUs are recognized, as shown in the following example:
Ale premiér řekl /, nikdy jsem ho neviděl /. Já toho člověka vůbecneznám /. Tahle aféra je směšná /.
But the prime minister said /, I have never seen him /. I don’t knowthat man at all /. This affair is ridiculous /.
5.3.3.4 Idiomatic Expressions
Similarly to English, frozen idiomatic expressions are not separated by any SU symbols evenif they contain multiple finite verbs.
To je ⊘ prašť ⊘ jako uhoď /.
It is ⊘ hit ⊘ or punch /.
5.3.3.5 Independent Subordinate-like Clauses
A complete SU may also be composed of stand-alone independent clauses starting with sub-ordinate conjunctions. In these cases, the subordinate conjunctions basically functions asparticles rather than conjunctions.
Protože toto je opravdu jednoduché /.
Because this is really easy /.
5.3.3.6 Parcelation
In spontaneous speaking, speakers often do not precisely plan the structure of their utterancesin advance. As a result, we sometimes observe discontinuous appending of additional utteranceconstituents. The talker composes several successive elliptic utterance units, which typicallyhave separate focal accents. This phenomenon is referred to as parcelation in Czech litera-ture. If this parcelation is strong (which is typically recognized from short pauses betweenconstituents), the utterance is segmented into multiple SUs.
Chceš s ním mluvit /? Sama /? Beze svědků /?
Do you want to speak with him /? Alone /? Without witnesses /?
45

Chapter 5. Czech Speech Corpora with Structural Metadata Annotation
5.3.3.7 Appositions
Apposition is a grammatical construction in which two elements are placed side by side, withone element serving to define or refine the other. In standard Czech writing, these constituentsare typically separated by a comma, however, in the MDE annotation, we do not separate themby any SU breaks.
Daniel Mach ⊘ ředitel místní školy ⊘ je můj přítel /.
Daniel Mach ⊘ the local school principal ⊘ is my friend /.
In most cases, noun phrases form appositions. However, based on the broad definitionof appositions (as defined by Vladimír Šmilauer), verbs, adverbs, or even clauses may formappositions, too. If a clause embedded in another clause appears in a apposition, we separateit by a clausal break.
Řeka se kroutí /, tedy tvoří meandry /, blízko u lesa /.
The river twirls /, thus it forms meanders /, close to the wood /.
I should also mention special introductory phrases such as “to jest ( lit. that is)” or “toznamená ( lit. it means)” (i.e., frozen phrases containing a finite verb), which frequentlyaccompany clausal appositions. In terms of MDE, these phrases should not be understood asclauses but rather as introductory particles. As a result, they do not motivate any SU breaks.An illustrative example follows.
Řeka se kroutí /, to znamená ⊘ tvoří meandry /, blízko u lesa /.
The river twirls /, it means ⊘ forms meanders /, close to the wood /.
In contrast to the previous examples, if a clause that seems to be appositional is notembedded in another clause and may stand alone, it should be annotated as an independentSU. This is in agreement with the rule of thumb for problematic decisions – “segment whereverit is possible!”.
Důkazy byly takové /, že soudy je osvobodily /. To znamená zbavily jetoho obvinění /.
There were such evidence /, that the court set them free /. It meansthey found them not guilty /.
5.3.3.8 Anacolutha
An anacoluthon in spoken language can be defined as an abrupt change of syntax withinan utterance. In other words, an utterance begins in a way that implies a certain logicalresolution, but concludes differently from the form grammar leads us to expect. An exampleof an anacoluthon in Czech is a disagreement between subject and predicate within a clause.Although anacolutha can also be used as a purposeful stylistic virtue, they more frequentlyoccur as a consequence of an unintentional grammatical fault in conversational language. Inthe Czech corpora, anacolutha often occur in the vicinity of parentheticals and asides, as shownin the following example.
46

5.3. Structural Metadata Annotation for Czech
Pokud se skupina států {a nejsou to jenom Spojené státy je to takéVelká Británie a další} rozhodnou použít sílu /, tak ...
If the group of states {and it’s not just the United States it’s alsoGreat Britain and others} decide to use power /, then ...
In the example above, to match the singular subject “skupina (group)”, Czech grammar strictlyrequires to use the singular “rozhodne (decides)” instead of the plural “rozhodnou (decide)”.However, the speaker got confused by using a plural form in the parenthetical, and continuedto use the plural form in the completion of the original message.
Annotators were instructed not to use any special annotation for these “small” anacolutha,pretending that grammar in the disturbed utterances is correct. However, note that anacoluthashould not be confused with edit disfluencies.
5.3.3.9 Tag Questions
Tag questions are short phrases added to the end of a statement in order to appeal to thelistener to give feedback. In terms of MDE, the statement plus the added phrase form a singleSU that should be labeled as interrogative. The added phrase is separated from the precedingstatement using a clausal break. This rule is identical to the corresponding English rule.
To si děláte legraci /, že jo /?
You must be joking /, aren’t you /?
However, if intonation gives a clear clue that the added phrase does not function as aquestion, the whole SU is labeled as a statement and the added phrase is labeled as a DM.
Přišli tam včera jo /.
They came there yesterday yeah /.
5.3.3.10 Embedded Questions
When a question is embedded in a larger carrier clause, SU type is assigned according to thefunction of the whole utterance, and not according to the embedded question. Embeddedquestions most frequently occur in quoted direct speech. This rule is also identical to thecorresponding English rule.
Zeptala se /, přidáš se k nám (?) /.
She asked /, will you join us (?) /.
5.3.3.11 Incomplete SUs
When a speaker’s utterance does not express a complete thought, an incomplete SU is recog-nized. Boundaries of the incompletes are labeled with either “/–” or “/∼”. If the utteranceis interrupted and cut short by another speaker, then the “/∼” symbol is used. On the otherhand, if the speaker abandons his/her utterance arbitrarily, the SU is annotated as “/–”. Itimplies that “/∼” may only occur at a turn boundary, whereas “/–” may also occur as turn-internal. In standard text, “/–” may correspond to ellipses (. . . ). The first example illustratesthe use of “/∼”:
47

Chapter 5. Czech Speech Corpora with Structural Metadata Annotation
A: Pokud vložíte dostatek peněz do /∼B: Ale to není jen otázka peněz /.
A: If you put enough money into /∼B: But it is not just a matter of money /.
The second example illustrates the use of “/–”:
Jeho boty vypadaly jako /- On je divnej kluk /.
His shoes looked like /- He is a weird guy /.
5.3.3.12 Distinguishing Incomplete SUs and Restart Disfluencies
Incomplete SUs are sometimes difficult to distinguish from restart disfluencies, which do notreceive incomplete SU labels, but are annotated as DelRegs. The distinction between thesetwo phenomena within the MDE standard is based on the following rules. In comparison withthe original MDE standard for English, the rules for Czech are slightly more complex.11 Ourexperience indicates it does not lead to a significant decrease of IAA, and the accuracy ofannotation is increased.
1. Restart disfluency may never appear as turn-final. In such cases, the incomplete utter-ance is always identified as an incomplete SU.
2. If the speaker immediately restructures the interrupted utterance and continues speakingon the same topic, restart disfluency is recognized. On the other hand, if he/she doesnot return to the incomplete message, an incomplete SU is recognized.
3. Incomplete SUs of the “/–” type must always contain either one or more SU-internalbreaks (/& or /,), or “useful information” that is not repeated in the same turn. However,this does not mean that the occurrence of an SU-internal break within an incompleteutterance automatically implies the use of “/–”. When the SU-internal break occurs ina very short introductory phrase such as “víte /, že (you know /, that)”, it is possible toannotate it as a DelReg (if other necessary conditions are met).
5.3.3.13 Turns with Missing Onsets
Turns whose onsets are missing in the verbatim transcripts, or whose onsets are transcribedwithin the immediately preceding overlapping speech section, are annotated in the same wayas if their onsets were present. Note that the overlapping speech regions in the verbatimtranscripts were not used for MDE annotation, and thus they do not contain any MDE symbols.An example of such a turn follows. The first line in the example corresponds to an overlappingspeech region (both A and B speak), in the second line, the speaker B continues the utterancethat was started in the overlapping region.
A: Překvapil vás. B: Na druhou stanu překvapil ∼ (OVERLAP)B: ∼ i mě /. Já jsem k tomu už názor vyjádřil /.
A: He surprised you. B: On the other hand he surprised ∼ (OVERLAP)B: ∼ me as well /. I have already stated my opinion on this /.
11In the original MDE standard, incomplete SUs are only recognized if “a speaker is interrupted or when thespeaker trails off, failing to complete the utterance within a turn”. Thus, incomplete SUs can only occur at theend of a speaker’s turn.
48

5.3. Structural Metadata Annotation for Czech
5.3.3.14 Direct Responses Expressing Agreement or Disagreement
Direct responses to questions expressing speaker’s agreement or disagreement such as ano(yes), ne (no), jo (yeah), m-hm (uh-huh) typically form a complete SU.
A: Bude to hotové do přištího týdne /?B: Ano /. Pevně v to doufám /.
A: Will it be finished by next week /?B: Yes /. I strongly hope so /.
If a subordinate clause having an explanatory function is attached to words expressingagreement or disagreement, a clausal break is used.
A: Zkusíte to /?B: Ne /, protože už je příliš pozdě /.
A: Will you try that /?B: No /, because it’s too late now /.
One must also be aware of the fact that words that often express agreement or disagreementmay also function as discourse markers. The discriminative rule for these ambiguities says thatboth agreement and disagreement words must always be preceded by a question. Otherwise, aDM is recognized. Although this simplification is not absolutely accurate in terms of discourseanalysis, it was introduced in this simplified form in order to support IAA. The use of thisrule is illustrated in the following example presenting a part of a fictitious dialog.
A: Myslím /, že se to stane /.B: Ano /?A: Ano /. Ten příkaz už je podepsaný /.B: Ano tak to je problém /.A: Ano ⊘ je to opravdu nepříjemné /.B: Takže oni přijdou /? a jo ⊘ odnesou všechno /?A: Ano /. Je mi to líto /.
A: I guess /, that this will happen /.B: Yes /?A: Yes /. The order has already been signed /.B: Yes so it’s a problem /.A: Yes ⊘ it is really bothersome /.B: So will they come /? and yeah ⊘ take everything /?A: Yes /. I am sorry /.
Note that nonverbal sounds such as uh-huh may also function as direct responses to yes/noquestions. In that case, they also form a complete SU.
A: Je to v pořádku /?B: HM /. Pojďme dál /.
A: Is it ok /?B: Uh-huh /. Let’s move on /.
49

Chapter 5. Czech Speech Corpora with Structural Metadata Annotation
5.3.3.15 Subordinate Clauses within Complex Sentences
Dealing with complex and compound sentences represents one of the most important partsof the MDE annotation. This section describes annotation of complex sentences that containsome kind of subordination. Subordinate clauses cannot themselves constitute a complete SUbecause they depend on the rest of the sentence and thus may not stand on their own; theyare semantically linked to their main clauses. Subordinate clauses are separated by clausalbreaks within MDE.
Já ti tu adresu dám /, když mi zavoláš /.
I will give you the address /, if you call me /.
If there is not just a single subordinate clause but two subordinate clauses dependent on thesame independent clause and joined by coordination, a coordination break is used to separatethese two dependent clauses. An SU-external break cannot be applied since neither of thesesubordinate clause can stand on its own without changing meaning of the whole statement.
Já ti tu adresu dám /, když mi zavoláš /& nebo pošleš email /.
I will give you the address /, if you call me /& or send me an email /.
Unlike English, relative clauses are separated by clausal breaks in the Czech MDE. Thisadjustment reflects Czech syntax which requires to separate relative clauses by commas, re-gardless whether they are restrictive or not. If we did not use clausal breaks for relative clauses,the MDE transcripts would be less transparent for the annotators.
Daniel /, který se narodil v Praze /, miluje Karlův most /.
Daniel /, who was born in Prague /, loves the Charles bridge /.
5.3.3.16 Compound Sentences
Compound sentences consist of two ore more main (independent) clauses joined by coordi-nation. As described above, the goal is to divide the compound sentences within a spokendiscourse into “minimal meaningful units” functioning to express a complete idea. It meansthat we split independent clauses into two complete SUs every time they can stand alone(i.e. they do not depend on each other for completion of an idea). The potential break pointis the interword boundary right before the coordinating conjunction as shown in the followingexample.
Adam hraje tenis /. a Robert cvičí jógu /.
Adam plays tennis /. and Robert practices yoga /.
However, not all cases are that clear as the one in the example above. In some cases,coordinated main clauses cannot be split into two independent SUs. In such cases, a coordi-nation break is used instead of an SU-external symbol. In English MDE, this situation mostfrequently arise when the second coordinate clause has a dropped subject. In English, subjectdropping is only allowed in the second clause of a compound sentence when both clauses sharethe same subject. It implies that such compound sentences cannot be divided into two SUs be-cause coordinated main clauses with dropped subjects do not form syntactically encapsulatedunits, and thus cannot stand alone. See the difference in the following illustrative example.
50

5.3. Structural Metadata Annotation for Czech
I love volleyball /. but I hate playing with beginners /.vs.
I love volleyball /& but hate playing with beginners /.
However, this rule cannot be applied to Czech. In contrast with English, Czech subjects(pronouns) can be dropped every time they are “understood” from context and/or from theform of a conjugated verb (predicate). Thus, since the conjugation of the verb includes bothperson and number of the subject, it is possible to say for instance just “Běžím /.” whichmeans “(I am) running /.” This phenomenon of subject dropping is typical for highly inflectivelanguages.
For the above stated reason, subject dropping in the coordinated clause does not implythe use of the coordinating break alone, as is the case for English. Instead, we separate thecoordinated clauses with an SU-external break, even if the subject is present in the first clauseand dropped in the second clause:
Robert do práce šel pěšky /. ale domů jel vlakem /.
Robert walked to work /. but (he) took the train home /.
In the Czech MDE, a coordination break is used for separation of coordinated main clauses inthe following cases:
1. The compound sentence is structured with a non-continuous expression such as sice –ale (though – but), buď – nebo (either – or), or nejen – ale i (not only – but also).
Ona je nejenom krásná /& ale také je laskavá /.
Not only she is beautiful /& but also she is kind /.
2. The second coordinate clause is elliptical and cannot stand alone.
Katka miluje kosatce /& ale Eva tulipány /.
Katka loves irises /& but Eva tulips /.
3. There exists a subordinate clause that is dependent on both main clauses.
Když byl hotov /, zavřel okno /& a sedl si na postel /.
When he was finished /, he closed the window /& and sat on the bed /.
4. Main clauses are joined by the syntactically primarily coordinating yet semantically oftenrather subordinating conjunction neboť (for).
Šli jsme se koupat /& neboť bylo krásné počasí /.
We went swimming /& for the weather was great /.
The rule No. 1 was adopted from the English MDE. The rules No. 2 and 3 are not explicitlymentioned in the English guidelines, however, the correct annotation of these phenomenashould be the same as for Czech. The last rule in the list is specific for Czech.
51

Chapter 5. Czech Speech Corpora with Structural Metadata Annotation
5.3.3.17 Coordinate Questions
When two questions are coordinated within a compound sentence, both of them receive thequestion label.
Půjde Robert do divadla /? a Adam zůstane doma /?
Will Robert go to the theater /? and will Adam stay at home /?
However, it is very common to drop an auxiliary verb in the second interrogative clause, which,in contrast, induces the use of a coordination break.
Bude Robert v divadle /& a Adam doma /?
Will Robert be in the theatre /& and Adam at home /?
5.3.3.18 Compound Predicates
Another important fact influencing the Czech MDE is that Czech syntax discriminates betweencompound sentences sharing a single common subject and simple sentences with compoundpredicates (i.e. compound predication in a simple sentence). The compound predicate is de-fined as a “tight unit” of two or more predicate verbs predicating on the same subject. Onthe other hand, if the predicate verbs do not form such a “tight unit”, a compound sentence isrecognized. Unfortunately, there is not absolute agreement in the literature on the exact bor-derline between compound predicates and compound sentences. For the MDE purposes, I onlyrecognize those compound predicates that can be identified based on unambiguous features.Within Czech MDE, the compound predicate is recognized if:
1. The predicate verbs share a common constituent (e.g., object).
Nacpal /& a zapálil si dýmku /.
He filled /& and lit up his pipe /.
2. The predicate verbs joined by a copulative conjunction have the same or very similarmeaning.
Naši hosté často slaví /& a radují se /.
Our guests often rejoice /& and celebrate /.
While compound predicates did not motivate any SU breaks according to the initial versionof the annotation guidelines, the current version instructs annotators to separate parts ofcompound predicates by a coordination SU break. A preliminary analysis showed that theredefined annotation rule supported IAA.
5.3.4 Technical Aspects of MDE Annotation
The two Czech MDE corpora were annotated just by two annotators. Since Czech syntax isquite complex, naive annotators could not be employed; at least some linguistic education isnecessary and such annotators are quite difficult to find. The small number of labelers sloweddown the annotation process, but, on the other hand, it supported annotation consistency.Moreover, the submitted annotations were checked by the author of this thesis. The MDEannotations of the easier BN corpus were checked on the basis of a random sample, while forthe more difficult RF data, all submitted annotations were carefully revised.
52

5.4. Analysis of Czech Structural Metadata Corpora
To ease the annotation process, a new annotation software has been developed. It wasdesigned to reflect the particulars of the Czech annotation task. As with LDC’s MDE Anno-tation Toolkit [114], the Czech tool allows annotators to highlight relevant spans of text, playcorresponding audio segments, and then record annotation decisions. The screen of this toolis shown in Appendix A. The screenshot also shows a longer stretch of the MDE annotatedCzech data.
5.4 Analysis of Czech Structural Metadata Corpora
This section presents and discusses some interesting statistics about structural metadata inthe two MDE annotated Czech corpora. It is organized as follows. The first subsection isdevoted to IAA on the Czech MDE annotation task. The following three subsections reportparticular corpus statistics relating to fillers, disfluencies, and SUs, respectively. The numbersare compared with available corresponding numbers relating to English MDE corpora (mostlytaken from [115]). However, note that while these comparisons are interesting, they do notallow to draw fundamental conclusions about structural differences between spoken Czech andEnglish since there is not a perfect match in genre and speaking style. The Czech BN corpus iscompared with the English BN MDE corpus, and the RF corpus with the English CTS corpus.Quite a good match is expected for BN data, but when comparing Czech broadcast conversa-tions with English telephone speech, one must also take into account significant differences inthe speaking styles. Broadcast conversations are more formal and less interactive.
5.4.1 Inter-Annotator Agreement on Czech MDE Annotation
This section focuses on testing annotation reliability in terms of IAA. If we employ goodannotators and the annotation task is well-defined in the guidelines, different annotators shouldconsistently generate similar annotations. To estimate annotation consistency, we typically usea random corpus sample that is independently labeled by two or more human annotators andmeasure the degree of IAA on this sample [116].
In general, it is not convenient to directly measure the percentage of judgments on whichthe annotators agree when coding the same data independently. The absolute agreementnumbers do not yield values that give a good notion about the quality of annotation sincesome agreement is always due to chance. Therefore, we should measure agreement abovechance in order to receive meaningful IAA numbers. To this end, we can employ the K(kappa) statistic [117] which is considered to be a standard measure of agreement in manyannotation tasks related to language processing. This agreement measure is defined as
K =Ao −Ae1−Ae
(5.1)
where Ao denotes the observed agreement and Ae the expected (chance) agreement. Theinterpretation of K is not completely straightforward. We must be aware of the fact thatmeasuring IAA is not equivalent to hypothesis testing, so that there is no theoretic cut-offvalue as well as no clear probabilistic interpretation. K evaluates the magnitude of agreementrather than compares two hypotheses. In the original paper presenting this method [117],Carletta claims that for tasks like content analysis, K > 0.8 is considered to be good reliability,and 0.67 < K < 0.8 allows to draw tentative conclusions.
For Czech MDE, we tested IAA on three recordings from the more difficult RF corpus.These recordings were dually-annotated by two experienced annotators. The total durationof these recordings was 86 minutes, the total number of tokens was 13k. For SU breaks, we
53

Chapter 5. Czech Speech Corpora with Structural Metadata Annotation
Table 5.2: Frequencies of filled pauses
BN RF
% of words followed by FPs 0.5% 3.8%Proportion of EEs N/A 93.1%Proportion of MMs N/A 6.9%
got K = 0.88 taking into account all SU types (both internal and external). For the keytask annotation – “SU-boundary” vs. “no SU-boundary” – we got K = 0.92. For filler anddisfluency labels, we got overall K = 0.85. Given the complexity of this annotation task, thesenumbers seem to be very well acceptable. Unfortunately, we could not compare our IAA withIAA for the English MDE since the numbers for English are not publicly available.
We also measured IAA for the additional Czech MDE annotation subtask – labeling ofprosodic strength of SU boundaries. Measuring IAA on “/. vs. //.” on the same dually-annotated recordings, the following consistency values were achieved. If the two annotatorsagreed on using a statement break after a particular word, they also used the identical symbol(/. or //.) in 86.9 % of the cases. In terms of the kappa statistics, we got K = 0.69 whenonly taking into account the words followed by a statement break (i.e. ignoring all words withno statement label). For comparison, for “/. vs. //. vs. other”, we obtained K = 0.85.
5.4.2 Statistics about Fillers
Table 5.2 reports numbers relating to occurrences of FPs. As expected, FPs are significantlymore frequent in conversational than in broadcast news data. Another important observationis that EE FPs are much more frequent than MMs – they represent more than 93 % of FPs.Note that this comparison is only available for the RF corpus since the Czech BN corpus usesdifferent rules for transcription of FPs (cf. Section 5.3.1.1). For comparison, 2.2 % of wordsis followed by an FP in the English CTS corpus, and 1.4 % in the English BN corpus. Arelatively smaller number of FPs in English CTS data might be explained by three differentfactors. First, transcribers of the English database could have missed a number of FPs sincesome of them are less audible and telephone data are more noisy. Second, Czech syntax ismore complex than English, thus speaking in Czech represents a more complex mental processwhich may cause a higher number of hesitations. Third, talkers may hesitate by voice morewhen speaking in public. In private conversations, people often do not care about beinggrammatically correct, which makes speech planning easier. On the other hand, the largerpercentage of FPs in English BN data is caused by the fact that these data contain a largerproportion of speech having a relatively higher level of spontaneity. Commercial TVs andradios are in minority in the Czech BN corpus, and broadcast news on Czech public radio andTV channels has significantly less interactive style than typical American broadcast news.
Table 5.3 shows numbers of words labeled as DMs or DRs. As with FPs, this kind of fillersis more common in conversational speech – just 0.1 % of words is labeled as a DM or a DRin the BN data. An interesting statistic to observe is the proportion of DMs and DRs. Inthe RF corpus, “non-DR” DMs prevail, whereas the DR subtype covers over 53 % of all DMsin the BN corpus. The explanation for this observation may be the following. DMs are notfrequently used by anchors in the studio, they are more typical for local reporters referring onactual events directly from their venues. These reporters typically react on questions comingfrom the studio and their interactive replies contain a number of DRs. English MDE datacontain a higher number of DMs than Czech data – 4.4 % in CTS and 0.5 % in BN speech.
54

5.4. Analysis of Czech Structural Metadata Corpora
Table 5.3: Proportions of discourse markers and discourse responses
BN RF
% of words in DMs and DRs 0.1% 1.6%Proportion of DMs 46.7% 73.3%Proportion of DRs 53.3% 26.7%
Table 5.4: Most frequent discourse markers (overall, in the RF corpus, and in the BN corpus)
DM Overall BN RF DM Overall BN RF
tak 17.0% 32.8% 15.8% tedy 5.7% 4.1% 5.8%no 13.2% 25.4% 12.2% jako 5.0% 7.8% 4.8%prostě 12.9% 4.5% 13.6% čili 4.8% 0.8% 4.8%vlastně 7.1% 3.7% 7.4% ano 3.8% 2.9% 3.9%jaksi 7.0% 2.5% 7.4% teda 2.9% 2.0% 2.9%
Table 5.4 shows ten most frequent DMs in the Czech data. The most frequent DM wastak (so) followed by no (well) and prostě (simply). The DM tak was first in both corpora(but more dominant in the BN corpus), while no came second in the spontaneous corpus, andprostě came second in the news corpus. Note that all frequent DMs consist of just one word.The table indicates that most significant difference are in DMs as prostě, vlastně (actually),and jaksi (somehow), which are more frequent in the RF corpus. The reason is that DMs ofthe DR subtype prevail in the BN corpus, while the three mentioned DMs typically occur asturn-internal. Another interesting observation is that DMs containing a verb are much lessfrequent in Czech than in English. Although there exist some Czech equivalents of the popularEnglish DM you know (such as víte or víte co), only a minority of speakers really use them.
Table 5.5 displays frequencies and average lengths of A/Ps and EETs. A/Ps are relativelyfrequent in the RF corpus, containing 1.5 % of all uttered words. On the other hand, A/Pstructures are quite rare in planned speech; they cover just 0.2 % of words. For comparison,English CTS data contain only 0.3% of A/Ps, which supports the hypothesis that A/Ps aremore frequent in conversational Czech than in conversational English. The statistics alsoindicate that A/Ps in conversational speech are on average approximately one word longer.
As expected, EETs were really rare. In total, they include just 0.08 % of words in the RFdata and 0.01 % in the BN data. These numbers are pursuant to English MDE corpora whereEETs represent 0.05 % and 0.02 % of words, respectively. Since average lenghts of EETs are1.2 and 1.1 words, respectively, it is possible to ratiocinate that one word EETs are stronglydominant. Table 5.6 shows the most frequent Czech EETs. For both corpora, we can observethat by far the most frequent EET is nebo (or); it represents more than two thirds of all EETinstances. The second most frequent EET is respektive (let’s say, respectively).
The total proportions of filler words (i.e. sum of all FPs, DMs, A/Ps, and EETs) signifi-cantly differ between the two Czech corpora. While they represent just 0.79 % of all words inthe BN corpus, they cover 6.97 % of words in the spontaneous RF corpus. For English MDEcorpora, this total filler percentage is 9.2 % for CTS, and 2.1 % for BN data.
5.4.3 Statistics about Edit Disfluenscies
Statistics relating to edit disfluencies are presented in Table 5.7. As with fillers, disfluencieswere much more frequent in the spontaneous corpus, where 2.8 % of words were labeled as
55

Chapter 5. Czech Speech Corpora with Structural Metadata Annotation
Table 5.5: Statistics about A/Ps and EETs
BN RF
% of words in A/Ps 0.2% 1.6%Average length of an A/P (in words) 5.4 6.2% of words in EETs 0.01% 0.08%Average length of an EET (in words) 1.1 1.2
Table 5.6: Most frequent explicit editing terms (overall, in the RF corpus, and in the BN corpus)
EET Overall BN RF EET Overall BN RF
nebo 69.6% 66.7% 69.9% vlastně 1.9% 0.0% 2.1%respektive 3.7% 6.7% 3.4% prostě 1.9% 0.0% 2.1%tedy 3.1% 0.0% 2.7% pardon 1.9% 6.7% 1.4%teda 2.5% 0.0% 2.7% ne 1.9% 0.0% 2.1%
within a DelReg. The corresponding percentage in Czech BN speech was just 0.2 %. Likewise,edit IPs were ten times more frequent in the RF corpus than in the BN corpus. In thecompareable English corpora, edit disfluencies were more frequent. DelRegs covered 5.4 % ofwords in CTS, and 1.5 % in the English BN data. Again, the explanation for this is in differentspeaking styles.
Another interesting numbers refer to occurrences of corrections and EETs within edit dis-fluencies. The proportion of DelRegs having a correction is dependent on the frequency ofrestart disfluencies since this disfluency type does not contain a correction. Because restartsare typical for spontaneous speech, the relative number of DelRegs having corrections is ac-cordingly smaller in the RF corpus. As expected, EETs were very rare in both corpora. Onlyapproximately 4 % of disfluencies contain an EET. The next statistics in Table 5.7 expressaverage lengths of DelRegs and their corrections. It is possible to see that short disfluenciespredominate; their average length is around 1.5 word in both corpora. Another interestingobservation that should be pointed out is that corrections have almost the same average lengthas DelRegs.
Furthermore, notable statistics are those referring to the total portion of data marked forthe potential automatic cleanup. This number is obviously correlated with the complexity ofthe MDE task for a particular corpus. Hence, I summed words in DelRegs and fillers andcompared the two Czech MDE corpora. As expected, the results were largely unequal – 9.8 %for the RF corpus while just 1.1 % for the BN corpus. For comparison, it was 17.7 % for theEnglish CTS and 3.8 % for the English BN corpus.
Unlike previous work, I also analyzed DelRegs and corrections in terms of which parts ofspeech they typically contain. To my best knowledge, this is the first analysis studying the POScontent of speech disfluencies in any language. Both Czech corpora were tagged using a state-of-the-art automatic morphological tagger based on the averaged perceptron method [118]. Ofthe positional Czech morphological tags12, I only used the first positions that correspond to thePOS information. For either Czech corpus, I computed three POS distributions correspondingto the whole corpus, DelRegs, and corrections, respectively.
The relative frequencies of particular POSs are shown in Figure 5.1. The top chart repre-sents the BN corpus, the bottom chart the RF corpus. POS on the x-axis are sorted according
12The positional Czech tagset is described in Section 10.4.1.3 on page 121.
56

5.4. Analysis of Czech Structural Metadata Corpora
Table 5.7: Statistics about edit disfluencies
BN RF
% of words followed by Edit IPs 0.2% 2.0%% of words within DelRegs 0.3% 2.8%% of DelRegs having Correction 94.6% 83.8%% of DelRegs having EET 3.5% 4.0%
Average length of DelRegs (in words) 1.4 1.6Average length of Corrections (in words) 1.5 1.6
N V P D J A R C T I0
0.1
0.2
0.3
0.4
Rel
. Fre
quen
cy
RF
N V P D J A R C T I0
0.1
0.2
0.3
0.4
Rel
. Fre
quen
cy
BN
AllDelRegsCorr
AllDelRegsCorr
Figure 5.1: Relative frequencies of Czech POS in all data, DelRegs, and corrections in the BN (top)and the RF corpus (bottom). (POS legend: N – Nouns, V – Verbs, P – Pronouns, D – Adverbs,J – Conjunctions, A – Adjectives, R – Prepositions, C – Numerals, T – Particles, I – Interjections)
to their frequencies in the RF corpus. The blue bars show that the corpora differ in overallPOS distributions. The BN corpus contains significantly more nouns and adjectives, while theconversational corpus shows distinctively higher relative numbers of pronouns, adverbs, andconjunctions, and a slightly higher proportion of verbs. These observations may be clarifiedby differences in speaking styles. Broadcast news data consist of sentences that were preparedto be as informative as possible, and thus contain a lot of nouns and adjectives. On the otherhand, conversational language is characterized by a more complex way of locution. A highernumber of complex and compound sentences logically implies a higher number of conjunctions,while numerous discourse markers having the form of adverbs cause the higher proportion ofthat POS type.
Despite the differences in overall POS distribution, both corpora show similar changes inthe distribution when only the words in DelRegs are taken into account. The proportionof nouns, pronouns, and prepositions is increased, while verbs, adverbs, and adjectives areless frequent in comparison with the general distribution. The increased number of nounsin DelRegs is not surprising. Speech disfluencies more frequently occur in more informative
57

Chapter 5. Czech Speech Corpora with Structural Metadata Annotation
Table 5.8: Relative frequencies of SU symbols (both SU-internal and SU-external)
SU break BN RF SU break BN RF
/. 6.7% 15.1% /- 0.0% 0.4%//. 60.2% 28.9% /∼ 0.6% 2.7%/? 0.3% 0.7% /& 2.9% 6.7%//? 1.3% 3.4% /, 28.1% 42.2%
regions of utterances and nouns usually carry information more densely than, for instance,verbs. A higher frequency of prepositions is consequent because prepositions are dependenton nouns.
Interesting variances may also be observed between DelRegs and their corrections. Themost prominent difference is in the higher rate of adjectives within corrections. This factindicates that speakers often put in the adjectives omitted in DelRegs. We can also observeslightly higher frequencies of verbs and adverbs. On the contrary, nouns, conjunctions, andprepositions are less common than in DelRegs. The difference in the proportion of prepositionsis only visible in the BN corpus.
5.4.4 Statistics about SUs
Relative frequencies of all SU symbols (both SU-external and SU internal) are displayed inTable 5.8. This table shows that both corpora significantly differ in SU distributions. Thesymbol “/,” is most frequent in the RF corpus, whereas “//.” is strongly dominant in the BNcorpus. This indicates that complex and compound sentences are more common in spontaneousconversations, while prearranged broadcast news typically consist of statements with simplerclause syntax.
Another substantial findings relate to differences between relative frequencies of single- anddouble-slash SU-symbols. Overall, the double-slash symbols are more frequent. The contrastis more distinctive in BN data, where “//.” is almost ten times more frequent than “/.”. Thisfact is not surprising since sentence boundaries are usually attentively prosodically marked byprofessional newscasters. In the RF corpus, “//.” is approximately twice as frequent as “/.”.
The statistics about incomplete SUs indicate that incompletes are much more common inconversational speech. Furthermore, incomplete SUs interrupted by another speaker (/∼) aremore frequent than arbitrarily abandoned statements (/–). The latter type of incompletesalmost never appears in broadcast news.
Table 5.9 shows average lengths of all, complete, and incomplete SUs in both Czech cor-pora. The numbers indicate that SUs in the conversational corpus are slightly longer. Forcomparison, the English CTS corpus has mean SU length 7.0 words and the English BN corpus12.5 words. The average SU length for broadcast news corpora is similar for both languages,whereas the average SU lengths in the the compared spontaneous corpora strongly differ. Theaverage segment length in conversational data is largely affected by backchannels. There isa large number of short backchannel SUs in the English telephone corpus, while backchannelSUs are not taken into account for the single-channel Czech RF corpus.
Table 5.10 reports average lengths of particular SU subtypes. These numbers indicateseveral interesting findings. First, statement SUs are longer than interrogative SUs. Further-more, double slash SUs (i.e., SUs with a strong prosodic marking at their boundaries) aresignificantly longer than corresponding one slash SUs. Note that this difference in length ismore prominent for the BN data.
58

5.5. Chapter Summary and Conclusions
Table 5.9: Average length (in number of words) of complete and incomplete SUs
BN RF
All SUs 13.0 14.5Complete SUs 13.0 14.7Incomplete SUs 10.2 11.9
Table 5.10: Average length (in number of words) of individual SU subtypes
SU type BN RF SU type BN RF
/. 7.8 12.6 //? 9.9 12.6//. 13.7 16.1 /– 11.3 15.2/? 8.7 11.5 /∼ 10.2 11.4
In addition, I also analyzed what happens with the average SU length when single slashsymbols are not considered to be SU-external but rather SU-internal boundaries. This hy-pothetical modification of the SU boundary definition lead to increase of average “//.” SUlength from 16.1 to 21.9 words for the BN data, and from 13.7 to 14.6 words for the RFcorpus. The mean length of double slash interrogative SUs rose from 12.6 to 15.7 words, andfrom 11.3 to 13.2 words, respectively. Note that these increases in length are more prominentfor spontaneous speech data where double slash boundaries are less frequent.
5.5 Chapter Summary and Conclusions
In this chapter, I have described the creation of Czech speech corpora annotated with struc-tural metadata. Two corpora from two different domains were created – one in the domainof broadcast news (mostly read-aloud speech) and the other in the domain of broadcast con-versations (mostly spontaneous speech). The first corpus was created by enriching an existingcorpus with the structural metadata annotation, while the second was built from scratch – ithad to be recorded and manually transcribed first.
The structural metadata annotation was based on the LDC’s “Simple Metadata Annota-tion Specification”, originally defined for English. The original guidelines were adjusted toaccommodate specific phenomena of Czech syntax. Moreover, I proposed and used a novelapproach to transcribing and annotating filled pauses in Czech, distinguishing vowel-like (EE)and consonant-like (MM ) sounds. In addition to the necessary language-dependent modifi-cations, I applied some language-independent modifications refining the original annotationscheme. The refinements included limited prosodic labeling at sentence unit boundaries anddistinction of two types of incomplete units.
Furthermore, I have presented a comparison of Czech broadcast news and broadcast conver-sations in terms of MDE statistics relating to fillers, edit disfluencies, and SUs. The comparisonis useful for evaluation of complexity of the Czech MDE task in the two genres. Moreover,it provides interesting data about domain-specific speaking styles. It also shows some cross-linguistic differences because I not only compared the two Czech corpora with each other, butalso with the available numbers relating to existing English MDE corpora.
Among others, the comparison shows that the total proportion of filler words (i.e., thesum of all FPs, DMs, A/Ps, and EETs) is significantly higher in the RF corpus (6.97 % ofwords) than in the BN corpus (0.79 %). Likewise, edit disfluencies are much more frequent inthe RF corpus (2.8 % of words within DelRegs in the RF and 0.2 % in the BN). I also found
59

Chapter 5. Czech Speech Corpora with Structural Metadata Annotation
that DelRegs and their corrections show differences in POS distributions in comparison withthe general POS distribution. Regarding SU symbols, I observed that clausal breaks are morefrequent in the RF corpus, which indicates that complex sentences are more common in talkshows than broadcast news. Furthermore, I found that SUs in the conversational broadcastdata are on average longer by 1.5 words than SUs in broadcast news.
In order to have more data for training and testing automatic systems for spontaneousCzech, the RF corpus is currently being extended by 20 additional talk show recordings.After this extension, the RF corpus should yield over 33 hours of transcribed and MDE an-notated broadcast conversation speech. I should also mention that both Czech MDE corporaare planned to be made publicly available – their publication at the LDC is currently beingprepared.
Speech corpus development is a very time-consuming and labor-intensive process whichcuts down the time available for other research tasks. However, I hope that all the effort putinto it paid off and the corpora created as part of this work will be of benefit for the spokenlanguage processing community. Besides their importance to automatic structural metadataextraction research, the two new MDE corpora should also be useful for training ASR systemsas well as for linguistic analysis of read-aloud and spontaneous Czech. Finally, note that thecorpora described in this chapter were used for automatic SU segmentation experiments thatare described in Chapter 10.
60

Chapter 6
Prosodic Features for Classification
The power of speech is not in words, but in the oration.Srijit Prabhakaran
The previous chapter was devoted to the creation of data resources. This chapter begins thethesis part concerning the automatic sentence segmentation system development. First of all,I take a closer look at the use of prosodic features. Some important qualitative aspects ofprosody were described in Section 2.2. This chapter focuses on methods for extraction ofprosodic features for automatic classification. Thus, prosody is viewed in terms of a quan-titative description herein. In this chapter, rather than giving an exhaustive enumeration ofall employed prosodic features, I describe motivations and general techniques used for theirdesign and extraction. The overall number of designed features is quite high – a complete listof all implemented features, along with their brief descriptions, is given in Appendix B.
The prosodic features for sentence segmentation of speech reflect breaks in temporal, into-national, and loudness contours, and are inspired by linguistic knowledge. To use prosody inautomatic systems effectively, all of the prosody processing must be performed automatically.In the employed approach, prosodic information is obtained from a combination of the speechsignal and speech recognition output, which is used to provide word and phone alignments. Allemployed features are designed to be automatically extractable, without need for any humanlabeling. First, a huge set of potentially useful features was extracted, which, after initialinvestigations, was pared down to a smaller set by eliminating redundant features.
Most of the implemented prosodic features were inspired by [49, 119, 120]. The prosodicfeatures can be grouped into broad feature classes based on the prosodic quality they aredesigned to capture – pause, pitch, duration, and energy. In addition to the pure prosodicfeatures, the automatic classifiers also have access to a limited number of “other” features,capturing important phenomena such as speaker change or overlap. Since these features areusually incorporated into the prosody model for machine learning purposes, their descriptionis also included in this chapter.
The remainder of this chapter is structured as follows. Section 6.1 depicts feature extractionregions. Section 6.2 describes pause features. Section 6.3 is devoted to pitch preprocessing andpitch features. Section 6.4 presents duration features, Section 6.5 describes energy features,and Section 6.6 overviews “other” features. Section 6.7 presents the method used for featurespace reduction. Finally, Section 6.8 summarizes the chapter.
61

Chapter 6. Prosodic Features for Classification
Figure 6.1: Prosodic feature extraction region spanning the previous, the current, and the followingword
6.1 Feature Extraction Regions
As in previous work on automatic sentence segmentation, I have only used local prosodicfeatures. The reasons for this decision are quite straightforward. As mentioned in Section 3.1,a number of linguistic studies based on listening tests showed that most of important prosodicinformation is coded locally. Moreover, the local features are much easier to extract. Althoughin principle one may consider longer regions, it is not obvious how such long range prosodicfeatures should be designed. This problem exceeds the scope of this thesis, however, it isdefinitely an interesting direction for possible future research.
All prosodic features employed in this work were extracted on the word level, i.e. thefeatures are associated with particular interword boundaries. However, the classifiers do notonly have access to features relating to the boundary after the current word, but to capturelocal prosodic dynamics, the classifiers also use features associated with boundaries after theprevious and the following word. The feature extraction region is depicted in Fig. 6.1. Typi-cally, one feature describes prosodic information contained in the word before the referentialboundary, or captures prosodic differences between the two words across the boundary. Wordboundary timestamps are obtained using an automatic speech recognizer. Throughout thisthesis, I use the following notation. Names of the features relating to previous words are pre-fixed with “p.”, names of the features relating to following words with “f.”, and the featuresrelating to current words have no prefix.
6.2 Pause Features
Pauses signal breaks in prosodic continuity, so they are very important indicators of sentenceunit boundaries. Intuitively, if the pause between the current word and the following wordis long, it is more likely that the current word is followed by a sentence boundary. Pausefeatures are quite robust in the face of speech recognition errors since, in principal, their valueis only dependent on correct speech/non-speech segmentation. Pause durations can easily beextracted from automatic word alignments. If there is no pause at the boundary, which isthe most frequent case in continuous speech, the pause duration feature is output as zero. Ido not only use the pause duration at the actual boundary; the pauses at the preceding andthe following interword boundary may be important as well. Their duration may indicateshort backchannels or reflect whether speech right before the boundary was just starting up orcontinuous in a longer region. The question is whether the pause features should be normalizedper speaker or not. My preliminary experiments showed that raw durations perform better.This finding is in agreement with [49].
62

6.3. Pitch Features
6.3 Pitch Features
As mentioned in Section 2.2, perceived pitch is a psychoacoustic quantity that cannot bedirectly measured from the speech signal. Instead, we measure the fundamental frequency ofthe glottal tone (F0), which is its correlate. It is the frequency at which vocal chords oscillatewhen producing voiced sounds. On the other hand, unvoiced regions of speech do not containthis periodic component.
6.3.1 Pitch Tracking
Several methods for measuring F0 from the speech signal have been proposed. One of thepopular methods is the RAPT algorithm (Robust Algorithm for Pitch Tracking) [121]. Thismethod employs Normalized Cross Correlation Function (NCCF) to generate pitch periodcandidates. This function is more robust to quick F0 changes than the formerly frequentlyused autocorrelation function. The NCCF is defined as
φi,k =
∑m+n−1j=m sjsj+k√emem+k
, k = 0,K − 1; m = iz; i = 0,M − 1 (6.1)
where m is the sample number, i is the index of the current frame, k is the index of the delay,z the frame shift, M the total number of frames, and n is the size of the analyzed window.The normalization factor ej is defined as
ej =j+n−1∑
l=j
s2l (6.2)
φi,k ranges in 〈−1, 1〉, values close to 1 signal that the delay kT is an integer multiple of theperiod 1
F0.
The idea of the RAPT method is the following. First, the input signal is downsampled andthe peaks (areas of interest) are found in this coarse version of the signal. The values of theNCCF are then computed from the original signal only in these areas of interest. All peaksfound in this stage are then viewed as F0 candidates for the current frame. Finally, by usinga dynamic programming method, we either select the most probable candidate value or markthe frame as unvoiced. The selection of the most probable candidate also takes into accounttypical properties of F0 curves.
6.3.2 Octave Error Correction
Despite the fact that the RAPT algorithm is quite robust, it is, as well as other pitch trackingmethods, prone to octave errors. For instance, noise and/or a creaky or gaspy voice maycause tracking errors. In such cases, the algorithm often outputs halved or doubled F0 values.Reasons for the halving (subharmonic) errors are the following. If the signal is T -periodic,it is also 2T , 3T , etc. -periodic. The NCCF values for the multiples of T (subharmoniccomponents) may be high and confuse the tracking algorithm. These errors are frequentlycaused by a creaky voice quality.
The doubling (harmonic) errors have the following reasons. If the componentM dominatesin the energy of the speech signal, the correlation score for the period T/M becomes high.For example, if this harmonic component is equal to the first formant frequency, it causes aresonance effect and this component is amplified. The doubling errors have M = 2.
Most of these errors are successfully detected during the RAPT’s dynamic programmingstage, especially if the speech signal is not noisy. However, the pitch tracking algorithm output
63

Chapter 6. Prosodic Features for Classification
log F0
p (
log
F0 )
Accurate
Halved Doubled
Figure 6.2: LTM model for F0
usually still contains a number of halved/doubled values so that postprocessing techniquesshould additionally be applied. For example, a postprocessing algorithm called de-step filterwas introduced by Bagshaw [122]. This simple method is based on the assumption that F0
values of two contiguous frames may differ at most by 75%, while the first value of a voicedregion may change arbitrarily with respect to the last value of the previous voiced region.Since I have not employed this technique, I do not describe it here in detail, but interestedreaders may consult the above cited publication.
For this work, I have adopted a pitch postprocessing technique that is based on using aspeaker’s longterm F0 distribution. Sönmez et al. showed that correct F0 values approximatelyhave a lognormal distribution [123]. The measured pitch containing octave errors can bemodeled using the Lognormal Tied Mixture (LTM) model with three Gaussian components.Individual components correspond to halved, accurate, and doubled F0 values, respectively. Itis assumed that all three components have the same variance and their mean values are shiftedby log 2 in the log domain. The model is illustrated in Fig. 6.2. In a mathematical notation,the LTM model can be expressed as
log(F0) ∼ LTM(µ, σ, λ1, λ2, λ3) = λ1 · N (µ− log 2, σ2) + λ2 · N (µ, σ2)++λ3 · N (µ+ log 2, σ2)
(6.3)
In addition, the model must satisfy the constraints λi ≥ 0, i = 1, 2, 3 and∑3i=1 λi = 1.
The parameters of the model are estimated using the Expectation-Maximization (EM) algo-rithm [13]. The F0 values marked as halved or doubled may be replaced by interpolated values,or, alternatively, multiplied by 2 or 1
2 , respectively. The borderline between the halved andthe accurate component corresponds to speaker’s baseline F0 [49]. This value is important fornormalization of F0 values, as will be described below.
6.3.3 Automatic Pitch Contour Stylization
F0 contours consist of two components – macroprosodic and microprosodic. The macroprosodiccomponent represents F0 changes intented by the speaker. On the contrary, the microprosodiccomponent is not purposely controlled by the speaker, but is influenced by the local segmental
64

6.3. Pitch Features
(phonetic) content. Since we are only interested in the intentional prosody, it is advisable toremove microprosody before analyzing the pitch contour. First, the measured pitch is usuallyfiltered by a median filter. The median filtering is similar to low pass filtering, but unlikeordinary low pass filters, the median filter preserves the integrity of sudden transitions to adifferent level in the signal. A typical size of the median window for pitch filtering is 5 or 7.
The median filtered contours are typically further processed – stylized. The pitch stylizationmethods are inspired by the ’t Hart’s idea of the “close copy”. The basic idea is to replace themeasured pitch contour by a contour consisting of line fits perceptually undistinguishable fromthe original contour. For TTS systems, D’Alessandro and Mertens introduced a perceptually-based stylization method [124]. Their method was based on so-called glissandos, which aredefined as audible pitch differences. In another approach, Hirst and Espesser interpolated pitchcontours by quadratic splines [125]. Later work of the same authors extended the approachand introduced a more complex algorithm called MOMEL [126].
The stylization by quadratic splines may be convenient for some TTS-related tasks. How-ever, for tasks related to sentence segmentation, it is more convenient to smooth the contour bylines since slopes of the smoothing lines may themselves be important features for classification.Within the VERBMOBIL project, Batliner and his colleagues interpolated all measured F0
values within a voiced region by a single line using linear regression in the log domain [11]. Inthis thesis, I have adopted a more sophisticated method in which the pitch contour is stylizedby a piece-wise linear (PWL) function [127].
In order to get the stylized contour, it is necessary to determine coordinates of the nodesconnecting the line fits in each voiced region. The number of nodes may either be determinedfrom the duration of the voiced region, or chosen to warrant local smoothness of the stylizedcontour. In this work, I used the latter option, with a fixed minimum length of a region. For avoiced region to be modeled by K line segments, the free parameters are (xk, yk)Kk=0, excludingthe x-coordinates x0 and xk which are given by the edges of the voiced region. The stylizationfunction is then given by
g(x) =K∑
k=1
(akx+ bk)I [xk−1<x≤xk] (6.4)
where ak is the slope bk the intercept of the line defined by the node (xk, yk). The coordinatesof the nodes are determined by minimizing the Mean Square Error between the stylized contourand the measured F0 values
MSE(
(xk, yk)Kk=0
)
=1T
T∑
t=1
(F0(t)− g(t))2 (6.5)
The minimization can be performed numerically, e.g. using the Nelder-Mead simplexmethod [128]. An example of the stylized pitch contour is displayed in Fig. 6.3. A diagram ofthe whole pitch preprocessing procedure is shown in Fig. 6.4.
6.3.4 Pitch Normalization
Raw, unnormalized F0 values do not convey information about their relative positions withinthe pitch register of the current speaker. For instance, the same F0 value may represent a rela-tively high pitch value for one speaker (a male speaker with a deep voice), but a relatively lowpitch value for another (a female speaker with a high voice). Likewise, absolute F0 differencesdo not convey accurate information about linguistically meaningful pitch rises and falls sincethe magnitudes are dependent on the pitch range of the actual speaker. Thus, some form ofpitch normalization is necessary.
65

Chapter 6. Prosodic Features for Classification
0 50 100 150 200 2500
20
40
60
80
100
120
Frames
F0 [H
z]
Figure 6.3: Raw and stylized F0 contours
Figure 6.4: Scheme of pitch preprocessing for feature extraction
A convenient reference value for the pitch normalization is the F0 baseline, mentionedat the end of Section 6.3.2. The baseline for a particular speaker corresponds to the lowestpitch value in the non-halved mode. It is the point at which the probability of an accuratepitch is equal to the probability of halving within the LTM model. Using the notation fromSection 6.3.2, the baseline (BL) value can be computed as
BL = exp
(
µ− 12
log 2 +(log λ1 − log λ2) σ2
log 2
)
[Hz] (6.6)
Past work also investigated using F0 toplines and means for normalization, but these val-ues proved to be by far less convenient [49]. The use of baselines for normalization is alsoin agreement with the findings of Rietveld and Vermillion [129], who showed that listenersbest estimate the speaker’s pitch register from low tones. The low tones show more stablefrequencies than high tones.F0 values can be normalized with respect to the baseline value using various approaches. I
have implemented the following normalizations – linear difference, linear ratio, log difference,and log ratio. The use of logarithms, in addition to linear differences and ratios, is motivatedby the fact that humans perceive pitch changes logarithmically. All four types of normalizedpitch features are available to the machine learning algorithms, the most useful normalizationform is determined in the feature selection phase (described below in Section 6.7).
Note that this form of pitch normalization assumes that speakers are recurring and theidentity of the actual speaker is known at the time of feature computation. For some applica-tions, this condition does not represent an additional problem (e.g., meetings with participantsrecorded by head-worn microphones), while for others, employment of an automatic speakeridentification and tracking system is required. Since the state-of-the-art speaker diarizationsystems perform with diarization error rates (defined as percentage of missed speech + per-centage of false alarm speech + percentage of speech by mislabeled speakers) in the range
66

6.4. Duration Features
of 10–20% (depending on the target domain), a slight degradation of the normalized pitchfeatures may be expected.
6.3.5 Pitch Feature Types
The implemented pitch features may be grouped into three broad classes according to prosodicphenomena they aim to capture – pitch range, pitch reset, and pitch slope. The group of rangefeatures reflects the pitch range of a single with respect to the speaker’s global F0 statistics.These features are based on computation of minimum, maximum, mean, first, and last F0
values within a single word. While some raw pitch features were also implemented, to achievegood results with a speaker-independent system, the above mentioned F0 normalization isnecessary.
The second set of features was designed to capture the pitch reset phenomenon. Typi-cally, we compare F0 values in the last voiced region before the interword boundary with thecorresponding values in the first voiced region after the boundary. The computed featurescomparing the current and the following word included the ratio and the difference betweenthe two values, both in the linear and the log domain.
The final group of pitch features looks at the slopes of the stylized F0 segments. It ei-ther captures melodic trends in the word before the interword boundary, or it checks trendcontinuity across the boundary. For the latter subgroup, it is expected that discontinuous(“broken”) trajectories would tend to indicate boundaries, regardless of the absolute differencein F0 values across adjacent words. Implemented slope features include the first and the lastslope in the word, and the difference between the last slope before the boundary and the firstslope in the word following the boundary.
6.4 Duration Features
Another important prosodic cues to sentence boundaries in speech are changes in the speakingrate. Duration features primarily aim to capture the phenomenon of preboundary lengthening,which was mentioned in Section 3.1. A variety of duration features can be computed usinghypothesized time marks from the speech recognizer. The implemented duration featuresrelate to three different basic units – phonemes, rhymes, and words.
6.4.1 Duration Normalization
Similarly to pitch features, feature normalization techniques have to be applied. It is obviousthat raw phoneme durations are inapplicable since every phoneme has a different standardduration. For example, Czech consonant r is on average almost twice shorter than anotherCzech consonant c. Likewise, Czech “short”1 vowel a is on average 1.8 times shorter than its“long” counterpart á.
Two basic normalization techniques were applied. The first was using the z-score, whichtransforms a random variable into a random variable having normalized Gaussian distributionwith zero mean and unit variance. Thus, zdur for an unit u is defined as
zdur(u) =dur(u)− µdur(u)σdur(u)
(6.7)
1Czech phonology discriminates between short and long vowels, which form minimal pairs. The length is animportant distinctive feature since it differentiates various word meanings. The vowel length is independent ofthe stress.
67

Chapter 6. Prosodic Features for Classification
where µdur(u) is the mean and σdur(u) the standard deviation of the duration of the phoneme u.The alternative method only uses the mean durations for normalization, avoiding potential
errors caused by noisy estimates of standard deviations. The normalized duration is thenexpressed as
normdur(u) =dur(u)µdur(u)
(6.8)
If the unit u represents a single phoneme, it is possible to apply the above stated formulasdirectly. On the other hand, if we are interested in the duration normalization of longerunits, such as rhymes or words, it is not possible since there is not enough data to reliablyestimate statistics µdur and σdur for the larger units. Thus, it is necessary to capture thenormalized duration using duration statistics of particular phonemes contained in the largerunit. Disregarding the influence of coarticulation, it is possible to approximate µdur(w) of alarger unit w = (p1, p2, . . . , pN ) consisting of phonemes pi as
µdur(w) =N∑
i=1
µdur(pi) (6.9)
Another issue is the computation of larger unit z-scores. One possibility how to perform it isto make a simplifying assumption that phoneme durations are independent random variablesand approximate the standard deviations using the well-known formula
σ2dur(p1+p2) = σ2
dur(p1) + σ2dur(p2) (6.10)
I have chosen an alternative approach which does not estimate σdur(w), but computes z-scoreof a larger unit as an average of z-scores of individual phones. This approach seems to bemore robust. Then, the formula for the computation of the z-score becomes
zdur(w) =1N
N∑
i=1
dur(i)− µdur(i)σdur(i)
(6.11)
For all normalized duration features, both speaker-independent and speaker-specific nor-malized versions were extracted. The former versions use data from the whole speech corpus,whereas the latter versions only use data of the particular speaker for normalization.
6.4.2 Duration Feature Types
On the phone level, only vowel duration features were implemented. Vowels contribute muchmore to the overall speaking rate than consonants. In addition, they are also more robustagainst ASR errors. A number of various vowel features was computed. Intuitively, themost important feature is the normalized duration of the last vowel before the boundary.However, other vowel features were also extracted. For instance, the longest normalized vowelin the words reflects lengthening of prefinal syllables in multisyllabic words. In addition, vowelduration maxima, minima, and averages were computed, as well as a number of other durationstatistics for individual vowels in the word.
Rhyme duration features are motivated by the fact that preboundary lengthening particu-larly affects the nucleus and coda of syllables. Moreover, unlike syllable-based features, whichrepresent a possible alternative, the rhyme-based features do not require an automatic syllab-ifier. Similarly to phoneme-based features, both speaker-independent and speaker-dependentnormalizations were performed. The normalizations were carried out using the method fornormalization of larger unit durations described in the previous section.
68

6.5. Energy Features
Word-level features reflect durations of whole words. Again, the same normalization tech-niques were applied. An interesting issue is the use of raw, unnormalized word durations.We should be very careful when employing them. Although they usually aid performance ofthe prosodic classification, they correlate with lexical features that should be modeled in alanguage model. For example, certain frequent short sentences (especially backchannels) havesmall set of words, so raw durations may capture those words rather than prosody.
6.5 Energy Features
Energy features aim to capture loudness patterns. It is expected that talkers tend to begintheir utterances aloud and gradually taper off. Since loudness is a psychoacoustic quantity,which cannot be directly measured from the speech signal, we use the short term RMS (RootMean Square) energy instead. The RMS is defined as
RMS =
√√√√
1K
K∑
k=1
s2k (6.12)
where sk denotes the signal samples and k = 1, . . . ,K indices of the samples in the window.The problem with the energy-based features is that they are less reliable because of the
channel variability. Moreover, there is also some redundancy because of correlation withpitch features – they are generated using the same physiological mechanisms during speechproduction. Thus, it is often very difficult to get some gain from using them.
The used energy features represent mean, minimum, and maximum RMS values in a singleword. These values were extracted using two approaches. The first approach only uses valuesfrom the voiced frames, while the second uses all RMS values. The normalized variants ofthese features were computed by dividing the raw values by mean RMS values for the currentturn.
6.6 Other Features
Some additional automatically extracted features are also included. These features describephenomena such as turn-taking or speaker overlaps. Although they are not inherently prosodic,they are put into the group of prosodic features for modeling purposes. Since they mayinfluence prosodic quantities, it can be advantageous for prosodic classifiers to have access tothem in order to model possible interactions.
For example, turn-related features include the flags indicating whether the current wordis the first or the last word in the current turn. This information is extremely importantfor the prosodic classifiers since pause durations as well as other important features are notdefined at turn boundaries. It is obvious that speaker changes are strong indicators of sentenceboundaries. Another turn feature records the time elapsed from the start of the turn.
When dealing with multi-channel data, it is also possible to add speaker overlap features.Overlaps are frequent in natural conversations. In a study of overlap in two-party and multi-party conversations, it was shown that 30% to 50% of all speech spurts (regions of speechin which a particular speaker does not pause for more than half a second) include at leastone frame of concurrent speech by another speaker [130]. Since talkers not holding the floorpredict the end of the current speaker’s turn and often start speaking before the current speakerfinishes, overlap information might be helpful in automatic sentence segmentation.
69

Chapter 6. Prosodic Features for Classification
The implemented overlap features include the number of speakers on other channels over-lapping with the current word as well as the number of spurt-initial, spurt-internal, and spurt-final overlaps, where the spurt position is meant with respect to speakers on other than thecurrent channel. The spurt-position-based features aim to capture information that says inwhich phase of their spurt the overlapping speakers are at the moment. All overlap features areimplemented as integer-valued (number of overlapping features) but may easily be convertedinto binary features indicating whether an overlap occurs or not.
6.7 Feature Selection
As mentioned above, the overall feature set was designed to be as exhaustive as possible. Anumber of features are highly correlated, differing only in the normalization approach. Becauseof the greedy nature of some statistical classifiers, using large feature sets may yield suboptimalresults. Furthermore, redundant features negatively affect computational efficiency and resultinterpretability. Thus, a feature space reduction is desirable. The feature selection methodused in this work is motivated by prosodic knowledge. To reduce the feature space, I firstcombined similar features into groups, and then selected the features from each group thatwere most frequently used in a first set of decision trees.
Individual features were grouped according to their prosodic category (pause, pitch, du-ration, energy, other) and the reference word (previous, current, following). Moreover, thefeature capturing pause duration after the current word was included in each group. Past ex-perience has indicated that this feature is essential and always selected for the final feature set.It also functions as a catalyst during the selection process because without it, duration, pitch,and energy features are much less discriminative. In addition, all F0 subsets were analyzedin two versions. The first one contained just normalized features, while the second containedboth normalized and raw values. This bifurcation was proposed in order to avoid maskingeffects of some good normalized features by the greedy raw features. Thus, for example, onefeature subset included pause after the current word plus all normalized pitch features relatingto the word following the boundary of interest. Another example of a feature group could bethe set comprised of pause plus all duration features referring to the current word.
Subsequently, a set of decision tree classifiers was trained from each subset using an ensem-ble sampling approach (described below in Section 7.1.4.3) and average relative feature usageacross the trees was inspected. All features that showed greater usage than an (empiricallyestimated) threshold were passed on to form a new feature set containing prosodic features ofall categories. This subset, already much smaller than the huge original set, was further pareddown by eliminating redundant features using the leaving-one-out approach.
6.8 Chapter Summary
This chapter has described prosodic features employed in this thesis. I use local features ex-tracted from the window spanning the previous, the current, and the following word. Theprosodic features can be divided into groups based on what quantities they capture – pause,pitch, duration, energy, and “other”. Pause features are essential for automatic sentence seg-mentation since pauses are the strongest indicators of sentence boundaries. They are also veryrobust since their extraction only relies on speech/non-speech segmentation.
On the other hand, pitch-related features are largely dependent on accurate F0 contourpreprocessing. The preprocessing steps involve a removal of halved and doubled values based onan LTM model, median filtering, and pitch contour stylization by a piece-wise linear function.
70

6.8. Chapter Summary
The implemented F0 features capture pitch ranges, pitch resets, and slopes of the stylizedcontour.
Duration features primarily aim to capture the phenomenon of preboundary lengthening.The implemented duration features relate to three referential units – phonemes, rhymes, andwords. The features are normalized with respect to phone duration means and standarddeviations. Energy features aim to capture loudness patterns – talkers often tend to graduallytaper off toward utterance unit boundaries. The features are computed based on the shortterm RMS energy and normalized to the mean RMS value of the actual turn. The groupof “other” features involves features capturing phenomena such as turn-taking or speakeroverlaps. Although these features are not prosodic, they are put into the group of prosodicfeatures for modeling purposes.
Because the overall set of implemented features is really huge, a feature space reductionis needed before using the prosodic feature set in statistical classifiers. The feature selectionmethod used in this work is based on searching for the best features in smaller groups offeatures capturing similar prosodic phenomena. The best features from each group are passedon to form a new feature set containing prosodic features of all categories. This subset is furtherpared down by eliminating redundant features on the basis of the leaving-one-out approach.
71


Chapter 7
Statistical Models for SentenceSegmentation of Speech
As we must account for every idle word,so must we account for every idle silence.
Benjamin Franklin
In this thesis, I examine three statistical approaches to sentence segmentation of speech –a hidden Markov model (HMM), a maximum entropy (MaxEnt) model, and a boosting-basedmodel called BoosTexter. All three approaches rely on both textual and prosodic information.The approaches are interesting to compare. They not only employ different machine learningmethods but also combine the two basic knowledge sources in different ways.
The HMM-based approach uses two independent models that are combined on the scorelevel during testing. The BoosTexter approach builds one integral model that combines the twoinformation sources on the feature level already during training. The MaxEnt-based approach,in the variant used here, lies somewhere in between the previous two. During training, themachine learning algorithm combines textual features with thresholded prosodic posteriorsobtained from an independent prosodic classifier. The different views on the knowledge sourcecombination are not only interesting to compare but also may be of benefit for a subsequentmodel output combination. The different models are likely to be at least partly complementary,and thus their combination may yield superior performance.
This chapter provides a detailed description of the three above mentioned modeling ap-proaches. Its remainder is organized as follows. Section 7.1 presents the HMM approach,Section 7.2 overviews the MaxEnt approach, and Section 7.3 describes the boosting-basedapproach. Section 7.4 gives a brief summary of the whole chapter.
7.1 HMM-Based Approach
This approach to sentence segmentation, which was introduced by Shriberg and Stolcke, com-bines lexical and prosodic model within the hidden Markov model (HMM) framework. Lexicalinformation is modeled by an N -gram language model, prosodic information is representedby posteriors output by an independent prosodic classifier. During testing, both knowledgesources are combined within an HMM.
This section is structured as follows. Subsection 7.1.1 summarizes N -gram modeling tech-niques, Subsection 7.1.2 overviews fundamentals of hidden Markov models, Subsection 7.1.3
73

Chapter 7. Statistical Models for Sentence Segmentation of Speech
describes the HMM-based hidden event language model, Subsection 7.1.4 presents the prosodicmodel based on decision trees, and Subsection 7.1.5 explains the combination of prosodic andlanguage models.
7.1.1 N-gram Language Models
In many language processing problems, we need to estimate the probability P (W ) of a wordstring W consisting of words w1, w2, . . . , wT . These probabilities are typically estimated usinga statistical language model (LM). In general, the LM distribution P (W ) should depend onsyntactic, semantic, and pragmatic properties of the target language, however, it is usuallyapproximated by so-called N -gram models in real-world applications.
The N -gram models can be formalized as follows. Using the Bayes’ chain rule, the proba-bility P (W ) may be computed as
P (W ) = P (w1, w2, . . . , wT ) = P (w1)T∏
i=2
P (wi|wi−11 ) = P (w1)
T∏
i=2
P (wi|w1, . . . , wi−1) (7.1)
However, such a model would have too many parameters and it would be basically impossible toestimate them robustly. That is why we use simplified models that assume that the occurrenceof the word at position i only depends on the N − 1 previous words. This simplification maybe formalized as follows
P (wi|w1, w2, . . . , wi−1) ≈ P (wi|wi−N+1, wi−N+2, . . . , wi−1) (7.2)
For example, if we assume that the current word depends on two preceding words, we use so-called trigram probabilities P (wi|wi−2, wi−1). By analogy, we can define bigram P (wi|wi−1)and unigram P (wi) probabilities.N -gram probabilities of orders greater than one can be estimated using the maximum
likelihood approach as
P (wi|wi−N+1i−1 ) =
C(wii−N+1)
C(wi−1i−N+1)
(7.3)
where the function C(·) returns the number of occurrences of its argument in training data.However, this approach fails when C(wii−N+1) = 0 or even C(wi−1
i−N+1) = 0. In the formercase, the probability1 P (wi|wi−N+1
i−1 ) would be zero, in the latter case, it would be undefined.To overcome this problem, we use so-called smoothing techniques. The term “smoothing” refersto the fact that after its application we get a flatter distribution in which zero probabilitiesare replaced by non-zeros and non-zero probabilities are lowered. The smoothing methods notonly prevent zero probabilities but also increase overall model robustness. There are two basicsmoothing strategies: interpolation and back-off.
The interpolation smoothing methods mix the highest order N -gram distribution withlower order N -gram distributions that suffer less from data sparseness. A weighted sum of theN -gram distributions is used. In the mixture, the lowest order distribution, zerogram, has aspecific uniform distribution in which all words from the vocabulary have a probability equalto the reciprocal of the vocabulary size 1
|V | . For example, for a trigram model, we get
PIP (wi|wi−2, wi−1) = λ01|V | + λ1P (wi) + λ2P (wi|wi−1) + λ3P (wi|wi−2, wi−1) (7.4)
1To simplify the notation I will use P (·|·) instead of P (·|·) in the remainder of this thesis.
74

7.1. HMM-Based Approach
The interpolation weights λi > 0, i = 0, 1, 2, 3 satisfying the condition∑3i=0 λi = 1 are
estimated using so-called held-out data, i.e. data that we hold out from the training set fromwhich we extract the N -gram counts. The λs are usually computed via the Expectation-Maximization (EM) algorithm or Powell search [128]. Note that the interpolation do notnecessarily have to be fixed numbers; some interpolation-based smoothing methods define theweights as functions of the word history.
While the interpolation approach always uses probabilities from lower order N -gram mod-els, the back-off approach exploits information from the lower order N -gram estimator only ifit does not have non-zero count for the higher order N -gram. For instance, if the model has acorresponding (smoothed) trigram probability, it solely relies on it. By contrast, if this trigramprobability is zero, the model backs-off to bigrams. The central idea of back-off smoothingis to distribute the overall probability mass between seen and unseen events. Most back-offmethods use for this purpose the Good-Turing estimate.
According to the Good-Turing estimate, it is necessary to distribute among unseen N -grams the same portion of the probability mass as corresponds to N -grams that have onlybeen seen once (so-called singletons). Hence,
P0 =n1
N(7.5)
where n1 is the number of singletons and N the overall number N -grams. Furthermore, forN -grams occurring exactly r-times, we pretend they occurred r∗-times
r∗ = (r + 1)nr+1
nr(7.6)
Using the probability notation, we get
PGT (x) =r∗
N(7.7)
where x is an N -gram occurring r-times. The basic back-off smoothing (so-called Katz back-off) may be for trigrams written as follows
PKatz(wi|wi−2, wi−1) =
{C∗(wi−2,wi−1,wi)C(wi−2,wi−1) for C(wi−2, wi−1, wi) > 0
α(wi−2, wi−1)PKatz(wi|wi−1) for C(wi−2, wi−1, wi) = 0(7.8)
where α(wi−2, wi−1) is a normalization factor satisfying the constraint that all probabilities inthe distribution sum up to 1.
Nowadays, the most popular smoothing technique is the Kneser-Ney method [131]. It isbased on a simple technique called absolute discounting. In absolute discounting, the higherorder distribution is created by subtracting a fixed discount D ≤ 1 from each non-zero count
Pabsolute(wi|wi−2, wi−1) =
{C(wi−2,wi−1,wi)−DC(wi−2,wi−1) if C(wi−2, wi−1, wi) > 0
α(wi−2, wi−1)Pabsolute(wi|wi−1) if C(wi−2, wi−1, wi) = 0(7.9)
The Kneser-Ney method extends the absolute discounting model by a more sophisticatedway of handling the back-off distribution. The intuition behind it is that words appearing in ahigher number of different contexts are also more probable to occur in an previously unseen con-text. Nowadays, the Kneser-Ney method is usually not used based on the formula introducedin the original paper. Chen and Goodman [132] showed that modified, interpolated version ofthe smoothing algorithm, which uses three different discount parameters D1, D2, D3+ rather
75

Chapter 7. Statistical Models for Sentence Segmentation of Speech
than a single discount D for all non-zero counts, performs better. The modified smoothingformula may be expressed as follows:
PKN (wi|wi−1i−N+1) =
C(wii−N+1)−D(C(wii−N+1))∑
wiC(wii−N+1)
+ λ(wi−1i−N+1)PKN (wi|wi−1
i−N+2) (7.10)
where
D(c) =
0 if c = 0D1 if c = 1D2 if c = 2D3+ if c ≥ 0
(7.11)
To make the sum of the distribution equal to 1, we use
λ(wi−1i−N+1) =
D1N1(wi−1i−N+1, ·) +D2N2(wi−1
i−N+1, ·) +D3+N3+(wi−1i−N+1, ·)
∑
wic(wii−N+1)
(7.12)
where
N1(wi−1i−N+1, ·) =
∣∣∣
{
wi : C(wi−1i−N+1, wi) = 0)
}∣∣∣ (7.13)
N2(wi−1i−N+1, ·) and N3+(wi−1
i−N+1, ·) are defined by analogy.
Another useful technique is referred to as Witten-Bell smoothing [133]. While empiricalresults by Chen and Goodman [132] suggest that this method does not perform as well asother common smoothing techniques (especially for small training sets), in some specific casesit represents a good option. For instance, if no singletons appear in training data, we cannot usethe methods based on the Good-Turing discounting. Such a situation often comes up when weuse class-based language models. The Witten-Bell method also proved to be robust to variousirregularities in training data since it is more conservative in subtracting the probability mass.The idea of the Witten-Bell discounting is to calculate the probability of seeing a new wordbased on the number of different words that follow a certain word history. The smoothedmodel is defined recursively as
PWB(wi|wi−1i−N+1) = λ(wi−1
i−N+1)P (wi|wi−1i−N+1) + (1− λ(wi−1
i−N+1))PWB(wi|wi−1i−N+2) (7.14)
To calculate the parameters λ(wi−1i−N+1), we use the number of unique words that occur follow-
ing the history wi−1i−N+1. This count, which is denoted as N1+(wi−1
i−N+1, ·), is formally definedas
N1+(wi−1i−N+1, ·) =
∣∣∣
{
wi : C(wi−1i−N+1, wi) > 0)
}∣∣∣ (7.15)
Using this notation, the probability mass corresponding to unseen N -grams is given by
1− λ(wi−1i−N+1) =
N1+(wi−1i−N+1, ·)
N1+(wi−1i−N+1, ·) +
∑
wiC(wii−N+1)
(7.16)
A more detailed survey of LM smoothing techniques may be found in [132, 134, 135, 13,136], among others.
76

7.1. HMM-Based Approach
7.1.2 Hidden Markov Models
Hidden Markov Model (HMM) is a sequence classifier representing a probabilistic function ofa Markov process. HMMs are very popular classifiers in many different tasks ranging frompart-of-speech tagging and speech recognition to bioinformatics and musical score following.One of the reasons for the HMM popularity is the fact that there exist very efficient methodsof HMM training and testing.
The general task of sequence classification is to assign a label to every element of theobserved sequence. The HMM, given the sequence of elements, computes a probability distri-bution over all possible labels, and consequently finds the most probable label sequence. Themodel has the following components:
• O = o1, o2, . . . , oN — an observation sequence (discrete or continuous valued);
• S = s1, s2, . . . , sN — an underlying sequence of states;
• S = s0, sN+1 — special start and end states not associated with observations;
• A = a01, a02, . . . , ann — a transition probability matrix where aij represents a probabilityof moving from state i to state j, satisfying the condition
∑Nj=1 = 1;
• B = bi(ot) — a set of observation likelihoods expressing the probability that an obser-vation ot is generated by state i.
The word “hidden” in the name of the model refers to the fact that we do not directly ob-serve the state sequence that the model passes when generating the observation sequence, butonly its probabilistic function. A first-order HMM makes two strong simplifying assumptions.First, the probability of the following state is only dependent on the directly preceding state
P (si|s1, s2, . . . , si−1) ≈ P (si|si−1) (7.17)
Second, the probability of the output observation oi depends only on the particular state sithat generated the observation.
P (oi|s1, s2, . . . , si, . . . , sn, o1, o2, . . . , oi, . . . , on) ≈ P (oi|si) (7.18)
There are three fundamental methods for HMMs. First, we need a method to computethe likelihood of an observed sequence O given an HMM and its parameteres (A,B). Thislikelihood can be efficiently computed using the Forward algorithm (or alternatively, usingits reversed version, the Backward algorithm) which is based on dynamic programming. Acombination of the two algorithms, the Forward-Backward algorithm, can be used to estimateprobabilities of the hidden state values given the output sequence.
Second, we need a method to find the best hidden state sequence S given an observationsequence O, and an HMM and its parameters (A,B). The best state sequence is usuallydecoded using the Viterbi algorithm. Finally, we need a method to estimate HMM parameters(A,B) given an observation sequence O (i.e., training data). For this purpose, we can usethe Baum-Welch algorithm, which is a special case of the Expectation-Maximization (EM)algorithm and enables training of HMM parameters in an unsupervised approach. More detailson these HMM algorithms are given in [134, 136], among others.
77

Chapter 7. Statistical Models for Sentence Segmentation of Speech
7.1.3 Hidden Event Language Model
For modeling of textual information within the HMM-based segmentation approach, the Hid-den Event Language Model (HELM) [137] has been proposed. In most tasks, the role of thelanguage model is to predict the next word given the word history. In contrast, the goal oflanguage modeling in the sentence segmentation task is to estimate the probability that a sen-tence boundary occurs in an observed word context. Because the sentence boundaries are notexplicitly present in the speech signal, they are called “hidden events”. LetW denote the givenword sequence w1, w2, ..., wi, ..., wn and E the sequence of interword events e1, e2, ..., ei, ..., en.Then, the HELM describes the joint probability of words and hidden events P (W,E) in anHMM. In this case, the HMM hidden variable is the type of the event (including “no-event”).The states of the model correspond to word/event pairs, the observations are the words (withthe possibility of adding another observations such as prosodic feature vectors as discussedbelow). Note that, in contrast to HMM taggers, words appear in both the states and theobservations.
Because we typically have training data annotated with event labels, the HMM model canbe trained using a supervised approach; using Baum-Welch algorithm is not necessary here.For training, words and event labels are merged into a single data stream. Then, standardN -gram techniques are used to estimate HMM transition probabilities. In other words, eventlabels are treated in the same way as words during training. The absence of any hidden eventin a interword boundary may be marked either explicitly (by a special label) or implicitly(by the absence of any event label). The latter approach seems to be more convenient sinceexplicit “no-event” labels shorten the considered word context. As opposed to the typical wayof N -gram model estimation, we do not split the training data into sentences before usingthem in training. Such splitting would evidently hurt the sentence boundary prediction abilitysince the model would not be aware of typical word sequences occurring across the sentenceboundaries.
The most probable event sequence is identified with respect to individual word boundaryclassifications, rather than by finding the highest probability sequence of events [88]. Thus,we use
ei = argmaxei
P (ei|W ) (7.19)
To obtain hidden event posteriors, standard HMM algorithms may be employed. The forward-backward algorithm is typically used for decoding, the alternative is to use the Viterbi algo-rithm. Note that the forward-backward algorithm is more accurate here since we are looking forthe most likely event at each interword location, rather than finding the most probable eventsequence. An implementation of the HELM is available as part of the SRILM toolkit [138].
7.1.4 Prosodic Model Based on Decision Trees with Ensemble Bagging
The aim of the prosodic model in the sentence unit segmentation task is to use prosodicfeatures to provide sentence boundary probabilities for each interword boundary. The prosodicposteriors P (E|X) may either immediately be used to make final decisions about the sentenceboundaries, or, more typically, may later be combined with posteriors from a language model.To obtain the prosodic posteriors, CART-style decision trees [139] are employed.
In general, we can employ any statistical classifier, such as neural network or Gaussianmixture model, but decision trees offer several advantages. Not only that they yield goodresults, but also can handle both continuous and categorical features, as well as features withundefined values. The undefined feature values frequently occur at the edges of acousticsegments since many prosodic features refer to preceding or following words. An additional
78
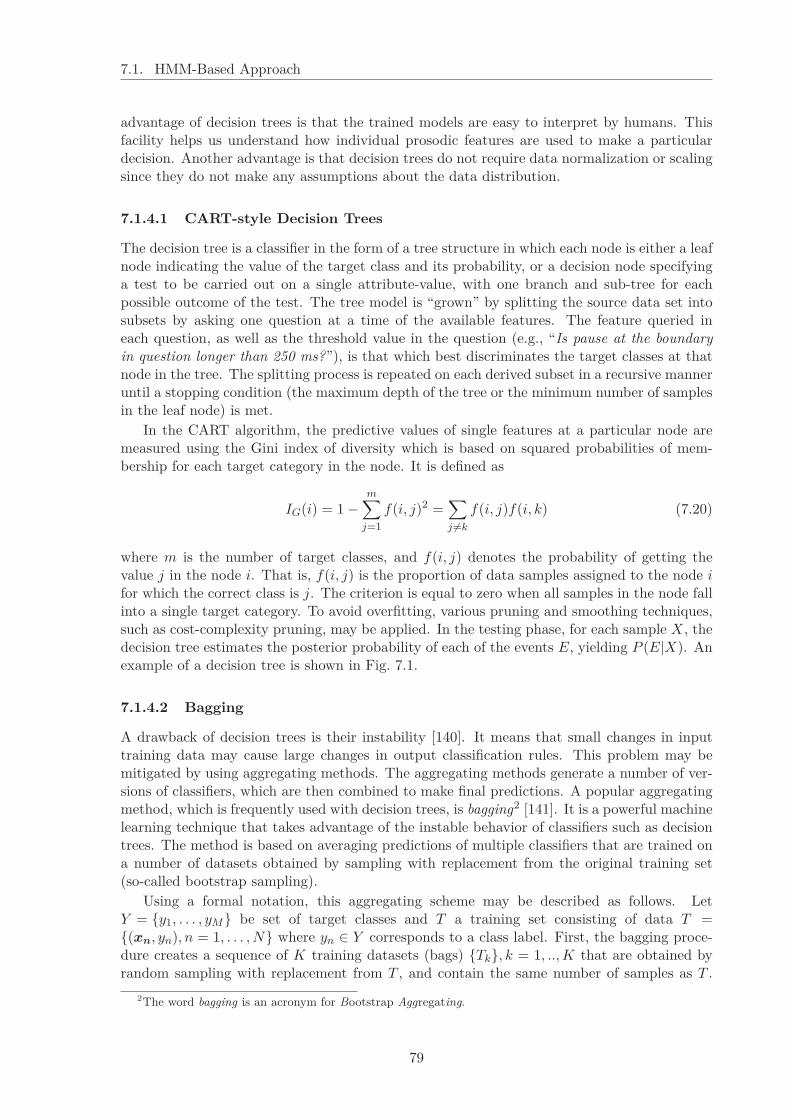
7.1. HMM-Based Approach
advantage of decision trees is that the trained models are easy to interpret by humans. Thisfacility helps us understand how individual prosodic features are used to make a particulardecision. Another advantage is that decision trees do not require data normalization or scalingsince they do not make any assumptions about the data distribution.
7.1.4.1 CART-style Decision Trees
The decision tree is a classifier in the form of a tree structure in which each node is either a leafnode indicating the value of the target class and its probability, or a decision node specifyinga test to be carried out on a single attribute-value, with one branch and sub-tree for eachpossible outcome of the test. The tree model is “grown” by splitting the source data set intosubsets by asking one question at a time of the available features. The feature queried ineach question, as well as the threshold value in the question (e.g., “Is pause at the boundaryin question longer than 250 ms?”), is that which best discriminates the target classes at thatnode in the tree. The splitting process is repeated on each derived subset in a recursive manneruntil a stopping condition (the maximum depth of the tree or the minimum number of samplesin the leaf node) is met.
In the CART algorithm, the predictive values of single features at a particular node aremeasured using the Gini index of diversity which is based on squared probabilities of mem-bership for each target category in the node. It is defined as
IG(i) = 1−m∑
j=1
f(i, j)2 =∑
j 6=k
f(i, j)f(i, k) (7.20)
where m is the number of target classes, and f(i, j) denotes the probability of getting thevalue j in the node i. That is, f(i, j) is the proportion of data samples assigned to the node ifor which the correct class is j. The criterion is equal to zero when all samples in the node fallinto a single target category. To avoid overfitting, various pruning and smoothing techniques,such as cost-complexity pruning, may be applied. In the testing phase, for each sample X, thedecision tree estimates the posterior probability of each of the events E, yielding P (E|X). Anexample of a decision tree is shown in Fig. 7.1.
7.1.4.2 Bagging
A drawback of decision trees is their instability [140]. It means that small changes in inputtraining data may cause large changes in output classification rules. This problem may bemitigated by using aggregating methods. The aggregating methods generate a number of ver-sions of classifiers, which are then combined to make final predictions. A popular aggregatingmethod, which is frequently used with decision trees, is bagging2 [141]. It is a powerful machinelearning technique that takes advantage of the instable behavior of classifiers such as decisiontrees. The method is based on averaging predictions of multiple classifiers that are trained ona number of datasets obtained by sampling with replacement from the original training set(so-called bootstrap sampling).
Using a formal notation, this aggregating scheme may be described as follows. LetY = {y1, . . . , yM} be set of target classes and T a training set consisting of data T ={(xn, yn), n = 1, . . . , N} where yn ∈ Y corresponds to a class label. First, the bagging proce-dure creates a sequence of K training datasets (bags) {Tk}, k = 1, ..,K that are obtained byrandom sampling with replacement from T , and contain the same number of samples as T .
2The word bagging is an acronym for Bootstrap Aggregating.
79

Chapter 7. Statistical Models for Sentence Segmentation of Speech
pause.after < 4.5:
| word.dur < 0.265:
| | p.pause.after < 124:
| | | word.dur < 0.215: 0.909 0.09104 N
| | | word.dur >= 0.215: 0.7797 0.2203 N (non_leaf)
| | p.pause.after >= 124:
| | | vowel.75_dur < 0.055: 0.7442 0.2558 N (non_leaf)
| | | vowel.75_dur >= 0.055: 0.4762 0.5238 S (non_leaf)
| word.dur >= 0.265:
| | f.word.dur.norm < 0.625:
| | | f.f0.slope.first < -0.035: 0.5686 0.4314 N (non_leaf)
| | | f.f0.slope.first >= -0.035: 0.4028 0.5972 S (non_leaf)
| | f.word.dur.norm >= 0.625:
| | | f0.ratio.last_min__baseline < 1.275: 0.5514 0.4486 N (non_leaf)
| | | f0.ratio.last_min__baseline >= 1.275: 0.692 0.308 N (non_leaf)
pause.after >= 4.5:
| pause.after < 70.5:
| | pause.after < 18.5:
| | | word.dur < 0.255: 0.5749 0.4251 N (non_leaf)
| | | word.dur >= 0.255: 0.369 0.631 S (non_leaf)
| | pause.after >= 18.5:
| | | pause.after < 36.5: 0.3235 0.6765 S (non_leaf)
| | | pause.after >= 36.5: 0.1928 0.8072 S
| pause.after >= 70.5: 0.03217 0.9678 S
Figure 7.1: Example of a CART-style decision tree for sentence segmentation (only top 4 levels listed)
Then, let ϕ(x, T ) be a procedure that builds a decision tree from data T and outputs posteriorprobabilities of target classes. Then, the final “bagged” posteriors are computed as an averageof ϕ(x, Tk) over k
ϕA(x, T ) =1K
K∑
k=1
ϕ(x, Tk) (7.21)
For a largeN , the bags Tk are expected to have 63.2% of the examples of T , while the remainingsamples are expexted to be duplicates.
Besides addressing the instability problem, bagging also decreases classifier variance andmakes the resulting predictor more robust to noise in training data. In addition, since trainingof a individual decision tree is independent of each other tree training, it can be efficientlyimplemented using parallel machines to decrease the overall training time.
7.1.4.3 Ensemble Bagging
When training a sentence boundary classifier, we have to deal with the problem of imbalanceddata. Sentence boundaries occur much less frequently than “non-boundaries”; their proportionis ranging approximately from 7 to 20 %, depending on the particular domain and language.The skewed distribution of training data may cause decision trees to miss out on inherentlyvaluable features that are dwarfed by data priors. One solution to this problem is to trainclassifiers on data randomly downsampled to equal class priors [49]. During testing on (theimbalanced) test data, the resulting posteriors are adjusted to take into account the originalclass priors. Note that this adjustment is only necessary when using the prosody model alonebecause the “downsampled” posteriors can be used directly when combined with the HELM,as described below in Section 7.1.5.
The problem of the downsampling approach is that it does not utilize all available data fromthe majority class. However, it is possible to perform the downsampling in a smarter way –in combination with bagging. To take advantage of all available data, we can apply ensemblesampling instead of simple downsampling. Ensemble sampling is performed by randomly
80

7.1. HMM-Based Approach
splitting the majority class into int(R) non-overlapping subsets, where R is the ratio betweenthe number of samples in the majority and minority classes. Each subset is joined with allminority class samples to form int(R) balanced sets. Then, we apply bagging on each of thesenewly formed balanced sets. This combination of bagging and ensemble sampling makes up amethod called ensemble bagging.
It was shown that this technique is very powerful in addressing the imbalanced datasetproblem in the sentence segmentation task [142]. Hence, ensemble bagging was employed inall our experiments with decision trees. I used 25 bags per ensemble which was found to bea reasonable trade-off between the training time and performance. The number of ensemblesvaries according to ratios between the event priors in individual tasks. In the datasets usedin this work, this number ranges from 5 to 13. For my experiments with CARTs, I used thetree growing algorithm as implemented in the IND package [143] along with a set of my ownwrapper scripts performing higher-level machine learning algorithms.
7.1.5 Combination of Language and Prosodic Model
Shriberg and Stolcke proposed to combine prosodic and lexical features in the HMM frameworkunder assumption of conditional independence of word identities and prosodic features [49].The integrated HMM then models the joint probability distribution P (W,X,E), where Wdenotes observed words, X observed prosodic features, and E hidden events. During classifi-cation, we try to find the event sequence E with the maximal posterior probability given Wand X
E = argmaxE
P (E|W,X) (7.22)
For P (E|W,X), it holds
P (E|W,X) =P (X|W,E)P (E|W )
P (X|W )(7.23)
If we make a simplifying assumption that prosodic features only depend on events E, andnot on word identities W , we may substitute P (X|W,E) by P (X|E). It is necessary tonote that this assumption is not always fully true because of several reasons. First, theprosodic features are partly influenced by particular phonetic content of individual words. Thisproblem can be mitigated by proper feature normalization, however, can hardly be completelyeliminated. Second, there also exists some indirect, and difficult to capture, relation betweenprosody and meaning [68]. Moreover, strictly speaking, even after applying the assumption ofindependence on word identities, real prosodic features are still dependent on word alignmentsince some prosodic features depend on phone or word boundary information for extractionor normalization. However, despite these facts, the simplifying assumption of independence isconsidered to be acceptable. Equation (7.23) may thus be rewritten as
P (E|W,X) ≈ P (X|E)P (E|W )P (X|W )
=P (E|X)P (E|W )
P (E)· P (X)P (X|W )
(7.24)
Because the fraction P (X)P (X|W ) does not depend on E, we may search for E using the following
proportion
P (E|W,X) ∝ P (E|X)P (E|W )P (E)
(7.25)
81

Chapter 7. Statistical Models for Sentence Segmentation of Speech
Furthermore, if the prosodic classifier was trained on data downsampled to equal priors P (E)(cf. Section 7.1.4), we can use
P (E|W,X) ∝ P (E|X)P (E|W ) (7.26)
Assuming that prosodic observations are conditionally independent of each other given theevent type, P (E|X) can be computed as
P (E|X) =∏
i
P (ei|xi) (7.27)
As a result, E can be found by treating prosodic features as state emissions with theprobability P (xi|ei) incorporated into the HELM. Thus, we obtain the following formula for E
E = argmaxE
P (E|W,X) = argmaxE
P (W,E)
(∏
i
P (ei|xi)P (ei)
)λ
(7.28)
Note that for searching for the maximum, P (W,E) and P (E|W ) are equivalent since P (W )is constant. Moreover, P (ei) in the denominator may be omitted if the prosodic model wastrained on data with equal priors (as proposed in Section 7.1.4.3). λ is an exponential scalingfactor estimated using held-out data, which allows us to weight relative contributions fromthe two models. The use of the scaling factor is advisable since we combine scores from twoprobabilistic models of a different type.
7.2 Maximum Entropy Approach
As described above, the HMM-based model is generative. Its supervised training method max-imizes the joint word/event pair sequence likelihood P (W,E) on the training text; prosodiclikelihoods are obtained from an independent classifier and integrated into the model duringtesting. Thus, the HMM-based model training algorithm does not guarantee that the correctevent posteriors needed for classification are maximized. There is a mismatch between thetraining criterion and the use of the model for testing. On the contrary, Maximum Entropy(MaxEnt) is a discriminative model, which is trained to directly maximize the posterior bound-ary label probabilities. On the other hand, a drawback of MaxEnt is that it only makes localdecisions, whereas HMM classifies the entire input sequence.
MaxEnt belongs to the exponential (or log-linear) family of classifiers, i.e. the featuresextracted from the input are combined linearly and then used as an exponent. The Max-Ent framework enables a natural combination of features relating to different data streamswithin a single model. MaxEnt models are very popular in many NLP tasks, such as machinetranslation, POS tagging, chunking, or word sense disambiguation.
7.2.1 General Method
Generally speaking, the classification problem is defined as a prediction of class y ∈ Y in acontext x ∈ X . The classifier k : X → Y is implemented using a conditional probabilitydistribution P (y|x). Furthermore, we define a context predicate3 as a logic function
cp : X → {0,1} (7.29)
3Context predicates are often called “features” within the MaxEnt framework.
82

7.2. Maximum Entropy Approach
returning 1 if “useful information” occurs in the context x ∈ X . The set of context predicatescp1, . . . , cpm has to be defined by the system designer in advance. Furthermore, a set of binaryindicator functions is defined
f : X × Y → {0,1} (7.30)
for which it holds
fcp,x′(x, y) =
{
1 if x = x′ ∧ cp(y) = 10 otherwise
(7.31)
In the context of the sentence segmentation task, one such feature function might be
fcp,x′(x, y) =
{
1 if wordi = “today” ∧ wordi+1 = “I ” ∧ yi = SU0 otherwise
(7.32)
where SU denotes a sentence unit boundary.The idea of MaxEnt is that the model should follow empirical constraints we impose on it,
but beyond these constraints, it should make as few assumptions as possible. The empiricalconstraints are given by the training data, i.e.
E(fi(x, y)) = E′(fi(x, y)) (7.33)
where E(·) denotes expectation and E′(·) its empirical estimate. The model finds a probabilitydistribution that satisfies these constraints and has the maximum conditional entropy
H(P ) = −∑
x
P (x)P (y|x) logP (y|x) (7.34)
Berger et al. [144] showed that the solution to this constrained optimization has an exponentialform corresponding to a multinomial logistic regression model
P (y|x) =1Z(x)
exp
(∑
i
αifi(x, y)
)
(7.35)
where
Z(x) =∑
y
exp
(∑
i
αifi(x, y)
)
(7.36)
is the normalization factor ensuring that∑
y p(y|x) = 1.The MaxEnt model is trained by finding parameters α∗i that maximize the likelihood
product over the training data
α∗i = argmaxαi
N∏
j=1
P (yj |xj) (7.37)
where N denotes the number of samples in the labeled training set. A number of variousnumerical optimization algorithms has already been employed to solve this weight estimationproblem. In all my experiments with the MaxEnt models, I employ the Conjugate Gradi-ent Ascent method as implemented in the MegaM model optimization toolkit written by HalDaumé III [145]. This method is very efficient for binary classification tasks, as is automaticsentence segmentation. Note that this optimization technique cannot be used for multiclassproblems. The reason is that for multiclass classification, explicit construction and inver-sion of the Hessian matrix, which is an inherent part of the optimization algorithm, becomes
83

Chapter 7. Statistical Models for Sentence Segmentation of Speech
impossible. Thus, for multiclass tasks such as automatic punctuation, one has to use an alter-native method. For instance, L-BFGS (Limited Memory Broyden-Fletcher-Goldfarb-Shanno)method [146] uses an iteratively built approximation to the true Hessian.
An important feature of MaxEnt models is that they are prone to overfitting. To overcomethis drawback, we typically use smoothing with Gaussian priors that penalize large weights.This technique aims to force weights to have Gaussian distribution with the mean µ = 0 andthe variance σ2. The value of σ2 is typically empirically optimized on development data. Theapplication of the smoothing method changes the optimized likelihood function from (7.37) to
α∗i = argmaxαi
N∏
j=1
P (yj |xj)∏
αi
1√
2πσ2i
exp
(
− α2i
2σ2i
)
(7.38)
In log space, where the optimization is usually performed, the objective function becomes
α∗i = argmaxαi
N∑
j=1
P (yj |xj)−∑
αi
α2i
2σ2i
(7.39)
More detail on general MaxEnt models may be found in [147, 148, 136], among others.
7.2.2 Textual Features for MaxEnt
To encode textual features for use in the MaxEnt model, it is necessary define some featuretemplates. The textual features I used correspond to N -grams available to the HELM plusan additional binary feature indicating whether the word before the boundary of interest isidentical with the following word. This additional feature aims to capture word repetitions.
Given the word sequence wi−3 . . . wi . . . wi+3 where wi refers to the word before the bound-ary in question, the N -gram templates were the following:
• Unigrams – U0: wi, U1: wi+1
• Bigrams – B0: wi−1wi, B1: wiwi+1
• Trigrams – T0: wi−2wi−1wi, T1: wi−1wiwi+1, T2: wiwi+1wi+2
• Fourgrams –F0: wi−3wi−2wi−1wi, F1: wi−2wi−1wiwi+1, F2: wi−1wiwi+1wi+2,F3: wiwi+1wi+2wi+3
In other words, all N -grams containing the word right before the current boundary (wi) areincluded. The only exception is the unigram capturing the word right after the boundary(wi+1). If some words from the analyzed window were undefined because of coinciding withtext boundaries, they were replaced by a special symbol for the feature extraction purposes.Note that although I also list fourgram features here, these have not been found to be usefulin any of the tasks described in this thesis. Given the amount of data available for training inthe individual tasks, they have never yielded improvement over the trigram model.
As already mentioned above, unlike the HELM, the MaxEnt model has the ability to handlemutually dependent or overlapping textual features. A single MaxEnt model does not have toonly rely on words, but we can also add parallel features relating to other textual knowledgesources. For instance, we can run the training text through a part-of-speech tagger, generateparallel features based on those tags, and pass them to the learning algorithm together withthe word-based features. Note that particular textual features used in individual classificationtasks are described in special sections of the respective chapters, for example in Section 8.5.1in the following chapter.
84

7.2. Maximum Entropy Approach
7.2.3 Prosodic Features for MaxEnt
A problem associated with using MaxEnt models for sentence segmentation is that it is notstraightforward how to efficiently use continuous (prosodic) features. Although the MaxEntfeatures fi may generally be real-valued, continuous are typically not used directly since combi-nation of real- and binary-valued features in a single MaxEnt model may cause many problems.To this end, continuous features are usually converted into binary features via thresholding.
In the approach used here, prosodic features are not embedded into the MaxEnt modeldirectly. The MaxEnt model is powerful in combining different sources of textual knowledge,but not expected to achieve superior performance when dealing with many (originally) real-valued features coming from a single knowledge source. This hypothesis was supported byexperiments performed in [149]. Thus, it looks more natural to estimate prosodic posteriorsusing an independent classifier (in our case the bagged decision trees) and then to encode theposteriors via thresholding, as proposed in [88].
Since the presence of each feature in a MaxEnt model raises or lowers the final probabilityby a constant factor, it is reasonable to encode the prosodic posteriors in a cumulative way.This approach is more robust than using interval-based bins since small changes in prosodicscores may influence at most one feature. I have experimented with various gaps betweenadjacent thresholds and found that 0.1 is a convenient value. Thus, I got the following sequenceof binary features – p > 0.1, p > 0.2, p > 0.3, . . . , p > 0.9.
The prosodic posteriors for training samples were estimated using a cross-validationmethod. My preliminary experiments showed that using decision trees trained on the samedata for which we generate the posteriors led to biased estimates and consequently hurt Max-Ent performance. Hence, the training set was divided into 5 non-overlapping subsets andCARTs for each of the subsets were trained only using other 4 subsets. In testing, modelstrained on all training data are used to generate the posteriors.
Note that some binary non-prosodic features that because of the HMM architecture had tobe grouped with prosodic features in the HMM approach may naturally be handled separatelywithin the MaxEnt framework. The speaker change feature is a good example of such features.
For illustration, the following example shows three data samples corresponding to threeconsecutive words from the training data. The MaxEnt features shown in the example captureword N -grams and thresholded prosodic posteriors. The first value in each sample correspondsto a class label (S – sentence boundary, N – no boundary). The following space-separatedcharacter strings correspond to binary features written in the so-called Bernoulli format, i.e. allpresent features are assumed to have value one and any non-present feature is assumed to havevalue zero.
N U0_anything U1_like B0_or_anything B1_anything_like T0_syllables_or_anythingT1_or_anything_like T2_anything_like_that
N U0_like U1_that B0_anything_like B1_like_that T0_or_anything_likeT1_anything_like_that T2_like_that_but pros_gt_0_1
S U0_that U1_but B0_like_that B1_that_but T0_anything_like_thatT1_like_that_but T2_that_but_but pros_gt_0_1 pros_gt_0_2 pros_gt_0_3pros_gt_0_4 pros_gt_0_5 pros_gt_0_6 pros_gt_0_7 pros_gt_0_8
85

Chapter 7. Statistical Models for Sentence Segmentation of Speech
7.3 Boosting-Based Approach (BoosTexter)
Besides their positive properties, the two above presented approaches also have some disad-vantages. In the HMM approach, the combination of prosodic and lexical models makes strongindependence assumptions, which are not fully met in actual language data. Moreover, theHMM training method maximizes the joint probability of data and hidden events, but a crite-rion more closely related to classification error would be the posterior probability of the correcthidden variable assignment given the observations. The drawbacks of HMM may partly beeliminated by using the MaxEnt model, however, the MaxEnt model itself also shows somesetbacks. As described in the previous section, lexical and prosodic features are not combineddirectly but via thresholding of prosodic posteriors generated by an independent prosodic clas-sifier. Thus, I have explored yet another approach in which prosodic and textual features areintegrated into a single model based on boosting.
7.3.1 General Method
Similarly to bagging, the principle of boosting is to combine many weak learning algorithmsto produce an accurate classifier. However, whereas in bagging, weak classifiers are trainedindependently of each other, in boosting, each weak classifier is built based on the outputsof previous classifiers, focusing on the samples that were formerly classified incorrectly. Thealgorithm generates weak classification rules by calling the weak learners repeatedly in seriesof rounds. The method maintains a set of importance weights over training data samples andlabels. The weights are used by the weak learning algorithm to find a weak hypothesis with“moderately low” error by forcing the weak learner to focus on “more difficult” samples fromthe training data. The general boosting method can basically be combined with any classifier.
In the sentence segmentation approach described here, an algorithm called BoosTexter [150]was employed.4 This machine learning technique was initially designed for the task of textcategorization. It combines weak classifiers having a basic form of one-level decision trees(stumps) using confidence-rated predictions. The test at the root of each tree can check forthe presence or absence of an N -gram, or for a value of a continuous feature. Hence, theapproach allows a straightforward combination of lexical and prosodic features in a singlestatistical model. Moreover, another positive property of BoosTexter is that it is very robustto overtraining. In parallel with [92], the BoosTexter method was newly applied to the sentencesegmentation task as part of this work (as published in [151]).
The particular boosting method implemented in BoosTexter is based on a boosting algo-rithm called AdaBoost.MH. Using the same notation as in Section 7.1.4.2, its basic principlemay be described as follows [150, 152]. The learning algorithm assigns M weights (i.e. oneweight for one of the target classes, in the sentence segmentation taskM = 2) to each instanceof training data (xn, yn). Let this distribution over training samples and labels be called Diand the set of labels Ln = {ln1, . . . , lnM}. In the first round, the distribution is uniform.On each iterative step i, the weak learner uses Di to generate a hypothesis hi,n(xn, ln). Thesign of hi,n(xn, ln) indicates whether the label ln is assigned to xn or not, and the magnitude|hi,n(xn, ln)| is the confidence of the prediction. The distribution Di is updated to increasethe weight of misclassified sample-label pairs
Di+1(n, l) =Di(n, l) exp (−αiCn(l)hi,n(xn, l))
Zi(7.40)
4An open source reimplementation of the original BoosTexter algorithm called icsiboost is available fromhttp://code.google.com/p/icsiboost/.
86

7.3. Boosting-Based Approach (BoosTexter)
where
Zi =N∑
n=1
∑
l∈Y
Di(n, l) exp(−αiCn(l)hi,n(xn, l)) (7.41)
is the normalization factor, Cn(l) is a function
Cn(l) =
{
1 if l = yn−1 if l 6= yn
(7.42)
indicating whether l is a correct label for xn, and αi is the weight of a weak classifier. Ingeneral, αi ∈ R. For binary problems, the original AdaBoost implementation use
αi =12
log(
1− eiei
)
(7.43)
where ei is the weighted error of classifier hi. However, the AdaBoost.MH with real predictionsemployed in this thesis uses
αi = 1 (7.44)
Finally, the resulting hypothesis is output as
f(xn, ln) =I∑
i=1
αihi,n(xn, ln) (7.45)
where I denotes the total number of training iterations. The resulting BoosTexter scores maybe converted into posterior probabilities using a probability calibration method. I employFriedman’s logistic correction [153]
p(yn|xn) =1
1 + exp (−2 · f(xn, ln))(7.46)
which showed good results when used with boosted stumps. In the particular BoosTexterimplementation, where the output scores are divided by sum
∑Ii=1 αi, the equation (7.46)
becomes
p(yn|xn) =1
1 + exp (−2I · fBT (xn, ln))(7.47)
7.3.2 Prosodic and Textual Features for BoosTexter
For training the classifier, I use exactly the same set of prosodic features as for prosodicclassification by decision trees. Also the form of all features was the same, i.e. no featurescaling or any other preprocessing operation was necessary. Similarly to CARTs, BoosTexteris also able to handle features that may take undefined values.
On the other hand, textual features for BoosTexter were extracted in the same way as forthe MaxEnt approach (cf. Section 7.2.2). Thus, all N -grams containing the word before theboundary of interest, plus the unigram right after the boundary, and a binary flag indicatingwhether the two words across the boundary are identical or not, were extracted. Similarly toMaxEnt, BoosTexter may handle dependent and overlapping features so that textual featuresused in a single learning procedure do not have to rely only on a single data stream but parallelknowledge sources may naturally be combined.
87

Chapter 7. Statistical Models for Sentence Segmentation of Speech
7.4 Chapter Summary
In this chapter, I have described three modeling approaches to sentence segmentation of speech– HMM, MaxEnt, and BoosTexter. The models differ in the ways they combine textual andprosodic cues. The HMM-based approach uses two independent models that are combined onthe score level during testing. The MaxEnt-based approach combines binary textual featureswith thresholded prosodic posteriors obtained from an independent prosodic classifier. TheBoosTexter approach builds one integral model that combines the two information sourceson the feature level during training. In addition to the used machine learning techniques, Ihave also described how individual approaches encode lexical and prosodic features. The threemodeling approaches presented herein are evaluated in experiments reported in the followingchapters.
88

Chapter 8
Dialog Act Segmentation ofMultiparty Meetings in English
Never interrupt me when I’m trying to interrupt you.Winston Churchill
Well-timed silence hath more eloquence than speech.Martin Fraquhar Tupper
An area of growing interest in the spoken language technology community is the automaticprocessing of multiparty meetings. Important tasks in this domain include automatic meet-ing browsing, summarization, information extraction and retrieval, and machine transla-tion [154, 155]. As in other domains, the downstream applications require input segmentedinto meaningful units. The goal of the work described in this chapter is to develop a segmen-tation system for the meeting domain, investigate usefulness of various textual and prosodicfeatures, and compare performance of the three modeling approaches described in the pre-ceding chapter. Unlike previous work, which has generally examined the use of prosody forDA segmentation of meetings using only pause information, I also explore the use of prosodicfeatures beyond pauses, including duration, pitch, and energy features. The ICSI meetingcorpus is used for all experiments herein.
This chapter is organized as follows. Section 8.1 describes the used corpus, Section 8.2 sur-veys related work in the meeting domain, Section 8.3 defines the particular task, and Section 8.4presents the experimental setup. Sections 8.5, 8.6, and 8.7 report results of the experimentsbased on using only textual information, only prosodic information, and a combination of bothinformation sources, respectively. Section 8.8 presents a system combining all three modelingapproaches, and Section 8.9 summarizes all experiments and draws conclusions.
8.1 Speech Data
8.1.1 Particularities of Meeting Speech
Natural meetings represent very difficult data for automatic processing. They typically containregions of high speaker overlaps, emotional speech, abandoned or interrupted utterances, andcomplicated speaker interactions. These frequent phenomena pose a number of challenges forresearchers in the speech processing community. The following example illustrates overlappingspeech as occurs in meetings.
89

Chapter 8. Dialog Act Segmentation of Multiparty Meetings in English
Channel 1 : Well now we should discuss the, uh Yeah, the plan
Channel 2 : the next year plan
Channel 3 : Oh... I see
. . . : . . . . . . . . .
8.1.2 ICSI Meeting Corpus
In this work, I use the ICSI Meeting Corpus [156] which is publicly available from LDC. Itis a collection of data from 75 natural meetings that occurred at the International ComputerScience Institute (ICSI) in Berkeley, CA, USA. In total, it yields approximately 72 hoursof multichannel conversational speech data sampled at 16 kHz with 16-bit resolution. Allmeetings were recorded using both head-worn wireless microphones and several desktop mi-crophones. In all experiments described in this chapter, I only used data from the close-talkingmicrophones.
Most of the recorded face-to-face meetings were regularly scheduled weekly group appoint-ments. Meetings of the following types were recorded:
• Even Deeper Understanding (Bed) – discussing NLP and neural theories of language (15meetings)
• Meeting Recorder (Bmr) – on the ICSI Meeting Corpus (29)
• Robustness (Bro) – discussing robust ASR methods (23)
• Network Services & Applications (Bns) – internet architectures and standards (3)
• One time only meetings (varies) – miscellaneous other meetings (5)
In the whole corpus, there appear 53 unique speakers – 13 females and 40 males, 28 nativespeakers of English and 25 nonnative speakers. Note that the number of nonnative speakersof English is quite high, however, many of them are fluent when speaking in English. Averagenumber of participants per meeting was about 6. A unique five-character tag was assigned toeach speaker in the corpus. First letter stands for sex (f for female or m for male), the secondletter is either e for native speakers or n for nonnative speakers. The first two charactersare followed by a unique three digit number. For instance, one of the native male speakers isme013.
Each of the near-field channels was manually transcribed on the word level. In addition tothe full words, transcripts also contain other information such as filled pauses, backchannels,contextual comments (e.g. while whispering) and non-lexical events such as laughter, breath,lip smack etc. Overall, the corpus transcripts yield 773k words.
8.1.3 Dialog Act Markup
In addition to the word transcripts, the ICSI corpus was hand-annotated for Dialog Acts(DAs) [157, 158]. This companion set of DA-level annotations is called the Meeting RecorderDialog Act (MRDA) corpus. The labeling included marking of DA segment boundaries, mark-ing of DA types, and marking of correspondence between DAs. The MRDA annotation schemedefines five main dialog act types as well as a number of their subtypes. The main DA classesare the following:
90

8.2. Related Work on Segmentation of Meetings
• statement (59.0% of DAs in the corpus) – such as “I agree.”.
• question (6.4%)– such as “Do you agree?”.
• backchannel (13.3%) – is a short positive comment, such as “uh-huh” or “yeah”, to theother speaker to encourage further talk or to confirm that one is listening.
• floor-grabber/holder (7.2%) – indicates that the talker wants to start (“okay”, “yes, but”)or keep talking (“so”, “uh”).
• disruption (14.1%) – is an incomplete statement or question such as “but there’s a –”.
DA segmentation rules within the MRDA guidelines were designed to separate speechregions having different discourse functions. The annotators should not only pay attention totextual features but also to pauses and intonational grouping. However, note that DA unitsas defined in MRDA differ from the SUs used in the MDE corpora described in Chapter 5.The MRDA segmentation rules instruct annotators to split utterances on a clausal level tomaximize the amount of information derived from DAs. This means that sometimes evengrammatically subordinate clauses may form a complete DA, which is in contrast with theSU definition. Typical examples of such grammatically subordinate DAs are clauses beginningwith conjunctions as because or although. An illustrative example of a DA-segmented utterancefollows (DA boundaries are marked by “/.” tags).
well so I wouldn’t be too concerned about it with respect to that /.
although we should clear with American down course /.
but these results are based on data which haven’t had be uh haven’t had the
chance to be reviewed by the subject /.
so I don’t know how that stands /.
Besides standard DA boundaries, a pipe bar (|) was used to distinguish utterances thatare prosodically one unit but contain multiple DAs. An example of such case may be theutterance “yeah | that’s right” when pronounced as one prosodic unit. This setting enablesresearchers to decide whether to split or not split at the pipes in dependence on the task oftheir research.
8.2 Related Work on Segmentation of Meetings
The first sentence segmentation study in the meeting domain was conducted by Baron etal. [159]. The authors focused on disfluency detection and automatic punctuation in meetingsusing the standard HMM approach. Since they used an older version of the ICSI meetingcorpus and a different definition of sentence-like unit boundaries, the results cannot be di-rectly compared with more recent work on the same data. For a three-way classification task(sentence boundary/IP/other), their experimental results showed that in the meeting domain,similarly to other spontaneous speech domains, a combination of lexical and prosodic modelsoutperforms a lexical model alone.
The study by Ang et al. [160] mainly aimed to provide baseline performance rates for DAsegmentation and classification in the meeting domain. For DA segmentation, the authorscombined lexical and pause features in the HMM framework. As expected, it was shown thatprosodic information (they only used pause duration) is less degraded by ASR errors. For DAclassification, a MaxEnt approach was employed.
91

Chapter 8. Dialog Act Segmentation of Multiparty Meetings in English
Zimmermann et al. [161] got inspired by [80] and used an A*-based algorithm to performDA segmentation and classification simultaneously. Their method was based solely on lexicalfeatures. The heuristic search used a probabilistic framework based on DA-specific N -grammodels. During A* search, an optimal path through the input word sequence was found. Thenodes of the search graph corresponded to inter-word boundaries, whereas the edges carriedlabels indicating the DA type and spanned one or more consecutive words. Even though thesystem did not use pause information, it outperformed [160] in classification of backchannelsand questions.
In a more recent paper [162], the same authors employed a combination of a word-basedhidden event HMM and a MaxEnt model jointly modeling words and pause duration. In con-trast to previous work [49, 160] which modeled pause duration independently from surroundingwords, they modeled word boundary types based on both the pause duration and surroundingwords. The novel approach resulted in a modest error rate reduction.
Cuendet et al. [163] focused on adaptation of sentence segmentation models trained onconversational telephone speech to meeting style conversations. Their models relied on lexicaland pause features. They used the ICSI meeting corpus, but only focused on meetings of onetype (“Bed”). Several different adaptation approaches including data concatenation, logisticinterpolation, boosting adaptation, and out-of-domain confidences as an extra feature, weretested. The authors also analyzed adaptation performance in dependence on the amount ofused in-domain data. The experimental results showed that boosting adaptation and logisticinterpolation were the best performing approaches when only small adaptation data were used.For larger adaptation data sets, the logistic interpolation approach showed the best results.
8.3 Segmentation Task for Meetings
This section defines the sentence-like units into which we segment the meeting data. Althoughthe original manual transcripts of the ICSI corpus do contain punctuation, and thus sentenceboundaries, the punctuation is highly inconsistent. Transcribers were instructed to focus ontranscribing words as quickly as possible; there was not a focus on consistency or conven-tions for marking punctuation. As a result, different transcribers used different approaches topunctuation annotation.
Hence, rather than using the inconsistent first-pass punctuation, we decided to employspecial DA segmentation marks from the MRDA annotation project. In this annotation pass,labelers carefully annotated both dialog acts and their boundaries, using using a set of seg-mentation conventions for the latter (as described in Section 8.1.3). Thus, we define the targetunits as dialog acts. Consequently, the task is automatic dialog act segmentation of multipartymeetings.
Since the class of DA boundaries involves boundaries of all five MRDA types, it includesboundaries of both complete and incomplete DAs. Also note that, in line with [160], wedecided to split at the pipe bar boundaries, creating a slightly larger number of total DAsegments. Note that splitting here makes it slightly more difficult to see significant gain fromusing prosodic cues since such splits occur within prosodic units.
Formally speaking, DA segmentation can be viewed as a two-way classification problemwith “DA-boundary” and “Non-DA-boundary” as the target classes. For a given word sequencew1w2...wi...wn, the task of DA segmentation is to determine which interword boundaries cor-respond to a DA boundary.
92

8.4. Experimental Setup
8.4 Experimental Setup
For the DA segmentation experiments herein, I used 73 out of the total 75 available meetings.The remaining two meetings were excluded because of their very different character from therest of the data. The 73 meetings were split into a training set (51 meetings, 539k words),a development set (11 meetings, 110k words), and a test set (11 meetings, 102k words). Inthe experiments to follow, classification models are trained on the training set, tuned on thedevelopment set, and evaluated on the test set. The test set contains unseen speakers, as wellas speakers appearing in the training data as it is typical for the real world applications.
For all experiments, two different test conditions were considered: human-generated ref-erence transcripts (REF) and speech recognition output (ASR). Recognition results were ob-tained using the state-of-the-art SRI CTS system [164], which was trained using no acousticdata or transcripts from the analyzed meeting corpus. To represent a fully automatic system,I also used automatic speech/non-speech segmentation, although manual segmentation wasavailable as well. Word error rates for this difficult data are still quite high; the employedspeech-to-text system performed at WER = 38.2% (on the whole corpus).
To allow performance evaluation on the ASR hypotheses, it is necessary to have some“reference” DA boundaries for the ASR words. Their generation is not straightforward sincetrue words and ASR hypotheses often differ in the number of words they contain. To this end,the reference setup was aligned to the ASR hypotheses based on the minimum edit distance.DA boundaries for the ASR words were then taken from the corresponding aligned referencewords with the constraint that two aligned words could not occur further apart than a fixedtime threshold. Since the ASR hypotheses tend to miss short backchannels that are usuallyfollowed by a DA boundary, the boundaries are less frequent in the ASR hypotheses (13.9% ofwords) than in the reference transcripts (15.9%). The DA boundary alignment for an erroneousASR hypothesis is illustrated in the following example.
REF:
you could do it about you /. right /. sure /. I mean different among classes /.because it’s it has a high rate energy /. somewhere around sixty must be /.
ASR:
could what about you /. sure /. or mean different him pluses /.because it’s it doesn’t high rate angie /. there are sixteen mostly /.
I use BER (defined in Eq. (3.1) on page 18) as the main performance measure for evaluationof my experiments. In addition, I always show chance error rate which corresponds to BERachieved when all interword boundaries in test data are classified as within-DA boundaries.To ease a performance comparison across test conditions, I also report NIST error rate (3.2)and F -measure (3.5) for the best model in each section.
Differences between individual models are tested for statistical significance using the Signtest [50]. For all statistical tests in this thesis, I take p < 0.05 as a standard level of sig-nificance. However, I do not only report whether a tested difference is significant or not,but also present p-values of all significant improvements. In addition, I also explicitly presentp-values falling between 0.05 and 0.10 since differences with p-values close to 0.05 may be inter-preted as “marginally significant”. All differences with p > 0.10 are referred to as statisticallyinsignificant.
93

Chapter 8. Dialog Act Segmentation of Multiparty Meetings in English
8.5 DA Segmentation Based on Textual Information
In this section, I focus on an effective utilization of information contained in the recognizedwords. Well-tuned language models (LMs) are not only important for applications where theyare combined with a prosody model, but also for the applications in which we do not haveaccess to, or cannot exploit, prosodic information. The LM evaluation is twofold; I searchboth for a convenient representation of textual knowledge (i.e., convenient textual features)and a suitable modeling approach.
I do not only explore simple word-based models, but also utilize textual information beyondword identities, as captured by word classes and part-of-speech (POS) tags. In general, it isalso possible to use chunking (or even full-parsing) features. Chunking features may slightlyincrease performance for well-structured English speech such as broadcast news [149], but mypreliminary investigations showed that, because of poor chunking performance on meetingdata, these features rather hurt DA segmentation accuracy on meeting speech. Hence, I didnot use them in this work.
8.5.1 Textual Features
The following sections describe individual groups of employed features. Since I do not only useLMs based on a single knowledge source but also LMs based on their combinations, it shouldbe noted how the parallel features are combined. While MaxEnt and BoosTexter allow usto combine overlapping features from parallel textual knowledge sources directly, the currentimplementation of HELM is not able to build the HMM trellis based on two parallel tokensequences, just as are words and part-of-speech tags. To overcome this problem, I have usedeach LM separately and then combined the outputs via posterior probability interpolation.The interpolation weights were tuned using the development set.
8.5.1.1 Words
Word features simply capture word identities around possible sentence boundaries. Theyrepresent a baseline feature set for the experiments herein.
8.5.1.2 Automatically Induced Classes
In language modeling, we always have to deal with data sparseness. In some tasks, it ispossible to mitigate this problem by grouping words with similar properties into word classes.The grouping reduces the number of model parameters to be estimated during training. Weassume a mapping function
r : V → C (8.1)
assigning a class ci ∈ C to every word wi from the vocabulary V , i.e., ci = r(wi). In general,one word could belong to more than one class, however, such mapping would cause problemsfor decoding. Thus, I assume that every word wi only belongs to a single class ci.
Automatically induced classes (AIC) are derived in a data-driven way. Data-driven meth-ods typically perform a greedy search procedure to find the best fitting class for each wordgiven an objective function. The clustering algorithm I used [165] minimizes perplexity of theinduced class-based N -gram with respect to provided word bigram counts. The DA bound-ary token is excluded from class merging, however, it affects the clustering procedure since itoccurs in bigram histories.
Initially, each word is placed into its own class. Then, the classes are iteratively mergeduntil the desired number of clusters is reached. The resulting classes are mutually exclusive,
94

8.5. DA Segmentation Based on Textual Information
i.e., each word is only mapped into a single class. In every step of the algorithm, the overallperplexity is minimized by joining the pair of classes maximizing the mean mutual informationof adjacent classes
I(c1, c2) =∑
c1,c2∈C
P (c1, c2) logP (c1, c2)P (c1)P (c2)
(8.2)
The crucial parameter of the word clustering algorithm is the number of target classes. Theoptimal number was empirically estimated on the development data by evaluating performanceof models with a different granularity. I started with a 500-class model and then was graduallydecreasing the number of classes by 25 in each iteration. The optimal number of classes wasestimated as 100.
I have also tested a model that mixes AICs and frequent words. In this approach, thefrequent words are excluded from class merging; they form their own one-word classes. Thisapproach can be viewed as a form of back off; we back off from words to classes for rare wordsbut keep word identities for frequent words. However, I have tested various numbers of the leftout words in combination with individual class granularities, but have never achieved betterresults than for the 100 classes with no excluded words.
8.5.1.3 Parts of Speech
The AICs reflect word usage in our datasets, but do not form clusters with a clearly in-terpretable linguistic meaning. In contrast, part-of-speech (POS) tags describe grammaticalfeatures of words. POS tagging is one of the most explored tasks in NLP. In many cases,several different POS categories may correspond to a particular word form. For instance, En-glish word monitor may either be a noun (as in “The monitor is battery operated.”), or a verb(“Brokers monitor emerging markets everyday.”). The goal of POS tagging is to automaticallydisambiguate such ambiguities. The task can formally be defined as follows:
φ :W → T, φ(wi) = ti; ti ∈ τ, i = 1, . . . , Nw (8.3)
where W denotes input text consisting of Nw words wi, T is a sequence of tags ti, and τ a setof all possible tags.
For the tests herein, the POS tags were obtained by using the TnT tagger [166] with aPOS model tailored for conversational English. The tagger was trained using hand-labeled datafrom the Switchboard Treebank corpus. To achieve a better match with speech recognitionoutput used in testing, punctuation and capitalization information was removed before usingthe data for tagger training [149].
Besides pure POS-based models, I also tested mixed POS models (POSmix). In contrastwith AICs, mixing of frequent words and POS of infrequent words yielded an improvement.The reason is that while the automatic clustering algorithm takes into account bigram countscontaining the sentence boundary token and thus is aware of strong sentence boundary in-dicators, POS classes are purely grammatical. By keeping the frequent words we also keepsome strong sentence indicators. Optimizing the model on our development data, I ended upwith 500 most frequent words being kept and not replaced by their POS tags. In terms ofa relative frequency, the cutoff value for not replacing the word by its POS was 1.87 · 10−4
(i.e., 101/539k).
8.5.2 Experimental Results
Table 8.1 presents experimental results for all three models (HMM, Maxent, and BoosTexter),all feature sets (words, AIC, POS, and POSmix, and training and test conditions. The models
95

Chapter 8. Dialog Act Segmentation of Multiparty Meetings in English
Table 8.1: DA segmentation error rates for LMs with various textual features [BER %].REF=Reference human transcripts, ASR=Automatic transcripts, AIC=Automatically Induced Classes,POS=pure POS-based model, POSmix=infrequent words replaced by POS tags and frequent wordskept. The best results for each model are displayed in boldface.
Model Used Features Train/Test Setup
REF/REF REF/ASR ASR/ASR
Chance — 15.92% 13.85% 13.85%
HMM Words 7.45% 9.41% 9.50%AIC 7.58% 9.70% 9.78%POS 10.62% 12.06% 11.85%POSmix 7.65% 9.57% 9.59%Words+AIC 7.11% 9.25% 9.18%Words+POSmix 7.23% 9.25% 9.31%Words+AIC+POSmix 7.02% 9.12% 9.12%
MaxEnt Words 7.50% 9.38% 9.38%AIC 7.42% 9.44% 9.37%POS 10.52% 11.79% 11.80%POSmix 7.26% 9.23% 9.25%Words+AIC 7.19% 9.25% 9.21%Words+POSmix 7.27% 9.27% 9.25%Words+AIC+POSmix 7.15% 9.24% 9.16%
BoosTexter Words 7.70% 9.52% 9.49%AIC 7.61% 9.50% 9.53%POS 10.87% 12.03% 11.13%POSmix 7.68% 9.45% 9.46%Words+AIC 7.50% 9.42% 9.40%Words+POSmix 7.66% 9.44% 9.45%Words+AIC+POSmix 7.46% 9.40% 9.40%
for segmentation of human transcripts were trained on reference words. For testing on ASRdata, I tried to use both true and recognized words for training, and compared performanceof the respective models.
8.5.2.1 Results in Reference Conditions
In reference conditions, the best models based on a single textual feature group were MaxEntfor mixed POS and AICs, and HMM for words. On the other hand, the models only using POSinformation performed poorly. A comparison of POS and POSmix shows that grammaticalproperties of words are not sufficient indicators of sentence boundaries and information pro-vided by some frequent cue words is necessary to achieve satisfactory performance. In terms ofa modeling approach comparison, it is interesting to observe that the generative HMM modelis better in dealing with word information, while the discriminative MaxEnt model better cap-tures class information (both AIC and POSmix). The BoosTexter model always performedworse than the other two models.
The results also indicate that an improvement is achieved when word information is com-
96

8.5. DA Segmentation Based on Textual Information
bined with class information. For all models, the best results are obtained when all threeinformation sources are combined. Using the Sign test, the improvements over baseline word-based models are statistically significant at the levels of p < 10−23, p < 10−18, and p < 10−5
for HMM, MaxEnt, and BoosTexter, respectively. Of the three statistical models, HMM wasthe best performing, achieving BER = 7.02%. Using other evaluation metrics, this result cor-responds to NIST = 44.09% and F = 76.88%. The difference between HMM and Boostexteris significant at p < 10−13, and the difference between HMM and MaxEnt at p < 0.02. Ofthe other two models, MaxEnt outperformed BoosTexter (BER : 7.15% vs. 7.46%). Thisdifference is significant at p < 10−9.
The interpolation weights of the combined HMM model were estimated as 0.36, 0.39, and0.25 corresponding to words, AIC, and POSmix, respectively. Thus, the largest weight isgiven to the AIC-based model. However, when interpreting the weight distribution, we musttake into account that some word-based features are also contained in the POSmix model.Hence, the word-based feature weights are distributed between the two submodels. We canalso observe that when only two types of features are employed, words plus AIC perform betterthan words plus POSmix. Once again, these results were expected since word and POSmixfeatures are partly overlapping and thus the combination of word and AIC features is morecomplementary.
8.5.2.2 Results in ASR Conditions
As in reference conditions, MaxEnt for mixed POS was the best single model in the ASR-basedtests. On the other hand, unlike reference conditions, MaxEnt was also the best model forcapturing word information. The combination of all three knowledge sources was helpful onceagain, the best performing combined model was HMM (BER = 9.12%, NIST = 65.81%, andF = 62.78%), while BoosTexter was the worst. Both HMM and MaxEnt show a significantoutperformance of the BoosTexter model (p < 10−5 and p < 10−4). In contrast, the differencebetween HMM and MaxEnt is not significant. Improvements of individual models contain-ing all available features over the baseline word-based models are significant at p < 10−10,p < 10−17, and p < 0.02 for HMM, MaxEnt, and BoosTexter, respectively.
A comparison of models trained on clean and erroneous data shows the following. Whilefor HMM and BoosTexter, the error rates were almost the same, for the MaxEnt model, I gotbetter results when training on automatic transcripts. However, even for the MaxEnt model,the difference in BER (9.16% vs. 9.24%) is only significant at p < 0.08.
The interpolation weights of the combined HMM model in ASR conditions were estimatedas 0.33, 0.35, and 0.32. As in REF conditions, AICs had the largest weight. In comparisonwith REF conditions, the POSmix submodel got a slightly larger weight, while the other twosubmodels got accordingly lower weights.
An interesting finding was that the MaxEnt approach was slightly better than HMM forall individual feature types, but slightly worse when all feature types were combined. Hence,I decided to test whether it could be caused by the model combination approach. In HMM,we interpolate three independent models, while for MaxEnt, all feature types are accessibleduring a single model learning procedure. Thus, I trained three independent MaxEnts forwords, AICs, and POSmix and interpolated them. However, I did not get better results thanfor the original MaxEnt model.
97

Chapter 8. Dialog Act Segmentation of Multiparty Meetings in English
8.6 DA Segmentation Based on Prosodic Information
The preceding section described experiments with language models, whereas in this section, Ifocus on the prosodic model. I explore the use of prosodic features including pause, duration,pitch, and energy features when lexical information is not accessible. The original databaseof prosodic features (described in Chapter 6 and listed in Appendix B) contained over 300different features. Using the approach described in Section 6.7, the huge database was reducedto a smaller set of 40 features. Note that the target number of features was not determinedbeforehand but resulted from the used feature selection method.
Besides reporting overall accuracy of prosodic models with the “rich” prosodic featureset, I also investigate whether there is gain from using the richer set of prosodic featuresin comparison with using pause information alone. The alternative pause-only feature setcontains just three features capturing pause duration after the previous, the current, andthe following word. I experiment with this feature set since there was a valid suspicion thatprosodic features beyond pause duration might not be helpful; prosodic marking of boundariesin meetings seems to be largely irregular. Since extraction of prosodic features requires a lot ofeffort, it is purposeful to test whether the additional features yield a significant improvementin meeting applications.
Only two modeling approaches are evaluated in this section. Although I investigate threemodeling approaches (HMM, MaxEnt, and BoosTexter) in this work, two of them (HMM andMaxEnt) use prosodic scores obtained from the same prosodic classifier (CART-style decisiontree with ensemble bagging). Hence, I only compare CART and BoosTexter in this section.
8.6.1 Experimental Results for Prosodic Models
Table 8.2 shows BERs achieved by particular prosody models in both reference and ASR testconditions.
8.6.1.1 Results in Reference Conditions
In reference conditions, the best result (BER = 8.06%) was achieved by the CART model usingthe rich prosodic feature set. This result corresponds to NIST = 50.60% and F = 70.60%. Ialso should point out that in reference conditions, the best prosodic model on its own performssignificantly worse that the best language model on its own (BER = 8.06% vs. BER = 7.02%).
We can see that prosody beyond pause is helpful to a great extent. The p-values of theSign test for the comparison of rich prosody vs. pause-only are 10−99 and 10−24 for CARTand BoosTexter, respectively. A comparison of CART and BoosTexter indicates that theboosting-based model is better when only three pause duration features are employed. On theother hand, bagged decision trees are better in handling the larger prosodic feature set. Thissuperiority is significant at p < 0.001.
8.6.1.2 Results in ASR Conditions
As in reference conditions, the best result in ASR conditions (BER = 8.30%) was achievedby the CART model with the rich feature set. Using the other two metrics, this best resultcorresponds to NIST = 59.89% and F = 63.58%. In contrast with the results on cleanreference data, the best prosodic model significantly outperforms the best language model(BER = 8.30% vs. BER = 9.12%) in ASR conditions. This comparison supports the hypoth-esis that prosodic features are less degraded by word errors than lexical features.
98

8.6. DA Segmentation Based on Prosodic Information
Table 8.2: DA segmentation error rates for prosodic models [BER %]
Model Used Features Train/Test Setup
REF/REF REF/ASR ASR/ASR
Chance — 15.92% 13.85% 13.85%
CART w. Ens. Bag. Pause 8.96% 8.97% 9.03%All Prosody 8.06% 8.30% 8.32%
BoosTexter Pause 8.81% 8.85% 8.82%All Prosody 8.22% 8.31% 8.35%
The gap between CART and BoosTexter was really tiny and statistically insignificant inASR conditions. I infer that the reason for this is that the simpler BoosTexter model (whichonly uses stumps instead of fully grown trees as weak learners) is more robust to errors in testdata and this robustness may balance more accurate modeling shown by the CART model.Note that although prosodic features are more robust than lexical features, it does not meanthat they are not affected by word errors at all since a number of them depend on phone orword boundary information for extraction or normalization.
As in reference conditions, the models benefit from using the rich prosody feature set.The gain over the pause feature set is a bit smaller than for reference data but still clearlysignificant – at p < 10−41 for CART and p < 10−18 for BoosTexter. The results also indicatethat the models trained on clean data slightly outperform their counterparts trained on ASRdata. However, note that the differences between them are not statistically significant.
8.6.2 Prosodic Feature Usage
To explore which prosodic features were useful in this task, I analyzed feature usage in prosodicdecision trees; the decision trees are much easier to interpret than the BoosTexter model. Themetric called feature usage [49] reflects the number of times a feature is queried in a tree,weighted by the number of samples it affects at each node. Thus, features that are used higherup in the decision tree have higher usage values. Total feature usage within a tree sums to1. The results reported here are based on averaging results over multiple trees as generatedduring ensemble bagging.
For illustration purposes, prosodic features were grouped into five non-overlapping groups:pause at the boundary in question, duration, pitch, energy, and “near pause” (describing pausesassociated with the previous and the following word boundary positions). The statistics foreach group as well as the most used features from each group are listed in Table 8.3. Thenumbers show that the most frequently queried feature group was “duration” followed by“pitch”. However, if we sum “pause” and “near pause”, we can conclude that pause-relatedfeatures are overall more important than F0-related features. As expected, the most usedindividual feature is duration of the pause after the current word. The next most queriedfeatures were duration of the current word, pause after the preceding word, and normalizedduration of the last rhyme in the current word. On the other hand, I observed that overlapfeatures were not helpful at all, which was a bit surprising. It suggests that turn-taking in thismultichannel data is well captured by pause-related features.
I also looked at the feature usage for the pause-only feature set. In this feature set, pauseafter the current word has usage 39.2%, whereas pauses after the previous and the followingword have 29.9% and 30.9%, respectively. Thus, as expected, the pause at the boundary inquestion was the most frequently queried feature in this feature set.
99

Chapter 8. Dialog Act Segmentation of Multiparty Meetings in English
Table 8.3: Feature usage for individual groups of prosodic features
Group Tot. usage Two most used features from the group
Pause 16.1% pause.after(16.1%), —Duration 48.9% word.dur(9.3%), word.dur.last_rhyme.snorm(5.5%)Pitch 21.4% f.f0.slope.first(3.6%), f0.ratio.last_min__baseline(3.2%)Energy 4.9% f.RMS.mean(2.3%), RMS.min.voiced.norm (1.5%)NearPause 8.7% p.pause.after(5.7%), f.pause.after(3.0%)
Table 8.4: DA segmentation error rates for models combining textual and prosodic features [BER%]
Model Used Features Train/Test Setup
REF/REF REF/ASR ASR/ASR
Chance — 15.92% 13.85% 13.85%
HMM LM+Pause 5.60% 6.86% 6.93%LM+Prosody 5.42% 6.85% 6.83%
MaxEnt LM+Pause 5.59% 6.82% 6.64%LM+Prosody 5.42% 6.64% 6.55%
BoosTexter LM+Pause 5.84% 6.85% 6.67%LM+Prosody 5.72% 6.73% 6.60%
8.7 DA Segmentation Using Both Textual and Prosodic Infor-mation
In this section, I report results of models that rely both on prosodic and textual information.The approaches to knowledge source combination differ among individual models; particularcombination methods were already described in Section 7. I compare two sets of models; thefirst combines the best LMs (using word, AIC, and POSmix features) with the pause-onlymodels, whereas the second combines the same LMs with the prosody models based on thericher feature set. The results for both test conditions are presented in Table 8.4.
Note that in contrast with the experiments reported in the previous section, prosodictrees trained on REF data were used to generate prosodic posteriors also for both ASR-basedsetups. Thus, in the ASR/ASR experiments, HMM and MaxEnt combine textual featuresextracted from ASR data with prosodic posteriors obtained from trees trained on REF data.This decision was motivated by the results reported in the previous section; they showed thatCARTs trained on clean data outperformed their ASR-trained counterparts.
8.7.1 Results in Reference Conditions
The best result in REF conditions was achieved by the HMM model combining the LM with therich prosodic model (BER = 5.42%, NIST = 34.03%, F = 83.17%). However, the MaxEntmodel performed nearly as well, and, in total, made only two more errors in 102k test samples.Thus, the difference between these two models is evidently not statistically significant. On theother hand, the differences between HMM and BoosTexter, and MaxEnt and BoosTexter aresignificant at p < 10−5 using the Sign test.
The models with the richer prosodic features sets outperform models with pause informa-tion only in all three approaches. The improvements are significant at p < 10−4 for HMM and
100

8.7. DA Segmentation Using Both Textual and Prosodic Information
Word−LM Best−LM Pause Prosody LM+Pau LM+Pros5
5.5
6
6.5
7
7.5
8
8.5
9
9.5REF
BE
R [%
]
HMMMaxEntBoosTexter
Word−LM Best−LM Pause Prosody LM+Pau LM+Pros5
5.5
6
6.5
7
7.5
8
8.5
9
9.5ASR
BE
R [%
]
HMMMaxEntBoosTexter
Figure 8.1: DA segmentation error rates for individual models in dependence on used knowledgesources [BER %]
MaxEnt, and at p < 0.005 for BoosTexter. Despite the fact that models using rich prosodywere always better than models with pauses, the results indicate that the gain from betterprosodic modeling is diminished when combined with an LM. For example, the relative errorrate reduction for prosody only conditions is over 10% in the HMM approach, whilst it is just3.2% for the combined prosodic-textual model in the same approach.
Furthermore, we can observe that combined models notably outperform both languageand prosody models alone. For comparison, the chance error rate is 15.92%, the best LMalone performed at BER = 7.02%, the best prosody model at BER = 8.06%, and the bestcombined model at BER = 5.42%. The left hand graph in Fig. 8.1 confronts BERs accordingto available information sources for all three modeling approaches. In the figure, lines connectpoints corresponding to the same model for the sake of readability.
8.7.2 Results in ASR Conditions
The best performing model in ASR conditions was the MaxEnt model that was using richprosody and was trained on ASR data (BER = 6.55%, NIST = 47.29%, F = 73.90%). Ofthe three modeling approaches, BoosTexter came second and HMM (which was the best inREF conditions) was the worst. The Sign test showed that MaxEnt is significantly better thanHMM (p < 10−4), but the difference between MaxEnt and BoosTexter (BER = 6.55% vs.BER = 6.60%) is not significant. The gap between BoosTexter and HMM is significant atp < 0.001%.
For all three approaches, models trained on ASR data outperform models trained on REFdata. While the difference is not significant for HMM, it is significant at p < 0.05 and p < 0.01for MaxEnt and BoosTexter, respectively. These results indicate that training on ASR datais more beneficial for the discriminative models.
As in the tests on reference data, the models with the richer prosodic feature sets outper-form models only using pause information. However, the gains are relatively smaller in ASRconditions. The improvement is clearly insignificant for the HMM model, the p-values forMaxEnt and BoosTexter are 0.02 and 0.07, respectively. Again, we can observe that the gainfrom rich prosody is much smaller when combined with LMs. Whereas the relative error ratereduction for prosody only conditions is 7.5% using decision trees, it is just slighltly over 1% inthe best performing MaxEnt approach (which also uses decision trees for prosody modeling).
The right-hand graph in Fig. 8.1 shows BERs according to available information sources
101

Chapter 8. Dialog Act Segmentation of Multiparty Meetings in English
Table 8.5: DA segmentation error rates for a combination of HMM, MaxEnt, and BoosTexter [BER%]
Combination Approach Test Data
REF ASR
Chance 15.92% 13.85%
Best Single Approach 5.42% 6.55%Majority Voting 5.20% 6.29%Linear Interpolation 5.18% 6.19%
for all three modeling approaches in ASR conditions. The chance error rate is 13.85%, the bestLM performed on its own at BER = 9.12%, the best prosody model at BER = 8.30%, andthe best combined model at BER = 6.55%. Although the shapes of the performance curvesare different from those for the REF-based tests displayed in the left-hand graph (prosodymodels outperform LMs for ASR), the combined models are by far the best models again.
8.8 Combination of All Three Modeling Approaches
In this section, I evaluate models that not only combine knowledge sources but also statisticalmodeling techniques. As was already mentioned in Chapter 7, the three machine learningapproaches used in this work train segmentation models in different ways. In machine learningtasks, it is often the case that superior results are achieved by a combination of several differentsubmodels. Models of a different nature usually make different errors and thus may be at leastpartly complementary. Hence, I also tried to combine the three modeling approaches to seewhether the combination could provide improvement over the best single-approach model.I examined two combination methods – simple majority voting and linear interpolation ofposterior probabilities.
Table 8.5 presents the overall error rates for both test conditions. The two combinationapproaches are compared with the best individual models – HMM for REF and MaxEnt forASR conditions. The results indicate that the model combination boosts DA segmentationperformance. Overall, BER was reduced from 5.42% to 5.18% for REF, and from 6.55% to6.19% for ASR. These error reductions are significant at p < 10−17 and p < 10−7, respec-tively. In the other two metrics, the best results are NIST = 32.49% and F = 83.18% forREF, and NIST = 44.70% and F = 75.85% for ASR. Of the two combination approaches,linear interpolation worked better, however, the gain over the majority voting approach wasonly significant for the ASR-based tests (p < 0.005). The interpolation weights for HMM,MaxEnt, and BoosTexter were estimated on the develepment data as 0.36, 0.33 and 0.31 forREF, and 0.32, 0.32 and 0.36 for ASR. None of the models has a dominant position and theweight distributions are not far from uniform. Examples of meeting transcripts automaticallysegmented by the best performing system are shown in Appendix C (page 153).
I also compared overall classification accuracy across the test conditions. Note that thiscomparison cannot be carried out in terms of absolute BER because this metric does not takeinto account event priors. Since the DA boundary priors differ between the two compareddatasets, a comparison in terms of absolute BERs would be skewed. However, we can com-pare model performance across corpora in terms of F -measure, NIST error rate, or relativereductions of BER over the chance error. As expected, the comparisons on the meeting dataclearly show that the final segmentation models are relatively more successful when dealingwith human-generated test data. For instance, the relative BER reduction over chance is67.5% for REF and 55.3% for ASR.
102

8.9. Chapter Summary and Conclusions
8.9 Chapter Summary and Conclusions
In this chapter, I explored automatic DA segmentation of the ICSI meeting corpus. Threedifferent modeling approaches were examined – HMM, MaxEnt, and BoosTexter. For languagemodeling, I did not only use simple word-based models, but also utilized textual informationbeyond word identities, as captured by automatically induced classes and POS tags. In prosodymodeling, I experimented with two distinct feature sets – the first contained just pause-basedfeatures, while the other was a richer set also containing features relating to duration, pitch,and energy. All experiments were evaluated both on manual and automatic transcripts.
First, I explored DA segmentation based on textual information. The results of languagemodels only using a single textual knowledge source indicate that both word-based and AIC-based features show good results, while POS information is helpful only when the most frequentwords are kept and not replaced by POS classes. For both test conditions, the best results wereachieved when all textual information sources were combined. The most successful languagemodeling approach was HMM, while BoosTexter was the worst.
The next set of experiments focused on performance of prosodic models. These experimentscompared decision tree and BoosTexter classifiers since both HMM and MaxEnt use prosodicposteriors obtained from the decision trees. The results show that decision trees outperformBoosTexter. The difference between the two models was statistically significant in referenceconditions but insignificant in ASR conditions. The results also indicate that prosodic featuresare less degraded by speech recognition errors than lexical features.
Prosody beyond pause was helpful to a great extent. The rich feature set significantlyoutperformed pause in both test conditions. The analysis of feature usage in decision treesrevealed that the most frequently queried group of features was the pause group followed bythe duration group and the pitch group. Thus, information from pauses is extremely importantfor successful DA segmentation of meetings, but adding duration, pitch, and energy featuresyields a further significant improvement.
Models combining prosodic and lexical information clearly outperform language andprosody models alone. Similarly to prosody-only models, the models combining textual in-formation with rich prosody feature set were better than the models combining it only withpause-based features. However, the relative gain from additional prosodic features was smallerthan for the models not employing textual features.
The comparison of individual modeling approaches shows that HMM and MaxEnt prevailsin reference conditions, and MaxEnt is the best in ASR conditions. The results of all modelssuggest that a tighter integration of prosodic and lexical knowledge during training is helpfulfor DA segmentation in ASR conditions. The best overall results for both test conditions wereachieved by a combination of HMM, MaxEnt, and BoosTexter based on linear interpolation ofposterior probabilities. This result indicates that the three modeling approaches are at leastpartly complementary.
Another comparison of automatic segmentation accuracy shows that the best DA segmen-tation system is relatively more successful in reference than in ASR conditions. The relativeBER reduction over the chance error is 67.5% for reference and 55.3% for ASR conditions. Theoverall results in ASR conditions also indicate that models trained on ASR data slightly out-perform their counterparts trained on manual transcripts. For the generative HMM approach,the difference is not significant, whereas the discriminative models (MaxEnt and BoosTexter)get a modest yet significant gain from training on ASR data. Thus, we can conclude that forcorpora in which ASR performance is still rather poor, it may be useful to train models onrecognized rather than reference words. However, we must take into account that automaticrecognition of large amounts of training data may be computationally expensive.
103


Chapter 9
Speaker-Dependent Modelingfor Dialog Act Segmentationof Meetings
Society exists only as a mental concept;in the real world there are only individuals.
Oscar Wilde
The previous chapter focused on automatic DA segmentation of meeting speech in a speaker-independent fashion. In this chapter, by contrast, I take a closer look at speaker-dependentprosodic and language modeling for DA segmentation of meetings. Speaker adaptation meth-ods are widely used for speech recognition, but much less is known about speaker-specificvariation in prosodic and lexical patterns that are important for detection of linguistic bound-aries in speech.
The meeting domain is a good test bed for speaker-dependent modeling. In many real-lifemeeting applications, the speakers are often known beforehand and recorded on a separatechannel. Moreover, many meetings have recurring participants, presenting the opportunityfor adapting models to the individual talkers. In the remainder of this chapter, I explorespeaker-specific issues for both prosody and language modeling. Section 9.1 discusses speaker-dependent prosodic modeling, Section 9.2 is devoted to speaker-dependent language modeling,and Section 9.3 provides an overall summary and conclusions.
9.1 Speaker-Dependent Prosodic Modeling
9.1.1 Motivation and Goals
The general idea of speaker adaptation is well known. Speaker adaptation methods werefirst successfully used in the cepstral domain for speech recognition [167, 168]. On the otherhand, only little is known about speaker-specific variation in prosodic patterns, beyond basicF0 normalization. Studies in speech synthesis and automatic speaker recognition have usedprosodic variation successfully, but to my best knowledge, modeling stylistic prosodic vari-ability for sentence boundary recognition has to date been mentioned only anecdotally in theliterature [49, 169, 170].
The experiments reported in this section try to find answers to two questions about speakervariation in prosodic marking of DA boundaries, using 20 frequent speakers from the ICSI
105

Chapter 9. Speaker-Dependent Modeling for DA Segmentation
meeting corpus. The first question asks whether individual speakers benefit from modeling richprosodic features other than simple pause information. The second question inquires whetherspeakers differ enough from an overall (speaker-independent) model of prosody to benefit froma model trained (or adapted) on only their speech. The rest of this section is organized asfollows. Subsection 9.1.2 describes used prosodic features, classifiers, modeling approaches,and the experimental setup. Subsection 9.1.3 provides results and discussion showing answersto the two questions. The results are presented separately for individual speakers as well assummed over all speakers to enable an overall model comparison.
9.1.2 Method
9.1.2.1 Prosodic Features
For the speaker-dependent experiments, I used a feature set comprising 32 prosodic features.This set was derived from the 40 feature set used for the speaker-independent experiments byremoving all raw duration features. Although unnormalized duration features aid performanceof prosody-based segmentation, they could correlate with lexical features that should be mod-eled in a language model. Certain frequent DAs (esp. backchannels) have small set of words,so raw durations may capture those words rather than prosody. Hence, in order to focus onthe aspect of the speaker-dependent prosodic characteristics, these raw features were takenout to avoid interference with language modeling. In addition to the rich prosodic feature set,the comparison in Section 9.1.3.1 also evaluates models only using pause features.
9.1.2.2 Classifiers
As in past work on DA segmentation, CART-style decision trees with ensemble bagging wereemployed as prosodic classifiers. Since the trees were trained on bagged ensembles downsam-pled to equal class priors, when applying the classifiers on (the imbalanced) test data, theoutput posteriors were adjusted to take into account the original class priors. The advantageof decision trees is not only in that they yield good results, but they are also easy to interpretin terms of feature usage. These classifiers have been described in detail in Section 7.1.4.
9.1.2.3 Evaluated Prosodic Models
This study compares three types of prosodic models differing in speaker-dependency. Speaker-independent (SI) models are trained using all available data, whereas speaker-dependent (SD)models are only trained on speech of the target talker. Models of the last type, speaker-adapted(SI+SD), are created via posterior probability interpolation of the two previous models
PSI+SD(X;λ) = λPSI(X) + (1− λ)PSD(X) (9.1)
where X denotes the observed prosodic feature vector, PSI(X) the speaker-independent andPSD(X) speaker-dependent posterior, and λ is a weighting factor estimated using the jackknifeapproach, as described below in Section 9.1.2.4.
9.1.2.4 Data and Experimental Setup
As in the previous chapter, the DA segmentation experiments reported here were performedusing the ICSI meeting corpus. However, the experimental setup was different because thespeaker-dependent experiments required a special data split. The models were evaluated on
106

9.1. Speaker-Dependent Prosodic Modeling
Table 9.1: Data set sizes for individual speakers. ID=Speaker ID, Train=Trainig set size, Test-R=Testsize for REF, Test-A=Test size for ASR. All data sizes are presented as numbers of words.
No. ID Train Test-R Test-A No. ID Train Test-R Test-A
1. me013 115.2k 51.2k 43.4k 11. mn052 10.7k 3.8k 3.5k2. me011 50.6k 24.8k 22.9k 12. mn021 9.6k 4.1k 4.1k3. fe008 50.6k 22.6k 19.5k 13. me003 9.3k 3.6k 3.2k4. fe016 32.0k 15.4k 13.9k 14. mn005 7.7k 3.1k 3.0k5. mn015 31.9k 14.7k 13.7k 15. me045 8.1k 2.4k 2.1k6. me018 31.8k 14.7k 13.3k 16. me025 7.7k 2.4k 1.6k7. me010 26.1k 12.6k 11.3k 17. me006 6.9k 1.5k 1.3k8. mn007 27.2k 10.1k 8.4k 18. me026 5.2k 2.5k 2.3k9. mn017 21.0k 7.1k 6.0k 19. me012 5.3k 2.1k 1.9k10. mn082 13.3k 4.2k 3.7k 20. fn002 5.9k 1.5k 1.4k
the top 20 speakers in terms of total words. This speaker set contains 17 males and 3 females;12 speakers are native English speakers and 8 are nonnative speakers.
Each speaker’s data was split into a training set (∼70% of data) and a test set (∼30%),with the caveat that a speaker’s recording in any particular meeting appeared in only oneof the sets. Because of data sparsity, especially for the less frequent speakers, I did not usea separate development set, but rather jackknifed the test set for my experiments. In thisapproach, one half of speaker’s test data is used to tune weights for the other half, and viceversa. As in the previous experiments, two different test conditions are used for evaluation:reference transcripts (REF) and automatic speech recognition output (ASR). BER (definedin Eq. (3.1) on page 18) is used for performance evaluation as in the preceding segmentationexperiments.
The total training set for speaker-independent models (comprising the training portions ofthe 20 analyzed speakers, as well as all data from 32 other less-frequent speakers) contained567k words. The total test set contained 204k words for reference test conditions and 180kfor ASR test conditions. Data set sizes for individual speakers are shown in Table 9.1; size oftraining sets available for training of the speaker-dependent models ranges from 5.2k to 115.2kwords. Note that the test set sizes for REF and ASR conditions differ since the number ofwords in ASR outputs is usually smaller than that in the corresponding reference. Speakeridentity is described using the official corpus speaker IDs. The first letter of the ID denotesthe sex of the speaker (“f” or “m”); the second letter indicates whether the speaker is a native(“e”) or nonnative (“n”) speaker of English.
9.1.3 Results and Discussion
9.1.3.1 Pause-only vs. Rich Prosody Features for Individual Speakers
Before analyzing the SD prosodic models, I took a look on prosodic differences among individ-ual speakers from a different perspective. The experiments in Chapter 8 showed that featurescapturing prosodic information beyond pause help prosody-based sentence segmentation ofmeetings. However, here our goal is to explore whether there is a gain from using rich prosodyfor all speakers, or only for some. Hence, I used an SI model based on the rich feature setand an SI model based only on pause information and compared their results for individualspeakers.
107

Chapter 9. Speaker-Dependent Modeling for DA Segmentation
Table 9.2: DA segmentation error rates by pause-only (Pause) and rich prosody models (RichPr)models for individual speakers in reference conditions [BER %]. RER denotes relative BER reductionby RichPr with respect to Pause. The best result for each speaker is shown in boldface.
ID Pause RichPr RER ID Pause RichPr RER
me013 8.93% 8.36% 6.29% mn052 8.93% 8.29% 7.17%me011 7.47% 6.61% 11.50% mn021 8.23% 8.01% 2.64%fe008 8.92% 8.53% 4.37% me003 6.18% 5.83% 5.79%fe016 10.15% 9.62% 5.18% mn005 8.74% 7.73% 11.57%
mn015 8.69% 7.99% 8.06% me045 7.95% 7.20% 9.37%me018 8.30% 7.74% 6.72% me025 8.74% 8.32% 4.85%me010 9.25% 8.30% 10.21% me006 10.72% 9.86% 7.98%mn007 11.53% 10.71% 7.10% me026 7.94% 7.94% 0.00%mn017 8.67% 8.03% 7.35% me012 8.85% 8.66% 2.11%mn082 9.76% 9.00% 7.82% fn002 11.26% 9.79% 13.09%
Table 9.2 shows the results using the two feature sets for each speaker. The speakersdisplayed in the table are sorted according to the total number of words they have in thecorpus. As shown, the richer prosodic feature set (RichPr) yields a better performance thanthe pause-only model (Pause), for 19 of the 20 speakers, and the other speaker (me026) showedthe same BER using both models.
The relative error rate reduction by RichPr with respect to Pause is also provided. Itshows that differences across speakers on this measure, interestingly, do not appear to becorrelated with the amount of training data. They may thus reflect differences in speakingstyles, although other factors such as robustness of feature extraction or production of differentrates of DA types, may also play a role.
9.1.3.2 Speaker-Independent vs. Speaker-Dependent Models for IndividualSpeakers
The main problem I investigate is whether some speakers may benefit from speaker-dependenttraining, despite significantly less data for SD than for SI models. All the experiments reportedin this section were performed with the rich prosodic feature set. I will present results for bothreference transcripts and ASR conditions, but I will mainly analyze results using the referencetranscripts, because I was more interested in looking at the effects of speaker differences thaneffects of recognition errors.
Table 9.3 compares performance of SI, SD, and SI+SD models in REF conditions. Theresults indicate that the SD model is better than the SI model for 4 of the 10 most frequentspeakers, and for 5 of the 20 speakers. The SD or SI+SD model is better than the SI modelfor 5 of the top 10 speakers, and for 7 of all 20 speakers. Note that it is possible for the SI+SDto perform worse than the SI model, because weights are estimated on fairly small amountsof data that are separate from the data on which the model is tested. I used the Sign testfor statistical significance measurement. Four speakers (me011, mn007, fe016, mn005) showedimprovements significant at p < 0.05 or better; one speaker (fn002) was marginally significantat p < 0.10. It is also interesting that the error reduction with respect to SI varies acrossspeakers, but in a manner uncorrelated with training set size.
Although only some speakers show these improvements (while some others show ratherpoor results from SD modeling), the finding is important. If a speaker shows significantly
108

9.1. Speaker-Dependent Prosodic Modeling
Table 9.3: DA segmentation performance comparison of SI, SD, and SI+SD prosodic models inREF conditions [BER %]. The best result for each speaker is shown in boldface, * indicates that theimprovement of SI+SD over SI is significant at p < 0.05 using the Sign test.
ID SI SD SI+SD ID SI SD SI+SD
me013 8.36% 8.47% 8.39% mn052 8.29% 8.64% 8.32%me011* 6.61% 6.60% 6.41% mn021 8.01% 9.27% 8.08%fe008 8.53% 8.55% 8.55% me003 5.83% 6.57% 5.83%fe016* 9.62% 9.55% 9.52% mn005* 7.73% 7.15% 7.18%mn015 7.99% 8.47% 7.96% me045 7.20% 7.62% 7.29%me018 7.74% 8.09% 7.74% me025 8.32% 8.95% 8.32%me010 8.30% 8.20% 8.30% me006 9.86% 10.65% 9.99%mn007* 10.71% 10.47% 10.19% me026 7.94% 8.99% 7.94%mn017 8.03% 8.06% 8.03% me012 8.66% 8.76% 8.66%mn082 9.00% 9.62% 9.02% fn002 9.79% 10.52% 9.32%
Pause Duration Pitch Energy Near Pause0
5
10
15
20
25
30
35
40
45
50Native Speakers
Rel
ativ
e F
eatu
re U
sage
[%]
SIme011fe016me010
Pause Duration Pitch Energy Near Pause0
5
10
15
20
25
30
35
40
45
50Nonnative Speakers
Rel
ativ
e F
eatu
re U
sage
[%]
SImn015mn007mn005fn002
Figure 9.1: Relative usage of prosodic feature groups for native (left) and nonnative (right) speakerswho improved using SD information
improved results using a model trained on far less data than the SI model, this suggests thatthe speaker’s prosodic marking of DA boundaries differs from that of the SI model. Thata number of speakers do not benefit from SD modeling is consistent with their being welldescribed by the SI model. That is, there are most likely some consistent ways that peoplebehave prosodically, but for some speakers who deviate from these norms, speaker-dependentmodeling can be of value.
Figure 9.1 displays relative feature usage statistics for those speakers for whom there is animprovement from using SD information. As in the speaker-independent feature usage analysispresented in Section 8.6.2, the prosodic features were grouped into five nonoverlapping groups:pause at the boundary in question, duration, pitch, energy, and “near pause”. The figurecompares the SD feature usage distribution with the SI distribution, for native speakers (theleft-hand graph) and nonnative speakers (the right-hand graph).
The three natives show very similar usage to each other and to the SI model. However, aswe saw earlier, SD models improve their results. This suggests that even when general featureusage patterns for a talker are similar to those of the SI model, specific features and/or featurethresholds may still be better modeled by training on the specific speaker. Given only three
109

Chapter 9. Speaker-Dependent Modeling for DA Segmentation
Table 9.4: DA segmentation performance comparison of SI, SD, and SI+SD prosodic models inASR conditions [BER %]. The best result for each speaker is shown in boldface, * indicates that theimprovement of SI+SD over SI is significant at p < 0.05 using the Sign test.
ID SI SD SI+SD ID SI SD SI+SD
me013 8.41% 8.47% 8.37% mn052 8.96% 9.30% 8.70%
me011 7.01% 6.80% 6.77% mn021 7.56% 8.54% 7.56%fe008 9.04% 8.98% 8.90% me003 6.40% 6.49% 6.27%
fe016 9.40% 9.39% 9.41% mn005 6.78% 5.87% 5.90%mn015 8.09% 8.47% 7.96% me045 7.93% 8.13% 7.89%
me018 8.16% 8.30% 8.18% me025 11.14% 10.77% 10.83%me010 8.62% 8.34% 8.30% me006 10.94% 10.78% 10.63%
mn007* 10.74% 10.06% 10.01% me026 7.91% 8.51% 7.61%
mn017 8.04% 8.16% 8.04% me012 8.99% 9.31% 8.99%mn082 8.03% 8.38% 8.00% fn002 9.74% 9.24% 9.46%
native speakers showing improvements here; it is possible that not all native speakers showthe same pattern, but this is a question for further research on a larger data set.
Feature usage for nonnative speakers, on the other hand, looks quite different. Speakersdiffer from each other, as well as from the SI pattern. Although more research is neededbefore drawing conclusions, this finding is nevertheless consistent with stylistic differencesbetween nonnative speakers and an overall SI model, in prosodic marking of DA boundaries.Obvious next question would be whether improvement depends on native language, proficiencyin English, or degree of perceived accent. The sample of nonnative speakers is too small toexamine these questions, however, I do note that of three native German speakers, all highlyproficient in English, one speaker improved from individual modeling while two others did not.Of three Spanish speakers, all moderately proficient, two improved and one did not.
Table 9.4 presents results for ASR conditions. We can see that the distribution of the bestperforming models differ from that for REF. In contrast to REF, most of speakers improvedby using SD information. While only 7 of 20 speakers improved in REF, 16 speakers improvedin the ASR-based tests. Also note that all 7 speakers who improved in REF also improved inASR conditions. On the other hand, the magnitudes of improvement were relatively smaller.Using the Sign test, only one speaker (mn007) showed a gain significant at p < 0.05. Oneother speaker (mn005) showed a marginally significant gain (p < 0.09).
I suppose that some of the differences between REF and ASR are related to backchannels,often missed by the ASR system. The backchannels are rather different from other speechmaterial, and thus their smaller number may considerably influence overall results. Thissupposition suggests to test prosodic adaptation on other data also having recurring speakers,yet a smaller number of backchannels and more regular prosody.
9.1.3.3 Overall Results of Speaker-Independent and Speaker-Dependent Models
After presenting results for individual speakers, I also present overall results summed over alltested speakers. These are shown for both test conditions in Table 9.5, along with chanceerror rate. In REF tests, the overall best performance showed the speaker-adapted SI+SDmodel followed by the SI model while the SD model was the worst. The improvement ofSI+SD over SI in reference conditions is statistically significant at p < 0.001 using the Signtest. Given the absolute difference in BER, the relatively high level of significance may seem
110

9.2. Speaker-Dependent Language Modeling
Table 9.5: Overall DA segmentation error rates for SI, SD, and SI+SD prosodic models [BER%]
Method REF ASR
Chance 15.02% 13.19%
SI (Baseline) 8.25% 8.41%SD 8.40% 8.41%SI+SD 8.19% 8.26%
a little surprising, but there exist two explanatory reasons. First, the overall test set is reallyhuge (204k words). Second, if the SD information does not benefit a particular speaker, itoften get zero weight in the interpolation model. Thus, both SI+SD and SI show identicaloutput for many unimproved speakers which decreases variance between overall output andconsequently supports statistical significance in the Sign test. The difference between SI+SDand SD is significant at p < 0.01 and between SI and SD at p < 0.05.
In ASR conditions, the SI+SD model was also the best performing one. The superiorityof SI+SD over SI and SD used alone was significant at p < 0.05. The relative gain by usingSI+SD instead of SI was higher than in reference conditions. Interestingly, the SD modelperformed almost as well as the SI model. In total, SD made only 4 more errors than SI inthe 180k test samples.
9.2 Speaker-Dependent Language Modeling
While the previous section dealt with speaker-dependent prosodic modeling, this section fo-cuses on speaker-dependent language modeling for DA segmentation.
9.2.1 Motivation and Goals
Section 9.1 indicated that the prosody-based automatic DA segmentation system may for somespeakers show good results with prosodic models trained only on a small amount of speech fromthe same speaker. However, similar results cannot be expected for LMs since LMs trained onlyon such small amounts of data as we have available for individual talkers would apparently suf-fer from large out-of-vocabulary rates and yield inferior performance. For speaker-dependentlanguage modeling, nevertheless, we can get inspired by the good results achieved by theSI+SD prosodic model that combines speaker-independent and speaker-dependent informa-tion. Thus, speaker-dependent modeling is viewed in terms of speaker LM adaptation in thisstudy. The goal is to try to adapt the LM to capture speakers’ idiosyncratic lexical patternsassociated with DA boundaries.
Speaker adaptation of LMs is not meaningful in all domains. First, the target domainmust show spontaneous speech. Evidently, it would not be reasonable to try speaker LMadaption on, for example, broadcast news where anchors just read prompted text prepared byanother person. In addition, the possible target domain should also have recurring speakerssince it seems to be very difficult to perform effective speaker LM adaptation to previouslyunseen speakers. Both conditions are met for multiparty meeting data, which presents theopportunity for investigating speaker LM adaptation.
General LM adaptation has been studied rather extensively in speech recognition and otherlanguage processing tasks, using both supervised [171, 172] and unsupervised [173, 174, 175]approaches. A useful survey of LM adaptation techniques is given in [176]. The typical
111

Chapter 9. Speaker-Dependent Modeling for DA Segmentation
approach is to use the test words to determine the topic for the test document, and then usethe topic-specific LM or its combination with the generic LM.
Topic- and domain-based LM adaptation approaches have received significant attention inthe literature, but much less is known about LM adaptation for individual talkers. First ofall, Besling and Meier [177] improved an automatic speech dictation system by speaker LMadaptation based on the LM fill-up method. Akita and Kawahara [178] showed improvedrecognition performance using LM speaker adaptation by scaling the N -gram probabilitieswith the unigram probabilities estimated via probabilistic latent semantic analysis. Tur andStolcke [179] demonstrated that unsupervised within-speaker LM adaptation significantly re-duced word error rate in meeting speech recognition.
Unlike previous work in LM adaptation (mostly topic-based adaptation in the task of speechrecognition), the goal of the study presented in this section is to investigate whether speakeradaptation of LMs may help in automatic DA segmentation of meetings. The remainder of thissection is structured as follows. Subsection 9.2.2 describes used LMs, the speaker adaptationapproach, and the experimental setup. Subsection 9.2.3 presents results and discussion; theresults are presented separately for individual speakers as well as summed over all speakers toenable an overall model comparison.
9.2.2 Method
9.2.2.1 Language Models
HELMs (described in detail in Section 7.1.3) that showed good results in previous work areused to automatically detect DA boundaries in the unstructured word sequence. The modelis trained by explicitly including the DA boundary token in the vocabulary in word-basedN -gram LM. I use trigram LMs with modified Kneser-Ney smoothing. During testing, theHELM performs forward-backward decoding in the HMM framework.
9.2.2.2 Speaker Adaptation Approach
To adapt the generic speaker-independent LM to a particular speaker, I used the simple yetpowerful interpolation approach again. The speaker-adapted model is obtained from a linearcombination of the speaker-independent model SI and a speaker-dependent model SD asfollows:
PSI+SD(ti|hi;λ) = λPSI(ti|hi) + (1− λ)PSD(ti|hi) (9.2)
where ti denotes a token (word or DA boundary) and hi its history of n−1 tokens within an N -gram LM. λ is a weighting factor that is empirically optimized on held-out data. Note that theSD data is already contained in the SI data for LM training; therefore, this interpolation doesnot help reduce out-of-vocabulary rate, it rather gives a larger weight to N -grams observed inthe data corresponding to a particular speaker and is expected to be better suitable to thisspeaker.
9.2.2.3 Data and Experimental Setup
I use the same data split as for the prosodic adaptation experiments, as described in Sec-tion 9.1.2.4. Thus, all data set sizes presented in Table 9.1 are also valid for the language-modeling experiments. As in previous work, I test the method using both manual and au-tomatic transcripts; DA segmentation performance is measured using BER. Likewise, I alsoemploy the jackknife approach, instead of using a separate development test. The only notable
112

9.2. Speaker-Dependent Language Modeling
Table 9.6: DA segmentation error rates for speaker-independent (SI) and speaker-adapted LMsfor individual speakers in REF conditions [BER %]. AdInW=Adaptation with individual weights,AdGlW=Adaptation with global weights. The best result for each speaker is shown in boldface, * and** indicate that the improvement over SI is significant by the Sign test at p < 0.05 for one or bothmethods, respectively.
ID SI AdInW AdGlW ID SI AdInW AdGlW
me013** 6.75% 6.55% 6.52% mn052 7.33% 7.28% 7.28%me011* 7.40% 7.38% 7.25% mn021** 6.68% 5.41% 5.65%fe008** 7.51% 7.12% 7.16% me003 8.78% 8.45% 8.56%fe016* 7.35% 7.22% 7.18% mn005** 7.83% 7.01% 6.92%
mn015** 8.05% 7.75% 7.80% me045 8.90% 8.94% 8.90%me018* 6.64% 6.43% 6.45% me025 8.06% 8.02% 7.85%
me010** 7.24% 6.96% 6.84% me006 9.53% 10.32% 9.47%
mn007* 7.59% 7.36% 7.31% me026 5.80% 5.76% 5.80%mn017** 7.02% 6.44% 6.44% me012** 6.85% 6.29% 6.29%mn082 6.33% 6.28% 6.21% fn002 10.92% 10.79% 11.33%
difference compared to the prosodic adaptation setup is that I test two approaches to estimatethe interpolation weights for LM adaptation.
A robust estimation of the interpolation weight λ in (9.2) may be a problem because ofdata sparsity. In the jackknife approach, one half of speaker’s test data is used to estimateλ for the other half, and vice versa. I test two methods for estimating λs. First, λs areestimated individually for each speaker. In the second method, I set λ as the average value ofthe interpolation weights across all the speakers. Note that in the latter approach, however,I still use only data from the first halves of individual test sets to estimate λ for the secondhalves, and vice versa. This approach eliminates having two significantly different values of λfor a single speaker, which did occur for some of the 20 analyzed speakers. It indicated thatfor those speakers, there is a mismatch in the two halves of the test data used in jackknife,and thus the weights were not optimized properly for the test set.
9.2.3 Results and Discussion
9.2.3.1 Results for Individual Speakers
Table 9.6 shows a comparison of DA segmentation performance for the baseline speaker-independent LM and speaker-adapted LMs for individual speakers, using reference transcripts.The speakers displayed in the table are sorted according to the total numbers of words theyhave in the corpus. The results indicate that for 17 of 20 speakers, performance improvedusing both individual and global weights, and two other speakers improved only for one of thetwo interpolation methods. However, the degree of the improvement varies across particularspeakers. For 8 talkers, the improvement was statistically significant at p < 0.05 using theSign test for both methods. For 4 others it was significant for only one of the methods.
Table 9.7 reports the corresponding results for the ASR conditions. The results show that15 speakers improved using both interpolation methods, while 4 other speakers improved justfor one of the methods. Again, for 8 talkers, the improvement was significant at p < 0.05 forboth methods, and for 4 others the improvement was significant for one method. An interestingobservation is that for both testing conditions, the relative error reduction achieved by speaker
113

Chapter 9. Speaker-Dependent Modeling for DA Segmentation
Table 9.7: DA segmentation error rates of speaker-independent and speaker-adapted LMs for in-dividual speakers in ASR conditions [BER %]. AdInW=Adaptation with individual weights, andAdGlW=Adaptation with global weights. The best result for each speaker is shown in boldface, *and ** indicate that the improvement over SI is significant by the Sign test at p < 0.05 for one or bothmethods, respectively.
ID SI AdInW AdGlW ID SI AdInW AdGlW
me013** 8.29% 8.16% 8.18% mn052* 10.87% 10.49% 10.17%
me011** 8.81% 8.59% 8.51% mn021* 8.20% 7.83% 7.73%
fe008* 9.19% 9.05% 8.89% me003 9.36% 9.36% 9.33%
fe016 8.42% 8.40% 8.31% mn005** 11.47% 8.94% 10.42%mn015** 10.16% 9.90% 9.84% me045 11.08% 11.42% 11.27%me018** 8.12% 7.83% 7.90% me025 14.36% 14.23% 14.36%me010** 8.39% 7.96% 7.91% me006* 10.94% 10.01% 10.40%mn007** 11.28% 10.73% 10.78% me026 7.35% 7.01% 6.88%
mn017** 8.92% 8.01% 7.84% me012 8.68% 8.15% 8.31%mn082 10.37% 10.45% 10.10% fn002 13.40% 13.40% 12.89%
Table 9.8: Overall DA segmentation error rates of speaker-independent and speaker-adapted LMs inreference and ASR conditions [BER %]
Method REF ASR
Chance 15.02% 13.19%
SI (Baseline) 7.30% 9.06%SI+SD: Individual weights 7.02% 8.79%SI+SD: Global weights 6.99% 8.76%
SI+SD: Adapt. with ASR data N/A 8.97%
adaptation is not correlated with the amount of adaptation data. This finding suggests thatspeakers differ inherently in how similar they are to the generic speaker-independent LM. Sometalkers probably differ more and thus show more gain, even with less data.
9.2.3.2 Overall Results of Speaker-Independent and Speaker-Dependent Models
An overall comparison of performance of baseline speaker-independent and speaker-adaptedLMs is presented in Table 9.8. The test set contains 204k words for REF and 180k wordsfor ASR conditions. These results show that for both conditions, speaker-adapted LMs –with either global interpolation weights or individual weights – outperform the baseline. Theoverall improvements by LM speaker adaptation for both conditions are statistically significantat p < 10−15, using the Sign test. Of the two weight options, global interpolation results inbetter performance; however, the difference between the two approaches is only marginallysignificant at p < 0.1.
In ASR conditions, I also tried interpolating the speaker-independent model trained onreference transcriptions with a speaker-dependent model trained on the recognizer output.The idea was to allow the model also to adapt for error patterns typical for an individualtalker. However, this adaptation performed less well than using reference transcriptions asthe training data, which indicates that, at least with the amount of data available for ourexperiments, it is preferable to adapt LMs using clean data. In consequence it also suggests
114

9.3. Chapter Summary and Conclusions
that prospective unsupervised approaches to LM speaker adaptation will perform less wellthan the supervised approach.
9.3 Chapter Summary and Conclusions
In this chapter, I have investigated speaker-specific prosodic and language modeling for DAsegmentation in meetings. The method was evaluated on 20 frequent speakers with a widerange of total words available for speaker-dependent modeling. First, it was found that overall,prosodic features beyond pause provide benefit over the pause-only features for 19 of the 20speakers studied. Further, it was found that interpolating the large, speaker-independentprosodic model with a much smaller prosodic model trained only on that talker’s speech yieldedimprovements for 6 of the 20 speakers in reference conditions, and for 16 of 20 the speakers inASR conditions. The ASR conditions showed a higher number of improved speakers, but theimprovements were relatively smaller than those in the reference conditions. Overall results,summed over all 20 speakers, indicate modest yet significant improvement with respect to theSI-model for both test conditions.
Feature analysis, while preliminary given the number of speakers, suggests that nonnativespeakers may differ from native speakers in overall feature usage patterns associated withDA boundaries. An important question for future work is to explore what factors predictwhether speaker-dependent modeling will benefit a particular speaker since it did not benefitall speakers. The absolute amount of data did not appear to be a predictor in our experiments,although data is certainly necessary for robustness.
In the second set of experiments, I explored speaker adaptation of hidden event languagemodels for the same task. Analogous to prosodic model adaptation, the speaker LM adaptationwas based on a linear combination of the generic speaker-independent and speaker-dependentLMs. Improvements were found for 17 of the 20 speakers using reference transcripts, and for15 of the 20 speakers using automatic transcripts. Overall, I achieved a statistically significantimprovement over the baseline LM for both test conditions. It can be concluded that speakeradaptation of LMs aids DA segmentation, and that future work should investigate the potentialof speaker-specific modeling for other spoken language understanding tasks.
For both types of speaker adaptation, improvements were achieved even for some talkerswho had only a relatively small amount of data available for adaptation. In addition, therelative error reduction achieved by speaker adaptation was not correlated with the amountof adaptation data. This finding suggests that speakers differ inherently in how similar theyare to the generic models. Some talkers probably differ more and thus show more gain, evenwith less data.
An obvious question is whether the speakers who benefit from prosodic model adaptationalso benefit from language model adaptation. Of the 6 speakers who improved by prosodicadaptation in reference conditions, 5 also improved by language model adaptation. The numberof improved speakers in common may seem to be high, but it was not higher than the chanceagreement based on the counts of improved speaker in both sets (5.1 speakers). Similarly, ofthe 16 speakers who improved by prosodic adaptation in ASR conditions, only 10 improved alsoby language model adaptation, while the chance agreement was 12 speakers. These numbersindicate that that there was no apparent correlation between speakers’ idiosyncrasy in prosodicand lexical patterns associated with DA boundaries.
115


Chapter 10
Sentence Unit Segmentation ofCzech Corpora
Change your language and you change your thoughts.Karl Albrecht
While the experiments presented in the two preceding chapters focused on sentence segmenta-tion of conversational English, this chapter focuses on sentence segmentation of spoken Czechusing the two MDE corpora described in Chapter 5. The same three modeling approaches asin the experiments with the meeting data (HMM, MaxEnt, and BoosTexter) are comparedherein. In addition, I analyze gains from using various textual and prosodic features.
The remainder of this chapter is organized as follows. Section 10.1 summarizes most promi-nent differences between Czech and English, Section 10.2 surveys related work on sentencesegmentation of spoken Czech, and Section 10.3 defines the task and experimental setup.Sections 10.4, 10.5, and 10.6 report results of the experiments based on using only textualinformation, only prosodic information, and a combination of both information sources, re-spectively. Section 10.7 presents a system combining all three modeling approaches, andSection 10.8 summarizes all experiments and draws conclusions.
10.1 Differences between Czech and English
When dealing with Czech data, we must cope with some specific issues that are absent inEnglish. Czech belongs to the family of Slavic languages, which are highly inflectional andderivational. The languages with a highly inflectional morphology typically use an extremelylarge number of distinct word forms. For example, Czech nouns have seven cases in the singularnumber and another seven cases in the plural number. Even though some of the inflected formsare identical, the number of distinct word forms relating to lemmas of inflected parts of speechis high. Hence, the ubiquitous problem of data sparseness is even more painful for Czech.
Additional problems arise when we must deal with colloquial Czech [180]. Colloquial Czechdeviates from standard Czech as defined by orthographic, morphological, lexical and syntac-tic rules by the Czech normative bodies. With respect to pronunciation variation, Czech isdifferent from English and many other languages in that spelling rules for Czech are phonet-ically based. Therefore, colloquial Czech words have well-defined but different spellings thantheir standard variants. In other words, colloquial Czech has an orthographic written form.The difference between colloquial and standard Czech is most prominently displayed in themorphology – prefixes and endings are often changed in the former.
117

Chapter 10. Sentence Unit Segmentation of Czech Corpora
Another problem is a relatively free word order in Czech. Word order flexibility is generallycorrelated with rich inflection in a language. In highly inflective languages, syntactic roles ofsentence members are often disambiguated based on morphological information, rather thana position in a sentence. Although the word order flexibility does not imply that the word (orphrase) order may be chosen absolutely arbitrarily, it evidently affects the predictive power ofstatistical models based on N -gram contexts.
On the prosody side, the largest difference between Czech and American English is probablyin typical sentence melody. While sentence-final pitch falls/rises are present in both languages,intrasentential pitch movements (e.g., at prosodic phrase boundaries) are typically less steepin Czech than in English. Another distinction is caused by a different function of stress inthe two languages. Stress has a lexical function in English, i.e. it may distinguish wordidentities. Stressed syllables in English are typically louder, as well as being longer and havinga higher pitch than non-stressed syllables. On the other hand, stress in Czech has only adelimitative function. Stress is fixed to the first syllable of a foot and its only function is toacoustically delimit foot boundaries. This delimitative stress is usually less strongly markedthan the lexical stress in English. Furthermore, preboundary lengthening in Czech is alsoless emphatic than in English. The reason for this is that the length of vowels also serves alexical function in Czech, which offers less opportunity for prosodically motivated lengthening.All these differences make Czech prosody sound “flatter” than English; foreigners often findspoken Czech rather monotonous.
10.2 Related Work on Czech
At the time I started to work on my thesis, there was no published research relating to sentencesegmentation or automatic punctuation of spoken Czech. Thus, our (Kolář, Švec, and Psutka)paper from 2004 [181] was the first published work focusing on this language. Since the earlyexperiments from this study are not included in this thesis, I briefly summarize their resultshere. The pilot paper focused on automatic punctuation (insertion of commas and periods) ofCzech broadcast news data. Although the same Czech BN corpus was used, we did not havethe MDE annotation available at that time. Thus, instead of the MDE symbols, we had touse the slightly inconsistent punctuation from the first transcription pass.
We used the HMM approach and tested two prosodic classifiers – CART and MLP. Of thetwo classifiers, CART worked slightly better. On the language modeling side, a baseline word-based trigram was outperformed by a POSmix model in which infrequent word forms werereplaced by their morphological tags. The methods were only tested on automatically alignedreference transcripts and the best performing combined system (HELM+CART) achievedBER = 4.8% and F = 78.2% for all punctuation marks. For sentence boundary detection,the results were only reported in F -measure (F = 88.1%).
One year later, Kolorenč presented an automatic system for punctuation of automaticallyrecognized Czech broadcast news [182]. He used a simple approach utilizing automaticallylearned rules, separate for periods and commas. The period insertion rules were based onreplacing automatically recognized “noises”, such as long pauses or audible breaths, by periods.For induction of the replacement rules, a genetic algorithm based on a grammatical evolutionapproach was employed. By contrast, the rules for commas were induced from a newspapercorpus. These rules were only relying on two words following the interword boundary ofinterest and looked for positions of conjunctions, pronouns, adverbs, and prepositions (i.e.,potential clause-joining words).
After applying the learned rules to speech recognizer output, a postprocessing step basedon a simple morphological analysis was performed. In this step, all punctuation marks were
118

10.3. Data and Experimental Setup
removed from all segments not containing nouns, numbers or pronouns in the first case (possiblesubjects), or verbs in a finite form (possible predicates). The author reports the performancerates as F = 81.9% for periods and F = 83.2% for commas. Overall, my view on thispaper is that while the presented approach is interesting, it seem to be suboptimal. Forperiod insertion, it only looks for noise flags instead of using prosodic and lexical features.Furthermore, the comma insertion rules do not take into account the words occuring beforethe classified boundary. Moreover, the rules learned in that way do not seem to be robustagainst word recognition errors.
10.3 Data and Experimental Setup
10.3.1 Segmentation Task for Czech Data
As mentioned above, this chapter uses the two MDE-annotated Czech corpora described inChapter 5. The diversity of MDE symbols allows us to define the sentence-unit segmentationtask for these corpora in a variety of ways. For example, we can only recognize sentence-likeunits delimited by the double slash symbols or, on the other hand, we can segment speechinto smaller syntactic units with boundaries marked by both sentence-external and sentence-internal SU breaks. However, since this part of my work aimed to perform an initial setof experiments with SU segmentation of spoken Czech, I decided to follow the original SUdefinition as used in the EARS project. Thus, I defined a two-way classification task in whicha sentence-like unit boundary was recognized when the current word was followed by any SU-external symbol (both complete and incomplete – “/.”, “//.”, “/?”, “//?”, “/-”, “/∼”). On theother hand, words followed by SU-internal symbols (“/&”, “/,”) or no symbol were treated as“non-boundary”.
10.3.2 Experimental Setup
The two Czech corpora were evaluated separately. As usual, each corpus’ data were split intoa training set, a development set, and a test set. The splits were performed based on the datesof broadcast in order to ensure that the training data only contain older recordings than thoseon which the models are tested. Particular data set sizes in terms of a total number of wordsare shown in Table 10.1. Note that, in line with the setup of the previous English experiments,pseudo-words, such as filled pauses or “uh-huhs”, are treated as word tokens during testingand evaluation. On the other hand, background noises or mouth noises, such as loud breathsor coughs, are not taken into account during evaluation and therefore not counted in the table.
The numbers in Table 10.1 show that the automatically generated transcripts containslightly more words than the manual transcripts, indicating that the employed ASR system(described in the following section) was making more insertion errors than deletion errors.Also note that both Czech corpora are significantly smaller than the ICSI meeting corpus usedin the two previous chapters. For example, both Czech training sets are more than three timessmaller than the training set of the meeting corpus.
In terms of the number of broadcast programs, the BN corpus setup used 244 programs fortraining, 39 for development, and 59 for testing. The seemingly unbalanced distribution of thebroadcast programs among the sets was caused by largely varying lengths of the recordingsin the corpus. The development and the test set were designed to contain an approximatelyequal number of words, regardless of the number of shows. On the other hand, the RF corpuscomprises talk shows of a similar length. Hence, the RF split – 40 shows for training, 6 showsfor development, and 6 shows for testing – was balanced in this respect. The evaluation sets
119

Chapter 10. Sentence Unit Segmentation of Czech Corpora
Table 10.1: Data set sizes for Czech corpora (numbers of words)
Data Set BN RF
REF ASR REF ASR
Training 174.8k N/A 159.1k N/ADevelopment 28.2k 28.6k 24.1k 24.2kTest 31.2k 31.6k 24.6k 24.7k
contain unseen speakers as well as speakers appearing in the training data, as it is typical forthe real world applications. For example, the talk shows usually have recurring interviewers,whereas the invited guests typically occur only in a single show.
To generate “reference” SU boundaries for ASR transcripts, I used the same approach asdescribed in Section 8.4. In contrast with previous experiments on the meeting data, I did notexamine models trained on ASR data. This decision was made because the Czech ASR systemwas trained on the same data as I use for training of my segmentation models. Consequently, itwas expected that the training portion of the data would be recognized with a higher accuracy,causing an apparent mismatch between training and test data.
As in all preceding experiments, BER is used as the main performance measure. In ad-dition, chance error rate is always reported. To ease a performance comparison across theexperiments, I also present the NIST error rate and F -measure for best results in individualsections. All experiments are evaluated using both human-generated and automatic speechtranscripts.
10.3.3 Speech Recognition System for Czech
Although building ASR models for Czech data was not one of the thesis goals, I briefly mentionthe speech recognition system here since I had to build my own ASR models as a necessarypreliminary step for my work on sentence segmentation. For automatic recognition of theCzech speech data, I used the LVCSR system developed at UWB [183]. The system wasdesigned for real-time recognition of highly inflected languages.
In the UWB recognizer, each individual basic speech unit (triphone) is represented by athree-state HMM with a continuous output probability density function assigned to each state.Feature vectors are computed at the rate of 100 frames per second using a parametrizationwith 12 PLP cepstral coefficients plus corresponding delta and delta-delta subfeatures. Fordecoding, the system employs a time synchronous Viterbi search with token passing within alexical-tree recognition network. In the first pass, the recognizer uses a bigram language modelto generate word lattices, which are rescored in the second pass using a higher order languagemodel.
The acoustic models for either corpus were trained in HTK only using data from the MDEtraining sets of the same corpora. For training of language models, I have used a databaseprovided by a Czech media-monitoring company. This database contained manual transcriptsof radio and TV broadcasts spanning the years from 1996 to 2006. First, the pieces of text hadto be preprocessed to normalize non-standard tokens, such as numerals, dates, or abbreviations.For this purpose, a text normalization system tailored for languages with rich inflection wasemployed [184]. Then, the transcripts were manually divided into five groups according to theprogram type: news, discussions, economics, investigative journalism, and sports. Since thetarget domain does not include sports, this subpart of the training corpus was not used, norall the data corresponding to the dates on which our development and test sets were recorded.
120

10.4. SU Segmentation Based on Textual Information
The remaining four subcorpora yielded 107M words in total.For each of the subcorpora, I trained a separate trigram language model with modified
Kneser-Ney smoothing in the SRILM toolkit [138]. Subsequently, the four LMs plus a modeltrained only on the MDE training set transcripts were interpolated to form a mixture LMwith five components. The interpolation weights for the two target corpora were estimatedon corresponding development sets using the EM algorithm. Thus, the LM for recognitionof broadcast news was different from the LM for broadcast conversation recognition. Therecognizer’s vocabulary contained 200k words. The words for the ASR vocabulary were selectedusing the vocabulary optimization method described in [185]. A relative weight of the LM fora combination with the acoustic model and the word insertion penalty value were tuned usingthe development data. The overall word error rates were 12.4% for the BN and 29.3% forthe RF corpus. The same automatic system was also used to generate forced alignments ofmanual transcripts.
10.4 SU Segmentation Based on Textual Information
10.4.1 Textual Features
10.4.1.1 Words
In this set of experiments, the term “word features” is used to refer to word-based featuresonly extracted from the training portions of the two Czech MDE corpora. Before I startedto evaluate the word-based segmentation experiments, I had focused on the issue whether theword-based LMs for either corpus may benefit from also using training data from the othercorpus. The answer to this question was not straightforward. While both corpora have beenMDE annotated in the same way, they largely differ in speaking styles. My initial experimentsshowed that using data from the other corpus was not helpful for either corpus. Besides employ-ing the data from the Czech MDE corpora, I also investigated using data from other sources.The exploitation of auxiliary textual resources is discussed below in Subsection 10.4.1.4.
10.4.1.2 AICs
Automatic word classes for the Czech data were induced in the same way as for the meetingdata (as described in Section 8.5.1.2). The optimization of the number of target classes wasperformed for each corpus separately. It was based on evaluation of models with variousclass granularities on corresponding development data. The optimal numbers of classes wereestimated as 300 for the BN corpus and 275 for the RF corpus. These numbers are higher thanthe number for the ICSI meeting corpus, which only used 100 classes. The differences are notvery surprising since we must take into account that, although the Czech corpora are smaller,their vocabularies contain a higher number of word forms. While the training portion of theICSI corpus contains 11,034 distinct word forms, the training set of the BN corpus contains26,805 word forms and the training set of the RF corpus 20,919 word forms. Thus, the corporawith larger vocabularies also show a higher number of resulting word clusters.
10.4.1.3 POS for Czech
Since the use of POS-based features helped in a variety of Czech speech processing tasks, suchas speech recognition [186, 187] or semantic parsing [188], employment of POS informationfor sentence segmentation of spoken Czech is explored here as well. In contrast to languageswith poor inflection (such as English), highly inflected languages (such as Czech) often use
121

Chapter 10. Sentence Unit Segmentation of Czech Corpora
Table 10.2: Description of individual tag positions in PDT tagset
No. Category No. Category
1 POS 9 Tense
2 Detailed POS 10 Degree of comparison
3 Gender 11 Negation
4 Number 12 Voice
5 Case 13 Reserve 1
6 Possessor’s Gender 14 Reserve 2
7 Possessor’s Number 15 Special Usage
8 Person
structured morphological tagsets. In addition to labeling words with a POS category, thesestructured tagsets use tags comprising of “subtags” providing information about morphologicalcategories.
For Czech, the most popular tagset is the positional tag system from the Prague Depen-dency Treebank (PDT) [189].1 In this tagset, every tag is represented as a string of 15 columns(positions). 13 of the 15 positions correspond to individual morphological categories, whichapproximately fit the formal Czech morphology. The two remaining positions are currentlyunused and kept as reserves for a possible future use. The description of individual positions ispresented in Table 10.2. Values in each position are represented by a single character, mostlyan uppercase letter. The values that are not applicable for a particular word (e.g., Gender forprepositions) are denoted by a single hyphen (-). For example, the word form “rezignoval”,lit. “(he) resigned”, is tagged as VpYS---XR-AA---.
It is evident that the structured tagsets for morphologically rich languages are much largerthan the compact tagsets for languages with a poor morphology. While the Penn TreebankTagset [191] used for our English data contains just 36 POS tags plus 12 tags for punctuation,the rich tagsets usually contain more than 1,000 distinct tags. For example, there is about1,500 different tags in the PDT corpus. A theoretical number of possible tags for Czech iseven higher.
Several automatic taggers have been developed for Czech. In this work, I used automatictags obtained from the Morče tagger2 [118], which is based on the averaged perceptron method.Because the Czech tagset is so rich, it was worth exploring whether the sentence segmentationsystems could benefit from using features based on some reduced tags. I explored variousreduced tags including: (1) tags containing just the second position - Detailed POS; (2) tagscontaining just first five positions; (3) the pair comprising of POS plus Case (or Detailed POSinstead of Case for POSs for which Case is not defined) often used for parsing of Czech; (4)the reduced tag found optimal in [181] - Detailed POS, Case (reduced to nominative, genitive,accusative, and “other”), person, tense, and grade. Of the four tested reductions, only option(4) achieved performance close to that using the full tags. However, since none of the reducedtagsets yielded improved results on the development data, I chose to use the full tags in allthe following POS-based experiments.
Besides the pure POS-based models, I also tested the models combining tags with frequent
1Besides the PDT tagset, there also exists an alternative tag system called Ajka [190]. This tagset is notdescribed herein since I do not use it in this work.
2The tagger is available from http://ufal.mff.cuni.cz/morce/.
122

10.4. SU Segmentation Based on Textual Information
words (POSmix). Optimizing the model on my development data, I ended up with 1600 mostfrequent word forms being kept for the BN corpus, and 2000 word forms being kept for the RFcorpus. In terms of relative frequency, the cutoff values for not replacing words by their POSwas 8.57 · 10−5 (i.e. 15/175k) for the BN data and 5.66 · 10−5 (i.e. 9/159k) for the RF corpus.These boundary values are lower than the cutoff value for the English meeting corpus, whichwas 1.87 · 10−4.
10.4.1.4 Auxiliary Words
In my experiments with Czech data, I did not only employ textual data from the MDE corpora,but also investigated benefits from using an additional text corpus. In comparison with English,the need for additional text data is larger for Czech, since the rich morphology sharpens thedata sparseness problem. Some additional textual data are often available, but we musttake into account two important facts. First, such data are typically not annotated for SUboundaries in terms of the MDE guidelines but only contain standard punctuation. This maycause a mismatch between training and test data, and it is not clear beforehand whether theadditional data would improve or rather hurt segmentation performance.
The second problem is that for the auxiliary textual data, we do not have available anyprosodic features associated with the words. In the HMM approach, the auxiliary LM caneasily be incorporated by interpolation with the baseline LM, but both MaxEnt and Boos-texter, which do not have a separate LM, assume that all features are available during training.In addition, these two methods are not very suitable for large N -gram-based training data.Therefore, I used a trick similar to the trick that was used for incorporating prosodic featuresinto the MaxEnt model (cf. Section 7.2.3). The HELM model is used to estimate posteriorevent probabilities based on the auxiliary LM, and these posteriors are subsequently used asan extra feature during training of the models from the primary data. In the BoosTextermodel, the auxiliary posteriors are employed directly, while for the MaxEnt-based model, theposteriors are thresholded to yield binary features.
The auxiliary LM was trained on the same data as I used to build my LMs for the CzechASR system (cf. Section 10.3.3). To generate reference SU boundaries for this data, the 107Mword corpus of broadcast transcripts was automatically split into sentences using a set ofheuristic rules based on punctuation and capitalization information. Then, a HELM modelcould be trained in a standard way.
10.4.2 Experimental Results
Table 10.3 displays experimental results for all three models (HMM, Maxent, and BoosTexter)and all textual feature sets (words, AIC, POS, POSmix, and Auxiliary words). For either of thetwo Czech corpora, each model is evaluated using both manual and automatically generatedtranscripts.
10.4.2.1 Results for BN Corpus
In both REF and ASR-based tests on the BN data, the best result by a model only relying ona single knowledge source was achieved by the auxiliary word (AuxWord) HMM. These resultsindicate that there is a good match between the textual database of broadcast transcripts andthe BN corpus. The second most successful single-source feature set was POSmix. Similar tothe meeting experiments, POSmix outperforms the pure POS model, however, the gap is muchsmaller on the Czech data. The different results between the two languages can be explainedby a different number of tags in the two tagsets. The Czech tagset is much larger so that it
123

Chapter 10. Sentence Unit Segmentation of Czech Corpora
Table 10.3: SU segmentation error rates for LMs with various textual features [BER %].AIC=Automatically Induced Classes, POS=pure POS-based model, POSmix=infrequent words re-placed by POS tags and frequent words kept, AuxWords=Auxiliary words, REF=Reference conditions,ASR=ASR conditions, BN=Broadcast News corpus, RF=Radioforum corpus (Broadcast conversa-tions). The best results for each model are displayed in boldface.
Model Used Features BN RF
REF ASR REF ASR
Chance — 8.11% 8.01% 6.81% 6.89%
HMM Words 6.58% 6.72% 5.38% 6.18%AIC 7.18% 7.31% 6.12% 6.55%POS 6.74% 7.25% 6.17% 6.98%POSmix 6.13% 6.39% 5.27% 5.94%AuxWords 5.23% 5.47% 6.25% 6.28%Words+AIC 6.50% 6.63% 5.43% 6.11%Words+POSmix 5.24% 6.23% 5.24% 5.91%Words+AuxWords 4.68% 5.05% 5.07% 5.24%
Words+AIC+POSmix 5.98% 6.19% 5.16% 5.86%Words+POSmix+AuxWords 4.53% 4.96% 4.88% 5.27%Words+AIC+POSmix+AuxWords 4.56% 4.99% 4.89% 5.34%
MaxEnt Words 6.65% 6.78% 5.76% 6.30%AIC 7.11% 7.23% 6.21% 6.76%POS 6.70% 7.00% 6.21% 6.65%POSmix 6.37% 6.64% 5.77% 6.21%Words+AIC 6.82% 6.93% 5.92% 6.56%Words+POSmix 6.21% 6.50% 5.64% 6.14%Words+AuxWords 4.71% 4.99% 5.16% 5.55%Words+AIC+POSmix 6.42% 6.65% 5.99% 6.48%Words+POSmix+AuxWords 4.65% 4.93% 5.16% 5.72%Words+AIC+POSmix+AuxWords 4.51% 4.85% 5.31% 5.60%
BoosTexter Words 6.77% 7.07% 5.31% 6.10%AIC 7.09% 7.29% 6.11% 6.73%POS 7.01% 7.31% 6.08% 6.65%POSmix 6.72% 6.91% 5.42% 6.22%Words+AIC 6.95% 7.13% 5.96% 6.47%Words+POSmix 6.67% 6.87% 5.43% 6.22%Words+AuxWords 4.70% 4.93% 5.12% 5.78%
Words+AIC+POSmix 6.85% 7.10% 5.88% 6.53%Words+POSmix+AuxWords 4.88% 5.15% 5.28% 5.82%Words+AIC+POSmix+AuxWords 4.91% 5.00% 5.47% 6.02%
124

10.4. SU Segmentation Based on Textual Information
forms a class-based model with a much finer granularity. As a result, it suffers less from theabsence of the important cue words. Finally, we can see that the least effective textual featureset was AIC.
Note that since MaxEnt and BoosTexter did not use a separate AuxWord model butAuxWords posteriors from the HMM model, it is not possible to make a comparison acrossthe three modeling approaches for the AuxWord feature set. However, we can compare theresults of the modeling approaches with other single-source feature sets. The numbers showthat the HMM approach was superior also for the second best feature set (POSmix), as wellas for the third best feature set (Words).
In general, lower error rates were achieved by feature sets relying on more than one infor-mation source. The best performing feature sets differ across the modeling approaches. Theglobally best result for both test conditions was achieved by the MaxEnt model combining allfour knowledge sources. This best result was BER = 4.51% (NIST = 55.64%, F = 70.59%)for BN REF and BER = 4.85% (NIST = 60.52%, F = 67.27%) for BN ASR. On the otherhand, HMM worked best with Words+POSmix+AuxW and BoosTexter run best when onlyWords and AuxWords were used.
Overall, it seems to be very difficult to get some gain from the AIC information. Only theMaxEnt model improved by adding AICs to the overall feature set. For BN REF, the gainwas significant at p < 0.03 using the Sign test. For BN ASR, the p-value of the same test was0.11.
For all models, the differences between the results achieved by the baseline word-basedfeature set and the best performing combined feature sets were large and statistically significantat p-values close to zero. Using the Sign test, I have also evaluated the gaps between the resultsof the three modeling approaches. In reference conditions, the difference between MaxEnt andHMM is not significant, whereas the differences MaxEnt–BoosTexter and HMM–BoosTexterare significant at p < 0.02. In ASR conditions, the gaps are much smaller; only the supremacyof MaxEnt over HMM has a p-value smaller than 0.1. But even for that case, the significancelevel is just p < 0.08.
10.4.2.2 Results for RF Corpus
Results for the RF corpus are also shown in Table 10.3. In both REF and ASR-based testson the RF data, the best result by a model only relying on a single knowledge source wasachieved by the HMM using POSmix features. By contrast, the best single-source BoosTexterwas using the Word features for both conditions, and the MaxEnt model worked best withWords in REF and with POSmix in ASR conditions.
Unlike BN, the HMM with AuxWords was not performing very well on the RF data whenused alone. It indicates that the differences between the training broadcast text database andspontaneous conversations are rather big. The differences are not only in the colloquiality ofthe used language but also in sentence definitions. SUs in the RF corpus differ from writtensentences to a larger extent than SUs from the BN corpus. In addition, AuxWords sufferfrom the absence of pseudo-words such as filled pauses or “uh-huhs”. These pseudo-words arefrequent in the corpus transcripts but absent in the auxiliary training text. However, as shownby the results of combined feature sets discussed, the AuxWord information help improvethe overall performance when AuxWords are not used alone but in a combination with otherfeature sets.
The models using feature sets relying on more than one information source displayedgenerally better results than the models with single-source features. The best performingfeature sets differ across modeling approaches and test conditions. The globally best per-
125

Chapter 10. Sentence Unit Segmentation of Czech Corpora
forming approach was HMM. For reference conditions, the best result was achieved withWords+POSmix+AuxWords – BER = 4.88%, NIST = 70.19%, F = 55.14%. For ASRconditions, the best result was achieved with Words+AuxWords – BER = 5.24%, NIST =75.95%, F = 49.04%. BoosTexter performed at its best in both conditions when combiningWords and AuxWords. On the other hand, MaxEnt worked best with Words+POSmix+AuxWon manual transcripts and with Words+AIC+POSmix+AuxW on automatic transcripts. Thiswas the only top feature set that included the AIC information. However, even here the im-provement by adding AICs was only marginally significant (p < 0.06), as shown by the Signtest.
I also checked statistical significance of gains from adding the AuxWord information tothe overall feature sets. The comparison of the best results achieved with the Auxword in-formation (HMM with Words+POSmix+AuxWords for RF REF and with Words+AuxWordsfor RF ASR) and without the AuxWord information (HMM Words+AIC+POSmix for bothconditions) showed that these improvements were significant at p < 0.001 for REF and atp < 10−6 for ASR conditions.
The gaps between the baseline models only employing Words and the models with bestperforming feature sets were smaller for the RF corpus than for the BN corpus. For HMM,the statistical significance levels of the improvements were p < 10−5 for REF and p < 10−14
for ASR. Likewise for Maxent, the significance levels were p < 10−5 for REF and p < 10−8
for ASR. On the other hand, the improvement of BoosTexter showed in reference conditionsa p-value of just 0.09. In ASR conditions, the improvement of BoosTexter was significant atp < 0.01. Thus, it can be concluded that both HMM and MaxEnt display greatly significantimprovements by adding the textual information beyond the RF training set words, while theBoosTexter model was not that largely successful in getting gain from the additional textualfeatures.
Finally, I measured statistical significance of the differences between the results of thethree modeling approaches. For reference conditions, the supremacy of HMM was significant– over MaxEnt at p < 0.005 and over Boostexter at p < 0.03. The gap between BoosTexterand MaxEnt was not significant. For ASR conditions, the dominance of HMM over the othermodels was significant at p < 10−5. The prevalence of MaxEnt over BoosTexter was significantat p < 0.05.
10.4.2.3 Result Comparison across Corpora
The most distinctive difference between the results for BN and RF is in the importance ofAuxWords. The auxiliary training text resembles more the BN corpus than the RF corpus.Accordingly, it is more beneficial for sentence segmentation of the former corpus. WhenAuxWords are used alone, they reduce the chance BER for BN REF and BN ASR by 35.5%and 37.1% relative, whereas for RF REF and RF ASR, they reduce it just by 8.2% and 8.5%relative, respectively. In addition, a comparison of the best results achieved with AuxWordfeatures shows difference in improvements. The addition of AuxWords reduce BER by 13.9%relative for BN REF, by 22.2% for BN ASR, by 5.4% for RF REF, and by 10.6% for RF ASR.
Performance of individual modeling approaches also differ between the two corpora. Max-Ent was the most successful for the BN corpus, while HMM was the best performing methodfor the RF corpus. The superiority of HMM for RF was greater than the superiority of Max-Ent for BN. On the other end, BoosTexter was the worst for three of the four test conditions.The only exception was RF REF, where it slightly outperformed MaxEnt. The dominanceof HMM for the RF data indicates that the smoothing method used in the HELM is morerobust to lexical irregularities frequent in colloquial Czech data than those used in other two
126

10.5. SU Segmentation Based on Prosodic Information
approaches.We can also compare relative error reductions with respect to chance achieved by the best
models in individual test sets. The relative reductions are 44.4% for BN REF, 39.5% for BNASR, 28.3% for RF REF, and 23.9% for RF ASR. It is possible to see that language modelingwas more succesful in the BN corpus. The differences between the corpora are also in theperformance degradation caused by ASR errors. SU segmentation performance in ASR testsis relatively more degraded in the RF corpus, which was recognized with a much higher WER.
Interesting insights are also offered by the comparison with the LM results on Englishmeeting data. For that corpus, the relative error reductions with respect to chance were55.9% a 49.3% for REF and ASR, respectively. Despite not using any additional textualdata, language modeling for the English meeting corpus was more successful than for theCzech corpora. Although such a comparison may be a bit imprecise beacuse of easier-to-detect backchannel DAs frequent in the English meeting corpus, it yet illustrates that languagemodeling is more difficult for Czech.
10.5 SU Segmentation Based on Prosodic Information
In this section, I evaluate performance of prosodic models. The prosodic feature selectionfor Czech corpora was performed in the same way as for the English meeting data (cf. Sec-tion 8.6.2). In contrast with meetings, the number of selected features was lower. The featurereduction algorithm ended up with 11 features for the BN corpus and 17 features for the RFcorpus. The varying number of features may not only be explained by different characteristicsof individual corpora (number of channels, level of spontaneity, rate of backchannels), butalso by different amount of training data. The meeting corpus is much larger than the Czechcorpora, and thus it could allow a model with a higher number of features to be robustlyestimated.
As in the prosody-based experiments on the ICSI meeting corpus, two modeling approachesare examined here (CART and BoosTexter) since the overall MaxEnt approach only binsprosodic scores obtained from CARTs. Besides reporting the overall accuracy of individualprosodic models, I also investigate whether there is some gain from using a richer set ofprosodic features in comparison with using pause information only. In contrast with meetings,the alternative pause feature set not only contains the three features capturing pause durationafter the previous, the current, and the following word, but also one “other” feature indicatingspeaker change. As described below, this non-prosodic feature significantly improves classi-fication accuracy for the broadcast data. Therefore, its absence in one of the two evaluatedfeature sets would skew the comparison.
10.5.1 Experimental Results for Prosodic Models
Table 10.4 shows BERs achieved by particular prosody models in both reference and ASR testconditions. The two following subsections report results for individual corpora.
10.5.1.1 Results for BN Corpus
In the BN corpus, the best results were achieved by bagged CARTs with the rich prosodicfeature set. In reference test conditions, this model achieved BER = 1.81% (corresponding toNIST = 22.48% and F = 88.52%). In ASR conditions, it achieved BER = 2.11% (NIST =26.41%, F = 86.37%). Using the Sign test, the differences between CART with rich prosodyand BoosTexter with rich prosody were significant at p < 10−11 and p < 10−10 for the two
127

Chapter 10. Sentence Unit Segmentation of Czech Corpora
Table 10.4: SU segmentation error rates for prosodic models [BER %]
Model Used Features BN RF
REF ASR REF ASR
Chance — 8.11% 8.01% 6.81% 6.89%
CART with Ens. Bag. Pause 2.96% 3.75% 4.88% 5.29%All Prosody 1.81% 2.11% 4.48% 4.82%
BoosTexter Pause 2.76% 3.40% 4.89% 5.30%All Prosody 2.28% 2.55% 4.60% 5.13%
test conditions. Moreover, the gains over pause-only models were significant at p < 10−45 andp < 10−99, respectively.
On the other hand, the boosting-based model was better than CART in modeling pauseinformation alone. These results were conformable with the results for the English meetingcorpus, where BoosTexter also handled the pause feature set better. The differences weresignificant at p < 0.001 and p < 10−7 for reference and ASR-based tests, respectively.
10.5.1.2 Results for RF Corpus
For the RF corpus, the best results were also achieved by the CART model with the richprosodic feature set. In reference test conditions, the CART model achieved BER = 4.48%(NIST = 66.27% and F = 56.81%). In ASR conditions, this model achieved BER = 4.82%(NIST = 70.21%, F = 53.77%). Using the Sign test, the difference between rich-prosodyCART and BoosTexter was significant at p < 0.001 in ASR conditions. On the other hand,the p-value of the same test in reference conditions was just 0.06. The two modeling approachesshowed similar results when only using the pause feature set.
The gaps between rich prosody and pause only CART models showed p-values 10−6 and10−8 for reference and ASR conditions, respectively. For BoosTexter, these p-values werelower: 0.001 and 0.05.
10.5.1.3 Result Comparison across Corpora
A comparison of relative error reductions with respect to the chance error rate indicates thatprosody-only models perform much better in the BN corpus than in the RF corpus. Expressedin percentages, these error reductions are 77.7% for BN REF, 73.7% for BN ASR, 34.2%for RF REF and 30.0% for RF ASR. Since broadcast news speech has more regular prosody,more accurate prosody-based predictions were expected for that data. In addition, I comparedthese error reductions with those obtained on the English meeting corpus. There, the chanceerror was reduced by 49.4% for REF and 40.1% for ASR. Thus, the prosody model was mostsuccessful for the Czech BN corpus, second most successful for the ICSI meetings, and leastsuccessful for the Czech RF corpus.
I also analyzed the improvements achieved by the rich prosody feature set in comparisonwith the pause-only feature set. Gain by adding prosody beyond pause is much more substan-tial for the BN corpus. The relative error reductions over using pauses alone are 38.8% and43.7% for human- and ASR-generated BN transcripts, while the relative reductions are just8.2% and 8.9% for the RF transcripts. These numbers also indicate that using rich prosody ismore helpful in ASR conditions.
We can also compare the results achieved by prosodic models with the earlier presented
128

10.5. SU Segmentation Based on Prosodic Information
Table 10.5: Prosodic feature usage for the BN corpus (“—” indicates that less than two features fromthe group appear in the overall feature set.)
Group Tot. Usage Two most used features in the group
Pause 26.9% pause.after (26.9%), —Duration 43.9% vowel.dur.last_1st.snorm (9.4%), word.dur (8.4%)Pitch 12.0% f0.logratio.pwl_last_baseline (12.0%), —Energy 6.3% f.RMS.max.norm (6.3%), —Near Pause 0.0% —Other 10.8% turn.is_end (10.8%), —
results of LMs (Table 10.3). Unlike the ICSI meetings, for which the prosody models outper-formed the language models only in ASR conditions, prosody models outperformed languagemodels in all four Czech test sets. However, the magnitudes of the differences varied acrossthe test sets. In comparison with the BERs by the LM, the BER by the prosody model waslower by 59.8% relative for BN REF, 56.5% for BN ASR, 8.2% for RF REF, and 8.0% for RFASR.
10.5.2 Prosodic Feature Usage
10.5.2.1 Prosodic Feature Usage for Czech Corpora
Similarly to Section 8.6.2, I also explored prosodic feature usage in decision trees. The usagerates for each group as well as the most used individual features are presented in Table 10.5(BN) and Table 10.6 (RF). In addition to the five feature groups from Chapter 8 (pause, dura-tion, pitch, energy, near pause), the group “other” is also represented here. While no featurefrom this group was selected for multi-channel meeting data, the feature called turn.is_endindicating speaker change was found to be very important for the single-channel broadcastdata.
The numbers for the BN corpus show that the most frequently queried feature group was“duration” followed by “pause”. The difference between these two groups is quite high – 17%absolute. The third most queried group was “pitch”, the fourth was “other”, and the fifth wasthe group of energy features. As contrated to meetings, near pause features were not selectedat all. The most used individual feature was pause after the current word. Other heavilyqueried features were the log ratio of the last stylized F0 value and the speaker’s F0 baseline,the speaker change flag, and the normalized duration of the last vowel in the current word.
For the RF corpus, the most frequently used feature groups were also “duration” and“pause”. The gap between the two groups was more prominent in the RF data – it was over38% absolute. The third most queried group was “energy”, the fourth was “other”, and thefifth was the group of pitch-related features. Although the near pause group had nonzero usagein this corpus, it was the least represented group again, taking up just 2.2%. The most usedindividual feature was duration of the current word, surpassing the pause after the currentword. Other heavily queried features were the speaker change flag and the feature capturingspeaker-normalized lengthening of the longest vowel in the current word.
A comparison of feature group usage between the two corpora is visualized in Fig. 10.1.The group of duration features prevails in both corpora, however, the two distributions vary.The difference is most prominently displayed in pausing features. The feature capturing pauseduration at the boundary of interest was more frequently queried in the BN corpus. Pausing innews speech is much more regular than in conversational speech; therefore, pause features are
129

Chapter 10. Sentence Unit Segmentation of Czech Corpora
Table 10.6: Prosodic feature usage for the RF corpus (“—” indicates that less than two features fromthe group appear in the overall feature set.)
Group Tot. Usage Two most used features in the group
Pause 14.7% pause.after (14.7%), —Duration 53.0% word.dur (16.5%), vowel.max_dur.snorm (6.0%)Pitch 9.1% f0.last.min (5.0%), f0.logratio.pwl_last_baseline (4.1%)Energy 11.5% f.RMS.max.norm (5.8%), f.RMS.min.norm (5.8%)Near Pause 2.2% p.pause.after (2.2%), —Other 9.4% turn.is_end (9.4%), —
Pause Duration Pitch Energy Near Pause Other0
10
20
30
40
50
60
Rel
ativ
e F
eatu
re U
sage
[%]
BNRF
Figure 10.1: Prosodic feature group usage for Czech corpora (BN and RF)
more reliable for that corpus. Another difference between the two distributions is the usageproportion of pitch and energy features. The BN corpus prefers pitch features, while the RFcorpus prefers energy features.
Variances in usage of individual features were the following. From the duration group, afeature that aims to capture segmental lengthening is the most important for the BN corpus,while the raw word duration feature is dominant for the RF corpus. The pitch group of the BNcorpus heavily use a feature reflecting the ratio between the last F0 value and the speaker’s F0
baseline. It suggests that radio anchors regularly mark statement boundaries with expressivepitch falls. This pitch feature was also important for the RF corpus, but an unnormalizedfeature capturing minimal F0 value in the last voiced region was used more. In both corpora,energy features were represented by normalized RMS values computed from the word followingthe boundary in question. These features reflect the fact that speakers typically start sentencesloudlier than they finish them.
I have also explored feature usage in the “pause-only” feature set. For the BN corpus, thepause after the current word had usage of 67.5%, while the pauses after the previous and thefollowing word had 1.9% and 1.0%, respectively. The remainder (29.6%) corresponded to thespeaker change feature. For the RF corpus, the pause after the current word takes in 48.4%.In contrast with BN, the pause after the preceding word was also largely used – 21.6% of thetotal usage. The pause after the following word showed usage 6.0% and the speaker changeflag 24.0%. A quick comparison of the two corpora indicates that in the BN corpus, we cando well with just using pause at the current boundary, while in the RF corpus, the other twopause features are also important when other prosodic features are not available.
130

10.5. SU Segmentation Based on Prosodic Information
10.5.2.2 Prosodic Feature Usage Comparison across Languages
It is not easy to make a direct comparison of prosodic feature usage between our Czech corporaand some similar English corpora because authors of parallel sentence segmentation studiesusually do not present relative usage of their prosodic features. An exception is [149], whereLiu shows the best performing features for HMM-based sentence segmentation of Englishbroadcast news and telephone conversations. For broadcast news, the most important featurewas the pause duration at the word boundary in question. As expected, the most used featureis identical with the most used feature for Czech BN, however, their relative usage percentagesdiffer. Liu reports the pause usage as 44.3%, while my Czech experiments showed the pauseusage only as 26.9%.
The next best prosodic features3 for English BN were reported as the normalized durationof the last rhyme in the word (17.7%), and the difference between last PWL F0 value andthe speaker’s baseline (4.5%). These two features capture the same phenomena as my mostused duration and F0 features, but their order is reversed in the feature ranking and theirrelative percentages largely vary. The comparison of particular numbers indicate that featurescapturing final lengthening are more important for English, while features capturing final pitchfall are more important for Czech. This finding is in agreement with the fact that Czech offersless opportunity for final lengthening because length also serves a lexical function in Czech.
In the comparison of prosodic feature usage between BN and CTS data, Liu concludes thatpitch plays a more important role for BN than for CTS, whereas phone and word durationis more important for CTS. This observation is in line with my findings regarding differencesbetween read-aloud and conversational Czech data.
Shriberg et al. reported a comparison of feature usage between English broadcast newsand Switchboard conversations only based on feature groups [49]. The differences betweenread-aloud and conversational speech in terms of feature group usage observed in that studywere once again similar to those I report here for Czech data – pitch and pause features4 weremore used in broadcast news, whereas duration features dominated in Switchboard.
While broadcast news speech have been studied for prosody-based sentence segmenta-tion extensively, much less is in this respect known about broadcast conversations since thisgenre has drawn attention of the speech technology community rather recently. To my bestknowledge, the only published study analyzing prosodic features for sentence segmentation ofbroadcast discussions is [192] by Cuendet et al. However, the way in which this study evaluatesprosodic features does not allow a direct comparison with my feature usage statistics.
The authors do not present feature usage of individual features in the overall set butcompare segmentation accuracy of systems using individual prosodic feature groups – duration,energy, pitch and pause. For energy and pitch features, the authors also looked at featuresubgroups – range, reset and slope. The error rates of individual feature subsets were comparedacross three genres, namely natural meetings, broadcast news, and broadcast conversations.The results revealed that in terms of sentence boundary cues, broadcast conversations standcloser to broadcast news than meetings. This finding cannot be confirmed nor refuted herebecause the variance between meetings and broadcast conversations observed in my thesis maynot only be caused by genre but also by language differences.
3In this cross-lingual comparison, I only take into account “pure” prosodic features, leaving out “other”features in the top feature rankings. Since the non-prosodic features cover different proportions in the comparedfeature sets, and these proportions are usually not reported, precise conclusions about “pure” prosodic featurescannot be drawn based on comparisons of the absolute usage numbers.
4Energy-based features were not used in this early study by Shriberg et al.
131

Chapter 10. Sentence Unit Segmentation of Czech Corpora
Table 10.7: SU segmentation error rates for models combining textual and prosodic features [BER %]
Model Used Features BN RF
REF ASR REF ASR
Chance — 8.11% 8.01% 6.81% 6.89%
HMM LM+Pause 2.18% 2.59% 3.61% 4.25%LM+Rich Prosody 1.44% 1.73% 3.44% 4.14%
MaxEnt LM+Pause 2.40% 2.78% 3.57% 4.27%LM+Rich Prosody 1.76% 2.07% 3.45% 4.16%
BoosTexter LM+Pause 1.85% 2.28% 3.58% 4.42%LM+Rich Prosody 1.42% 1.72% 3.56% 4.21%
10.6 SU Segmentation Using Both Textual and Prosodic In-formation
In this section, I present results of models that rely both on prosodic and textual information.For each modeling approach, I compare two types of models. The first combines the best LMs(different across the three approaches) with the pause-only models, whereas the second typeof models combines the same LMs with prosody models based on the richer feature set. Theerror rates for both Czech corpora are displayed in Table 10.7.
10.6.1 Results for BN Corpus
For the BN corpus, the best results were achieved by the BoosTexter model combining textualinformation with the rich prosody feature set. These results were BER = 1.42%, NIST =17.49%, F = 91.27% for REF test conditions and BER = 1.72%, NIST = 21.44%, F =89.19% for ASR conditions. However, the gap between BoosTexter and HMM using the samefeature sets was really tiny and statistically insignificant for both test conditions. On the otherhand, MaxEnt performed significantly worse than the other two approaches. Using the Signtest, the difference between MaxEnt and BoosTexter was significant at p < 10−6 for both testconditions. The difference between MaxEnt and HMM was significant at p < 10−7 for REFand at p < 10−8 for ASR.
The models with richer prosodic feature sets consistently outperform the models withpause information only. The improvements by adding rich prosody information are statisti-cally significant for all three employed modeling approaches and both test conditions. Thesignificance levels for REF conditions are p < 10−28, p < 10−17 and p < 10−13 for HMM, Max-Ent, and Boostexter, respectively. The corresponding significance levels for ASR conditionsare p < 10−35, p < 10−20 and p < 10−19.
Although the combined models with rich prosody outperform the combined models withpause-only prosody, the relative gains from using rich prosody are diminished in compari-son with the gains for the prosody-only classification presented in Table 10.4. The decreaseof improvement is smaller for Czech BN than for the English meetings, but it is still visible.Whereas the addition of prosodic features beyond pause reduces BER of the prosody-only clas-sification by 34.4% relative for BN REF and by 37.9% relative for BN ASR, the classificationby combined models is only improved by 23.2% and 32.6%, respectively.
132

10.6. SU Segmentation Using Both Textual and Prosodic Information
10.6.2 Results for RF Corpus
In the RF corpus, the best results were achieved by the combined HMM model employingthe rich prosodic feature set. The best model performed at BER = 3.44%, NIST = 49.50%,F = 74.48% for REF and BER = 4.14%, NIST = 60.06%, F = 68.59% for ASR testconditions. The second best results were obtained from the MaxEnt model. The MaxEntresults were basically identical with those of HMM. Even the BoosTexter model, which wasthe worst of the three modeling approaches, showed just insignificantly (p > 0.1) higher errorrates than the best HMM.
Same as in the BN corpus, the models with the rich prosodic features sets outperformedthe models only using pause information for prosody modeling. However, the improvementsby adding rich prosody information were much smaller for the RF corpus. For REF conditions,only HMM showed a clearly significant improvement (p < 0.01). The gain for MaxEnt wasonly “marginally” significant at p < 0.08, while the gain for BoosTexter was even clearlyinsignificant. On the other hand, BoosTexter was the only model displaying a clearly significantimprovement (p < 0.005) in ASR conditions. The improvements by the other two approachesonly showed p-values between 0.08 and 0.10.
Again, I observed that relative gains from using rich prosody for models relying bothon textual and prosodic cues are smaller than the gains for a prosody-only classification.This relative decrease of improvement for the RF corpus is much larger than for the BNcorpus. While the addition of prosodic features beyond pause reduced BER of the prosody-only classification by 8.2% relative for RF REF and by 8.9% for RF ASR, the classificationby the models combining textual and prosodic features was only improved by 4.9% and 2.7%relative, respectively.
10.6.3 Result Comparison across Corpora
The presented numbers relating to models combining textual and prosodic information showsome differences between BN and RF. BoosTexter was the best combined model for BN, whileHMM was the best for RF. However, the gaps among the three explored approaches were rathersmall for both corpora. The only exception was MaxEnt for BN, which showed significantlyworse results than the other approaches. These results of individual modeling approachessuggest that tight integration of prosodic and textual features is important for BN, while moreefficient language modeling as shown by the HMM approach is important for RF.
The results also indicate differences in the importance of using prosodic features beyondpause in the combined models. The additional prosodic features decreased BER by 23.2%relative for BN REF and by 32.6% relative for BN ASR, but they only reduced the error by4.9% relative for RF REF and by 2.7% relative for RF ASR.
Fig. 10.2 visualizes BERs in dependence on used knowledge sources for all three modelingapproaches. Individual graphs in the figure correspond to four Czech test sets on whichthe models were evaluated (BN REF, BN ASR, RF REF, and RF ASR). In the graphs,lines connect points corresponding to the same model in order to increase readability. Thegraphs show some interesting facts. For instance, two of the three models for the BN corpusshow a better performance when only using rich prosody than when using an LM plus pauseinformation. This finding is quite surprising. It shows how important the prosodic featuresbeyond pause are for sentence segmentation of broadcast news data. Unlike BN, the LM pluspause models consistently outperform the rich prosody models used on their own in the RFcorpus. In general, lexical cues are more important for spontaneous speech corpora, whichdisplay less regular prosodic marking of boundaries than planned speech corpora do.
133

Chapter 10. Sentence Unit Segmentation of Czech Corpora
Word−LM Best−LM Pause Prosody LM+Pau LM+Pros1
2
3
4
5
6
7
BN REF
BE
R [%
]
HMMMaxEntBoosTexter
Word−LM Best−LM Pause Prosody LM+Pau LM+Pros1
2
3
4
5
6
7
BN ASR
BE
R [%
]
HMMMaxEntBoosTexter
Word−LM Best−LM Pause Prosody LM+Pau LM+Pros
3.5
4
4.5
5
5.5
6
6.5RF REF
BE
R [%
]
HMMMaxEntBoosTexter
Word−LM Best−LM Pause Prosody LM+Pau LM+Pros
3.5
4
4.5
5
5.5
6
6.5RF ASR
BE
R [%
]
HMMMaxEntBoosTexter
Figure 10.2: SU segmentation error rates for individual models in dependence on used knowledgesources [BER %]
The differences among the results of the three modeling approaches are more visible inthe RF graphs. The hugest deviation is displayed in the LM-only tests in which the HMMapproach clearly outperforms the two others. Another notable deviation is in the results ofprosody-only tests in which we can see that the BoosTexter model is not good in handling therich prosody feature set on its own. This inferiority is more visible in ASR conditions.
10.7 Combination of All Three Modeling Approaches
Just as for the meeting data (cf. Section 8.8), I tried to combine HMM, MaxEnt, and Boos-Texter models into a single SU segmentation system. Thus, the resulting system combines notonly various knowledge sources but also various machine learning techniques. I only combinethe best performing models, i.e. those using both lexical and prosodic features. Again, twomodel combination methods were examined – simple majority voting and linear interpolation.The results for both Czech corpora are presented in Table 10.8. For a better illustration,the table compares the two combination approaches with the best results achieved by single-approach models – BoosTexter for BN REF and BN ASR, and HMM for RF REF and RFASR.
134

10.7. Combination of All Three Modeling Approaches
Table 10.8: SU segmentation error rates for a combination of HMM, MaxEnt, and BoosTexter [BER %]
Combination Approach BN RF
REF ASR REF ASR
Chance 8.11% 8.01% 6.81% 6.89%
Best Single Approach 1.42% 1.72% 3.44% 4.14%Majority Voting 1.35% 1.65% 3.23% 4.00%Linear Interpolation 1.27% 1.61% 3.22% 3.98%
10.7.1 Results for BN Corpus
The results on the BN corpus indicate that the model combination improves SU segmentationaccuracy. Of the two combination options, the linear interpolation worked better, however, thegain over the voting approach was only significant for tests on manual transcripts (p < 0.01).Overall, BER was decreased from 1.42% to 1.27% for BN REF, and from 1.72% to 1.61% forBN ASR. The Sign test showed that these improvements over the best single-approach modelare significant at p < 0.001 and at p < 0.02, respectively. In our other metrics, the best resultsof the combined models were evaluated as NIST = 15.63% and F = 92.30% for REF, andNIST = 20.09% and F = 90.02% for ASR conditions.
The interpolation weights for HMM, MaxEnt, and BoosTexter were estimated from devel-opment data using the EM algorithm. I got 0.33, 0.38, and 0.29 for BN REF, and 0.36, 0.36,and 0.28 for BN ASR. The estimated weights do not largely vary across the test conditionsand both weight distributions are not far from uniform. For illustration of the automaticsentence segmentation accuracy achieved by the best performing system, an example of anautomatically segmented BN transcript is shown in Appendix C.2.
10.7.2 Results for RF Corpus
The results for the RF corpus also indicate an improvement over the best single-approachmodel. Of the two combination options, the linear interpolation approach showed betterresults. However, the gain over the simple majority voting approach was statistically insignif-icant for both test conditions. The interpolation decreased BER from 3.44% to 3.22% for RFREF, and from 4.14% to 3.98% for RF ASR. The Sign test indicated that the gaps betweenthe best combined system and the best single-approach model were significant at p < 0.005and at p < 0.02 for the two test conditions, respectively. The best results correspond toNIST = 46.35% and F = 75.65% for RF REF, and NIST = 57.65% and F = 69.12% for RFASR.
The optimal interpolation weights for HMM, MaxEnt, and BoosTexter were determined bythe EM algorithm as 0.30, 0.39, and 0.31 for RF REF, and as 0.34, 0.32, and 0.34 for RF ASR.Again, the estimated weight distributions did not diverge far from the uniform distributions.An example of an automatically segmented RF transcript is presented in Appendix C.3.
10.7.3 Result Comparison across Corpora
The model combination approach helped relatively more for the BN corpus than for the RFcorpus. The relative error reductions by model interpolation were 10.6% for BN REF, 6.4%for BN ASR, 6.4% for RF REF, and 3.9% for RF ASR. Since the results by the interpolatedmodels are the best for all Czech test sets, I also used them to compare overall classificationaccuracy across the corpora. In terms of a relative BER reduction with respect to chance error
135

Chapter 10. Sentence Unit Segmentation of Czech Corpora
rate, my segmentation system was relatively most successful on BN REF (BER reduction by84.3%) followed by BN ASR (79.9%), RF REF (52.7%), and RF ASR (42.2%). Analogouscomparisons based on NIST error rates and F -measures show the results in the same order.
Furthermore, we can compare these relative BER reductions with those achieved for theICSI meeting corpus – 67.5% for ICSI REF and 55.3% for ICSI ASR. Thus, it is possible toconclude that of the three corpora explored in this thesis, the best results were achieved forthe Czech broadcast news, second best for the English multiparty meetings, and the relativelyworst results were obtained for the Czech broadcast conversations. However, this order doesnot necessarily imply that meetings represent an easier domain for automatic sentence segmen-tation of speech than broadcast conversations. There are two important facts that should betaken into account when interpreting the above presented numbers. First, the ICSI meetingdata contain a large number of backchannel DAs whose boundaries are relatively easier todetect. Second, the meetings are in English, which is an easier language for modeling thanCzech.
Finally, my results for BN can be confronted with those presented in [115] for SU boundarydetection in English BN data. Therein, the results are reported using the NIST error rate,which allows to make a performance comparison across tasks and corpora having differentevent priors. The lowest NIST error rates for English BN achieved by a combination of HMM,MaxEnt, and CRF were reported as 47.44% for REF and 57.23% for ASR (WER = 11.7%)conditions. These NIST error rates are much higher than those achieved for the Czech BNherein – NIST = 15.63% and NIST = 20.09%, respectively. Nevertheless, this comparisondoes not allow to claim that my Czech sentence segmentation system is better. The comparisonof the Czech BN MDE corpus and the English MDE corpus presented in Chapter 5 revealedthat the English data are more difficult since they contain a higher number of fillers and editdisfluencies.
10.8 Chapter Summary and Conclusions
In this chapter, I have explored automatic sentence unit segmentation of spoken Czech fromtwo different domains – broadcast news and broadcast conversations. As for the experimentswith English meeting data, I have examined three different modeling approaches: HMM,MaxEnt, and BoosTexter, and evaluated them on manual and automatic transcripts of thetwo corpora.
In language modeling, I not only employ simple word-based models, but also textual in-formation beyond word identities, as captured by automatically induced word classes andpart-of-speech tags. In addition, I investigated the possibility of using additional text re-sources that were not annotated for SUs but only contained standard punctuation. Prosodymodels were evaluated with two distinct feature sets – the first contained just pause-basedfeatures, while the other was a richer set also comprising features relating to duration, pitch,and energy. Features for the richer feature set were selected for each corpus separately.
The experiments with language models showed that the HMM model trained on the aux-iliary text corpus was by far the best single-source model for the BN corpus. On the otherhand, this feature set did not perform that well for the RF corpus, for which the best featureset was POSmix. However, when AuxWords were combined with other textual informationsources, they significantly improved segmentation performance also for the RF corpus.
In general, language models combining several textual knowledge sources worked betterthan models using just a single information source. For BN REF and BN ASR, the bestlanguage model was MaxEnt with Words+AIC+POSmix+AuxWords. For RF REF, the best
136

10.8. Chapter Summary and Conclusions
was HMM with Words+POSmix+AuxWords. The HMM model was also the best for RF ASR,but it performed slightly better when only using Words+AuxWords.
The next set of experiments focused on performance of prosodic models. For all four testsets, the best results for prosody-only classification were achieved by the CART-based modelusing the rich prosodic feature set. The prosodic features beyond pause were more helpfulfor the BN corpus which has a more regular prosodic marking of sentence boundaries. I alsoobserved that relative gain from the additional prosodic features was slightly larger in ASRconditions.
Prosodic feature usage analysis revealed that duration and pause feature groups were mostimportant for both corpora. However, the feature group usage distributions differed betweenthe two corpora. The difference was most prominently displayed in pausing features, whichwere more frequently queried in the BN corpus. Another difference between the two distri-butions was in the proportion of pitch and energy features. The BN corpus preferred pitchfeatures, while the RF corpus preferred energy features. For the BN data, I also compared myfeature usage with those reported for English BN. As expected, the most used feature (pauseduration at the boundary) was the same for both languages, however, its relative usage dif-fered. It was higher for English. A comparison of other most used features demonstrated thatfeatures capturing final lengthening were more important for English, while features capturingfinal pitch fall were more important for Czech. This finding is in agreement with the fact thatCzech offers less opportunity for final lengthening because length also serves a lexical functionin Czech.
Further, models relying on both lexical and prosodic cues were examined. BoosTexterwas the best modeling approach for BN, while HMM was the best for RF. The results ofindividual modeling approaches suggest that tight integration of prosodic and textual featuresis important for broadcast news data, while more efficient language modeling as shown bythe HMM approach is important for broadcast conversation data. However, the gaps amongthe three explored approaches were not very large. The results indicated differences in theimportance of using prosodic features beyond pause in the combined textual-prosodic models.Similarly to sentence segmentation only based on prosodic models, the additional prosodicfeatures were much more helpful for the BN corpus.
Overall, the best results for all test sets were achieved by a model that combines HMM,MaxEnt, and BoosTexter models via posterior probability interpolation. This result is inline with my results for English multiparty meetings, for which the interpolation model alsoshowed superior performance. Finally, I compared relative BER reductions with respect tochance across all three corpora used in this thesis. This comparison indicates that the highestchance error reduction was achieved for the Czech broadcast news corpus, the second highestfor the ICSI meeting corpus, and the relatively worst results were obtained for the Czechbroadcast conversation corpus.
137


Chapter 11
Conclusion
Success is not final, failure is not fatal:it is the courage to continue that counts.
Winston Churchill
This final chapter summarizes contributions of this thesis (Section 11.1), presents a thesissummary and main conclusions (Section 11.2), and proposes possible extensions and researchdirections for future work (Section 11.3).
11.1 Contributions
This section explicitly lists contributions of this thesis. They are categorized according to thelist of objectives presented in Chapter 4.
1. Two Czech speech corpora with structural annotation have been created – one in thedomain of broadcast news and the other in the domain of broadcast conversations. Theemployed annotation scheme creates boundaries between natural breakpoints in the flowof speech, flags non-content words for optional removal, and identifies sections of disfluentspeech. The original structural metadata annotation guidelines for English have been ad-justed to accommodate specific phenomena of Czech syntax. In addition to the necessarylanguage-dependent modifications, I have proposed some language-independent modifi-cations refining the original annotation scheme. Finally, I have performed a detailedanalysis of the metadata annotated corpora.
2. Automatic dialog act segmentation of English multiparty meetings has been investigated.Various textual and prosodic features have been explored for usefulness, and three mod-eling approaches (HMM, Maximum Entropy, and BoosTexter) have been compared. Inaddition to experiments in a speaker-independent fashion, I have also explored speakeradaptation of both prosodic and language models in this domain. Speaker adaptationfor sentence (or dialog act) segmentation of speech is a novel idea proposed in this thesis.
3. The first sentence segmentation system for spoken Czech has been developed. The systemhas been evaluated on the two Czech corpora created in Objective 1. Again, variousprosodic and textual features have been examined, and the three modeling approacheshave been compared.
139

Chapter 11. Conclusion
11.2 Summary and Main Conclusions
The work presented in the thesis can be divided into two major parts based on the type ofwork – Creation and analysis of data resources (Objective 1) and Development and evaluationof automatic systems for segmentation of speech into sentence-like units (Objective 2 and 3).The work on these two major parts is summarized in the two following subsections.
11.2.1 Creation and Analysis of Czech Data Resources
11.2.1.1 Corpus Design and Creation
Objective 1 is about creation of Czech speech corpora with appropriate annotation of sentence-like unit boundaries. The employed annotation scheme was based on the LDC’s “SimpleMetadata Annotation Specification”, which was originally defined for English. In order tomake this standard applicable to Czech, the original annotation guidelines have been ad-justed to accommodate specific phenomena of Czech syntax. I have also proposed a novelapproach to transcribing and annotating filled pauses in Czech, distinguishing vowel-like (EE)and consonant-like (MM ) sounds. In addition to the necessary language-dependent modifi-cations, I have proposed and applied some language-independent modifications refining theoriginal annotation scheme. The refinements included limited prosodic labeling at sentenceunit boundaries and distinction of two types of incomplete units.
Two Czech corpora with structural metadata annotation were created – one in the domainof broadcast news (BN) and the other in the domain of broadcast conversations (RF). Thefirst corpus has been created by enriching an existing corpus with the structural metadataannotation, while the second has been built from scratch – it had to be recorded and manuallytranscribed first. Besides their importance to automatic structural metadata extraction re-search, these corpora are also useful for training ASR systems as well as for linguistic analysisof read-aloud and spontaneous Czech.
11.2.1.2 Corpus Analysis
I have conducted a detailed comparison of the two Czech corpora in terms of structural meta-data statistics. The comparison revealed that, as expected, Czech broadcast conversationsrepresent a more difficult data for automatic metadata extraction than Czech broadcast newssince they contain significantly more disfluencies and fillers. I also found that reparanda andtheir corrections show differences in POS distributions in comparison with the general POSdistribution. For example, the relative proportion of nouns, pronouns, and prepositions ishigher in reparanda than in all data. On the other hand, verbs, adverbs, and adjectives arerelatively less frequent in reparanda.
Regarding SU symbols, I observed that clausal breaks were more frequent in the broadcastconversation corpus, which indicates that complex sentences are more common in talk showsthan broadcast news. Furthermore, the comparison showed that SUs in conversational datawere on average longer by 1.5 words.
Moreover, I also reported most frequent filler words in the two corpora. Statistics of filledpauses showed that EEs were much more frequent than MMs; more than 90% of all filledpauses were EEs. Another interesting observation was that discourse markers containing averb (such as English you know) are much less frequent in Czech than in English. The mostfrequent Czech discourse markers were tak (lit. so), no (well), and prostě (simply).
140

11.2. Summary and Main Conclusions
11.2.2 Development and Evaluation of Automatic Sentence SegmentationSystems
The other two objectives referred to the development of automatic systems for segmentation ofspeech into sentence-like units. The objective No. 2 was focused on DA segmentation of multi-party meetings from the ICSI meeting corpus and the objective No. 3 on sentence segmentationof the two Czech MDE corpora. Although the systems for Czech and English were trainedon different data, they share a common modeling groundwork. All sentence segmentation ex-periments were conducted on two types of speech transcripts – manual transcripts (referenceconditions) and automatically-generated transcripts (ASR conditions). Furthermore, I haveevaluated sentence segmentation accuracy achieved by models only relying on textual infor-mation, models only relying on prosodic information, and combined models relying on bothsources of information.
Since the experimental part of the thesis was manifold, its summary is divided into severalsections. The first section provides a brief description of the general segmentation system. Thefollowing three sections summarize results of experiments – speaker-independent experimentson English meetings, speaker-dependent experiments on the same corpus, and experimentson Czech corpora. The final section summarizes general findings learned from the describedexperiments.
11.2.2.1 General System Description
For either language, three modeling approaches have been examined – HMM, MaxEnt, andBoosTexter. All these approaches rely on both textual and prosodic features. The textualfeatures describe lexical patterns associated with sentence-external and sentence-internal in-terword boundaries. I use features capturing word identities, parts of speech, and automaticallyinduced word classes. The prosodic features for sentence segmentation of speech reflect breaksin temporal, intonational, and loudness contours in an utterance. In the approach I employin this thesis, prosodic features for automatic classification are extracted directly from thespeech signal based on time alignments from automatic speech recognition, without any needfor hand-labeling of prosodic events. A toolkit for the direct extraction of prosodic featureshas been implemented as part of this work.
11.2.2.2 Speaker-Independent Experiments on Multiparty Meetings in English
The work conducted on DA segmentation of meetings from the ICSI corpus can be dividedinto two parts – speaker-dependent and speaker-independent. The speaker-independent ex-periments had the following results. The best performing language modeling approach fortext-based DA segmentation was HMM combining words, POS, and AICs. The best perform-ing model for DA segmentation only based on prosodic information was bagged CART usinga rich prosodic feature set. An analysis of feature usage in decision trees revealed that themost frequently queried group of features was pause, followed by duration-related features andpitch-related features.
Models combining prosodic and lexical information clearly outperformed language andprosody models used on their own. A comparison of individual modeling approaches showedthat HMM and MaxEnt were superior in reference conditions, and MaxEnt was the bestin ASR conditions. The best overall results for both test conditions were achieved by acombination of HMM, MaxEnt, and BoosTexter based on linear interpolation of posteriorprobabilities. The overall results in ASR conditions also indicate that models trained on ASRdata slightly outperform their counterparts trained on human-generated transcripts. The best
141

Chapter 11. Conclusion
system achieved BER = 5.18%, NIST = 32.49%, F = 83.18% in reference conditions, andBER = 6.19%, NIST = 44.70%, F = 75.85% in ASR conditions.
11.2.2.3 Speaker-Dependent Experiments on Multiparty Meetings in English
These experiments examined speaker-specific prosodic and language modeling for DA segmen-tation of meetings. The method was evaluated on 20 frequent speakers with a wide range oftotal words available for speaker-dependent modeling. For prosodic models, it was found thatinterpolating the large, speaker-independent prosodic model with a much smaller prosodicmodel trained only on that talker’s speech yielded improvements for 6 of the 20 speakers inreference conditions, and for 16 of 20 the speakers in ASR conditions. The ASR conditionsshowed a higher number of improved speakers, but the improvements were relatively smaller.Overall results, summed over all 20 speakers, indicate a modest, yet statistically significantimprovement with respect to the speaker-independent model for both test conditions. Featureanalysis, while preliminary given the number of speakers, suggests that nonnative speakers maydiffer from native speakers in overall feature usage patterns associated with DA boundaries.
For speaker-adapted language models, improvements were found for 17 of the 20 speakersusing reference transcripts, and for 15 of the 20 speakers using automatic transcripts. Over-all, a statistically significant improvement over the baseline LM was achieved for both testconditions. For both types of speaker adaptation, improvements were achieved even for sometalkers who had only a relatively small amount of data available for adaptation. In addition,the relative error reduction achieved by speaker adaptation was not correlated with the amountof adaptation data.
11.2.2.4 Experiments on Czech Corpora
The last group of experiments focused on sentence segmentation of the two Czech corpora. Theexperimental setup was the same as for the speaker-independent experiments on the meetingdata. In contrast to the meeting experiments, I have also examined the possibility of usingauxiliary text resources not annotated for sentence-like unit boundaries but only containingstandard punctuation. The experiments with language models showed that the HMM modeltrained on the auxiliary text corpus was by far the best single-source model for the BN corpus.On the other hand, this feature set did not perform that well for the RF corpus. However,when auxiliary word features were combined with other textual information sources, theysignificantly improved segmentation performance also for the RF corpus.
For both Czech corpora, same as for the meeting corpus, the best results for prosody-only segmentation were achieved by the CART-based model with a rich prosodic feature set.A prosodic feature usage analysis showed that the feature group usage distributions differedbetween the two Czech corpora. The difference was most prominently displayed in pausingfeatures, which were more frequently queried in the BN corpus.
Of the models relying on both lexical and prosodic cues, BoosTexter was the best modelingapproach for BN, while HMM was the best for RF. Overall, the best results for all testsets were achieved by a model that combined HMM, MaxEnt, and BoosTexter models viaposterior probability interpolation. For the BN corpus, the best performing system achievedBER = 1.27%, NIST = 15.63%, F = 92.30% in reference conditions, and BER = 1.61%,NIST = 20.09%, F = 90.02% in ASR conditions. For the RF corpus, the best system achievedBER = 3.22%, NIST = 46.35%, F = 75.65% in reference conditions, and BER = 3.98%,NIST = 57.65%, F = 69.12% in ASR conditions. The results indicate that, as expected,broadcast conversations are more difficult for automatic sentence segmentation than broadcastnews.
142

11.2. Summary and Main Conclusions
11.2.2.5 General Findings
The performed experiments indicate several important findings. First, prosody represents avaluable knowledge source for automatic sentence segmentation of speech, both in English andCzech. Nevertheless, the importance of prosodic features varies across corpora. They wererelatively most beneficial for the Czech BN corpus, where professional newscasters usually payattention to proper prosodic marking of sentence boundaries. However, prosodic informationlargely reduced error also for other two corpora. Similarly, the gains from using rich prosodicfeature sets instead of only pause features differed corpus to corpus; they were the largest forthe BN corpus. Furthermore, feature analysis reveals that English and Czech slightly differin overall prosodic feature usage patterns. The experimental results also show that prosodicfeatures are less degraded by word recognition errors than textual features.
Textual features based on N -gram contexts are also important for sentence segmentationof speech. An increase in performance was achieved when word-based N -grams were com-bined with N -grams based on automatically induced classes and POS tags. Automatic classinformation was more helpful for English, while POS information was more helpful for Czech.As expected, language models were relatively more successful on English data since Czechrepresents a more complex language for language modeling. In addition, it was shown thattextual features are complementary to prosodic features. The models relying on both prosodicand textual features outperformed prosody-only and language-only models in all test sets.
An important part of this work was a comparison of three statistical modeling approachesto sentence segmentation of speech – HMM, MaxEnt, and BoosTexter. The experimentalresults indicate that there is no clear overall winner among the approaches since each ofthem was superior in some of the tests. On the other hand, a clear conclusion is that thebest performance is achieved when all these approaches are combined via posterior probabilityinterpolation. This model was superior in all tests in both languages, and all the improvementsover the best single approach model were statistically significant.
Of the individual modeling approaches, HMM showed most consistently good results. Inthe vast majority of tests, it produced best or close to best results. The only test in which thismethod did not perform very well was DA segmentation of meetings in ASR conditions. In thistest with the highest WER, the best model was MaxEnt. A tighter integration of prosodicand lexical knowledge was helpful for this particular data since BoosTexter also performedwell. On the other hand, the MaxEnt model had problems with the RF corpus because itslanguage model did not work well on this data. Apparently, its smoothing method was notable to efficiently deal with a higher out-of-vocabulary rate and lexical irregularities frequentin the RF corpus. The last approach, BoosTexter, was relatively most successful on CzechBN data where it was the best of the three approaches for both types of transcripts. On thecontrary, it worked rather poor on manual transcripts of the meeting corpus. As indicated bythe results of individual language models, this shortcoming was probably caused by the factthat the simpler BoosTexter’s language model was less effective on errorless manual Englishtranscripts. By contrast, the same model performed reasonably well on ASR hypotheses ofthe same transcripts, showing that a simpler lexical model may also be robust in the face ofword recognition errors.
The results of speaker-dependent experiments indicate that prosodic features beyond pauseinformation are helpful for a vast majority of speakers. In my tests, they provided benefit for19 of the 20 speakers studied. On the other hand, not all speakers benefited from speakeradaptation of prosodic and language models. Interestingly, improvements were achieved evenfor some talkers with relatively little data available for adaptation. The relative error reductionachieved by speaker adaptation was not correlated with the amount of adaptation data. Hence,
143

Chapter 11. Conclusion
I infer that speakers differ inherently in how similar they are to the generic speaker-independentmodel. Some talkers differ more and thus show more gain, even with less data.
11.3 Future Work
The work presented in this thesis suggests a number of extensions and future research direc-tions. One obvious direction is to examine possible gain from using other machine learningtechniques. Among others, support vector machines and conditional random fields have showngood success in many similar applications. In addition, the statistical models might be com-bined with some rules (either hand-crafted or induced from data) imposing constraints on theform of the extracted sentence-like segments. However, there arises a question how robustsuch rules would be in the face of ASR errors.
Another possible direction is to take into account ASR word confidences. Their inclusionwould allow to dynamically adjust relative weights of language and prosodic models. It mightbe helpful since it was shown that prosodic models are less degraded by ASR errors. For exam-ple, the language model weight could automatically be decreased for speech regions recognizedwith low confidence scores. Such a setup could especially be useful in domains for which ASRaccuracy is still rather poor.
Furthermore, the importance of additional classification features ought to be investigated.In prosody modeling, an interesting direction would be to explore longer-range features sinceonly local features have been employed so far. On the other hand, language models mightbenefit from using parsing features. These features should be generally helpful, but the problemis that the quality of speech parsing is largely affected by ASR errors, missing punctuation, anddisfluencies. Moreover, there is a kind of a circular problem: parsing features are important forsentence segmentation and sentence segmentation is important for parsing. Roark et al. [72]have solved this problem by using a hypothesis reranking approach, however, their approachalso has some limitations, such as impracticability in real-time applications. If reliable, parsingfeatures would probably benefit sentence segmentation for Czech more than English since thestandard N -gram models are less powerful for Czech because of the more flexible word order.
Moreover, employment of information sources beyond prosody and recognized words shouldbe examined. Given the recent progress in audio-visual speech processing, using visual cues tosentence segmentation represents a promising research direction. For example, TV broadcastdata offer a good opportunity for testing multimodal segmentation models.
The results of the speaker-dependent modeling experiments also motivate further research.An important unanswered question about prosodic adaptation is what factors predict whetherspeaker-dependent prosodic modeling will benefit a particular speaker. Prosodic adaptationdid not benefit all speakers and the absolute amount of data did not appear to be a good pre-dictor. Additional areas for further research include development of other adaptation methods,exploration of unsupervised adaptation approaches, and exploration of clustering of speakerssimilar in behavior, for greater model robustness. Future work should also investigate thepotential of speaker-specific modeling for other tasks in spoken language understanding.
For Czech, this thesis has only focused on automatic sentence boundary detection. How-ever, the rich MDE markup available for the two Czech corpora also enables research ofautomatic detection of other structural events. A variety of structural event detection tasksbeyond SU segmentation can be defined based on the MDE annotation scheme. A meaningfulextension of the segmentation task would be to not only look for SU boundaries, but also toautomatically label their types (statement/question/incomplete). Likewise, we can also trydifferent definitions of the detected boundary. For instance, we might only recognize sentence-
144

11.3. Future Work
like units delimited by the double slash SU symbols, or, on the contrary, segment speech intosmaller units with boundaries delimited by both sentence-external and sentence-internal SUbreaks.
SU boundary detection is one of the four subtask defined in the EARS MDE task. Thethree other subtasks defined by MDE are Filler word detection (identification of words used asFPs, DMs, or EETs), Edit word detection (identification of all the words within DelRegs), andInterruption point detection (identification of the interword locations at which fluent speechbecomes disfluent). All these subtasks can be evaluated using the two newly created Czech cor-pora. Future research on Czech metadata extraction may also include exploration of automaticdetection of events that are not among the MDE subtasks, such as Asides/Parentheticals.
The automatic detection of disfluencies and filler words mentioned in the previous para-graph is important for spontaneous speech where these events are frequent. On the otherhand, the task for the more regularly structured BN data may be extended in another way.In addition to automatic sentence segmentation, we could focus on automatic punctuationfrom speech, especially on automatic insertion of commas. Commas not only enhance hu-man readability, but also help downstream automatic processes, as was shown by some recentwork [193, 194]. I have already experimented with automatic punctuation for Czech broadcastnews [181], but this task should be explored more thoroughly for Czech. Note that Czechpunctuation is slightly different from that of English since Czech grammar has different (andmore strict) rules for using commas.
Finally, the impact of sentence segmentation on downstream automatic processes, such asPOS tagging, named entity tagging, speech summarization, and machine translation, shouldbe evaluated. This is very important since different applications may require input segmentedin a different way. The very recent work of Hillard [113] argues that when providing automaticsentence segmentation to downstream applications, performance can be improved when theautomatic sentence segmentation is optimized for downstream process performance rather thanfor sentence segmentation performance itself.
145


Appendix A
Annotation Tool for Czech MDE
In order to ease the MDE annotation process, a software tool – QAn (Quick Annotator) – wasdeveloped for the Czech MDE annotation task. Analogous to the English MDE tool [114], itenables to highlight relevant spans of text, play corresponding audio segment, and then recordannotation decisions with few mouse clicks or keystrokes. Moreover, it respects particularitiesof the Czech MDE task (data format, new MDE symbols, etc.). The tool was implemented byJan Švec.
The following screenshot not only displays the tool itself, but also serves as an example ofMDE annotated Czech data. In the screenshot, mouth noises are displayed in gray, DelRegsin green, corrections in black, EETs in blue green, DMs in dark brown, DRs in light brown,FPs in magenta, and SUs in red. Asterisks denote IPs.
147


Appendix B
List of Prosodic Features
This appendix presents a complete list of implemented prosodic features. Note that this is alist of all available features, not a list of features that were found to be useful for the sentencesegmentation task. Only the features referring to the current word are listed in the followingtable for the sake of brevity. In addition, all feature names may be prefixed by “p.” or ”c.”to indicate that they refer to the previous or the following word, rather than to the currentword. Thus, thrice as many features may be generated in total. The horizontal lines in thetable delimit individual feature groups (pause, duration, pitch, energy, and “other”).
Feature Name Description
pause.after Pause duration after current word
vowel.avg_dur Average duration of vowels in current wordvowel.avg_dur.norm Normalized average duration of vowels in current wordvowel.avg_dur.snorm Speaker-normalized average duration of vowels in current
wordvowel.avg_dur.var Mean variance of vowel durationvowel.dur.first_1st Duration of first vowel in current wordvowel.dur.first_1st.norm Normalized duration of first vowel in current wordvowel.dur.first_1st.snorm Speaker-normalized duration of first vowel in current
wordvowel.dur.first_1st.word_norm Duration of first vowel in current word normalized by
mean duration of all vowels in current wordvowel.dur.first_2nd Duration of second vowel in current wordvowel.dur.first_2nd.norm Normalized duration of second vowel in current wordvowel.dur.first_2nd.snorm Speaker-normalized duration of second vowel in current
wordvowel.dur.first_2nd.word_norm Duration of first vowel in current word normalized by
mean duration of all vowels in current word
149

Appendix B. List of Prosodic Features
Feature Name Description
vowel.dur.last_1st Duration of last vowel in current wordvowel.dur.last_1st.norm Normalized duration of last vowel in current wordvowel.dur.last_1st.snorm Speaker-normalized duration of last vowel in current
wordvowel.dur.last_1st.word_norm Duration of last vowel in current word normalized by
mean duration of all vowels in current wordvowel.dur.last_2nd Duration of penultimate vowel in current wordvowel.dur.last_2nd.norm Normalized duration of penultimate vowel in current
wordvowel.dur.last_2nd.snorm Speaker-normalized duration of penultimate vowel in
current wordvowel.dur.last_2nd.word_norm Duration of penultimate vowel in current word normal-
ized by mean duration of all vowels in current wordvowel.max_dur Duration of the longest vowel in current wordvowel.max_dur.norm Normalized duration of the longest vowelvowel.max_dur.snorm Speaker-normalized duration of the longest vowelvowel.max_dur.z Z-score of vowel.max_durvowel.med_dur Median duration of vowels in current wordvowel.med_dur.norm Normalized median duration of vowelsvowel.med_dur.snorm Speaker-normalized median duration of vowelsvowel.min_dur Duration of the shortest vowel in current wordvowel.min_dur.norm Normalized duration of the shortest vowelvowel.min_dur.snorm Speaker-normalized duration of the shortest vowel in cur-
rent wordvowel.min_dur.z Z-score of vowel.min_durvowel.75_dur 75% fractile of duration of vowels in current wordvowel.75_dur.norm 75% fractile of normalized duration of vowelsvowel.75_dur.snorm 75% fractile of speaker-normalized duration of vowelsword.dur Raw word durationword.dur.norm Normalized word durationword.dur.snorm Speaker-normalized word durationword.dur.last_rhyme Duration of last rhymeword.dur.last_rhyme.norm Normalized duration of last rhymeword.dur.last_rhyme.snorm Speaker-normalized duration of last rhyme
f0.baseline Speaker’s F0 baselinef0.max Max value of F0 in wordf0.mean Mean value of F0 in wordf0.min Min value of F0 in wordf0.first First value of raw F0 in wordf0.last Last value of raw F0 in word
150

Appendix B. List of Prosodic Features
Feature Name Description
f0.last.max F0 maximum in last voiced regionf0.last.min F0 minimum in last voiced regionf0.pwl_first First value of PWL F0 in wordf0.pwl_last Last value of PWL F0 in wordf0.diff.first__baseline Difference between f0.first and speaker’s baselinef0.diff.last__baseline Difference between f0.last and speaker’s baselinef0.diff.last__first Difference between f0.last of current and f0.first of fol-
lowing wordf0.diff.pwl_first__baseline Difference between f0.pwl_first and speaker’s baselinef0.diff.pwl_last__baseline Difference between f0.pwl_last and speaker’s baselinef0.diff.pwl_last__pwl_first Difference between f0.pwl_last of current and
f0.pwl_first of following wordf0.logdiff.first__baseline Log of f0.diff.first__baselinef0.logdiff.last__baseline Log of f0.diff.last__baselinef0.logdiff.last__first Log of f0.diff.last__firstf0.logdiff.pwl_first__baseline Log of f0.diff.pwl_first__baselinef0.logdiff.pwl_last__baseline Log of f0.diff.pwl_last__baselinef0.logdiff.pwl_last__pwl_first Log of f0.diff.pwl_last__pwl_firstf0.ratio.first__baseline Ratio of f0.first and speaker’s baselinef0.ratio.last__baseline Ratio of f0.last and speaker’s baselinef0.ratio.last__first Ratio of f0.last of current and f0.first of following wordf0.ratio.pwl_first__baseline Ratio of f0.pwl_first and speaker’s baselinef0.ratio.pwl_last__baseline Ratio of f0.pwl_last and speaker’s baselinef0.ratio.pwl_last__pwl_first Ratio of f0.pwl_last of current and f0.pwl_first of fol-
lowing wordf0.ratio.first_avg__baseline Ratio of average F0 in first voiced region and baselinef0.ratio.first_beg__baseline Ratio of F0 onset in first voiced region and baselinef0.ratio.first_end__baseline Ratio of F0 offset in first voiced region and baselinef0.ratio.first_max__baseline Ratio of F0 maximum in first voiced region and baselinef0.ratio.first_min__baseline Ratio of F0 minimum in first voiced region and baselinef0.ratio.last_avg__baseline Ratio of average F0 in last voiced region and baselinef0.ratio.last_beg__baseline Ratio of F0 onset in last voiced region and baselinef0.ratio.last_end__baseline Ratio of F0 offset in last voiced region and baselinef0.ratio.last_max__baseline Ratio of F0 maximum in last voiced region and baselinef0.ratio.last_min__baseline Ratio of F0 minimum in last voiced region and baselinef0.logratio.first__baseline Log of f0.ratio.first__baselinef0.logratio.last__baseline Log of f0.ratio.last__baselinef0.logratio.last__first Log of f0.ratio.last__firstf0.logratio.pwl_first__baseline Log of f0.ratio.pwl_first__baselinef0.logratio.pwl_last__baseline Log of f0.ratio.pwl_last__baseline
151

Appendix B. List of Prosodic Features
Feature Name Description
f0.logratio.pwl_last__pwl_first Log of f0.ratio.pwl_last__pwl_firstf0.slope.first First slope PWL F0 in wordf0.slope.last Last PWL F0 in wordf0.slope.diff.last__first Difference between f0.slope.last of current and
f0.slope.first of following word
RMS.max Max RMS in current wordRMS.max.norm Max RMS divided by mean RMS in current turnRMS.mean Mean RMS in current wordRMS.mean.norm Mean RMS divided by mean RMS in current turnRMS.min Min RMS in current wordRMS.min.norm Min RMS divided by mean RMS in current turnRMS.voiced.max Max voiced RMS in current wordRMS.voiced.max.norm Max voiced RMS divided by mean voiced RMS in current
turnRMS.voiced.mean Mean voiced RMS in current wordRMS.voiced.mean.norm Mean voiced RMS divided by mean voiced RMS in cur-
rent turnRMS.voiced.min Min voiced RMS in current wordRMS.voiced.min.norm Min voiced RMS divided by mean voiced RMS in current
turn
turn.is_begin Is word turn-initial? (speaker change before the word)turn.is_end Is word turn-final? (speaker change after the word)turn.speaker Speaker IDoverlap.n_overlap Number of words overlapping with current wordoverlap.spurt_end25 Number of “spurt ends” overlapping with current word
- boundary 25msoverlap.spurt_end50 Number of “spurt ends” overlapping with current word
- boundary 50msoverlap.spurt_intern25 Number of “spurt-internal” words overlapping with cur-
rent word - boundary 25msoverlap.spurt_intern50 Number of “spurt-internal” words overlapping with cur-
rent word - boundary 50msoverlap.spurt_start25 Number of “spurt starts” overlapping with current word
- boundary 25msoverlap.spurt_start50 Number of “spurt starts” overlapping with current word
- boundary 50msword.start Elapsed time from the beginning of current turn
152

Appendix C
Examples of AutomaticallySegmented Speech Transcripts
In this appendix, I present illustrative examples of speech transcripts automatically segmentedinto sentence-like units. Even though there is no audio available, I believe that readers may geta good notion how successful the automatic methods are. To present objective illustrations, Itried to find such regions of the test data for which the automatic system performs at similarerror rates as on the whole test set.
This appendix is organized as follows. There are three one-page sections with examples.Each of the sections represents one of the three corpora used in this thesis (English ICSImeetings, Czech BN, and Czech RF) and shows a pair of examples. In each pair, the firstexample illustrates an automatically segmented manual transcript (REF), and the second ex-ample illustrates an automatically segmented automatic transcript (ASR) that corresponds tothe same region of speech as the manual transcript. For each corpus, I also recapitulate overallperformance rates using all three metrics (BER, NIST, and F). In the examples, automaticdecisions are displayed as follows:
• Correctly placed boundaries are displayed in green: /.
• Insertion errors (false alarms) are displayed in red: /.
• Deletion errors (misses) are displayed in blue: /.
For the sake of readability, the first example starts at the beginning of the next page.
153

Appendix C. Examples of Automatically Segmented Speech Transcripts
C.1 ICSI Meeting Data
REF:(Overall performance rates – BER = 5.18%, NIST = 32.49%, F = 83.18%)
the the worst system still reduced the error rate by thirty three percent or something indevelopment set /. so /. so you know sort of everybody is doing things between /. wellroughly a third of the errors and half the errors being eliminated /. uh and varying ondifferent test sets /. and so forth /. so i think /. um /. it’s probably a good time to lookat what’s really going on /. and seeing if there’s a there’s a way to combine the best ideas /.while at the same time not blowing up the amount of uh resources used /. because that’sthat’s critical for this this test /. um uh /. the uh the- there were two systems that were putforth by a combination of of uh french telecom and alcatel /. and um /. they they differed insome respects /. but they e- them- one was called the french telecom alcatel system the otherwas called the alcatel french telecom system /. uh which is the biggest difference /. i think /.but but there’re there’re there’re some other differences too /. uh and and uh they both didvery well /. you know /. so um my impression is they also did very well on on the the uhevaluation set /. but um /. i i- we haven’t seen /. you’ve- you haven’t seen any final resultsfor that /. yeah /. there is a couple pieces to it /. there’s a spectral subtraction style piece itwas basically you know wiener filtering /. and then then there was some p- some modificationof the cepstral parameters where they /. yeah /. but some people have done exactly that sortof thing /. of of and the i mean it’s not to to look in speech only to try to m- to measure thesethings during speech /. that’s p- that’s not that uncommon /. but i- it- it /. so it looks likethey did some some uh reasonable things /.
ASR:(Overall performance rates – BER = 6.19%, NIST = 44.70%, F = 75.85%)
the the worst system still reduce their race by thirty three percent or something /. so it’sit’s /. so /. so you know so everybody is doing things between uh roughly thirty years /. andthe errors being eliminated uh and bearing on different s. /. and so forth /. so i think /. um /.it’s probably a good time to look at what’s really going on /. and see if there’s a there’s away to combine the best ideas /. swell same time not blowing up the amount of uh resourcesused /. because that’s that’s critical for this this test /. um uh of /. the uh they they weretwo systems that were put forth by combination of of uh france telecom and now could tell /.and um /. they they differed in some respects /. but they in one was called french telecom elktell system it was called up and tell francetelecom still kind of system uh what’s the biggestdifference i think /. but but there there there are some other differences too /. uh /. andand uh they both did very well /. you know /. so um /. my impression is they also did verywell on on the the uh evaluation set /. but um /. i i we haven’t seen /. if you haven’t seenany find ourselves /. there’s a couple pieces to it /. to suspect this attraction southeast isbasically you know wiener filter /. and then then there was some some modification of thecapsule parameters /. but some people have done exactly that sort of thing /. of i mean it’snot to to look in speech only try to measure these things during speeches /. but that’s notthat uncommon /. but it it still looks like he did some some uh reasonable things /.
154

C.2. Czech BN Data
C.2 Czech BN Data
REF:(Overall performance rates – BER = 1.27%, NIST = 15.63%, F = 92.30%)
zprávy /. jednání mezi mosteckou uhelnou a společností shd peel /. o osudu dolu kohinoor vmariánských radčicích trvalo dlouho do noci /. konkrétní informace o možnosti prodeje doluale budou zveřejněny až dopoledne /. uzavření kupní smlouvy je přitom hlavním požadavkemsedmačtyřiceti horníků kteří zůstávají už čtrnáctý den pod zemí z obavy před uzavřenímdolu a ztrátou zaměstnání /. poslanci by mohli už odpoledne zahájit volbu členů novérady české televize /. z předběžné dohody mezi poslaneckými kluby vyplývá že kandidátičssd a ods zřejmě obsadí v tomto mediálním orgánu sedm míst z devíti přičemž sociálnímdemokratům připadnou čtyři místa a ods tři /. lidovci a unionisté by pak podle této dohodymohli do rady české televize dosadit po jednom kandidátovi /. zatímco komunisté jsou ztéto hry pravděpodobně vyšachováni /. podle předsedy klubu ksčm vojtěcha filipa se alenevzdávají /. a své dva kandidáty i přesto navrhnou /. neveřejným zasedáním budou ve svéschůzi pokračovat senátoři /. projednají vládní materiál který vyhodnocuje činnost armádníchjednotek v zahraničí /. poté se horní parlamentní komora bude zabývat třemi zákony kterésouvisejí s reformou veřejné správy /. v praze budou demonstrovat lidé kterým dluží penízezkrachovalé kampeličky /. protest na hradčanském náměstí pořádá celostátní koordinačnícentrum postižených střadatelů družstevních záložen /. v praze také proběhne demonstraceza dodržování lidských práv v čečensku /. vystoupí na ní zástupci nevládních organizacípolitici i čečenští uprchlíci /. večer se pak uskuteční ekumenická bohoslužba za ukončení násilína severním kavkaze /.
ASR:(Overall performance rates – BER = 1.61%, NIST = 20.09%, F = 90.02%)
z trávy ER /. jednání mezi mosteckou uhelnou a s společností s hady peel o osudu dolukohinoor v mariánských radčicích trvalo dlouho do noci /. konkrétní informace o možnostiprodeje dolu ale budou zveřejněny až dopoledne /. uzavření kupní smlouvy je přitom hlavnímpožadavkem sedmačtyřiceti horníků kteří zůstávají už čtrnáctý den podzimní z obavy předuzavřením dolu a ztrátou zaměstnání /. a poslanci by mohli už odpoledne zahájit volbu členůnové rady české televize /. předběžné dohody mezi poslaneckými kluby vyplývá že kandidátičssd a ods zřejmě obsadí v tomto mediálním orgánu se do míst z devíti přičemž sociálnímdemokratům připadnout čtyři místa a ods tři /. lidovci a unionisté by pak podle této dohodymohli do rady české televize dosadit po jednom kandidátovi /. zatímco komunisté jsou ztéto hry pravděpodobně vyšachování /. podle předsedy klubu ksčm vojtěcha filipa se alenevzdávají /. a své dva kandidáty přesto navrhnou /. neveřejným zasedáním budou ve svéschůzi pokračovat senátoři /. projednají vládní materiál který vyhodnocuje činnost armádníchjednotek v zahraničí /. poté se horní parlamentní komora bude zabývat třemi zákony kterésouvisejí s reformou veřejné správy /. vzp /. v praze budou demonstrovat lidé kterýmdluží peníze zkrachovalé kampeličky /. protest na hradčanském náměstí pořádá celostátníkoordinační centrum postižených střadatelů družstevních záložen /. v praze také proběhnedemonstrace za dodržování lidských práv v čečensku /. vystoupí na ní zástupci nevládníchorganizací politici i čečenští uprchlíci /. večer se pak uskuteční ekumenická bohoslužba zaukončení násilí na severním kavkaze /.
155

Appendix C. Examples of Automatically Segmented Speech Transcripts
C.3 Czech RF Data
REF:(Overall performance rates – BER = 3.22%, NIST = 46.35%, F = 75.65%)
A: pojďme se zastavit u jiné věci /. ministr práce a sociálních věcí místopředseda čssd zdeněkškromach v sobotním právu vyjádřil názor že kdyby bylo po jeho bohatí by měli platit dosystému víc /. a i těch třicet sedum procent v pátém daňovém pásmu které se nepodařiloprosadit by pro pana ministra škromacha byla jen symbolika protože by tak státní rozpočetzískal jen necelou miliardu /. co říkáte takovému názoru jako předseda rozpočtového výborua taky jako křesťanský demokrat jemuž EE so- solidarita sou není cizí /.
B: ale oni přece ti bohatí platí víc /. třicet dva procent z velkého příjmu je samozřejměmnohem víc peněz než patnáct procent z malého příjmu /. a také daň z příjmu fyzických osobje jediná daň u nás která je progresivní /. která skutečně stoupá podle toho čím víc mátetím více platíte podle toho v jakém ste daňovém pásmu /. ale ta progresivita musí mít svojímíru /. kdybych MM extrapoloval vyjádření pana ministra škromacha tak bych samozřejměře- tak by se dalo říct že kdo bude že když se bude platit sto procent v nejvyšším daňovémpásmu tak se vybere nejvíc daní /. a to není pravda /. pak vám samozřejmě ti nejschopnějšíkteří jsou schopni EE vydělávat nejvíc a tím pádem také nejvíc přispívat /. prostě z takovéhosystému utečou /. EE my sme přesvědčeni že současná míra progrese která je mezi patnácti ažtřiceti dvěma procenty je míra progrese která je optimální /. a nechceme tu progresi zvyšovatprávě proto aby ti schopní neutíkali a nebyli do- demotivováni k tomu aby vytvářeli hodnoty /.
ASR:(Overall performance rates – BER = 3.98%, NIST = 57.65%, F = 69.12%)
A: pojďme zase jiné věci /. ministra práce a sociálních věcí místopředseda čssd zdeněkškromach v sobotním právu vyjádřil názor že kdyby bylo po jeho bohatí by měli platit dosystému HM s /. i těch třicet sedm procent v pátém daňovém pásmu které se nepodařiloprosadit by pro pana ministra škromacha dva jen symbolika protože by tak státní rozpočetzískal jen necelou miliardu /. co říkáte takovému názoru jako předseda rozpočtového výborua tak jako křesťanský demokrat jemuž jsou solidarita soud není cizí /.
B: ale MM oni přece ti bohatí platí víc /. třicet dva procent z velkého příjmu je samozřejměmnohem víc peněz než patnáct procent z malého příjmu /. a také daň z příjmu fyzických osobje jediná liberální u nás která je progresivní které skutečně stoupá podle toho čím víc o tétím více platíte podle toho v jakém jste daňovém pásmu /. ale ta progresivita musí mít svojimíru /. kdybych šel extrapolovat vyjádření pana ministra škromacha tak bych samozřejmě žeteď by se iluzí že výrobu nepodílí se bude platit sto procent nejvyšším daňovém pásmu kdese vybere víc víc /. denního /. to není pravda /. pak nám samozřejmě ti nejschopnější kteříjsou schopni /. a EE nevyděláváte nejvíc a tím pádem taky nejvíc přispívat prostě z takovéhosystému utečou /. my EE jsme přesvědčeni že současná míra progrese která je mezi patnáctiaž třiceti dvěma procenty je EE míra progrese která je optimální /. a nechceme tu progresizvyšovat právě proto aby ti schopní neutíkali nebyly demotivováni který by tvořili hodnoty /.
156

Bibliography
[1] D. Jones, F. Wolf, E. Gibson, E. Williams, E. Fedorenko, D. Reynolds, and M. Zissman,“Measuring the readability of automatic speech-to-text transcripts,” in Proc. Eurospeech, Geneva,Switzerland, 2003.
[2] J. G. Kahn, M. Ostendorf, and C. Chelba, “Parsing conversational speech using enhancedsegmentation,” in Proc. HLT-NAACL’04, Boston, MA, USA, 2004.
[3] S. Furui, T. Kikuchi, Y. Shinnaka, and C. Hori, “Speech-to-text and speech-to-speech summariza-tion of spontaneous speech,” IEEE Transaction on Speech and Audio Processing, vol. 12, no. 4,pp. 401–408, 2004.
[4] E. Matusov, D. Hillard, M. Magimai-Doss, D. Hakkani-Tür, M. Ostendorf, and H. Ney,“Improving speech translation with automatic boundary prediction,” in Proc. INTERSPEECH2007, Antwerp, Belgium, 2007.
[5] Z. Palková, Fonetika a fonologie češtiny (Phonetics and Phonology of Czech). Karolinum, 1997.
[6] I. Lehiste, “Perception of sentence and paragraph boundaries,” in Frontiers of Speech Communi-cation Research, 1979, pp. 191–201.
[7] M. Swerts, A. Wichmann, and R.-J. Beun, “Filled pauses as markers of discourse structure,” inProceedings of ICSLP 96, vol. 2, Philadelphia, USA, 1996.
[8] M. Swerts, “Prosodic features at discourse boundaries of different strength,” Journal of AcousticSociety of America, vol. 101, no. 1, pp. 514–521, 1997.
[9] P. Hansson, “Prosodic phrasing in spontaneous Swedish,” Travaux de l’institut de linguistique deLund, vol. 43, 2003.
[10] A. Fox, Prosodic Features and Prosodic Structure. Oxford University Press, 2000.
[11] A. Batliner, A. Buckow, H. Niemann, E. Nöth, and V. Warnke, “The prosody module,” inVERBMOBIL: Foundations of Speech-to-speech Translations, W. Wahlster, Ed. New York,Berlin: Springer, 2000, pp. 106–121.
[12] J. Psutka, L. Müller, J. Matoušek, and V. Radová, Mluvíme s počítačem česky (Speaking withComputer in Czech). Prague: Academia, 2006.
[13] X. Huang, A. Acero, and H. Hon, Spoken Language Processing. Prentice Hall PTR, 2001.
[14] I. Shafran, M. Ostendorf, and R. Wright, “Prosody and phonetic variability: Lessons learnedfrom acoustic model clustering,” in Proceedings of Workshop on Prosody in ASR. ISCA, 2001.
[15] M. Swerts, E. Strangert, and M. Heldner, “F0 declination in read-aloud and spontaneous speech,”in Proceedings of ICSLP 96, Philadelphia, USA, 1996.
[16] J. Vaissiere, “Language-independent prosodic features,” in Prosody: Models and Measurments.Springer, 1983, pp. 53–66.
[17] J. Hirschberg and C. Nakatani, “A prosodic analysis of discourse segments in direction-givingmonologues,” in Proceedings ACL, Santa Cruz, 1996, pp. 286–293.
[18] M. Oliveira, “Pitch reset as a cue for narrative segmentation,” in Proceedings of ProsodicInterfaces 2003, 2003.
157

Bibliography
[19] J. ’t Hart, R. Collier, and A. Cohen, A perceptual study of intonation. Cambridge UniversityPress, 1990.
[20] J. Ohala, “Prosody and phonology,” in Proceedings of International conference Speech Prosody,Nara, Japan, 2004.
[21] F. Daneš, Intonace a věta ve spisovné češtině (Intonation and sentence in standard Czech).Nakladatelství ČSAV, 1957.
[22] K. Silverman, M. Beckman, J. Pitrelli, M. Ostendorf, C. Wightman, P. Price, J. Pierrehumbert,and J. Hirschberg, “ToBI: A standard scheme for labeling prosody,” in Proceedings ICSLP’92,Banff, Canada, 1992.
[23] D. Oppermann and S. Berger, “What makes speech data spontaneous?” in Proceedings of ICPhS,San Francisco, 1999.
[24] E. Shriberg, “Preliminaries to a theory of speech disfluencies,” Ph.D. dissertation, University ofCalifornia, Berkeley, 1994.
[25] M. Honal and T. Schulz, “Correction of disfluencies in spontaneous speech using a noisy-channelapproach,” in Proceedings of EUROSPEECH, Geneva, Switzerland, 2003, pp. 2781–2784.
[26] E. Shriberg, “Disfluencies in Switchboard,” in Proceedings of ICSLP96, vol. addendum, Philadel-phia, USA, 1996, p. 11.
[27] M. Swerts, “Filled pauses as markers of discourse structure,” Journal of Pragmatics, vol. 30, pp.485–496, 1998.
[28] K. Bailey and F. Ferreira, “Do non-word disfluencies affect syntactic parsing?” in Proceedings ofITRW on Disfluency in Spontaneous Speech (DiSS’01), Edinburgh, Scotland, UK, 2001.
[29] H. H. Clark and J. F. Tree, “Using uh and um in spontaneous speaking,” Cognition, vol. 84, pp.73–111, 2002.
[30] J. Fox Tree, “The effect of false starts and repetitions on the processing of subsequent words inspontaneous speech,” Journal of Memory and Language, vol. 34, pp. 709–738, 1995.
[31] H. H. Clark and T. Wasow, “Repeating words in spontaneous speech,” Cognitive Psychology,vol. 37, pp. 201–242, 1998.
[32] M. Swerts and R. Geluykens, “Prosody as a marker of information flow in spoken discourse,”Language and speech, vol. 37, no. 1, pp. 21–43, 1994.
[33] A. Kiessling, R. Kompe, A. Batliner, H. Niemann, and E. Nöth, “Classification of boundariesand accents in spontaneous speech,” in Proc. of the 3rd CRIM / FORWISS Workshop, Montreal,Canada, 1996.
[34] E. Shriberg, “Phonetic consequences of speech disfluency,” in Proceedings of ICPhS ’99, SanFrancisco, CA, USA, 1999.
[35] B. Megyesi and S. Gustafson-Čapková, “Production and perception of pauses and their linguisticcontext in read and spontaneous speech in Swedish,” in Proceedings of ICSLP, Denver, USA,2002.
[36] J. Vaissiere, “Phonetic explanations for cross–linguistic prosodic similarities,” Phonetica, vol. 52,pp. 123–130, 1995.
[37] C. W. Wightman, S. Shattuck-Hufnagel, M. Ostendorf, and P. J. Price, “Segmental durations inthe vicinity of prosodic phrase boundaries,” Journal of the Acoustical Society of America, vol. 91,no. 3, pp. 1707–1717, 1992.
[38] M. Horne, E. Strangert, and M. Heldner, “Prosodic boundary strength in Swedish: Finallengthening and silent interval duration,” in Proceedings of the XIIIth ICPhS, Stockholm, Sweden,1995.
[39] M. Heldner and B. Megyesi, “Exploring the prosody-syntax interface in conversations,” inProceedings of 15th ICPhS, Barcelona, Spain, 2003.
158

Bibliography
[40] E. Strangert, “Speech chunks in conversation: Syntactic and prosodic aspects,” in Proceedings ofSpeech Prosody 2004, Nara, Japan, 2004.
[41] L. Yang, “Duration and pauses as phrasal and boundary marking indicators in speech,” inProceedings of 15th ICPhS, Barcelona, Spain, 2003, pp. 1791–1794.
[42] M. van Donzel and F. Koopmans, “Pausing strategies in discourse in Dutch,” in Proceedings ofICSLP96, Philadelphia, USA, 1996.
[43] M. van Donzel and F. J. Koopmans, “Perception of discourse boundaries and prominence inspontaneous Dutch speech,” Working papers 46, Lund University, 1997.
[44] F. Grosjean, “How long is the sentence? Prediction and prosody in the on-line processing oflanguage,” Linguistics, vol. 21, pp. 501–529, 1983.
[45] F. Grosjean and C. Hirt, “Using prosody to predict the end of sentences in English and French:Normal and brain-damaged subject,” Language and cognitive processes, vol. 11, no. 1-2, pp. 107–134, 1996.
[46] R. Carlson and M. Swerts, “Perceptually based prediction of upcoming prosodic breaks inspontaneous Swedish speech materials,” in Proceedings of 15th ICPhS, Barcelona, Spain, 2003.
[47] R. Carlson, J. Hirschberg, and M. Swerts, “Prediction of upcoming Swedish prosodic boundariesby Swedish and American listeners,” in Proc. od Speech Prosody 2004, Nara, Japan, 2004.
[48] M. Fach, “A comparison between syntactic and prosodic phrases,” in Proceedings of EURO-SPEECH, Budapest, Hungary, 1999.
[49] E. Shriberg, A. Stolcke, D. Hakkani-Tür, and G. Tür, “Prosody-based automatic segmentationof speech into sentences and topics,” Speech Communication, vol. 32, no. 1-2, pp. 127–154, 2000.
[50] G. K. Kanji, 100 Statistical Tests, 3rd ed. Sage Publications Ltd, 1999.
[51] M. Ostendorf and D. Hillard, “Scoring structural MDE: Towards more meaningful error rates,”in Proc. of EARS Rich Transcription Workshop, 2004.
[52] J. Makhoul, F. Kubala, R. Schwartz, and R. Weischedel, “Performance measures for informationextraction,” in Proc. DARPA Broadcast News Workshop, Herndon, 1999.
[53] M. Haase, W. Kriechbaum, G. Möhler, and G. Stenzel, “Deriving document structure fromprosodic cues,” in Proc. of EUROSPEECH 2001, Aalborg, Denmark, 2001.
[54] D. Wang, L. Lu, and H.-J. Zhang, “Speech segmentation without speech recognition,” in ICASSP2003, Hong Kong, 2003.
[55] D. Wang and S. Narayanan, “A multi–pass linear fold algorithm for sentence boundary detectionusing prosodic cues,” in Proceedings of ICASSP 2004, Montreal, Canada, 2004.
[56] M. Gavalda, “High performance segmentation of spontaneous speech using part of speech andtrigger word information,” in Proc. of 5th Conference on Applied Natural Language Processing,Washington D.C., USA, 1997.
[57] D. D. Palmer and M. A. Hearst, “Adaptive multilingual sentence boundary disambiguation,”Computational Linguistics, vol. 23, no. 2, pp. 241–267, 1997.
[58] D. Beeferman, A. Berger, and J. Lafferty, “Cyberpunc: A lightweight punctuation annotationsystem for speech,” in Proceedings of ICASSP, 1998, pp. 689–692.
[59] M. Stevenson and R.Gaizauskas, “Experiments on sentence boundary detection,” in Proc.NAACL, Seattle, USA, 2000.
[60] N. Gupta, S. Bangalore, and M. Rahim, “Extracting clauses for spoken language understandingin conversational systems,” in Proceedings of ICSLP 2002, 2002, pp. 361–364.
[61] S. Shieber and X. Tao, “Comma restoration using constituency information,” in Proceedings ofHLT-NAACL 2003, vol. Main papers, 2003, pp. 142–148.
159

Bibliography
[62] J. Mrozinski, E. Whittaker, P. Chatain, and S. Furui, “Automatic sentence segmentation of speechfor automatic summarization,” in Proc. IEEE ICASSP, Toulouse, France, 2006, pp. 981–984.
[63] Y. Lee, Y. Al-Onaizan, K. Papineni, and S. Roukos, “IBM spoken language translation system,”in Proc. TC-Star Workshop on Speech-to-Speech Translation, Barcelona, Spain, 2006.
[64] K. Takanashi, T. Maruyama, K. Uchimoto, and H. Isahara, “Identification of "sentences" inspontaneous Japanese,” in Proceedings of the ISCA & IEEE Workshop on Spontaneous SpeechProcessing and Recognition, Tokyo, Japan, 2003.
[65] C. Chelba and F. Jelinek, “Structured language modeling,” Computer Speech and Language,vol. 14, pp. 283–332, 2000.
[66] S. Mori, N. Itoh, and M. Nishimura, “An automatic sentence boundary detector based on astructured language model,” in Proceedings of ICSLP, Denver, Colorado, 2002, pp. 921–924.
[67] T. Oba, T. Hori, and A. Nakamura, “Sentence boundary detection using sequential dependencyanalysis combined with CRF-based chunking,” in Proc. INTERSPEECH 2006 - ICSLP,Pittsburgh, PA, USA, 2006.
[68] E. Shriberg and A. Stolcke, “Direct modeling of prosody: An overview of applications in automaticspeech processing,” in Proceedings of International Conference Speech Prosody 2004, Nara, Japan,2004.
[69] C. W. Wightman and M. Ostendorf, “Automatic labeling of prosodic patterns,” IEEE Transac-tions on Speech and Audio Processing, vol. 2, no. 4, pp. 469–481, 1994.
[70] S. Ananthakrishnan and S. Narayanan, “Combining acoustic, lexical, and syntactic evidence forautomatic unsupervised prosody labeling,” in Proc. INTERSPEECH 2006 - ICSLP, Pittsburgh,PA, USA, 2006.
[71] N. Veilleux, M. Ostendorf, and C. Wightman, “Parse scoring with prosodic information,” inProceedings of ICSLP, Banff, Canada, 1992.
[72] B. Roark, Y. Liu, M. Harper, R. Stewart, M. Lease, M. Snover, I. Shafran, B. Dorr, J. Hale,A. Krasnyanskaya, and L. Yung, “Reranking for sentence boundary detection in conversationalspeech,” in Proc. IEEE ICASSP, Toulouse, France, 2006.
[73] M. Dreyer and I. Shafran, “Exploiting prosody for PCFGs with latent annotations,” in Proc.Interspeech’07, Antwerp, Belgium, 2007.
[74] A. Stolcke, E. Shriberg, R. Bates, M. Ostendorf, D. Hakkani, M. Plauche, G. Tür, and Y. Lu,“Automatic detection of sentence boundaries and disfluencies based on recognized words,” inProceedings of ICSLP98, Sydney, Australia, 1998.
[75] Y. Liu, E. Shriberg, A. Stolcke, D. Hillard, M. Ostendorf, B. Peskin, and M. Harper, “TheICSI-SRI-UW metadata extraction system,” in Proc. of ICSLP, Jeju, Korea, 2004.
[76] D. Hillard, M. Ostendorf, A. Stolcke, Y. Liu, and E. Shriberg, “Improving automatic sentenceboundary detection with confusion networks,” in HLT/NAACL 04, Boston, USA, 2004.
[77] J. H. Kim and P. Woodland, “A combined punctuation generation and speech recognition systemand its performance enhancement using prosody,” Speech Communication, vol. 41, no. 4, pp.563–577, 2003.
[78] A. Batliner, R. Kompe, A. Kiessling, M. Mast, H. Niemann, and E. Nöth, “M = Syntax +Prosody: A syntactic–prosodic labelling scheme for large spontaneous speech databases,” SpeechCommunication, vol. 25, pp. 193–222, 1998.
[79] E. Schukat-Talamazzini, F. Gallwitz, S. Harbeck, and V. Warnke, “Rational interpolationof maximum likelihood predictors in stochastic language modeling,” in Proc. Eurospeech ’97,Rhodes, Greece, 1997, pp. 2731–2734.
[80] V. Warnke, R. Kompe, H. Niemann, and E. Nöth, “Integrated dialog act segmentation andclassification using prosodic features and language models,” in Proc. Europeech 97, Rhodes,Greece, 1997.
160

Bibliography
[81] A. Batliner, E. Nöth, J. Buckow, R. Huber, V. Warnke, and H. Niemann, “Duration featuresin prosodic classification: Why normalization comes second, and what they really encode,” inITRW on Speech recognition and understanding, Red Bank, NJ, USA, 2001, pp. 23–28.
[82] F. Gallwitz, Integrated Stochastic Models for Spontaneous Speech Recognition, ser. Studien zurMustererkennung. Berlin, Germany: Logos Verlag, 2002.
[83] F. Gallwitz, H. Niemann, E. Nöth, and V. Warnke, “Integrated recognition of words and prosodicphrase boundaries,” Speech Communication, vol. 36, no. 1–2, 2002.
[84] C. Chen, “Speech recognition with automatic punctuation,” in Proc. of EUROSPEECH,Budapest, Hungary, 1999, pp. 447–450.
[85] Y. Gotoh and S. Renals, “Sentence boundary detection in broadcast speech transcripts,” inProceedings of ISCA workshop Challenges for the New Millenium (ASR-200), Paris, France,2000.
[86] H. Christensen, Y. Gotoh, and S. Renals, “Punctuation annotation using statistical prosodymodels,” in Proc. of ISCA Workshop on Prosody in Speech Recognition and Understanding, RedBank, NJ, USA, 2001.
[87] A. Srivastava and F. Kubala, “Sentence boundary detection in Arabic speech,” in Proceedings ofEUROSPEECH 2003, Geneva, Switzerland, 2003.
[88] Y. Liu, A. Stolcke, E. Shriberg, and M. Harper, “Comparing and combining generative andposterior probability models: Some advances in sentence boundary detection in speech,” in Proc.EMNLP, Barcelona, Spain, 2004.
[89] ——, “Using conditional random fields for sentence boundary detection in speech,” in Proc. ACL,Ann Arbor, MI, USA, 2005.
[90] M. Tomalin and P. C. Woodland, “Discriminatevely trained Gaussian mixture models for sentenceboundary detection,” in Proc. IEEE ICASSP, Toulouse, France, 2006, pp. 549–552.
[91] S. Young, G. Evermann, M. J. F. Gales, T. Hain, X. Liu, G. Moore, J. Odell, D. Ollason,D. Povey, V. Valtchev, and P. C. Woodland, “The HTK book (for HTK version 3.4),”http://htk.eng.cam.ac.uk, 2006.
[92] M. Zimmermann, D. Hakkani-Tur, J. Fung, N. Mirghafori, L. Gottlieb, E. Shriberg, and Y. Liu,“The ICSI+ multilingual sentence segmentation system,” in Proc. INTERSPEECH 2006 - ICSLP,2006, pp. 117–120.
[93] R. Schapire, “The boosting approach to machine learning: An overview,” in Proc. of MSRIWorkshop on Nonlinear Estimation and Classification, 2002.
[94] E. Matusov, A. Mauser, and H. Ney, “Automatic sentence segmentation and punctuationprediction for spoken language translation,” in Proc. International Workshop on Spoken LanguageTranslation, Kyoto, Japan, 2006.
[95] F. Batista, D. Caseiro, N. Mamede, and I. Trancoso, “Recovering punctuation marks forautomatic speech recognition,” in Proc. INTERSPEECH, Antwerp, Belgium, 2007.
[96] K. Shitaoka, K. Uchimoto, T. Kawahara, and H. Isahara, “Dependency structure analysis andsentence boundary detection in spontaneous Japanese,” in Proceedings of the 20th internationalconference on Computational Linguistics, Geneva, Switzerland, 2004.
[97] Y. Akita, M. Saikou, H. Nanjo, and T. Kawahara, “Sentence boundary detection of spontaneousJapanese using statistical language model and support vector machines,” in Proc. INTER-SPEECH 2006 - ICSLP, Pittsburgh, PA, USA, 2006.
[98] V. Radová, J. Psutka, L. Müller, W. Byrne, J. V. Psutka, P. Ircing, and J. Matoušek, “CzechBroadcast News Speech and Transcripts,” Linguistic Data Consortium, CD-ROM LDC2004S01and LDC2004T01, Philadelphia, PA, USA, 2004.
161

Bibliography
[99] J. Psutka, V. Radová, L. Müller, J. Matoušek, P. Ircing, and D. Graff, “Large broadcast news andread speech corpora of spoken Czech,” in Proceedings of EUROSPEECH. Aalborg, Denmark:ISCA, 2001, pp. 2067–2070.
[100] J. Psutka, J. Hajič, and W. Byrne, “The development of ASR for Slavic languages in theMALACH project,” in IEEE ICASSP 2004, Montreal, Canada, 2004.
[101] Linguistic Data Consortium, “Guidelines for RT-04 transcription (version 3.1),” http://projects.ldc.upenn.edu/Transcription/rt-04/RT-04-guidelines-V3.1.pdf.
[102] M. Meeter, “Dysfluency annotation stylebook for the Switchboard corpus,”ftp://ftp.cis.upenn.edu/pub/treebank-/swbd/doc/DFL-book.ps, 1995.
[103] P. Heeman, “Speech repairs, intonational boundaries and discourse markers: Modeling speakers’utterances in spoken dialogs,” Ph.D. dissertation, University of Rochester, New York, 1997.
[104] O. Müllerová, Mluvený text a jeho syntaktická výstavba (The Syntax of Spoken Text). Praha:Academia, 1994.
[105] S. Strassel, “Simple metadata annotation specification V6.2,” http://www.ldc.upenn.edu/Projects/MDE/Guidelines/SimpleMDE_V6.2.pdf, 2004.
[106] S. Strassel, D. Miller, K. Walker, and C. Cieri, “Shared resources for robust speech-to-texttechnology,” in Proc. EUROSPEECH 2003, Geneva, Switzerland, 2003.
[107] Y. Liu, E. Shriberg, A. Stolcke, B. Peskin, J. Ang, D. Hillard, M. Ostendorf, M. Tomalin,P. Woodland, and M. Harper, “Structural metadata research in the EARS program,” in Proc.IEEE ICASSP, Philadelphia, USA, 2005.
[108] K. Svoboda, Souvětí spisovné češtiny (Compound Sentences in Standard Czech). SPN Praha,1970.
[109] M. Grepl and P. Karlík, Skladba češtiny (Syntax of Czech). Votobia, 1998.
[110] M. Grepl, Z. Hladká, M. Jelínek, P. Karlík, M. Krčmová, M. Nekula, Z. Rusínová, and D. Šlosar,Příruční mluvnice češtiny (Handbook of Czech grammar), P. Karlík, M. Nekula, and Z. Rusínová,Eds. Lidové noviny, 2003.
[111] M. Erard, “Just like, er, words, not, um, throwaways,” New York Times, vol. (Jan 3, 2004), 2004,available from http://www.speech.sri.com/press/nyt-jan03-2004.html.
[112] P. Kaderka and Z. Svobodová, “Manuál pro přepisovatele televizních diskusních pořad �u (Guide-lines for annotators of broadcast discussions),” Jazykovědné aktuality, no. 3-4, pp. 18–51, 2006.
[113] D. Hillard, “Automatic sentence structure annotation for spoken language processing,” Ph.D.dissertation, University of Washington, Seattle, WA, USA, 2008.
[114] K. Maeda and S. Strassel, “Annotation tools for large-scale corpus development: Using AGTKat the Linguistic Data Consortium,” in Proc. LREC 2004, Lisbon, Portugal, 2004.
[115] Y. Liu, E. Shriberg, A. Stolcke, D. Hillard, M. Ostendorf, and M. Harper, “Enriching speechrecognition with automatic detection of sentence boundaries and disfluencies,” IEEE Transactionson audio, speech, and language processing, vol. 14, no. 5, pp. 1526–1540, 2006.
[116] R. Artstein and M. Poesio, “Inter-coder agreement for computational linguistics,” ComputationalLinguistics, To Appear.
[117] J. Carletta, “Assessing agreement on annotation tasks: The kappa statistic,” ComputationalLinguistics, vol. 22, no. 2, pp. 249–254, 1996.
[118] D. Spoustová, J. Hajič, J. Votrubec, P. Krbec, and P. Květoň, “The best of two worlds:Cooperation of statistical and rule-based taggers for Czech,” in Proc. of the ACL Workshopon Balto-Slavonic Natural Language Processing, Prague, Czech Republic, 2007.
[119] D. Baron, “Prosody-based automatic detection of punctuation and interreption events in the ICSIMeeting Recorder corpus,” Research project, University of California, Berkeley, USA, 2002.
162

Bibliography
[120] J. Buckow, V. Warnke, R. Huber, A. Batliner, E. Nöth, and H. Niemann, “Fast and robust featuresfor prosodic classification,” in Proceedings of TSD’99 Mariánské Lázně. Berlin: Springer, 1999,pp. 193–198.
[121] D. Talkin, “A robust algorithm for pitch tracking (RAPT),” in Speech Coding and Synthesis.Amsterdam, Netherlands: Elsevier Science, 1995, pp. 495–518.
[122] P. C. Bagshaw, “Automatic prosodic analysis for computer aided pronunciation teaching,” Ph.D.dissertation, The University of Edinburgh, Scotland, UK, 1994.
[123] K. Sönmez, L. Heck, M. Weintraub, and E. Shriberg, “A lognormal tied mixture model of pitchfor prosody-based speaker recognition,” in Proceedings of EUROSPEECH’97, Rhodes, Greece,1997, pp. 1391–1394.
[124] C. d’Alessandro and P. Mertens, “Automatic pitch contour stylization using a model of tonalperception,” Computer Speech and Language, vol. 9, pp. 257–288, 1995.
[125] D. Hirst and R. Espesser, “Automatic modelling of fundamental frequency using a quadraticspline function,” Travaux de l’Institut de Phonétique d’Aix, vol. 15, pp. 75–85, 1993.
[126] D. Hirst, A. di Cristo, and R. Espesser, “Levels of representation and levels of analysis for thedescription of intonation systems,” in Prosody: Theory and Experiment, M. Horne, Ed. KluwerAcademic Press, 2000.
[127] K. Sönmez, E. Shriberg, L. Heck, and M. Weintraub, “Modeling dynamic prosodic variation forspeaker verification,” in Proceedings of ICSLP, Sydney, Australia, 1998, pp. 3189–3192.
[128] W. Press, B. Flannery, S. Teukolsky, and W. Vetterling, Numerical Recipes in C. CambridgeUniversity Press, 1992.
[129] T. Rietveld and P. Vermillion, “Cues for perceived pitch register,” Phonetica, vol. 60, pp. 261–272,2003.
[130] E. Shriberg, A. Stolcke, and D. Baron, “Observations on overlap: Findings and implicationsfor automatic processing of multi-party conversation,” in Proc. EUROSPEECH’01, Aalborg,Denmark, 2001.
[131] R. Kneser and H. Ney, “Improved backing-off for M-gram language modeling,” in Proc. ICASSP,Detroit, MI, 1995.
[132] S. Chen and J. Goodman, “An empirical study of smoothing techniques for language modeling,”Harvard University, USA, Tech. Rep., 1998.
[133] I. Witten and T. Bell, “The zero-frequency problem: Estimating the probabilities of novel eventsin adaptive text compression,” IEEE Transactions on Information Theory, vol. 37, no. 4, pp.1085–1094, 1991.
[134] C. Manning and H. Schütze, Foundations of Statistical Natural Language Processing, 2nd ed.MIT Press, 2000.
[135] F. Jelinek, Statistical Methods for Speech Recognition. The MIT Press, 1998.
[136] D. Jurafsky and J. H. Martin, Speech and Language Processing, 2nd ed. Prentice Hall, 2008.
[137] A. Stolcke and E. Shriberg, “Automatic linguistic segmentation of conversational speech,” inProc. ICSLP, Philadelphia, PA, USA, 1996.
[138] A. Stolcke, “SRILM – An extensible language modeling toolkit,” in Proc. ICSLP’02, Denver, CO,USA, 2002.
[139] L. Breiman, J. Friedman, R. Ohlsen, and C. Stone, Classification and Regression Trees. PacificGrove, CA: Wadsworth and Brooks Inc., 1984.
[140] R.-H. Li and G. Belford, “Instability of decision tree classification algorithms,” in Proceedingsof the 8th ACM SIGKDD International Conference on Knowledge Discovery and Data Mining,Edmonton, Canada, 2002.
163

Bibliography
[141] L. Breiman, “Bagging predictors,” Machine learning, vol. 24, no. 2, pp. 123–140, 1996.
[142] Y. Liu, N. Chawla, M. Harper, E. Shriberg, and A. Stolcke, “A study in machine learning fromimbalanced data for sentence boundary detection in speech,” Computer Speech and Language,vol. 20, pp. 468–494, 2006.
[143] W. Buntime and R. Caruana, “Introduction to IND version 2.1 and recursive partitioning,” MoffetFields, CA, USA, 1992.
[144] A. Berger, S. A. Della Pietra, and V. J. Della Pietra, “A maximum entropy approach to naturallanguage processing,” Computational Linguistics, vol. 22, no. 1, pp. 39–71, 1996.
[145] H. Daumé III, “Notes on CG and LM-BFGS optimization of logistic regression,” 2004, paperavailable at http://pub.hal3.name\#daume04cg-bfgs, implementation available at http://hal3.name/megam/.
[146] D. C. Liu and J. Nocedal, “On the limited memory method for large scale optimization,”Mathematical Programming B, vol. 45, no. 3, pp. 503–528, 1989.
[147] A. Ratnaparkhi, “Maximum entropy models for natural language ambiguity resolution,” Ph.D.dissertation, University of Pennsylvania, Philadelphia, PA, USA, 1998.
[148] A. Berger and R. Miller, “Just-in-time language modelling,” in Proc. ICASSP98, Seattle, WA,USA, 1998.
[149] Y. Liu, “Structural event detection for rich transcription of speech,” Ph.D. dissertation, PurdueUniversity, W. Lafayette, IN, USA, 2004.
[150] R. Schapire and Y. Singer, “BoosTexter: A boosting-based system for text categorization,”Machine Learning, vol. 39, no. 2–3, pp. 135–168, 2000.
[151] J. Kolář, E. Shriberg, and Y. Liu, “Using prosody for automatic sentence segmentation of multi-party meetings,” Lecture Notes in Computer Science (Proc. TSD’06), vol. 4188, pp. 629–636,2006.
[152] S. Cuendet, “Model adaptation for sentence unit segmentation from speech,” IDIAP, Martigny,Switzerland, Tech. Rep. IDIAP-RR 06-64, 2006.
[153] A. Niculescu-Mizil and R. Caruana, “Obtaining calibrated probabilities from boosting,” in Proc.21st Conference on Uncertainty in Artificial Intelligence (UAI ’05), Edinburgh, Scotland, UK,2005.
[154] S. Armstrong, A. Clark, G. Coray, M. Georgescul, V. Pallotta, A. Popescu-Behs, D. Portabella,M. Rajman, and M. Starlander, “Natural language queries on natural language data: A databaseof meeting dialogues,” in Proc. NLDB, Burg/Cottbus, Germany, 2003.
[155] A. Waibel, M. Bett, F. Metze, K. Ries, T. Schaaf, T. Schultz, H. Soltau, H. Yu, and K. Zechner,“Advances in automatic meeting record creation and access,” in Proc. IEEE ICASSP, Salt LakeCity, UT, USA, 2001.
[156] A. Janin, D. Baron, J. Edwards, D. Ellis, D. Gelbart, N. Morgan, B. Peskin, T. Pfau, E. Shriberg,A. Stolcke, and C. Wooters, “The ICSI meeting corpus,” in IEEE ICASSP 2003, Hong Kong,2003.
[157] E. Shriberg, R. Dhillon, S. Bhagat, J. Ang, and H. Carvey, “The ICSI meeting recorder dialogact (MRDA) corpus,” in Proc. 5th SIGdial Workshop on Discourse and Dialogue, Boston, MA,USA, 2004, pp. 97–100.
[158] R. Dhillon, S. Bhagat, H. Carvey, and E. Shriberg, “Meeting recorder project: Dialog act labelingguide,” ICSI, Berkeley, CA, USA, Tech. Rep. TR-04-002, 2004.
[159] D. Baron, E. Shriberg, and A. Stolcke, “Automatic punctuation and disfluency detection in multi-party meetings using prosodic and lexical cues,” in Proceedings of ICSLP, Denver, USA, 2002,pp. 949–952.
164

Bibliography
[160] J. Ang, Y. Liu, and E. Shriberg, “Automatic dialog act segmentation and classification inmultiparty meetings,” in Proc. IEEE ICASSP 2005, Philadelphia, USA, 2005.
[161] M. Zimmermann, Y. Liu, E. Shriberg, and A. Stolcke, “A* based joint segmentation andclassification of dialog acts in multi-party meetings,” in Proceedings of ASRU’05, San Juan,Puerto Rico, 2005.
[162] M. Zimmermann, A. Stolcke, and E. Shriberg, “Joint segmentation and classification of dialogacts in multiparty meetings,” in Proc. IEEE ICASSP 2006, Toulouse, France, 2006.
[163] S. Cuendet, D. Hakkani-Tür, and G. Tur, “Model adaptation for sentence segmentation fromspeech,” in Proc. IEEE SLT 2006, Aruba, 2006.
[164] A. Stolcke, B. Chen, H. Franco, V. R. R. Gadde, M. Graciearena, M.-Y. Hwang, K. Kirchhoff,A. Mandal, N. Morgan, X. Lei, T. Ng, M. Ostendorf, K. Sönmez, A. Venkataraman, D. Vergyri,W. Wang, J. Zheng, and Q. Zhu, “Recent innovations in speech-to-text transcription at SRI-ICSI-UW,” IEEE Transactions on Audio, Speech, and Language Processing, vol. 14, no. 5, 2006.
[165] P. Brown, V. D. Pietra, P. de Souza, J. Lai, and R. Mercer, “Class-based n-gram models ofnatural language,” Computational Linguistics, vol. 18, no. 4, pp. 467–479, 1992.
[166] T. Brants, “TnT – A statistical part-of-speech tagger,” in Proc. ANLP2000, Seattle, WA, USA,2000.
[167] J.-L. Gauvain and C.-H. Lee, “Maximum a posteriori estimation for multivariate Gaussianmixture obsevation of Markov chains,” IEEE Transaction on Speech and Audio Processing, vol. 2,no. 2, pp. 291–298, 1994.
[168] M. Gales, “Maximum likelihood linear transformations for HMM-based speech recognition,”Computer Speech and Language, vol. 12, pp. 75–98, 1998.
[169] M. Ostendorf and N. Veilleux, “A hierarchical stochastic model for automatic prediction ofprosodic boundary locations,” Computational Linguistics, vol. 20, no. 1, pp. 27–54, 1994.
[170] A. Hirst and A. D. Cristo, Eds., Intonation Systems. Cambridge University Press, 1998.
[171] R. Kneser, J. Peters, and D. Klakow, “Language model adaptation using dynamic marginals,” inEurospeech 97, Rhodes, Greece, 1997.
[172] K. Seymore and R. Rosenfeld, “Using story topics for language model adaptation,” in Proc.Eurospeech 97, Rhodes, Greece, 1997.
[173] R. Gretter and G. Riccardi, “On-line learning of language models with word error probabilitydistributions,” in Proc. ICASSP’01, Salt Lake City, UT, USA, 2001.
[174] T. Niesler and D. Willett, “Unsupervised language model adaptation for lecture speechtranscription,” in ICSLP, Denver, CO, USA, 2002.
[175] H. Nanjo and T. Kawahara, “Unsupervised language model adaptation for lecture speechrecognition,” in Proc. ISCA and IEEE Workshop on Spontaneous Speech Processing andRecognition, Tokyo, Japan, 2003.
[176] J. R. Bellegarda, “Statistical language model adaptation: Review and perspectives,” SpeechCommunication, vol. 42, pp. 93–108, 2004.
[177] S. Besling and H.-G. Meier, “Language model speaker adaptation,” in Proc. EUROSPEECH ’95,Madrid, Spain, 1995.
[178] Y. Akita and T. Kawahara, “Language model adaptation based on PLSA of topics and speakers,”in Proc. INTERSPEECH 04-ICSLP, Jeju, Korea, 2004.
[179] G. Tur and A. Stolcke, “Unsupervised language model adaptation for meeting recognition,” inProc. IEEE ICASSP, Honolulu, HI, 2007.
[180] J. Psutka, P. Ircing, J. Hajič, V. Radová, J. V. Psutka, W. J. Byrne, and S. Gustman, “Issues inannotation of the Czech spontaneous corpus in the MALACH project,” in Proceedings of LREC2004, Lisbon, Portugal, 2004.
165

Bibliography
[181] J. Kolář, J. Švec, and J. Psutka, “Automatic punctuation annotation in Czech broadcast newsspeech,” in Proc. Intl. Conf. Speech and Computer - SPECOM´2004, St. Petersburg, Russia,2004.
[182] J. Kolorenč, “Automatic punctuation of automatically recognized speech,” in Proc. ESSV 2005,ser. Studientexte zur Sprachkommunikation, vol. 36, Prague, Czech Republic, 2005, pp. 291–297.
[183] A. Pražák, L. Müller, J. V. Psutka, and J. Psutka, “Live TV subtitling: Fast 2-pass LVCSRsystem for online subtitling,” in Proc. 2nd International Conference on Signal Processing andMultimedia Applications, SIGMAP 2007, Barcelona, Spain, 2007.
[184] J. Zelinka, J. Kanis, and L. Müller, “Automatic transcription of numerals in inflectionallanguages,” Lecture Notes in Computer Science, vol. 3658, pp. 326–333, 2005.
[185] A. Venkataraman and W. Wang, “Techniques for effective vocabulary selection,” in Proc.Eurospeech’03, Geneva, Switzerland, 2003.
[186] P. Krbec, P. Podveský, and J. Hajič, “Combination of a hidden tag model and a traditional n-grammodel: A case study in Czech speech recognition,” in Proc. Eurospeech’03, Geneva, Switzerland,2003.
[187] I. Shafran and K. Hall, “Corrective models for speech recognition of inflected languages,” in Proc.EMNLP, Sydney, Australia, 2006.
[188] J. Švec, F. Jurčíček, and L. Müller, “Input parameterization of the HVS semantic parser,” LectureNotes in Computer Science, vol. 4629, pp. 415–422, 2007.
[189] J. Hajič, J. Panevová, E. Hajičová, P. Sgall, P. Pajas, J. Štěpánek, J. Havelka, and M. Mikulová,“Prague Dependency Treebank 2.0,” Linguistic Data Consortium, CD-ROM LDC2006T01,Philadelphia, PA, USA, 2006.
[190] R. Sedláček, “Morphemic analyser for Czech,” Ph.D. dissertation, Masaryk University, Brno,Czech Republic, 2004.
[191] A. Taylor, M. Marcus, and B. Santorini, The Penn Treebank: An Overview. Kluwer, 2003, ch. 1,pp. 5–22.
[192] S. Cuendet, E. Shriberg, B. Favre, J. Fung, and D. Hakkani-Tür, “An analysis of sentencesegmentation features for broadcast news, broadcast conversations, and meetings,” in Proc. SIGIR2007 SSCS workshop, Amsterdam, The Netherlands, 2007.
[193] D. Hillard, Z. Huang, R. Grishman, D. Hakkani-Tür, M. Harper, M. Ostendorf, and W. Wang,“Impact of automatic comma prediction on POS/name tagging of speech,” in Proc. of IEEE/ACLWorkshop on Spoken Language Technology (SLT), Aruba, 2006.
[194] B. Favre, R. Grishman, D. Hillard, H. Ji, D. Hakkani-Tür, and M. Ostendorf, “Punctuatingspeech for information extraction,” in Proc. IEEE ICASSP’08, Las Vegas, NV, USA, 2008.
166

List of Publications
Publications in English:
1. KOLÁŘ, J.: “A comparison of language models for dialog act segmentation of meetingtranscripts,” In Lecture Notes in Computer Science (TSD 2008), 2008, Vol. 5246, pp. 117–124,ISSN 0302-9743.
2. KOLÁŘ, J.; ŠVEC, J.: “Structural metadata annotation of speech corpora: Comparingbroadcast news and broadcast conversations,” In Proc. of the 6th International Conference onLanguage Resources and Evaluation (LREC’08), Marrakech, Morocco, 2008, ISBN 2-9517408-4-0.
3. KOLÁŘ, J.; LIU, Y.; SHRIBERG, E.: “Speaker adaptation of language models for automaticdialog act segmentation of meetings,” In Proc. INTERSPEECH 2007, Antwerp, Belgium, 2007,pp. 1621–1624, ISSN 1990-9772.
4. KOLÁŘ, J.; SHRIBERG, E.; LIU, Y.: “On speaker-specific prosodic models for automatic dialogact segmentation of multi-party meetings,” In Proc. INTERSPEECH 2006, Pittsburgh, PA, USA,2006, pp. 2014–2017, ISSN 1990-9772.
5. KOLÁŘ, J.; SHRIBERG, E.; LIU, Y.: “Using prosody for automatic sentence segmentationof multi-party meetings,” In Lecture Notes in Computer Science (TSD 2006), 2006, Vol. 4188,pp. 629–636, ISSN 0302-9743.
6. KOLÁŘ, J.; ŠVEC, J.; STRASSEL, S.; WALKER, CH.; KOZLÍKOVÁ, D.; PSUTKA, J.: “Czechspontaneous speech corpus with structural metadata,” In Proc. INTERSPEECH 2005, Lisbon,Portugal, 2005, pp. 1165–1168, ISSN 1018-4074.
7. STRASSEL, S.; KOLÁŘ, J.; SONG, Z.; BARCLAY, L.; GLENN, M.: “Structural metadataannotation: Moving beyond English,” In Proc. INTERSPEECH 2005, Lisbon, Portugal, 2005,pp. 1545–1548, ISSN 1018-4074.
8. KOLÁŘ, J.; ŠVEC, J.; PSUTKA, J.: “Automatic punctuation annotation in Czech broadcastnews speech,” In Proc. Speech and Computer - SPECOM´2004, Saint-Petersburg, Russia, 2004,pp. 319–325, ISBN 5-7452-0110-X.
9. KOLÁŘ, J.; ROMPORTL, J.; PSUTKA, J.: “The Czech speech and prosody database both forASR and TTS purposes,” In Proc. EUROSPEECH 2003, Geneva, Switzerland, 2003, pp. 1577–1580, ISSN 1018-4074.
10. KOLÁŘ, J.; MÜLLER, L.: “The application of Bayesian Information Criterion in acoustic modelrefinement,” In Proc. ECMS 2003, Liberec, Czech Republic, 2003, pp. 44–48, ISBN 807083708X.
Publications in Czech:
11. KOLÁŘ, J.: “Anotace strukturálních metadat ve spontánní mluvené češtině (Annotation ofstructural metadata in spontaneous spoken Czech),” In Proc. Čeština v mluveném korpusu 2007,Praha, Czech Republic, 2008, ISBN 978-80-7106-982-9 [In Press].
167

List of Publications
Citations:1
The publication No. 3 was cited in:
• H. op den Akker, C. Schulz, “Exploring Features and Classifiers for Dialogue ActSegmentation,” in Lecture Notes in Computer Science (MLMI’08), vol. 5237, 2008,pp. 196–207, ISSN 0302-9743.
The publication No. 5 was cited in:
• L. Xie, “Discovering salient prosodic cues and their interactions for automatic storysegmentation in Mandarin broadcast news,” in Multimedia Systems, vol. 14, no. 4,2008, pp. 237–253, ISSN 0942-4962.
The publication No. 8 was cited in:
• Y. Liu, E. Shriberg, A. Stolcke, D. Hillard, M. Ostendorf, and M. Harper,“Enriching speech recognition with automatic detection of sentence boundariesand disfluencies,” IEEE Transactions on Audio, Speech and Language Processing,vol. 14, no. 5, 2006, pp. 1526–1540, ISSN 1558-7916.
• M. Zimmermann, D. Hakkani-Tür, J. Fung, N. Mirghafori, L. Gottlieb, E. Shriberg,and Y. Liu, “The ICSI+ multilingual sentence segmentation system,” in Proc. IN-TERSPEECH 2006 - ICSLP, Pittsburgh, PA, USA, 2006, pp. 117–120, ISSN 1990-9772.
• J. Kolorenč, “Automatic punctuation of automatically recognized speech,” inStudientexte zur Sprachkommunikation (ESSV 2005), vol. 36, 2005, pp. 291–297,ISSN 0940-6832.
1Only citations in which the citing and cited paper do not have any author in common are listed.
168