Automatic procedure for mass and charge identification of light isotopes detected in CsI(Tl) of the...
9
Automatic procedure for mass and charge identification of light isotopes detected in CsI(Tl) of the GARFIELD apparatus L. Morelli a , M. Bruno a , G. Baiocco a , L. Bardelli b , S. Barlini b , M. Bini b , G. Casini b , M. D’Agostino a, , M. Degerlier c , F. Gramegna c , V.L. Kravchuk a,c , T. Marchi d,c , G. Pasquali b , G. Poggi b a Dipartimento di Fisica dell’Universit a and INFN, Bologna, Italy b Dipartimento di Fisica dell’Universit a and INFN, Firenze, Italy c INFN, Laboratori Nazionali di Legnaro, Italy d Dipartimento di Fisica dell’Universit a, Padova, Italy NUCL-EX Collaboration article info Article history: Received 18 January 2010 Received in revised form 1 March 2010 Accepted 5 March 2010 Available online 15 March 2010 Keywords: Inorganic scintillators Light ions Response function Pulse-shape identification Calibration abstract Mass and charge identification of light charged particles detected with the 180 CsI(Tl) detectors of the GARFIELD apparatus is presented. A ‘‘tracking’’ method to automatically sample the Z and A ridges of ‘‘Fast–Slow’’ histograms is developed. An empirical analytic identification function is used to fit correlations between Fast and Slow, in order to determine, event by event, the atomic and mass numbers of the detected charged reaction products. A summary of the advantages of the proposed method with respect to ‘‘hand-based’’ procedures is reported. & 2010 Elsevier B.V. All rights reserved. 1. Introduction The availability of 4p multi-detectors [1–3] provides the opportunity for studying very complex nuclear phenomena and events associated to small cross-sections. The price to be paid, however, comes in form of a vast amount of multi-dimensional data, which need to be calibrated before obtaining physical correlations. The calibration of the measured signals can be quite man- power and time consuming, for several reasons: the large number of detecting elements covering the labora- tory solid angle, different detectors (ionization chambers, drift chambers, semiconductors, scintillators) can be used in experiments, each requiring an ‘‘ad hoc’’ procedure, the rich variety of nuclear species produced in the reaction in a wide energy rang. New semi-automatic methods are therefore required to perform a comprehensive data calibration and analysis in a reasonable amount of time. We recall hereafter the scheme of the usually employed procedures to identify (A,Z) isotopes, which do not rely on the ‘‘brute force’’, even more time-consuming, approach like graphical cuts. Two steps are normally necessary for each detector used in the experiment (for instance when the (A, Z) identification is performed through Fast–Slow [4]) or via DEE residual [5]): (1) In a bidimensional scatter plot several points are ‘‘by hand’’ sampled on the ridges of well defined isotopes. Some isotopes can be easily identified by simple inspection, either due to their abundance ( 4 He) or their separation from other masses ( 1,2,3 H). Charge, mass and coordinates of the sampled points are organized in a table. (2) The parameters characterizing the detector response to the charge (Z) and mass (A) are determined by fitting the coordinates of the previously sampled points. If an analytical [5], even empirical [6] function, describing one of the two variables as a function of the other does not exist, the set of points for a given isotope (A, Z) are fitted one by one via polynomial functions [4,7]. The fit parameters are stored in a table. Once the identification function is determined, by studying the ridges, therefore the most probable correlations, the event by event identification can be performed. For all the measured ARTICLE IN PRESS Contents lists available at ScienceDirect journal homepage: www.elsevier.com/locate/nima Nuclear Instruments and Methods in Physics Research A 0168-9002/$ - see front matter & 2010 Elsevier B.V. All rights reserved. doi:10.1016/j.nima.2010.03.099 Corresponding author. E-mail address: [email protected] (M. D’Agostino). Nuclear Instruments and Methods in Physics Research A 620 (2010) 305–313
Transcript of Automatic procedure for mass and charge identification of light isotopes detected in CsI(Tl) of the...

ARTICLE IN PRESS
Nuclear Instruments and Methods in Physics Research A 620 (2010) 305–313
Contents lists available at ScienceDirect
Nuclear Instruments and Methods inPhysics Research A
0168-90
doi:10.1
� Corr
E-m
journal homepage: www.elsevier.com/locate/nima
Automatic procedure for mass and charge identification of light isotopesdetected in CsI(Tl) of the GARFIELD apparatus
L. Morelli a, M. Bruno a, G. Baiocco a, L. Bardelli b, S. Barlini b, M. Bini b, G. Casini b, M. D’Agostino a,�,M. Degerlier c, F. Gramegna c, V.L. Kravchuk a,c, T. Marchi d,c, G. Pasquali b, G. Poggi b
a Dipartimento di Fisica dell’Universit �a and INFN, Bologna, Italyb Dipartimento di Fisica dell’Universit�a and INFN, Firenze, Italyc INFN, Laboratori Nazionali di Legnaro, Italyd Dipartimento di Fisica dell’Universit�a, Padova, Italy
NUCL-EX Collaboration
a r t i c l e i n f o
Article history:
Received 18 January 2010
Received in revised form
1 March 2010
Accepted 5 March 2010Available online 15 March 2010
Keywords:
Inorganic scintillators
Light ions
Response function
Pulse-shape identification
Calibration
02/$ - see front matter & 2010 Elsevier B.V. A
016/j.nima.2010.03.099
esponding author.
ail address: [email protected] (M. D’Agosti
a b s t r a c t
Mass and charge identification of light charged particles detected with the 180 CsI(Tl) detectors of the
GARFIELD apparatus is presented. A ‘‘tracking’’ method to automatically sample the Z and A ridges of
‘‘Fast–Slow’’ histograms is developed. An empirical analytic identification function is used to fit
correlations between Fast and Slow, in order to determine, event by event, the atomic and mass
numbers of the detected charged reaction products. A summary of the advantages of the proposed
method with respect to ‘‘hand-based’’ procedures is reported.
& 2010 Elsevier B.V. All rights reserved.
1. Introduction
The availability of 4p multi-detectors [1–3] provides theopportunity for studying very complex nuclear phenomena andevents associated to small cross-sections. The price to be paid,however, comes in form of a vast amount of multi-dimensionaldata, which need to be calibrated before obtaining physicalcorrelations.
The calibration of the measured signals can be quite man-power and time consuming, for several reasons:
�
the large number of detecting elements covering the labora-tory solid angle, � different detectors (ionization chambers, drift chambers,semiconductors, scintillators) can be used in experiments,each requiring an ‘‘ad hoc’’ procedure,
� the rich variety of nuclear species produced in the reaction in awide energy rang.
New semi-automatic methods are therefore required to perform acomprehensive data calibration and analysis in a reasonableamount of time.
ll rights reserved.
no).
We recall hereafter the scheme of the usually employedprocedures to identify (A,Z) isotopes, which do not rely on the‘‘brute force’’, even more time-consuming, approach like graphicalcuts.
Two steps are normally necessary for each detector used in theexperiment (for instance when the (A, Z) identification isperformed through Fast–Slow [4]) or via DE�Eresidual [5]):
(1)
In a bidimensional scatter plot several points are ‘‘by hand’’sampled on the ridges of well defined isotopes. Some isotopescan be easily identified by simple inspection, either due totheir abundance (4He) or their separation from other masses(1,2,3H). Charge, mass and coordinates of the sampled pointsare organized in a table.(2)
The parameters characterizing the detector response to thecharge (Z) and mass (A) are determined by fitting thecoordinates of the previously sampled points. If an analytical[5], even empirical [6] function, describing one of the twovariables as a function of the other does not exist, the set ofpoints for a given isotope (A, Z) are fitted one by one viapolynomial functions [4,7]. The fit parameters are stored in atable.Once the identification function is determined, by studying theridges, therefore the most probable correlations, the event byevent identification can be performed. For all the measured

ARTICLE IN PRESS
Fig. 1. (Color online) Fast–Slow bidimensional plots of a GARFIELD sector for the
reaction 32S+58Ni 16.5 AMeV incident energy. For a better presentation in some of
the panels Fast and Slow have been scaled by the reported factor.
L. Morelli et al. / Nuclear Instruments and Methods in Physics Research A 620 (2010) 305–313306
events, isotopes are identified in mass and charge, by minimizingthe distance of the measured signals with respect to the valuesprovided by the identification function, calculated with theparameters of the hit detector.
Clearly, in the case of a large number of detectors/telescopes,the most time consuming step of the identification procedure isthe first one, because of the accurate sampling of a huge numberof points on each isotope branch needed to obtain in the secondstep a reliable set of parameters. However, [6], even the efforts toanalytically link the employed variables are of great importance,to make it possible to identify isotopes which cannot be sampled,because of their low statistics (e.g. in backward-angle detectors).
Our aim is to improve both the previous steps, in order togreatly reduce, for a large number of detectors, the time dedicatedto offline calibration with respect to methods based on graphicalcuts or ‘‘by hand’’ sampling procedures.
In this paper we present a new procedure, developed in theROOT framework [11], aimed at extracting from Fast–Slowcomponents coming from CsI(Tl) scintillators mass and chargeof the detected Light Charged Particles (LCP, Zr2) and Fragments.The ROOT powerful set of software tools uses object orientedprogramming and provides the user with several methods ofdisplaying and analyzing data.
We will show that our procedure, compared with othermethods, considerably saves time without loss of precision.
We present here the application of our identification proce-dure to data collected in experiments performed by the Nucl-excollaboration [12] at the Tandem-Alpi complex of LNL (LaboratoriNazionali di Legnaro) with the GARFIELD apparatus [2]. Theseexperiments have been performed after the completion of theupgrading to digital electronics; in this way, without the need ofadding complicated and costly analog channels, we could obtainthe Fast–Slow components from the CsI(Tl) by means of ADC-Digital Signal Processor (DSP) boards [8,9] which processed theelectric signals directly fed by the charge preamplifiers.
2. The experiment
In this paper we show the results of the identificationprocedure firstly applied to the data coming from the reaction32S+58Ni at 16.5 AMeV incident energy. At the end, we show theapplication of the same procedure to data of other measuredreactions. For all the reactions the energy range of the measuredparticles and fragments extends from very low values up to150 MeV.
The main detector of the GARFIELD apparatus consists on twogas chambers with microstrip readout, followed by CsI(Tl)scintillators [2], for a total of 180 telescopes made of DE gaseousdetectors (filled by CF4 gas at 50 mbar pressure) and CsI(Tl)stopping detectors. The GARFIELD chambers cover the angularrange 301rylabr1501.
The characteristics of the CsI(Tl) scintillators of the GARFIELDarray used in these tests have been described in detail elsewhere[13,14]. We only recall here that the scintillators have beencarefully tested in order to select those with light-outputresolution of about 3% for a�particles of about 5 MeV (standardthree peaks radioactive source [13,14]). Moreover using around8 AMeV Li and C elastically scattered beams on Au target the light-output resolution resulted in the range 2–3%.
Fragments ðZZ3Þ are identified in charge by analyzing DE�E
matrices, where DE is the energy lost in the gas and E the residualenergy, measured by the CsI(Tl) light output.
A new designed electronics [8,9] has been used for the signalcoming from CsI(Tl) detectors for identifying the light isotopes bymeans of pulse-shape analysis. The Fast and Long components of
the CsI luminescence have been obtained via ADC–DSP channel,one for each crystal as described hereafter.
The charge signal integrated in a preamplifier is sampled by anADC (125 MS/s sampling frequency, nominal 12 bits precision)and the information is processed by a DSP which, among othervariables, produces Short and Long components. These areobtained applying to the ADC sampled points two shaping filterswith different time constants. In our case a semi-Gaussian filter(tf¼700 ns) produces the Short component, while a triangularshaping with a peaking time of about 6ms [9] gives the Longcontribution. The Long component is basically proportional to thetotal light output, for any particle species.
Of course, Short and Long contributions are largely linearlyassociated, since part of the signal produced by the long-timefluorescence components of the CsI(Tl) is integrated within theShort quantity. For a good isotope visualization and a betterpresentation of the data in the identification scatter-plots, onetries a partial decorrelation and fill the histos with new quantitiesobtained from a linear mixing of Short and Long. In our case wechoose the quantities Fast¼Short and Slow¼Long�4 � Short asdone in Ref. [9], capable of separating the isotopic lines, leavingthe Slow observable larger than 0 (see Fig. 1).
We show in Fig. 1 the Fast–Slow bidimensional plots for one ofthe 24 azimuthal sectors of GARFIELD, as shown on-line by theGARFIELD data monitor recently implemented [10]. An offset of500 channels has been added to the signals, for a betterpresentation of all figures.
3. Identification procedure
The procedure we are proposing is based on an automatictracking of the ridge of the LCP branches, with the aim ofconfining the action of the researcher only to check the finalisotope mass spectra and to evaluate the quality of the isotopicdesignation, through a Figure-of-Merit [20] (FoM).
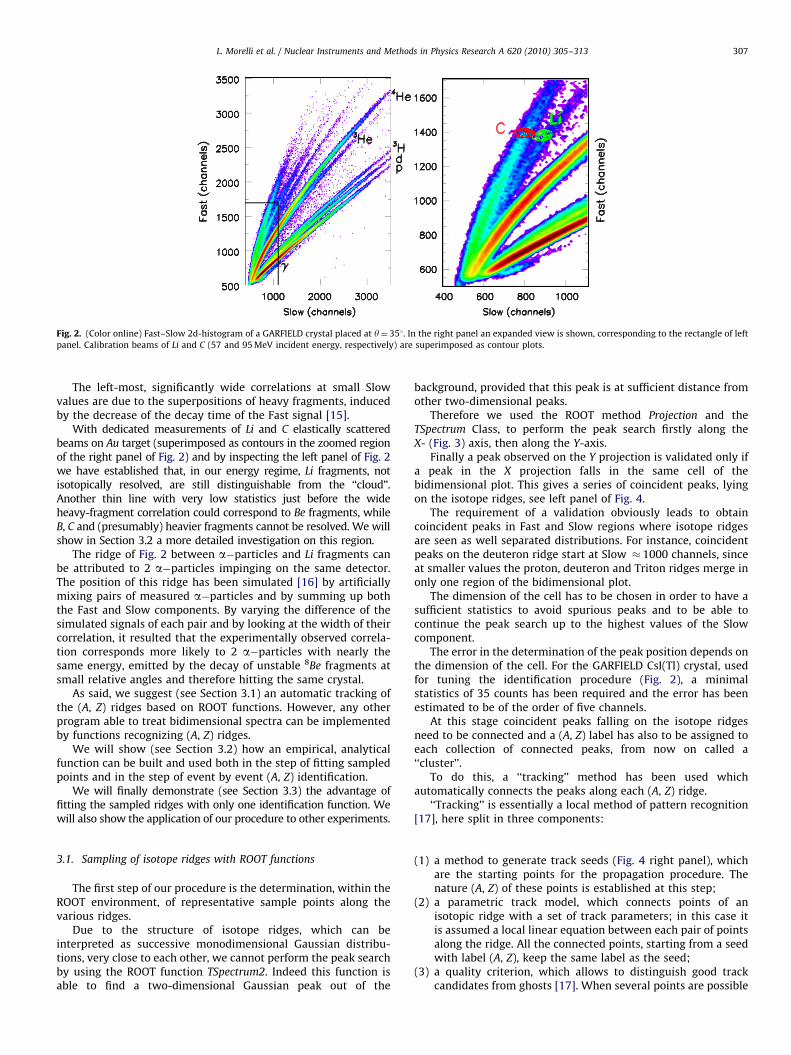
We show in Fig. 2 the two-dimensional Fast–Slow histogram,for the GARFIELD CsI(Tl) crystal placed at y¼ 351, which has beenused for tuning the identification procedure, which will be shownto properly work for all the other crystals employed in theexperiment (see Fig. 8 of Section 3.2).
Lines visible in the histogram correspond to particles withdifferent A and Z values (isotope lines). The ridge sequence of g, p,d, 3H, 3He and a�particles can be easily distinguished, whileother, more dispersed, ridges need to be more carefully studied.
ARTICLE IN PRESS
Fig. 2. (Color online) Fast–Slow 2d-histogram of a GARFIELD crystal placed at y¼ 351. In the right panel an expanded view is shown, corresponding to the rectangle of left
panel. Calibration beams of Li and C (57 and 95 MeV incident energy, respectively) are superimposed as contour plots.
L. Morelli et al. / Nuclear Instruments and Methods in Physics Research A 620 (2010) 305–313 307
The left-most, significantly wide correlations at small Slowvalues are due to the superpositions of heavy fragments, inducedby the decrease of the decay time of the Fast signal [15].
With dedicated measurements of Li and C elastically scatteredbeams on Au target (superimposed as contours in the zoomed regionof the right panel of Fig. 2) and by inspecting the left panel of Fig. 2we have established that, in our energy regime, Li fragments, notisotopically resolved, are still distinguishable from the ‘‘cloud’’.Another thin line with very low statistics just before the wideheavy-fragment correlation could correspond to Be fragments, whileB, C and (presumably) heavier fragments cannot be resolved. We willshow in Section 3.2 a more detailed investigation on this region.
The ridge of Fig. 2 between a�particles and Li fragments canbe attributed to 2 a�particles impinging on the same detector.The position of this ridge has been simulated [16] by artificiallymixing pairs of measured a�particles and by summing up boththe Fast and Slow components. By varying the difference of thesimulated signals of each pair and by looking at the width of theircorrelation, it resulted that the experimentally observed correla-tion corresponds more likely to 2 a�particles with nearly thesame energy, emitted by the decay of unstable 8Be fragments atsmall relative angles and therefore hitting the same crystal.
As said, we suggest (see Section 3.1) an automatic tracking ofthe (A, Z) ridges based on ROOT functions. However, any otherprogram able to treat bidimensional spectra can be implementedby functions recognizing (A, Z) ridges.
We will show (see Section 3.2) how an empirical, analyticalfunction can be built and used both in the step of fitting sampledpoints and in the step of event by event (A, Z) identification.
We will finally demonstrate (see Section 3.3) the advantage offitting the sampled ridges with only one identification function. Wewill also show the application of our procedure to other experiments.
3.1. Sampling of isotope ridges with ROOT functions
The first step of our procedure is the determination, within theROOT environment, of representative sample points along thevarious ridges.
Due to the structure of isotope ridges, which can beinterpreted as successive monodimensional Gaussian distribu-tions, very close to each other, we cannot perform the peak searchby using the ROOT function TSpectrum2. Indeed this function isable to find a two-dimensional Gaussian peak out of the
background, provided that this peak is at sufficient distance fromother two-dimensional peaks.
Therefore we used the ROOT method Projection and theTSpectrum Class, to perform the peak search firstly along theX- (Fig. 3) axis, then along the Y-axis.
Finally a peak observed on the Y projection is validated only ifa peak in the X projection falls in the same cell of thebidimensional plot. This gives a series of coincident peaks, lyingon the isotope ridges, see left panel of Fig. 4.
The requirement of a validation obviously leads to obtaincoincident peaks in Fast and Slow regions where isotope ridgesare seen as well separated distributions. For instance, coincidentpeaks on the deuteron ridge start at Slow � 1000 channels, sinceat smaller values the proton, deuteron and Triton ridges merge inonly one region of the bidimensional plot.
The dimension of the cell has to be chosen in order to have asufficient statistics to avoid spurious peaks and to be able tocontinue the peak search up to the highest values of the Slowcomponent.
The error in the determination of the peak position depends onthe dimension of the cell. For the GARFIELD CsI(Tl) crystal, usedfor tuning the identification procedure (Fig. 2), a minimalstatistics of 35 counts has been required and the error has beenestimated to be of the order of five channels.
At this stage coincident peaks falling on the isotope ridgesneed to be connected and a (A, Z) label has also to be assigned toeach collection of connected peaks, from now on called a‘‘cluster’’.
To do this, a ‘‘tracking’’ method has been used whichautomatically connects the peaks along each (A, Z) ridge.
‘‘Tracking’’ is essentially a local method of pattern recognition[17], here split in three components:
(1)
a method to generate track seeds (Fig. 4 right panel), whichare the starting points for the propagation procedure. Thenature (A, Z) of these points is established at this step;(2)
a parametric track model, which connects points of anisotopic ridge with a set of track parameters; in this case itis assumed a local linear equation between each pair of pointsalong the ridge. All the connected points, starting from a seedwith label (A, Z), keep the same label as the seed;(3)
a quality criterion, which allows to distinguish good trackcandidates from ghosts [17]. When several points are possible
ARTICLE IN PRESS
Fig. 4. (Color online) Left: points along the various ridges, determined through the Projection and TSpectrum procedure. Right: seeds for protons, deuteron’s, a�particles
and IMFs (triangle, star, circle, square, respectively).
Fig. 3. (Color online) Fast–Slow bidimensional plot (left) and its Y-projection on Fast component (right) for the narrow channel window shown in the left panel.
L. Morelli et al. / Nuclear Instruments and Methods in Physics Research A 620 (2010) 305–313308
candidates to propagate a trajectory, the method selects thepoint giving the minimum change of the angular coefficient ofthe straight line connecting the previous two points belongingto the ridge.
This procedure is continued until the end of the tracking areahas been reached, or no further suitable points can be found.
Seeds are automatically chosen as the leftmost coincidentpeaks, allowing to connect all the other coincident peaks of agiven isotope through the parametric track model. More indetails, a link from each seed is searched, with the criterion thatthe second coincident peak has to be on the right of the seed andwith larger Fast component. These two connected peaks form asegment, which is then extended recursively by adding coincidentpeaks linked to the last one. The label (A, Z) of the seeds is givenby the user. In our case Fast and Slow, coming from DSPs, do notcontain offsets and seeds are close to the origin, therefore notsensitive to the variation of the amplification factors of theconsidered chain. As a consequence, seeds needed to be labelled
only once, then they resulted valid for all the 180 crystalsemployed in our measurements.
At the end about 2500 coincident peaks were found andlabelled in the case of Fig. 4, much more than the number of peakswhich can be sampled by ‘‘hand-based’’ procedures.
In the next section we show how to find the parameterscharacterizing each crystal, through a fitting procedure and howto perform a (A, Z) event calibration.
3.2. Empirical analytic function and isotope identification
We have already stressed in Section 3 the importance of fittingthe points sampled or tracked on a bidimensional plot with onlyone analytical function, in order to generate curves for any isotope(A, Z), even not sampled.
To build an empirical, but analytical, function, we started fromthe consideration that a power law relation can been employed[18] for the total light output (our Long component) of a crystal asa function of the energy. A power-law was used in Ref. [18] to

ARTICLE IN PRESS
Fig. 5. Ln(Slow) as a function of Ln(Fast) for the 2500 points sampled on the
bidimensional spectrum of Fig. 2.
Fig. 6. (Color online) Fast–Slow 2d-histogram of a GARFIELD crystal placed at
y¼ 351. Dashed lines correspond to the function of Eqs. (1), (2).
L. Morelli et al. / Nuclear Instruments and Methods in Physics Research A 620 (2010) 305–313 309
calibrate in MeV the light output of the crystal. In this case ionswere already identified in (A, Z) via a DE�Eresidual analysis.
In our case, due to the almost linear correlation between Fastand Long, we expect a power-law behavior for both the Fast andthe Slow variables as a function of the energy. This also implies apower-law relationship between the Fast and the Slow. Moredetails are given in the Appendix.
A plot of the Fast–Slow correlation in a double logarithmicrepresentation is shown in Fig. 5, for the coincident peaks shownin Fig. 4.
For all isotopes a power-law behavior is apparent, at highvalues of the Fast and Slow. Deviations are visible for IMFs anda�particles with low values of the two components (low energy).Our challenge is to find a fitting function able to reproduce thebehavior of the detector response over the whole observed rangeof signals.
We therefore started by adapting to our case the power-lawfunction of Ref. [18], by writing:
SlowðFast,A,ZÞ ¼ a1Fasta2 ða1,a2Z0Þ: ð1Þ
In Ref. [18] a1 and a2 were treated as free parameters when fittingthe light-output as a function of the energy for separate (A, Z)species. Both a1 and a2, showing a regular exponential behavior asa function of Z, were then fitted as a function of the charge andused for subsequent analyses (see Fig. 8 of Ref. [18]).
To reach the goal of obtaining only one analytical function forall our observed isotopic species, we incorporated in Eq. (1)the exponential behaviors of a1 and a2. We needed also to modifya1 with another term dependent on (A, Z). Therefore our functionwill contain seven fit parameters, instead of the six of Ref. [18]:
a1 ¼ ½d1þd2expð�d3Zeff Þ�expð�d4Zeff Þ
a2 ¼ ½d5�d6expð�d7Zeff Þ� ðdiZ0,i¼ 1,7Þ ð2Þ
with Zeff¼(AZ2)1/3, which represents the most effective way,within our approach, to take into account the charge and the massof the analyzed isotope ridges.
The points belonging to the tracked clusters are fitted byEqs. (1) and (2) with Minuit [19] package.
The fit is performed in two steps:
(1)
The fit is made only on the clusters starting from the seedsshown in Fig. 4, i.e. on protons, deuterons, a�particles andIMFs clusters. At the end of this step, other clusters areautomatically labelled by the program, which estimatesthe distance of each coincident point, not yet labelled, fromthe curve of Eq. (1) for all the possible (A, Z) values. Theshortest distance between the measured coincident point andeach curve determines the appropriate assignment of (A, Z).(2)
The fit is now performed on all the labelled clusters, to findthe fit parameters characterizing the crystal under study.The resulting total
w2 ¼1
d:o:f :
X ðSlow�SlowEq:ð1ÞÞ2
errors2
for the crystal shown in this paper is 1.6 (d.o.f. stands here for thedegrees of freedom, number of the sampled points minus thenumber of free parameters).
In Fig. 6 we show the analytical function (Eqs. (1), (2))superimposed to the bidimensional plot of Fig. 2.
Several checks have been made in order to establish theminimum number of tracked clusters needed to obtain a goodidentification of all the observed ridges. It resulted that the labellingof protons, deuterons, a�particles and fragments, performed in thetracking stage, is sufficient to obtain fit parameters well suited torecognize also 3H, 3He, 2a (8Be) and Li fragments.
We also verified the dependence of the fit results by the labelassigned to the IMFs cluster. Including the centroid of the elastic C
peak of the right panel of Fig. 2 as a further cluster, the fit givesalmost identical w2 if for the fragment ridge is assumed any (A, Z)values from C to Mg. Heavier elements would worsen the fit.
ARTICLE IN PRESS
L. Morelli et al. / Nuclear Instruments and Methods in Physics Research A 620 (2010) 305–313310
The last step of the analysis is the event by event identificationprocedure. By using the table of fit parameters of all the crystals,for each detected LCP the program assigns to each experimentalpoint (Slow,Fast) the appropriate values of Z (integer) and A (real),on the basis of the shortest distance from the curves Slow(Fast, A,Z) of Eq. (1) calculated for all the possible (A, Z) values. In theevent by event identification g and IMFs are only counted andneglected for further analysis.
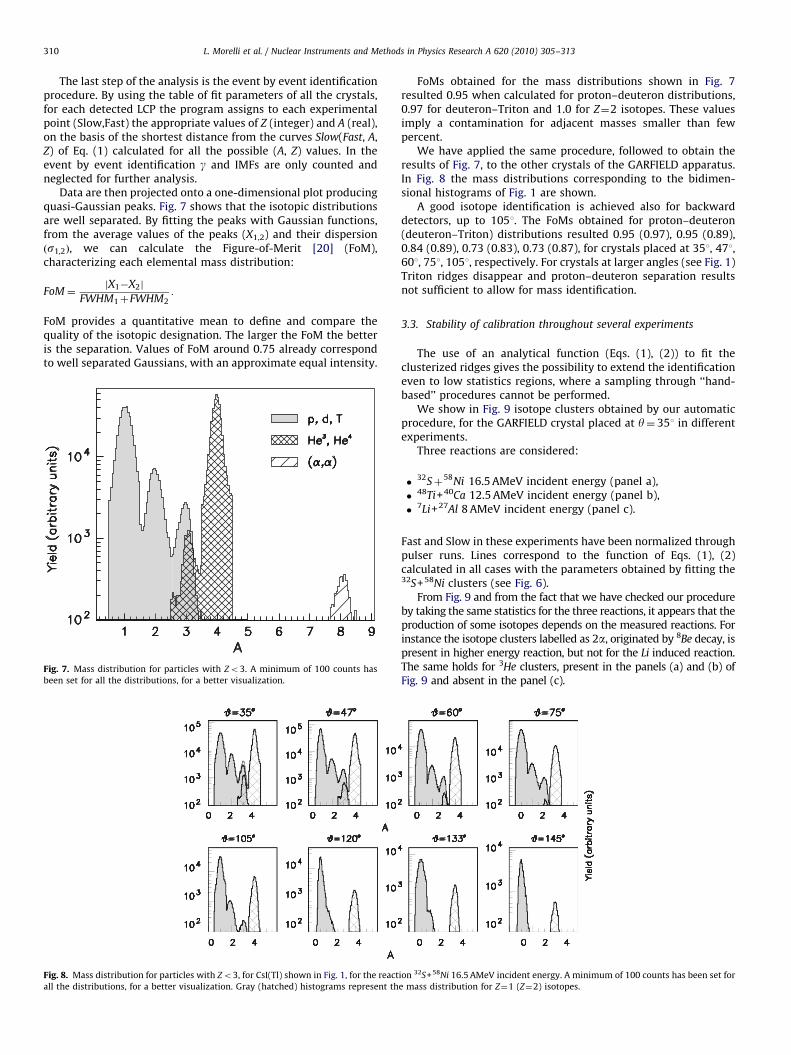
Data are then projected onto a one-dimensional plot producingquasi-Gaussian peaks. Fig. 7 shows that the isotopic distributionsare well separated. By fitting the peaks with Gaussian functions,from the average values of the peaks (X1,2) and their dispersionðs1,2Þ, we can calculate the Figure-of-Merit [20] (FoM),characterizing each elemental mass distribution:
FoM¼jX1�X2j
FWHM1þFWHM2:
FoM provides a quantitative mean to define and compare thequality of the isotopic designation. The larger the FoM the betteris the separation. Values of FoM around 0.75 already correspondto well separated Gaussians, with an approximate equal intensity.
Fig. 7. Mass distribution for particles with Zo3. A minimum of 100 counts has
been set for all the distributions, for a better visualization.
Fig. 8. Mass distribution for particles with Zo3, for CsI(Tl) shown in Fig. 1, for the react
all the distributions, for a better visualization. Gray (hatched) histograms represent th
FoMs obtained for the mass distributions shown in Fig. 7resulted 0.95 when calculated for proton–deuteron distributions,0.97 for deuteron–Triton and 1.0 for Z¼2 isotopes. These valuesimply a contamination for adjacent masses smaller than fewpercent.
We have applied the same procedure, followed to obtain theresults of Fig. 7, to the other crystals of the GARFIELD apparatus.In Fig. 8 the mass distributions corresponding to the bidimen-sional histograms of Fig. 1 are shown.
A good isotope identification is achieved also for backwarddetectors, up to 1051. The FoMs obtained for proton–deuteron(deuteron–Triton) distributions resulted 0.95 (0.97), 0.95 (0.89),0.84 (0.89), 0.73 (0.83), 0.73 (0.87), for crystals placed at 351, 471,601, 751, 1051, respectively. For crystals at larger angles (see Fig. 1)Triton ridges disappear and proton–deuteron separation resultsnot sufficient to allow for mass identification.
3.3. Stability of calibration throughout several experiments
The use of an analytical function (Eqs. (1), (2)) to fit theclusterized ridges gives the possibility to extend the identificationeven to low statistics regions, where a sampling through ‘‘hand-based’’ procedures cannot be performed.
We show in Fig. 9 isotope clusters obtained by our automaticprocedure, for the GARFIELD crystal placed at y¼ 351 in differentexperiments.
Three reactions are considered:
�
ion
e m
32Sþ58Ni 16.5 AMeV incident energy (panel a),
�48Ti+40Ca 12.5 AMeV incident energy (panel b),
�7Li+27Al 8 AMeV incident energy (panel c).
Fast and Slow in these experiments have been normalized throughpulser runs. Lines correspond to the function of Eqs. (1), (2)calculated in all cases with the parameters obtained by fitting the32S+58Ni clusters (see Fig. 6).
From Fig. 9 and from the fact that we have checked our procedureby taking the same statistics for the three reactions, it appears that theproduction of some isotopes depends on the measured reactions. Forinstance the isotope clusters labelled as 2a, originated by 8Be decay, ispresent in higher energy reaction, but not for the Li induced reaction.The same holds for 3He clusters, present in the panels (a) and (b) ofFig. 9 and absent in the panel (c).
32S+58Ni 16.5 AMeV incident energy. A minimum of 100 counts has been set for
ass distribution for Z¼1 (Z¼2) isotopes.

ARTICLE IN PRESS
Fig. 9. Comparison of isotope clusters obtained by the automatic procedure for the
GARFIELD crystal placed at y¼ 351 in several experiments. Panel (a): clusters
already shown in Fig. 6, for the reaction 32S+58Ni 16.5 AMeV incident energy. Panel
(b): 48Ti+40Ca reaction 12.5 AMeV incident energy. Panel (c): 7Li+27Al reaction
8 AMeV incident energy.
Fig. 10. Light output as a function of the energy for p, d, 4He, 7Li and 12C isotopes of
the reference crystal (see text). Dashed lines represent the fit performed with
Eq. (1) of Ref. [18]. The center of the squares correspond to elastically scattered
beams of 7Li and 12C on Au targets, measured with the GARFIELD crystal analyzed
in this paper.
Fig. 11. Long component as a function of the energy for p, 4He and Li for the crystal
under consideration in this paper. Dashed lines represent the function Eq. (1) of
Ref. [18].
L. Morelli et al. / Nuclear Instruments and Methods in Physics Research A 620 (2010) 305–313 311
This demonstrates that if (A, Z) identification would have beenperformed with graphical cuts or other ‘‘hand-based’’ procedures,for a reaction not producing some isotopes (3He, for instance),further samplings would have been needed for experiments athigher incident energy, or with larger neutron contents of the twopartners of the reaction.
Another useful consequence of using an analytic function (likeEqs. (1), (2)) and a table of fit parameters for all the crystals is thepossibility to check the data for drifts of the response of eachdetector. The use of a precision pulser, of course, is the main toolto reveal and correct for the electronics instabilities but it doesnot detect other effects connected to the behavior of the detectors(like aging or temperature effects). With the function obtained byour procedure, we can signal possible variations occurred duringthe data-taking period by superimposing, for successive data sets,the function to the bidimensional Fast–Slow histogram of eachtelescope and evaluating the w2.
4. Conclusions
The advantages obtained with the automatic calibrationprocedure presented in this paper may be summarized in thefollowing points.
�
The time dedicated to offline calibration is greatly reduced.Indeed the time needed with our procedure to automaticallysample, label, fit more than 2500 points and to identify in (A, Z)some hundred thousands of events is about 2 min. On thecontrary, by using ‘‘hand-based’’ procedures, at least 10 minare needed to only sample some tens of points on the isotoperidges. Saving a lot of time is particularly important, especiallyin experiments involving many telescopes. � The use of an analytical form of the Fast–Slow correlationEq. (1) makes it possible the extrapolation to A-regions wheregraphical cuts are not easy to make, due to low statistics.

ARTICLE IN PRESS
L. Morelli et al. / Nuclear Instruments and Methods in Physics Research A 620 (2010) 305–313312
�
Possible drifts of the crystal response can be diagnosed bycontrolling the constancy of the parameters, characterizing theindividual response of each telescope, during the sequence ofruns throughout a whole experiment. � The method ensures fast, standardized and reliable mass andcharge identification for multi-telescope systems.
The procedure described in this paper can be extended tohigher incident energies, where the number of isotopes to beidentified increases.
In particular the method has been tested with Fast–Slow plotsobtained in a recent FAZIA experiment at LNS (July–November ’09,[3]), where particle identification up to Z � 5 was available,providing good performances [23].
Acknowledgments
The authors wish to thank R. Cavaletti, A. Paolucci, G. Tobia forthe technical support during the experiment and S. Sambi for thehelp in the data analysis.
The authors also wish to thank the accelerator staff of theTandem-Alpi complex of LNL (Laboratori Nazionali di Legnaro) forhaving provided high quality beams.
This work was supported in part by grants of Alma MaterStudiorum (Bologna University).
Appendix
To justify the assumption that Fast and Slow are linked by apower-law relationship, as assumed in Section 3.2, we have firstlyto perform an energy calibration of the Long component and thenshow that both our Fast and Slow keep the memory of a power-law behavior as a function of the energy. It has indeed beenobserved that light output signals, collected through photomul-tipliers [21] or photodiodes [18], even if partially integrated,follow a light-energy power-law relation in a wide range ofparticle energies, Z and A.
Fig. 12. Right: slow component as a function of the energy for p, 4He and
In Fig. 10 we show the light-output response of a crystal(under beam in previous experiments and used here as referencecrystal) calibrated in (A, Z, E) through a DE�E technique. DE is theenergy lost by isotopes in a 300mm Silicon detector [22] and E isthe residual energy in the CsI(Tl). By using energy-loss tables, thecalibrated DE scale allows to calculate the energy deposited in thecrystal for each particle. Thereby the light (channels)-energy(MeV) correlation is established. The dashed lines of Fig. 10represent the fit performed with Eq. (1) of Ref. [18].
We show in Fig. 10 only few isotopes, representative of thoseobserved with Fast–Slow technique in this paper. For a morecomplete discussion of the light-output calibration from protonsto 58Ni see Ref. [14].
The center of the squares in Fig. 10 correspond to elasticallyscattered beams of 7Li and 12C on Au targets, used to normalizethe Long component of the GARFIELD crystal analyzed in thispaper to the light-output of the reference crystal.
As a check of the normalization procedure over the wholerange of energy for the selected isotopes, we show in Fig. 11 thecorrelation Long-Energy for p, 4He and Li clusters of Fig. 5, forthe crystal under consideration in this paper. The dashed line isthe function used to fit isotopes of the reference crystal, simplysuperimposed to the clusters.
For the same clusters we can now test the behavior of the Slow(left panel of Fig. 12) and of the Fast (right panel of Fig. 12) as afunction of the energy. The dominating behavior for bothcomponents is a power-law as a function of the energy, thougha deviation with respect to this behavior can be observed for theSlow component at low energies.
We report in Fig. 12 (as dashed line superimposed to theSlow-Energy and Fast-Energy correlations) the analytical function(Eqs. (1), (2)) used in this paper to reproduce the link betweenFast and Slow and identify isotopes. The function has beencalibrated in MeV as the data.
The almost perfect agreement between the measured Slowand the analytical function (Eqs. (1), (2)) over the whole range ofthe energy and channels, even where deviations from a power-lawbehavior are evident, not only is a countercheck of our procedure, butalso makes us confident about the next step of the analysis, i.e. theevent by event energy calibration of the measured isotopes [14].
Li. Left: fast component as a function of the energy for p, 4He and Li.

ARTICLE IN PRESS
L. Morelli et al. / Nuclear Instruments and Methods in Physics Research A 620 (2010) 305–313 313
Coming back to the aim of this Appendix, it is nowstraightforward to link Fast and Slow components via a power-law. Indeed, if
Slow¼ aEb
and
Fast¼ gEd
therefore
Slow¼ a=gb=dðFastÞb=d
with a, b, g, d depending on the charge and mass of the isotopicspecies.
References
[1] See for instance: U. Lynen, et al., Gesellschaft fur SchwerionenforschungReport n. GSI-02–89; R.T. de Souza, et al., Nucl. Instr. and Meth. A 295 (1990)109; I. Iori, et al., Nucl. Instr. and Meth. A 325 (1993) 458; J. Pouthas, et al.,Nucl. Instr. and Meth. A 357 (1995) 418; S. Aiello, et al., Nucl. Phys. A 583(1995) 461; B. Davin, et al., Nucl. Instr. and Meth. A 473 (2001) 302;M.S. Wallace, et al., Nucl. Instr. and Meth. A 583 (2007) 302; S. Wuenschel,et al., Nucl. Instr. and Meth. A 604 (2009) 578.
[2] F. Gramegna, et al., Nucl. Instr. and Meth. A 389 (1997) 474;F. Gramegna, et al., in: 2004 IEEE Nuclear Science Symposium, Rome, 16–22October 2004.
[3] FAZIA collaboration, web site /http://fazia.in2p3.fr/S.[4] /http://indra.in2p3.fr/KaliVedaDoc/S.[5] L. Tassan-Got, Nucl. Instr. and Meth. B 194 (2002) 503;
N. Le Neindre, et al., Nucl. Instr. and Meth. A 490 (2002) 251.[6] P.F. Mastinu, P.M. Milazzo, M. Bruno, M. D’Agostino, L. Manduci, Nucl.
Instr. and Meth. A 338 (1994) 419; P.F. Mastinu, P.M. Milazzo, M. Bruno,M. D’Agostino, L. Manduci, Nucl. Instr. and Meth. A 343 (1994) 663, Erratum.
[7] N. Colonna, et al., Nucl. Instr. and Meth. A 321 (1992) 529.[8] L. Bardelli, et al., Nucl. Instr. and Meth. A 491 (2002) 244;
L. Bardelli, et al., Nucl. Phys. A 746 (2004) 272;L. Bardelli, et al., Nucl. Instr. and Meth. A 560 (2006) 517.
[9] G. Pasquali, et al., Nucl. Instr. and Meth. A 570 (2007) 126.[10] L. Bardelli, A ROOT-based data-monitor software for the GARFIELD experi-
ment, LNL 2007 Annual Report, LNL-INFN(REP)-207/2007, 2007.[11] /http://root.cern.ch/S.[12] /http://www.bo.infn.it/nucl-ex/S.[13] F. Tonetto, et al., Nucl. Instr. and Meth. A 420 (1999) 181;
U. Abbondanno, et al., Nucl. Instr. and Meth. A 488 (2002) 604.[14] G. Casini, et al., LNL 2004 Annual Report, LNL-INFN(REP)-204/2005,
2005, ISBN 88-7337-008-X, pp. 212–214; Nucl. Instr. and Meth., inpreparation.
[15] F. Benrachi, et al., Nucl. Instr. and Meth. A 281 (1989) 137.[16] R. Wada, et al., Phys. Rev. C 69 (2004) 044610.[17] R. Mankel, Pattern Recognition and Event Reconstruction in Particle Physics
Experiments, arXiv:physics/0402039v1, 2004.[18] V. Avdeichikov, et al., Nucl. Instr. and Meth. A 466 (2001) 427.[19] MINUIT D506 routine from the CERN Program Library.[20] R.A. Winyard, et al., Nucl. Instr. and Meth. 95 (1971) 141.[21] V. Avdeichikov, et al., Nucl. Instr. and Meth. A 501 (2003) 505–513.[22] A. Moroni, et al., Nucl. Instr. and Meth. A 556 (2006) 516.[23] FAZIA Collaboration, private communication and paper in preparation.