Automatic Control of Cement Quality using On-Line XRD
20
1 Automatic Control of Cement Quality using On-Line XRD Sanjiv K. Dhanjal (FCT), Lloyd Young (Ash Grove Cement) and Peter Storer (FCT) Abstract Today, automatic control of cement quality is possible by the use of a continuous on-line X-ray diffraction (XRD) machine. Continuous on-line XRD analysis at the cement mill outlet has been tested to directly control calcite addition, SO 3 content, gypsum hemi- hydrate and pozzolan addition. Furthermore, the information that XRD provides is used to generate models that predict strength. As such automatic control of cement strength is becoming achievable. XRD is a common analytical technique used to directly measure the mineral content of cement, such as C 3 S, C 2 S and gypsum. The technique is highly developed and able to detect most cement minerals, even distinguish between the different phases of aluminates, belite and gypsum for example. While XRD is often carried out in a laboratory, a number of plants have installed a field instrument, which analyzes a continuous stream of material in real time. The field instrument employs a special patented position sensitive detector that allows for a full mineral analysis of a moving stream of material to be trended in real time continuously, giving the information needed for real time automated plant control. In contrast, laboratory units analyze a small sample specimen over a finite time to give an analysis. The principles used to determine mineral composition in an on-line XRD machine are no different to those used in laboratory machines. However, the volume and timeliness of the data from an on-line instrument allow for the control of certain quality parameters in real time. An on-line XRD can avoid sample preparation problems by examining a vast number of crystals in a continuous sample presentation system. This article describes a technology for on-line XRD analysis, and how it can provide benefits to cement and clinker production. 1 Introduction This article describes a system that provides continuous on-line mineral analysis of cement and clinker. The on-line XRD directly measures mineral content of cement and
Transcript of Automatic Control of Cement Quality using On-Line XRD
1
Automatic Control of Cement Quality using On-Line XRD
Sanjiv K. Dhanjal (FCT), Lloyd Young (Ash Grove Cement) and Peter Storer
(FCT)
Abstract Today, automatic control of cement quality is possible by the use of a continuous on-line X-ray diffraction (XRD) machine. Continuous on-line XRD analysis at the cement mill outlet has been tested to directly control calcite addition, SO3 content, gypsum hemi-hydrate and pozzolan addition. Furthermore, the information that XRD provides is used to generate models that predict strength. As such automatic control of cement strength is becoming achievable. XRD is a common analytical technique used to directly measure the mineral content of cement, such as C3S, C2S and gypsum. The technique is highly developed and able to detect most cement minerals, even distinguish between the different phases of aluminates, belite and gypsum for example. While XRD is often carried out in a laboratory, a number of plants have installed a field instrument, which analyzes a continuous stream of material in real time. The field instrument employs a special patented position sensitive detector that allows for a full mineral analysis of a moving stream of material to be trended in real time continuously, giving the information needed for real time automated plant control. In contrast, laboratory units analyze a small sample specimen over a finite time to give an analysis. The principles used to determine mineral composition in an on-line XRD machine are no different to those used in laboratory machines. However, the volume and timeliness of the data from an on-line instrument allow for the control of certain quality parameters in real time. An on-line XRD can avoid sample preparation problems by examining a vast number of crystals in a continuous sample presentation system. This article describes a technology for on-line XRD analysis, and how it can provide benefits to cement and clinker production.
1 Introduction This article describes a system that provides continuous on-line mineral analysis of cement and clinker. The on-line XRD directly measures mineral content of cement and

2
clinker, such as C3S, C2S and free lime. The on-line XRD therefore provides powerful information that can be used to optimize the cement manufacturing process, thereby reducing costs and increasing quality. Analysis of material is carried out using the XRD technique. X-rays are fired onto the material and they diffract off each lattice layer. The diffraction pattern is then used to identify the minerals, as each mineral has a characteristic diffraction pattern. X-ray diffraction is not new, having been first proposed in 1912. The feature that differentiates the on-line XRD from other XRD machines is that the on-line XRD can detect the complete diffraction pattern continuously. This unique feature allows the on-line XRD to analyze a stream of material, instead of a single sample. The on-line XRD then elevates XRD mineral analysis from a laboratory technique to a fully on-line field system. The analysis is carried out in real time. The data can then be used for control and optimization purposes.
2 Cement and Clinker Quality Key primary properties of cement are its strength, workability and resistance to chemical attack. In the manufacture of white cement, color is also a key quality determinant. As well as measuring the direct property (such as 28 day strength) cement standards require limits for indirect properties that influence cement properties, such as mineral content (strength) and LOI (set times and workability). Many parts of the world allow the use of binders, such as limestone, and their limit is also controlled. The properties described above are more influenced by mineral content than chemistry. Even before mineral analysis was prevalent cement chemists measured chemical compositions, nowadays using XRF for example. They then attempted to calculate the hypothetical composition of clinker phases minerals using the Bogue equations. However, the equations are based on the assumption that thermo-dynamic equilibrium is achieved in the kiln, and this is not always the case. The implied phase compositions can vary enormously (up to 20% for C3S) compared to actual composition, depending on kiln conditions and minor elements. Mineralogy also governs the performance of a cement plant. Burnability of raw feed and grindability of raw materials and clinker are properties that are influenced by mineralogy.
3 On-Line Quality Control As it is minerals that govern the quality of cement, on-line quality control requires the measurement of mineral content in real time.
3.1 X-ray Diffraction

3
A common technique to measure mineral content is X-ray diffraction. The technique involves firing an X-ray beam onto a sample and then measuring its diffraction pattern. When X-rays are fired onto a crystalline material they are reflected in all directions. However as they reflect off each layer of the crystalline lattice there are certain angles for which the reflected X-rays are in phase and the signal will be very strong, as in Figure 1. At other angles they are out of phase and the X-rays cancel each other. This process of cancellation and reinforcement is called diffraction. The angle at which the diffracted rays are in phase is related to the distance between the lattice planes, creating a pattern that is characteristic for a particular mineral. For example, the mineral tri-calcium silicate (C3S) has a characteristic pattern corresponding to the different diffracting planes in its crystal structure.
Figure 1: X-ray diffraction from a crystalline material (1.), showing constructive
interference leading to a diffraction peak, and destructive interference When a composite material, such as cement or clinker, is analyzed by XRD a range of diffracted peaks will occur. The angle of each peak can be used to identify the mineral while the intensity of the peak will indicate relative amount present. Figure 2 shows a pattern for a typical cement type.

4
Figure 2: XRD pattern of cement. Each compound contributes one or more peaks to the pattern.
There are, of course, many complicating factors. In order to arrive at the profile in the figure above and convert it into mineral composition, industrial machines use powerful software and the Reitveld analytical method (2.). In this way Reitveld XRD analysis allows for the complete mineralogical analysis of cement, e.g. C3S, C2S, C3A, C4AF, CaO, Ca(OH)2, CaCO3, CaSO4.2H2O, Ca SO4.½H2O
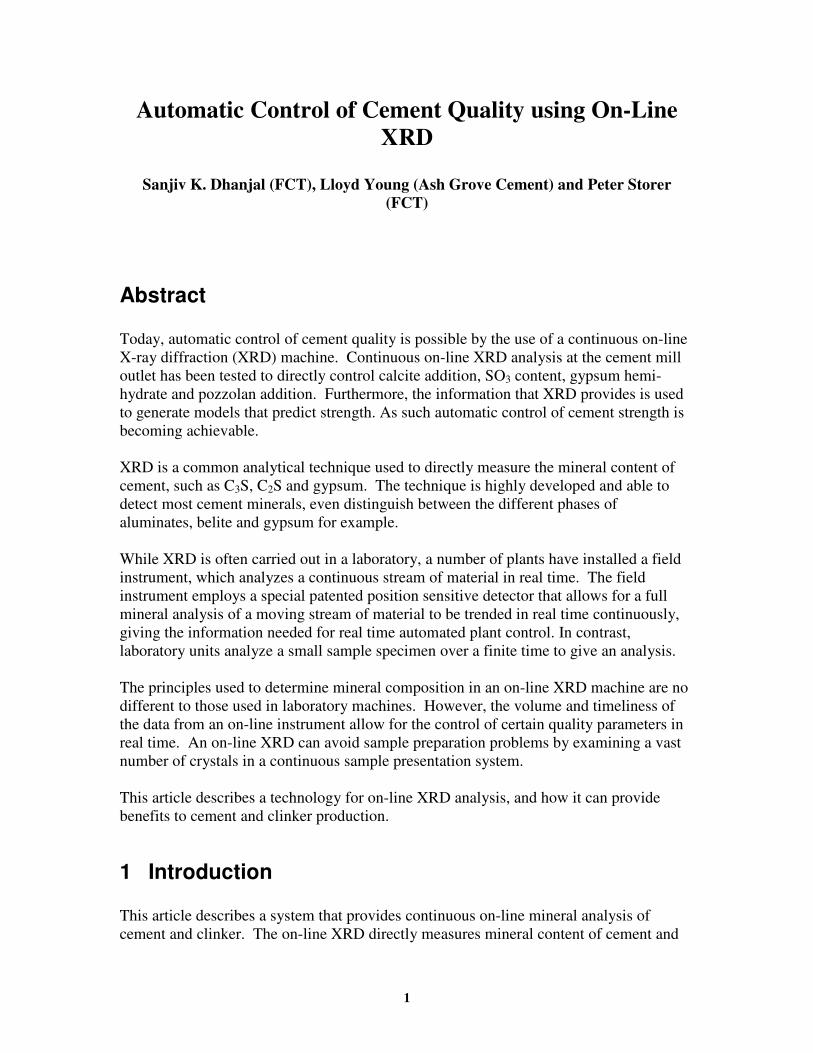
3.2 Continuous On-Stream Mineral Analysis Most XRD analyzers are laboratory based. A sample is collected, prepared and analyzed. From the diffraction pattern the composition of the sample is determined. They take many minutes to analyze the data and provide the results. The X-ray detector sees a small area, and so picks up only a small section of the diffracted X-rays. In recent years an XRD analyzer has been developed with a curved detector that is able to see the complete diffracted pattern, see Figure 3, with a sample presentation system. This innovative design has had a profound effect on the XRD analysis. It allows for continuous analysis. This graduates XRD mineral analysis from the laboratory to the field. The instrument allows XRD to be used for continuous monitoring and control. A typical process flow diagram of the unit on clinker is given in Figure 4 and a typical output is provided in Figure 5.
5
Figure 3: X-rays are diffracted continuously from a moving stream to a curved
detector.
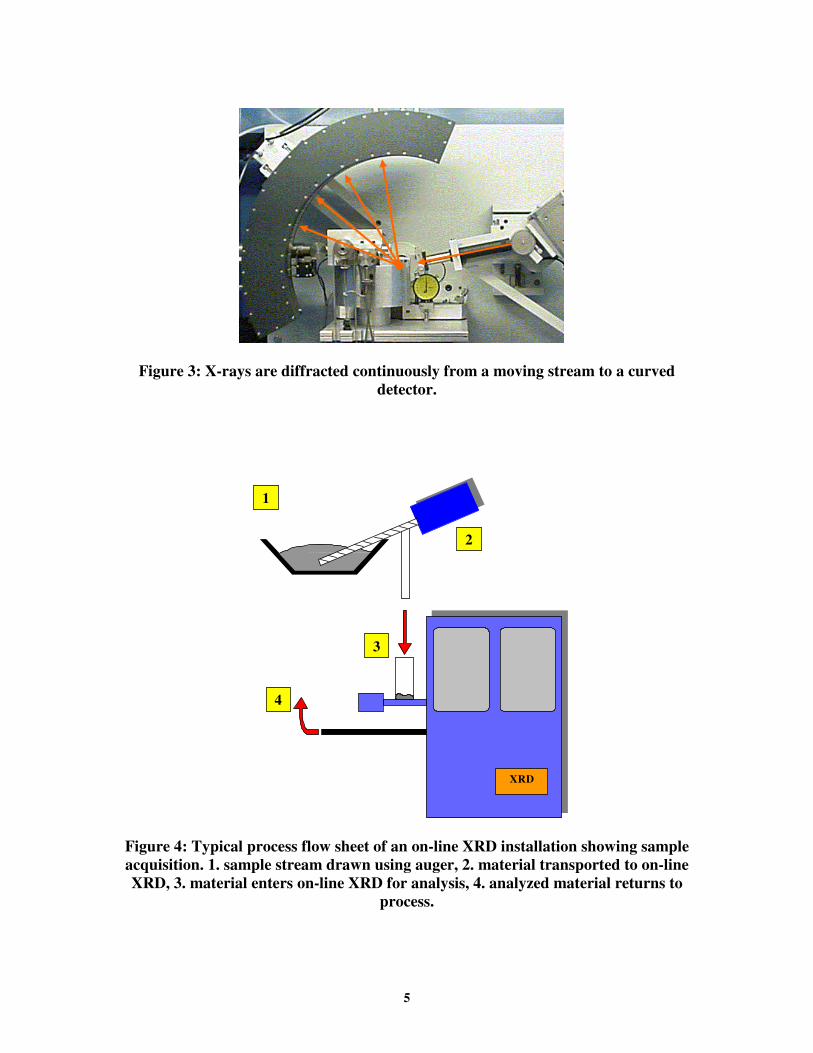
Figure 4: Typical process flow sheet of an on-line XRD installation showing sample acquisition. 1. sample stream drawn using auger, 2. material transported to on-line XRD, 3. material enters on-line XRD for analysis, 4. analyzed material returns to
process.
1
2
3
4
XRD

6
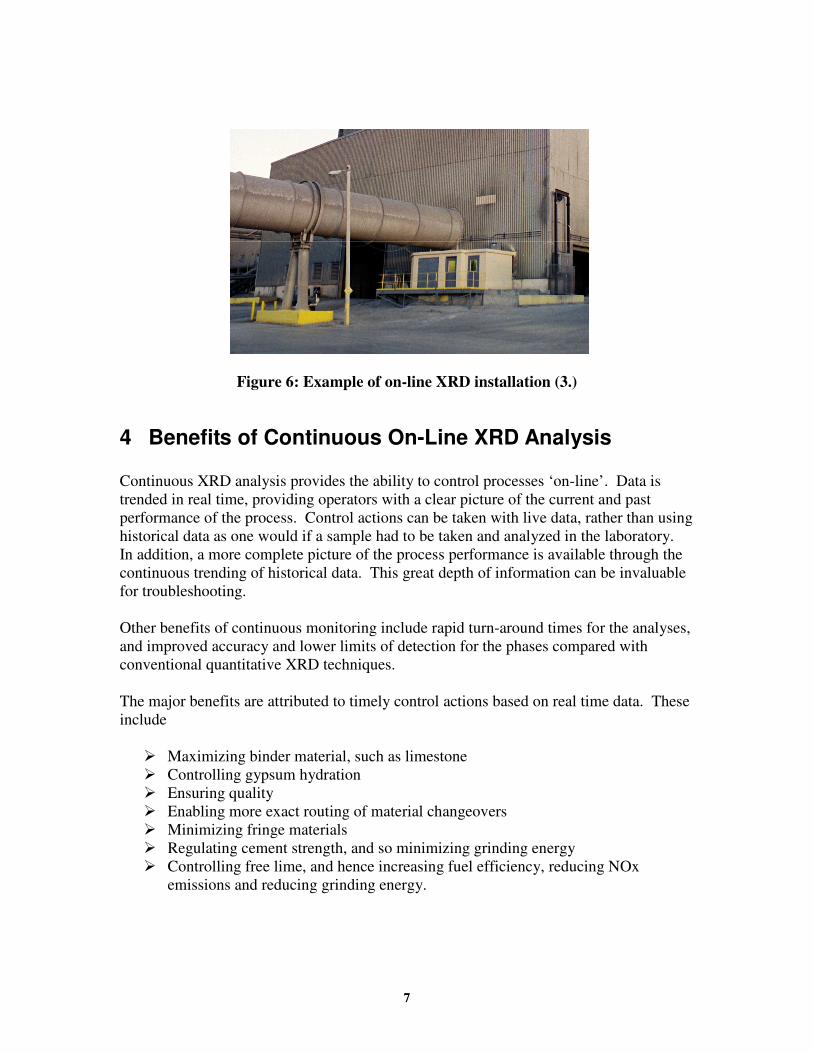
Figure 5: Typical display of clinker minerals from on-line XRD analyzer Approximately 150 g of sample per minute is analyzed by the on-line instrument. An analysis is provided each minute, based on data averaged over the preceding 10 minutes to reduce variations. The software is adjustable to suit the application. The analysis data is transferred directly to the plant control system via an Ethernet connection. As X-rays used in XRD instruments do not penetrate the surface of the powder more than a few microns, laboratory instruments only analyze a very small amount of the material sample. On-line XRD, on the other hand, analyzes significantly more material because a fresh stream of material is continuously passing under the X-rays. On-line XRD analyzes some several thousand times as much material compared to a laboratory unit. On-line XRD is a true field instrument. Figure 6 shows an installation described at the IEEE-IAS/PCA conference in 2003 (3.).
7
Figure 6: Example of on-line XRD installation (3.)
4 Benefits of Continuous On-Line XRD Analysis Continuous XRD analysis provides the ability to control processes ‘on-line’. Data is trended in real time, providing operators with a clear picture of the current and past performance of the process. Control actions can be taken with live data, rather than using historical data as one would if a sample had to be taken and analyzed in the laboratory. In addition, a more complete picture of the process performance is available through the continuous trending of historical data. This great depth of information can be invaluable for troubleshooting. Other benefits of continuous monitoring include rapid turn-around times for the analyses, and improved accuracy and lower limits of detection for the phases compared with conventional quantitative XRD techniques. The major benefits are attributed to timely control actions based on real time data. These include
� Maximizing binder material, such as limestone � Controlling gypsum hydration � Ensuring quality � Enabling more exact routing of material changeovers � Minimizing fringe materials � Regulating cement strength, and so minimizing grinding energy � Controlling free lime, and hence increasing fuel efficiency, reducing NOx
emissions and reducing grinding energy.

8
4.1 Maximizing binder material A binder of interest is limestone and on-line XRD provides good analysis of limestone content. Figure 7 shows the results of testing on-line XRD with known quantities of limestone added to cement. By knowing the exact content of limestone in cement a plant can ensure the level is never exceeded. As such a plant can control much closer to the upper limit, than if they relied on infrequent laboratory analysis.
Figure 7: Known Limestone addition v measured limestone content with on-line XRD
With such measurement, it is possible to optimize the addition of cement additives, and therefore conserve the use of clinker in cement. Clearly, a lower percentage of clinker in cement in favor of cheaper additives potentially represents substantial cost savings. Even a 1% increase in additives will result in substantial savings for the plant. Alternatively if a plant is sold out, the extra additive will result in increased revenue. Further work has also been undertaken to show that control of fly ash, pozzolan and slag is possible.
4.2 Controlling Gypsum De-Hydration The dehydration of Gypsum in cement has been shown to influence both setting time and cement strength development. On the other hand, it has been demonstrated that control of
0.0
1.0
2.0
3.0
4.0
5.0
6.0
7.0
0.0 1.0 2.0 3.0 4.0 5.0 6.0 7.0
Percent by Weight of Limestone Added
Per
cent
Mea
sure
d by
XR
D
Limestone, RMSD = 0.24

9
cement mill exit temperatures does not always give control of the percentage of gypsum that dehydrates in the mill. On-line XRD is able to analyze the different hydration states of gypsum and therefore gives the tool needed to control gypsum de-hydration. Figure 8 shows on-line XRD test results with gypsum hemi-hydrate.
Figure 8: Known Hemi-hydrate addition v measured Hemi-hydrate content with on-
line XRD
4.3 Quality Assurance By knowing the mineral content of cement produced at any time, a plant can be sure that it is producing a cement of acceptable quality, and is not producing cement that will fail quality standards. This information can be valuable as the cost of shipping sub-standard cement can have disastrous and long term implications. During a type change on-line knowledge of mineral content is of particular interest. With this information a plant knows the instant one type is no longer being produced, and the instant the next type begins to emerge from the mill. This minimizes fringe material, thereby increasing saleable product.
0.0
1.0
2.0
3.0
4.0
5.0
6.0
0.0 1.0 2.0 3.0 4.0 5.0 6.0
Percent by Weight of Hemihydrate Added
Per
cent
Mea
sure
d by
XR
D
Hemihydrate, RMSD = 0.19
10
4.4 Cement Strength Control In addition to mineral content cement strength is dependant on particle size. Most plants control to a particle size. The goal is to ensure the material is fine enough, so that its strength will exceed the minimum required. Often the cement is over ground to ensure that its strength will never fall below the minimum limit. If the strength of cement can be predicted, then it can be ground to a fineness just sufficient to create the minimum strength. This avoids over grinding and hence saves on mill energy, and allows for significantly increased mill throughput. Models are being developed to predict cement strength based on mineral content and particle size. The models are based on data collected over a period of time. Once finalized the models would be used to control cement fineness to cement strength. Over grinding can be avoided, as the strength will be known. Such a control strategy will require an on-line particle size analyzer as well as an on-line XRD machine.
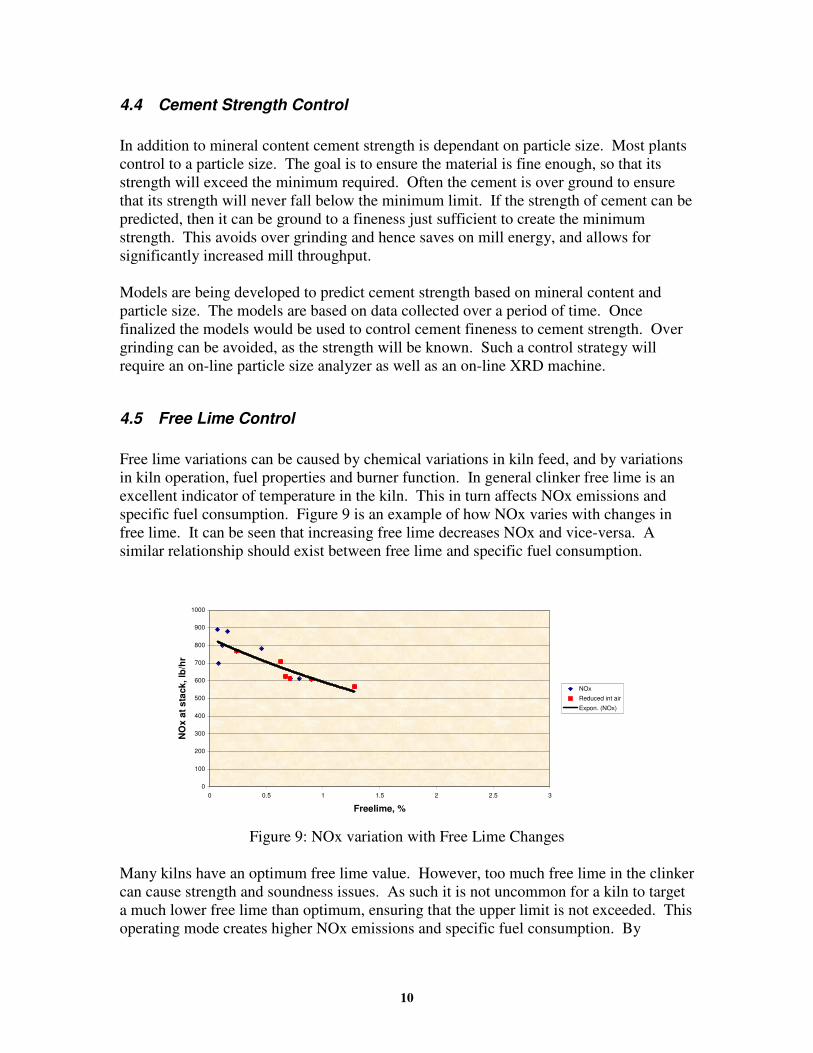
4.5 Free Lime Control Free lime variations can be caused by chemical variations in kiln feed, and by variations in kiln operation, fuel properties and burner function. In general clinker free lime is an excellent indicator of temperature in the kiln. This in turn affects NOx emissions and specific fuel consumption. Figure 9 is an example of how NOx varies with changes in free lime. It can be seen that increasing free lime decreases NOx and vice-versa. A similar relationship should exist between free lime and specific fuel consumption.
Figure 9: NOx variation with Free Lime Changes Many kilns have an optimum free lime value. However, too much free lime in the clinker can cause strength and soundness issues. As such it is not uncommon for a kiln to target a much lower free lime than optimum, ensuring that the upper limit is not exceeded. This operating mode creates higher NOx emissions and specific fuel consumption. By
0
100
200
300
400
500
600
700
800
900
1000
0 0.5 1 1.5 2 2.5 3
Freelime, %
NO
x at
sta
ck, l
b/hr
NOx
Reduced int air
Expon. (NOx)
11
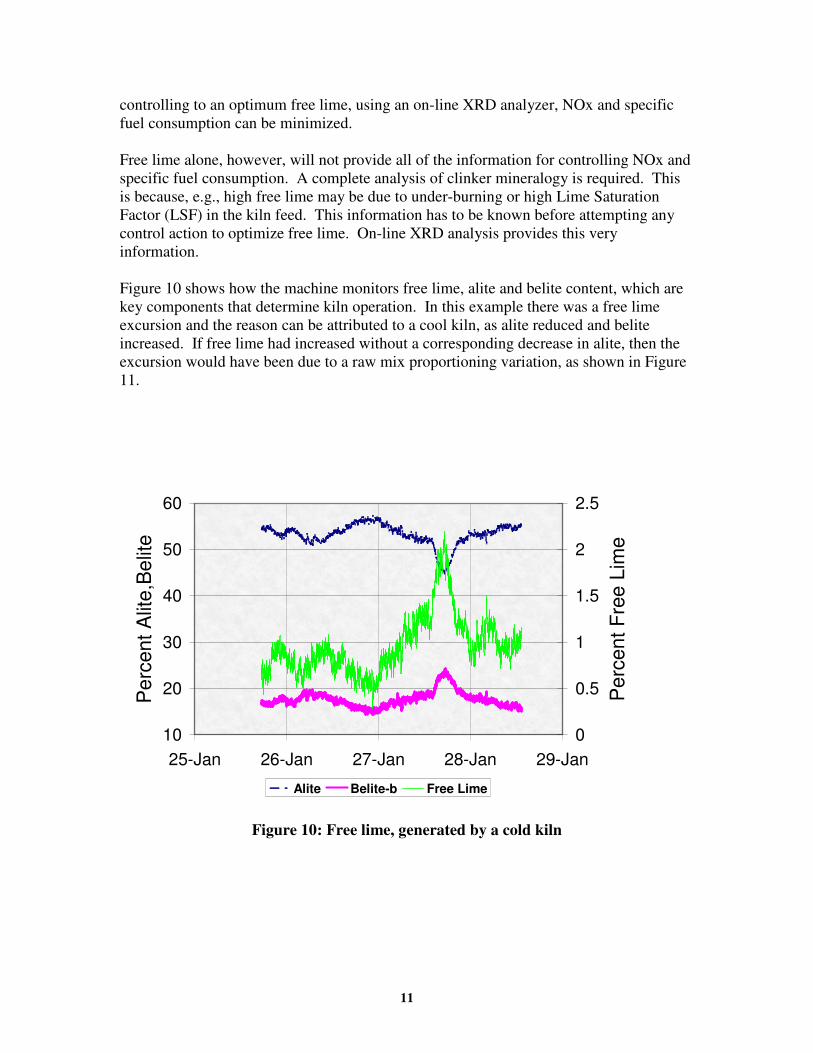
controlling to an optimum free lime, using an on-line XRD analyzer, NOx and specific fuel consumption can be minimized. Free lime alone, however, will not provide all of the information for controlling NOx and specific fuel consumption. A complete analysis of clinker mineralogy is required. This is because, e.g., high free lime may be due to under-burning or high Lime Saturation Factor (LSF) in the kiln feed. This information has to be known before attempting any control action to optimize free lime. On-line XRD analysis provides this very information. Figure 10 shows how the machine monitors free lime, alite and belite content, which are key components that determine kiln operation. In this example there was a free lime excursion and the reason can be attributed to a cool kiln, as alite reduced and belite increased. If free lime had increased without a corresponding decrease in alite, then the excursion would have been due to a raw mix proportioning variation, as shown in Figure 11.
10
20
30
40
50
60
25-Jan 26-Jan 27-Jan 28-Jan 29-Jan
Per
cent
Alit
e,B
elite
0
0.5
1
1.5
2
2.5
Per
cent
Fre
e Li
me
Alite Belite-b Free Lime
Figure 10: Free lime, generated by a cold kiln

12
Figure 11: Free Lime generated by changes in kiln feed
As such a strategy to control free lime must involve understanding why free lime changes. If the change is due to temperature the burner can be adjusted, but if it is due to chemistry other control actions are required. On-line XRD analysis will indicate which control action is to be carried out.
5 Production Control with On-line XRD: Experience at Ash Grove Cement, Leamington, UT
An on-line XRD analyzer has been monitoring the finished cement at the Ash Grove Leamington plant since October 2001. The installation of the on-line XRD is in a small building next to the cement mill, as shown in Figure 6. The cement is extracted directly from the finished cement conveyor, as it leaves the cement cooler and is on its way to a

13
finish cement silo. Further information about the installation can be found in Summit et al (3.). The online XRD is used in several fashions for finish cement, clinker, and raw mix control. It should be noted that clinker and raw mix control at the Ash Grove plant is possible because there is minimal intermediate clinker storage between the kiln and finish mill. Some of the uses are described in the following sections.
5.1 Raw Mix Control For raw mix control, a PGNAA cross belt analyzer (C.B.A.) is in service. In January, 2004 the use of an XRF as a check for raw mix consistency was discontinued. By far and large the C.B.A. was adequate for the job in the short term. Over longer periods, there is a drift to the C.B.A. elemental analysis. The on-line XRD has shown itself to be consistently reliable even over long periods. Thus, the on-line XRD analysis of cement has been used to correct for drift of raw mix. These corrections have been made as frequently as in two day periods. Figure 11 is a graph of the C.B.A. C3S results and the correlating C3S results from the XRD. Two C3S trends from the XRD are represented. The actual C3S mineral analysis is one trend and the C3S calculated from the actual C3S plus the C3S that would have formed from the free lime, based on the free lime mineral analysis and from the portlandite mineral analysis. In this case, raw mix target adjustments were not needed because the base C3S chemistry remained steady. These sharp deviations were due to material starvations. At this time, the raw mix blend air system was offline and the deviations were of significant proportion. But, it can be noted that if these were drifts instead of deviations, the raw mix chemistry could be corrected in a timely fashion. Figure 11 highlights how responsiveness on-line XRD is in analyzing the C3S parameter, which is extremely important to kiln burners.

14
Figure 11: Comparison of C3S using on-line XRD and on-line C.B.A.
5.2 Clinker Control For clinker control, the conversion of raw feed to clinker is the primary objective. This has always been measured as percent free lime in the clinker. Leamington is pursuing other avenues than just the wet free lime test to indicate proper conversion. Part of these new approaches is to utilize the FCaO and Portlandite analysis from the XRD. This is only valid when we are burning and grinding the same clinker inline. Figure 12 is a graph of these two minerals. A short term upset on the kiln will show sharp spikes of these minerals. If these were done by performing a wet test on grab samples, either the spike would be missed or the kiln would be over corrected for a short term deviation. This would result in kiln feed being reduced far past the disturbance, resulting in lost tonnage, which can accumulate significantly over the production year. As shown in the previous graph, Figure 11, raw feed chemical deviations account for the majority of these free lime spikes. The clinker grab samples are insufficient for short term corrective actions. Corrective actions would be to begin fueling the calciner and kiln based on the C.B.A results as a proactive approach instead of a reactive approach. In longer time frames, the XRD FCaO results can help the operators to decide when to add or subtract feed. Or it could show the plant chemist or process engineer the effects of mix chemistry or raw feed fineness on kiln burning.
C3S Comparison
50
55
60
65
70
75
80
85
90
0 500 1000 1500 2000 2500 3000 3500 4000
Time (min)
C3S
40
45
50
55
60
65
70
C3S
C3S-C.B.A. ActualC3S XRD ActualC3S XRD Calculated

15
Figure 12: Free lime and Portlandite analysis using on-line XRD As stated above, this XRD is installed after the finish mill. If it was to be installed after the clinker cooler, inline with grinding preparation equipment, this could be of greater use for kiln control than even automated labs.
5.3 Finish Mill Control For finish cement control, the XRD results are being used in conjunction with a control software program. At Leamington this is the same control software that utilizes the C.B.A. results to control raw mix. The two minerals being measured and controlled are SO3 (gypsum weigh feeder control) and calcite (limestone weigh feeder control). Figures 13 and 14 are graphs showing mineral and weigh feeder control action for each species.
FCaO and Portlandite
0
0.5
1
1.5
2
2.5
3
3.5
4
4.5
0
248
496
744
992
1240
1488
1736
1984
2232
2480
2728
2976
3224
3472
3720
3968
4216
4464
4712
4960
5208
5456
5704
5952
6200
6448
6696
6944
Time (min)
Wt%
FCaOPortlanditeFCaO calc. from both

16
Figure 13: SO3 Control
SO3/Gypsum Control
2.2
2.4
2.6
2.8
3
3.2
3.4
0 46 92 138
184
230
276
322
368
414
460
506
552
598
644
690
736
782
828
874
920
966
1012
1058
1104
1150
1196
1242
1288
1334
1380
1426
Time (min)
SO
3
5
5.5
6
6.5
7
SO3Gypsum WF%
Target 2.8%Average 2.79%Standard Dev 0.08%

17
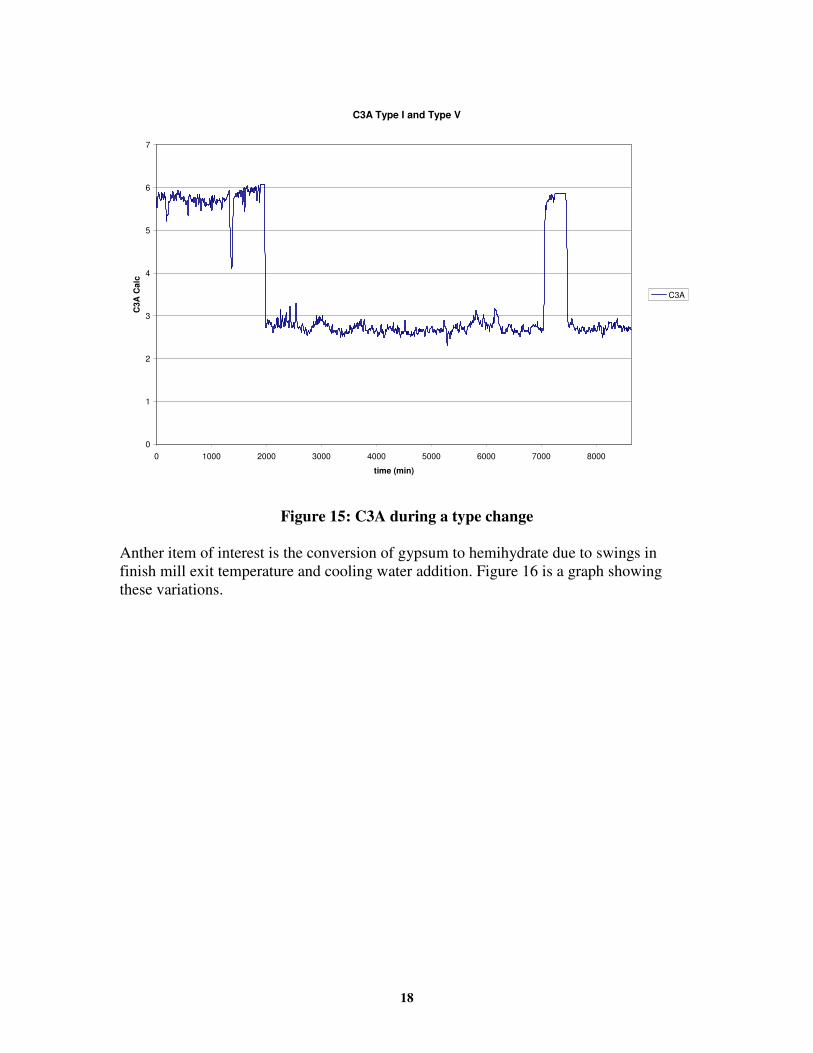
Figure 14: Calcite Control There are several other ways that the XRD results are used in operational control. One of these is to recognize type changes on the finish mill to switch finish cement silos. Several of the analysis items can be utilized to perform this function. Figure 15 is graph of C3A back calculated from the mineral analysis to represent a bogue value.
Calcite/Limestone Control
1
1.2
1.4
1.6
1.8
2
2.2
2.4
2.6
2.8
3
0 46 92 138
184
230
276
322
368
414
460
506
552
598
644
690
736
782
828
874
920
966
1012
1058
1104
1150
1196
1242
1288
1334
1380
1426
Time (min)
Cal
cite
1.8
2.3
2.8
3.3
3.8
Lim
esto
ne W
F%
CalciteLimestone
Target 2.0%Average 2.03%Standard Dev 0.09%
18
Figure 15: C3A during a type change
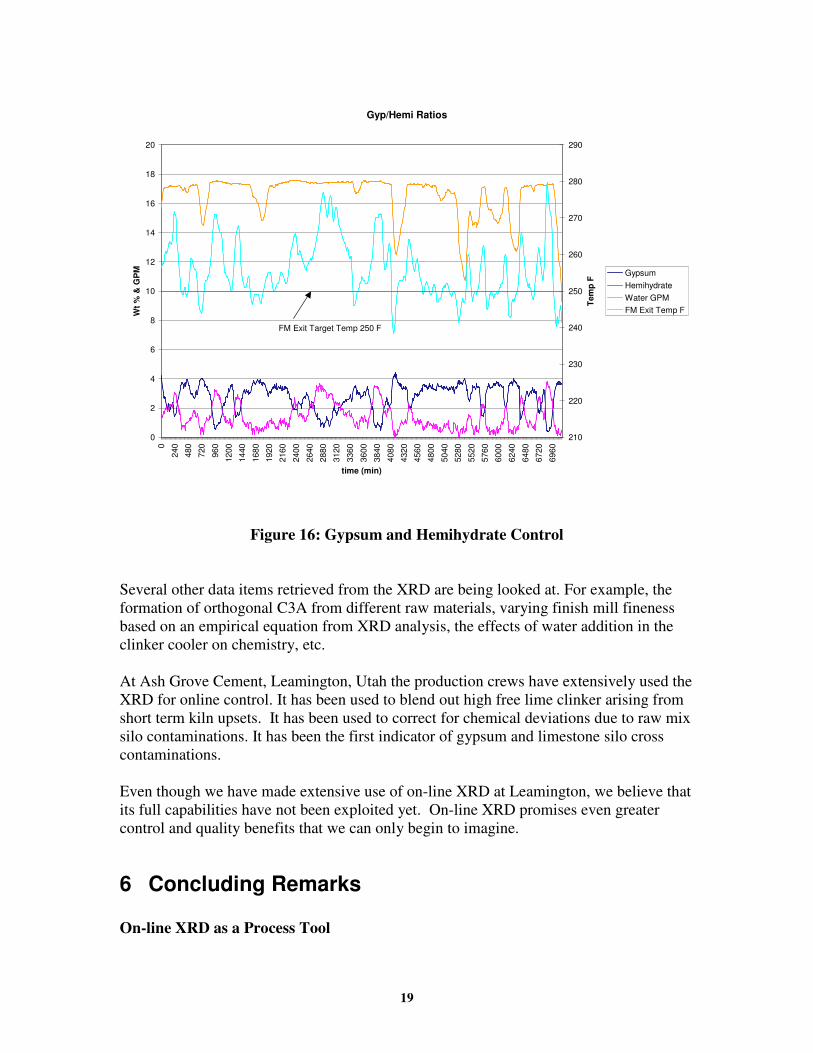
Anther item of interest is the conversion of gypsum to hemihydrate due to swings in finish mill exit temperature and cooling water addition. Figure 16 is a graph showing these variations.
C3A Type I and Type V
0
1
2
3
4
5
6
7
0 1000 2000 3000 4000 5000 6000 7000 8000
time (min)
C3A
Cal
c
C3A
19
Figure 16: Gypsum and Hemihydrate Control Several other data items retrieved from the XRD are being looked at. For example, the formation of orthogonal C3A from different raw materials, varying finish mill fineness based on an empirical equation from XRD analysis, the effects of water addition in the clinker cooler on chemistry, etc. At Ash Grove Cement, Leamington, Utah the production crews have extensively used the XRD for online control. It has been used to blend out high free lime clinker arising from short term kiln upsets. It has been used to correct for chemical deviations due to raw mix silo contaminations. It has been the first indicator of gypsum and limestone silo cross contaminations. Even though we have made extensive use of on-line XRD at Leamington, we believe that its full capabilities have not been exploited yet. On-line XRD promises even greater control and quality benefits that we can only begin to imagine.
6 Concluding Remarks On-line XRD as a Process Tool
Gyp/Hemi Ratios
0
2
4
6
8
10
12
14
16
18
20
0
240
480
720
960
1200
1440
1680
1920
2160
2400
2640
2880
3120
3360
3600
3840
4080
4320
4560
4800
5040
5280
5520
5760
6000
6240
6480
6720
6960
time (min)
Wt %
& G
PM
210
220
230
240
250
260
270
280
290
Tem
p F
GypsumHemihydrateWater GPMFM Exit Temp F
FM Exit Target Temp 250 F

20
Continuous on-line XRD analysis has opened the door to the use of in-plant mineralogical analyzers with automatic control loops integrating the process control function with the quality control function into a single sophisticated control system. On-line XRD can be integrated with most types of DCS control systems through the appropriate interface. On-line XRD as a on-line cement/clinker analyzer Continuous XRD analysis produces far more information much faster than that possible with laboratory based systems. Several orders of magnitude more sample is analyzed than with laboratory systems, and this increases the confidence in the continuous XRD analyzer’s result. The fact that the analysis is continuous allows an analysis trend to be reported, and control actions recommended based on the trended information. Benefits The economic benefits to the bottom line for a cement manufacturer are expected to be substantial. Cost of production through more meaningful analysis and control will reduce significantly while the customer will appreciate the improved product quality and relevant new information that could be made available.
7 References 1. Web Page. http://www.eserc.stonybrook.edu/ProjectJava/Bragg/ 2. Rietveld, H. M. (1966). Acta Cryst. 20, 508. 3. Summit, D., Crutchfield, G.D., Godek, A., Manias, C. G., Storer, P. Experiences with Continuous On-stream XRD at the Ash Grove Leamington Plant. IEEE Conference 2003
8 Acknowledgements The authors would like to acknowledge the help and support of Mr. Duane Crutchfield, Ash Grove Cement, in preparing this paper.