Automatic Classification of Digestive Organs in Wireless ...jelee/pubs/SAC07.pdf · Automatic...
5
Automatic Classification of Digestive Organs in Wireless Capsule Endoscopy Videos Jeongkyu Lee 1 , JungHwan Oh 2 , Subodh Kumar Shah 1 , Xiaohui Yuan 2 , Shou Jiang Tang 3 1 Dept. Comp. Sci. & Eng. University of Bridgeport Bridgeport, CT 06604 {jelee,subodhs}@bridgeport.edu 2 Dept. Comp. Sci. & Eng. University of North Texas Denton, TX 76203 {jhoh,xyuan}@cse.unt.edu 3 Division of Digestive Diseases UTSW Medical Center Dallas, TX 75390 [email protected] ABSTRACT Wireless Capsule Endoscopy (WCE) allows a physician to examine the entire small intestine without any surgical op- eration. With the miniaturization of wireless and camera technologies the ability comes to view the entire gestational track with little effort. Although WCE is a technical break- through that allows us to access the entire intestine without surgery, it is reported that a medical clinician spends one or two hours to assess a WCE video. It limits the number of examinations possible, and incur considerable amount of costs. To reduce the assessment time, it is critical to develop a technique to automatically discriminate digestive organs such as esophagus, stomach, small intestinal (i.e., duode- num, jejunum, and ileum) and colon. In this paper, we propose a novel technique to segment a WCE video into these anatomic parts based on color change pattern anal- ysis. The basic idea is that the each digestive organ has different patterns of intestinal contractions that are quan- tified as the features. We present the experimental results that demonstrate the effectiveness of the proposed method. Categories and Subject Descriptors I.2.10 [Artificial Intelligence]: Vision and Scene Under- standing—Video analysis ; I.4.8 [Image Processing and Computer Vision]: Scene Analysis—Time-varying imagery General Terms Algorithms, Experimentation, Software Keywords Wireless capsule endoscopy, event boundary detection, event hierarchy, energy function, high frequency content function 1. INTRODUCTION Permission to make digital or hard copies of all or part of this work for personal or classroom use is granted without fee provided that copies are not made or distributed for profit or commercial advantage and that copies bear this notice and the full citation on the first page. To copy otherwise, to republish, to post on servers or to redistribute to lists, requires prior specific permission and/or a fee. SAC’07 March 11-15, 2007, Seoul, Korea Copyright 2007 ACM 1-59593-480-4 /07/0003 ...$5.00. A human digestive system consists of a series of several different organs including the esophagus, stomach, small in- testinal (i.e., duodenum, jejunum, and ileum) and colon. Standard endoscopy has been playing a very important role as a diagnostic tool for the digestive tract. For example, various endoscopies such as gastroscopy, push enteroscopy colonoscopy have been used for the visualization of digestive system. However, all methods mentioned above are limited in viewing small intestine. To address the problem, Wire- less Capsule Endoscopy (WCE) was first proposed in 2000, which integrates wireless transmission with image and video technology [13, 2, 1, 12, 14, 8]. After FDA approved in 2002, it is now used as one of the important tools to examine small intestine. WCE allows a physician to examine the entire small in- testine non-invasively. WCE uses a small capsule, 11 mm in diameter and 25 mm in length (see Figure 1 (a)). The front end of the capsule has an optical dome where white light emitting diodes (LEDs) illuminate the luminal surface of the gut, and a micro camera sends images via wireless trans- mission to a receiver worn by a patient (see Figure 1 (b)). Another part of the capsule contains a small battery that can last up to 8 hours. The patient swallows a small cap- sule, usually after an overnight fast. As the capsule moves through the gastrointestinal tract, images are transmitted by the digital radio frequency communication channel to a data recorder (see Figure 1 (c)). This data are transferred to a computer for interpretation by the specialists. The cap- sule is then passed in the patient’s stool without the need for retrieval. (a) (b) (c) Figure 1: Wireless Capsule Endoscopy Equipments: (a) the capsule, (b) the 8-lead antenna array, and (c) receiver/recorder unit and battery. Although WCE is a technical breakthrough that allows to access the entire intestine without surgery, it is reported that the interpretation time takes 1 or 2 hours. This is very time consuming for the gastroenterologist. It limits
Transcript of Automatic Classification of Digestive Organs in Wireless ...jelee/pubs/SAC07.pdf · Automatic...
Automatic Classification of Digestive Organs in WirelessCapsule Endoscopy Videos
Jeongkyu Lee1, JungHwan Oh2, Subodh Kumar Shah1, Xiaohui Yuan2, Shou Jiang Tang3
1Dept. Comp. Sci. & Eng.University of BridgeportBridgeport, CT 06604
{jelee,subodhs}@bridgeport.edu
2Dept. Comp. Sci. & Eng.University of North Texas
Denton, TX 76203{jhoh,xyuan}@cse.unt.edu
3Division of Digestive DiseasesUTSW Medical Center
Dallas, TX [email protected]
ABSTRACTWireless Capsule Endoscopy (WCE) allows a physician toexamine the entire small intestine without any surgical op-eration. With the miniaturization of wireless and cameratechnologies the ability comes to view the entire gestationaltrack with little effort. Although WCE is a technical break-through that allows us to access the entire intestine withoutsurgery, it is reported that a medical clinician spends oneor two hours to assess a WCE video. It limits the numberof examinations possible, and incur considerable amount ofcosts. To reduce the assessment time, it is critical to developa technique to automatically discriminate digestive organssuch as esophagus, stomach, small intestinal (i.e., duode-num, jejunum, and ileum) and colon. In this paper, wepropose a novel technique to segment a WCE video intothese anatomic parts based on color change pattern anal-ysis. The basic idea is that the each digestive organ hasdifferent patterns of intestinal contractions that are quan-tified as the features. We present the experimental resultsthat demonstrate the effectiveness of the proposed method.
Categories and Subject DescriptorsI.2.10 [Artificial Intelligence]: Vision and Scene Under-standing—Video analysis; I.4.8 [Image Processing andComputer Vision]: Scene Analysis—Time-varying imagery
General TermsAlgorithms, Experimentation, Software
KeywordsWireless capsule endoscopy, event boundary detection, eventhierarchy, energy function, high frequency content function
1. INTRODUCTION
Permission to make digital or hard copies of all or part of this work forpersonal or classroom use is granted without fee provided that copies arenot made or distributed for profit or commercial advantage and that copiesbear this notice and the full citation on the first page. To copy otherwise, torepublish, to post on servers or to redistribute to lists, requires prior specificpermission and/or a fee.SAC’07 March 11-15, 2007, Seoul, KoreaCopyright 2007 ACM 1-59593-480-4 /07/0003 ...$5.00.
A human digestive system consists of a series of severaldifferent organs including the esophagus, stomach, small in-testinal (i.e., duodenum, jejunum, and ileum) and colon.Standard endoscopy has been playing a very important roleas a diagnostic tool for the digestive tract. For example,various endoscopies such as gastroscopy, push enteroscopycolonoscopy have been used for the visualization of digestivesystem. However, all methods mentioned above are limitedin viewing small intestine. To address the problem, Wire-less Capsule Endoscopy (WCE) was first proposed in 2000,which integrates wireless transmission with image and videotechnology [13, 2, 1, 12, 14, 8]. After FDA approved in 2002,it is now used as one of the important tools to examine smallintestine.
WCE allows a physician to examine the entire small in-testine non-invasively. WCE uses a small capsule, 11 mm indiameter and 25 mm in length (see Figure 1 (a)). The frontend of the capsule has an optical dome where white lightemitting diodes (LEDs) illuminate the luminal surface ofthe gut, and a micro camera sends images via wireless trans-mission to a receiver worn by a patient (see Figure 1 (b)).Another part of the capsule contains a small battery thatcan last up to 8 hours. The patient swallows a small cap-sule, usually after an overnight fast. As the capsule movesthrough the gastrointestinal tract, images are transmittedby the digital radio frequency communication channel to adata recorder (see Figure 1 (c)). This data are transferredto a computer for interpretation by the specialists. The cap-sule is then passed in the patient’s stool without the needfor retrieval.
(a) (b) (c)
Figure 1: Wireless Capsule Endoscopy Equipments:(a) the capsule, (b) the 8-lead antenna array, and(c) receiver/recorder unit and battery.
Although WCE is a technical breakthrough that allowsto access the entire intestine without surgery, it is reportedthat the interpretation time takes 1 or 2 hours. This isvery time consuming for the gastroenterologist. It limits
its general application and incur considerable amount ofcosts. To reduce the assessment time, Berens et al. proposedthe technique for automatically discriminating stomach, in-testine, and colon by using the Discrete Cosine Transform(DCT) and Principal Component Analysis (PCA) classi-fiers [1]. However, the technique can detect only two bound-aries of stomach/intestine and intestine/colon, which is notenough to assist the specialist. In [14], ROC (ReceivingOperating Characteristic) curves analysis are used for theclassification of contraction and non-contraction images inWCE videos. However, it is not based on the contents ofWCE video.
In this paper, we propose a novel algorithm for eventboundary detection in Wireless Capsule Endoscopy videosbased on an energy function. The basic idea is that each di-gestive organ such as esophagus, stomach, duodenum, smallintestine, and colon, has different patterns of intestinal con-tractions. These patterns have been widely used in the anal-ysis of biogenic signals, such as Electrogastrogram [7] orElectrocardiogram [10]. We first characterize the contrac-tions of WCE video using Energy function in a frequencydomain. Then, we segment WCE video into events by us-ing a high frequency content (HFC) function. The detectedevent boundaries indicate either entrance of the next organor unusual events in the same organ, such as intestinal juices,bleedings, and unusual capsule movements. We classify thesegmented events into higher level events that represent di-gestive organs. The classification result is represented by atree structure, which is called an event hierarchy of WCE.
The remainder of this paper is organized as follows. Fea-ture extraction and event boundary detection in WCE videoare discussed in Section 2. Section 3 presents the proposedtechnique for building event hierarchy of WCE video. InSection 4, we discuss our experimental results. Finally, Sec-tion 5 presents some concluding remarks.
2. EVENT BOUNDARY DETECTION IN WCEVIDEOS
In this section, we first discuss the intestinal contractionsof which patterns are the most important discriminator ofdigestive organs. In order to characterize the contractions,we extract energy-based feature in frequency domain fromWCE images, and then detect event boundaries by using ahigh frequency content (HFC) function.
2.1 Intestinal ContractionsPeristalses or contractions are intrinsic motility patterns
in bowel movements, which is also the basic activity through-out entire gastrointestinal tract. Since the intestinal con-traction is a very good pathological indicator, it is widelyused for the diagnosis of many gastrointestinal diseases. Oneof examples using contractions is Electrogastrogram [7] (EGG).EGG is a non-invasive recording of the electrical activityof stomach. Slow waves are generated from the activity ofthe gastrointestinal wall surface, or gastrointestinal contrac-tions.
WCE videos can record continuous activities in digestivesystem such as intestinal contractions, and visualize themeasily. Figure 2 shows a number of examples of intestinalcontractions taken by WCE. Figure 2 (a) and (b) are se-quences of frames captured from stomach and small bowel,respectively. As seen in the figure, the motility patterns
are different since each digestive organ has different typesof movements and functionalities. We will characterize in-testinal contractions to find events in WCE videos in thefollowing subsections.
(a)
(b)
Figure 2: Sequence of Frames of WCE Video from:(a) stomach and (b) small bowel.
2.2 Feature ExtractionTo characterize the contractions in WCE videos, we tested
several different features. Many works have tackled theproblem of the characterization of intestinal contractions incapsule endoscopy using various features [1, 12, 14]. In [14],34 features are extracted to describe the contractions along9 frames: 9 mean intensities, 9 hole sizes, 9 global contrasts,6 correlations among frame sequences, and 1 variance of in-tensities. However, the approach requires high computationsto extract many features from videos, and pre-processing totest the data, which prevent on-line processing.
We mainly focus on color features in order to pursue on-line processing. Since colors are the only feature values cap-tured by a camera directly, it can reflect the activities of di-gestive system effectively such as contractions and juices. Inother words, intestinal movements, i.e. contractions, couldchange the color values. Among the various color domains,we select HSI color space. The reason we choose HSI is thathue, saturation and intensity are most robust componentsfor video and image processing [3].
First, we convert the RGB color space into the HSI colorspace for every frame in WCE video. Since the intestinalcontractions that are periodic movements affect all compo-nents in the color space, we can use either any componentsamong hue, saturation and intensity, or any combinationsof components in HSI. In this paper, we use mean of entirepixel values in a frame. Figure 3 shows the average valuesof HSI for the first 5000 frames of a sample WCE video.
A B C D
Intensity Saturation Hue
Frame #
Avg.
Value
Figure 3: Average values of HSI colors for the first5000 frames of a sample WCE video.
The blue, pink, and gray lines in the figure indicate theaverage values of hue, saturation, and intensity of each frame
in a video, respectively. We marked the actual sections ofdigestive system. For example, ‘A’ indicates esophagus, ‘B’indicates stomach, and ‘C’ indicates duodenum. Also, ‘D’is the part of small bowel. It is clear that each part ofWCE video, i.e. ‘A’ to ‘D’, has different pattern of colorsequence values. We refer the sequence of color values ascolor signal of WCE video because it has the same propertiesas a signal such as frequency and wave length. Contractionsthat are periodically occurred in digestive tube distort thecolor values, which make the signal of color values in WCEvideo. The characteristics of color signal in WCE video canbe summarized as follows:
• Unlike EGG that is an electrical activity from the gas-trointestinal wall surface as well as the contractile ac-tivity of the smooth muscles, the color signal is causedby only the contraction of digestive movements, and
• When a capsule enters the next digestive organ, thecorresponding color signal has a short-term changethat is the suddenness of the signal change and theincrease in energy.
The aforementioned characteristics will be used to definedetection function of WCE video events in the following sub-section. In this paper we choose the color signal generatedfrom intensity value (gray signal in Figure 3) of HSI colordomain for the efficiency of processing.
2.3 Event Boundary DetectionA shot is very useful processing unit in many video ap-
plications such as video segmentation, video indexing, andvideo annotation. However, it cannot be applied into non-produced videos such as video surveillance systems and med-ical videos, since they are taken without any stops or pauses.To address it, we define an event of WCE videos as follows:
Definition 1. An event of WCE videos is a sequence ofcontinuous frames that include the same semantic contents.
The examples of events in WCE videos are each digestivesystem, i.e. esophagus, stomach, small intestine (duodenum,jejunum and ileum), and colon, and anomaly (i.e. bleedingand mass lesion). Since one event has the same semanticcontents including the similar digestive movements, the colorsignal in a single event has a similar pattern. Therefore, wecan find the event boundaries of WCE videos based on asignal processing.
We design the event detection method by recognizing twosignal properties associated with a short-term change, whichare the suddenness of the signal change, and the increasein energy [11]. In addition, we choose a frequency domainmethod since it is able to reveal not only changes in overallenergy, but also the energy concentration in frequency [11].The frequency location of energy is very important sincethe sudden changes in the signal cause phase discontinuities.In the frequency spectrum, this appears as high frequencyenergy. We define the energy function of color signal, E asa sum of the squared magnitude of each frequency bin ina specified range. The energy function of the ith frame ofWCE video, Ei is defined as:
Ei =
N2 +1∑
k=2
(|Xi(k)|2) (1)
where N is the FFT (fast fourier transforms) array length,and Xi(k) is the kth bin of the FFT. In Equation (1), N
2+1
indicates the frequency FS2
where FS is the sample rate. Thefunction to measure high frequency content is defined as aweighted energy function, which is linearly increased towardthe higher frequencies. The high frequency content functionof the ith frame of WCE video, HFCi is defined as:
HFCi =
N2 +1∑
k=2
(|Xi(k)|2 · k) (2)
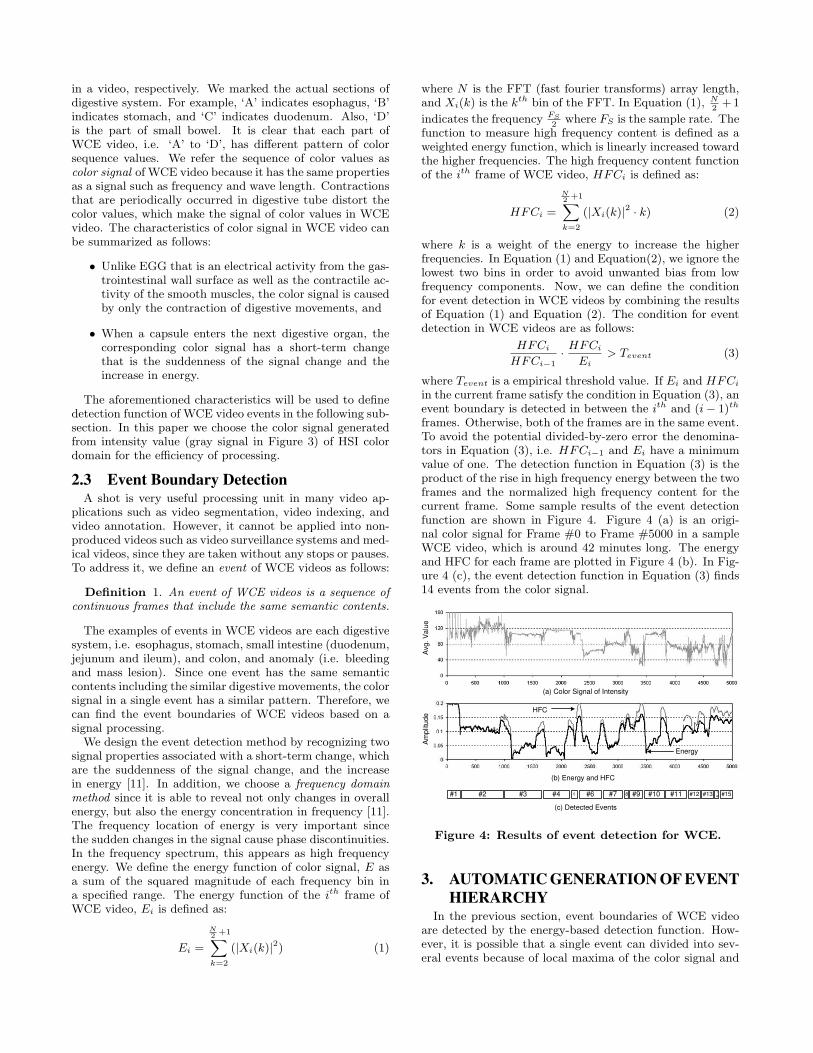
where k is a weight of the energy to increase the higherfrequencies. In Equation (1) and Equation(2), we ignore thelowest two bins in order to avoid unwanted bias from lowfrequency components. Now, we can define the conditionfor event detection in WCE videos by combining the resultsof Equation (1) and Equation (2). The condition for eventdetection in WCE videos are as follows:
HFCi
HFCi−1· HFCi
Ei> Tevent (3)
where Tevent is a empirical threshold value. If Ei and HFCi
in the current frame satisfy the condition in Equation (3), anevent boundary is detected in between the ith and (i− 1)th
frames. Otherwise, both of the frames are in the same event.To avoid the potential divided-by-zero error the denomina-tors in Equation (3), i.e. HFCi−1 and Ei have a minimumvalue of one. The detection function in Equation (3) is theproduct of the rise in high frequency energy between the twoframes and the normalized high frequency content for thecurrent frame. Some sample results of the event detectionfunction are shown in Figure 4. Figure 4 (a) is an origi-nal color signal for Frame #0 to Frame #5000 in a sampleWCE video, which is around 42 minutes long. The energyand HFC for each frame are plotted in Figure 4 (b). In Fig-ure 4 (c), the event detection function in Equation (3) finds14 events from the color signal.
Avg. V
alu
e
(b) Energy and HFC
(a) Color Signal of Intensity
HFC
Energy
#1 #3 #4 5 #6 #7 8 #9 #10 #11 #12 #131
4 #15
(c) Detected Events
Am
plit
ude
#2
Figure 4: Results of event detection for WCE.
3. AUTOMATIC GENERATION OF EVENTHIERARCHY
In the previous section, event boundaries of WCE videoare detected by the energy-based detection function. How-ever, it is possible that a single event can divided into sev-eral events because of local maxima of the color signal and
threshold value. In order to find exact boundaries of everydigestive organs, we need to merge these events into a singleevent. For the merge, we apply bottom-up approach to builda tree. We refer to the constructed tree as an event hierarchyof WCE video. Using the energy function in Equation (1),we determine the correlation between two events, Eventi
and Eventj . The correlation between Eventi and Eventj ,Corr(Eventi, Eventj), can be determined as follows:
Corr(Eventi, Eventj) = (4){true if
∑ N2 +1
k=2 (|Xi(k)−Xj(k)|2) > Tcorr,false otherwise.
where Xi(k) and Xj(k) are the kth bins of the FFT fromEventi and Eventj , respectively. Tcorr is an empirical thresh-old value. When Eventi and Eventj have the same patternof color signal, two events are related to each other. Other-wise, they are not related. Corr() is used for constructingan event hierarchy. Event hierarchy is a tree structure rep-resented as nodes and levels. Each node in the hierarchy iscalled an event node labeled as ENm
i , where the subscriptdenotes an event, and the superscript indicates a level ofthe node in the hierarchy. An event hierarchy is based on a‘scene tree’ in [9], and the procedure is as follows:
1. Create an event node EN0i for each Eventi
2. Set i ← 2.
3. Apply an event correlation Corr() to check if Eventi
is similar to Eventi−1, . . . , Event1 in descending or-der. The comparison stops when a related event, sayEventj , is identified. If no related shot is found, wecreate a new empty node, connect it as a parent nodeto EN0
i , and proceed to step 5.
4. We connect all event nodes, EN0i through EN0
j , to a
parent node of EN0j .
5. If more events, we set i ← i + 1, and go to step 3.
6. For each event node at upper level, we select them asan boundaries of digestive organs.
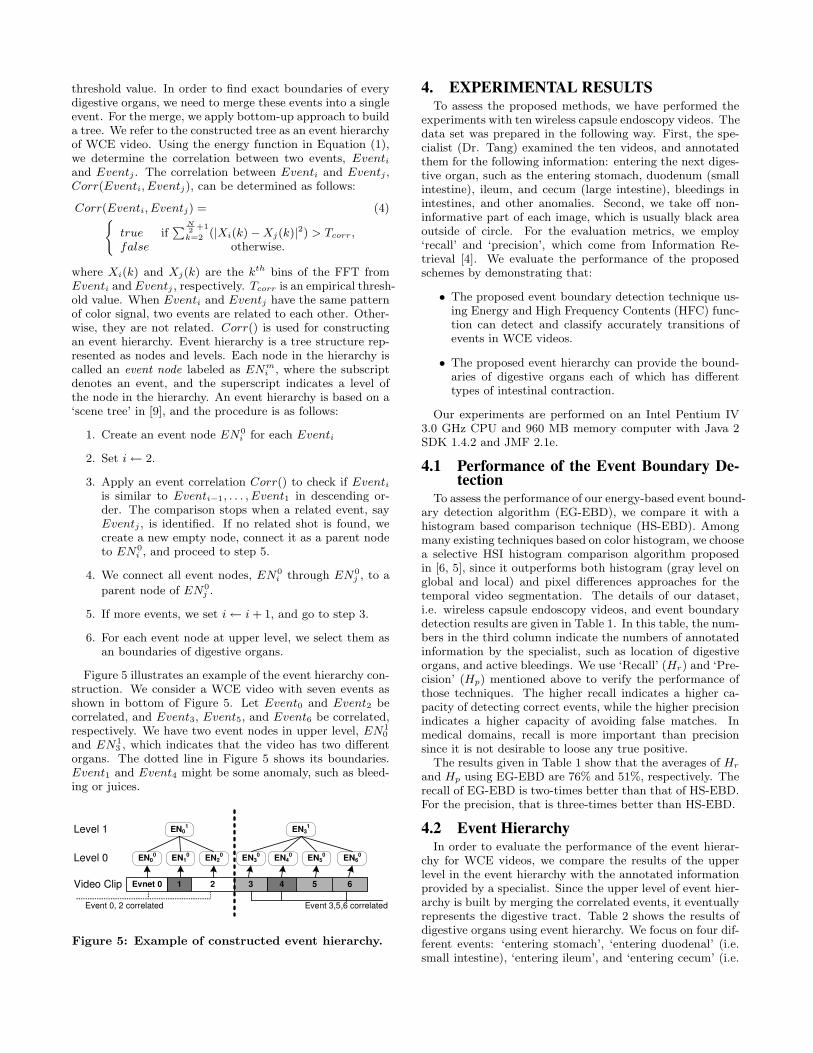
Figure 5 illustrates an example of the event hierarchy con-struction. We consider a WCE video with seven events asshown in bottom of Figure 5. Let Event0 and Event2 becorrelated, and Event3, Event5, and Event6 be correlated,respectively. We have two event nodes in upper level, EN1
0
and EN13 , which indicates that the video has two different
organs. The dotted line in Figure 5 shows its boundaries.Event1 and Event4 might be some anomaly, such as bleed-ing or juices.
EN1
0EN2
0EN3
0EN4
0EN0
0
EN0
1EN3
1
Level 0
Level 1
Evnet 0 1 2
EN5
0EN6
0
3 4 5 6
Event 0, 2 correlated Event 3,5,6 correlated
Video Clip
Figure 5: Example of constructed event hierarchy.
4. EXPERIMENTAL RESULTSTo assess the proposed methods, we have performed the
experiments with ten wireless capsule endoscopy videos. Thedata set was prepared in the following way. First, the spe-cialist (Dr. Tang) examined the ten videos, and annotatedthem for the following information: entering the next diges-tive organ, such as the entering stomach, duodenum (smallintestine), ileum, and cecum (large intestine), bleedings inintestines, and other anomalies. Second, we take off non-informative part of each image, which is usually black areaoutside of circle. For the evaluation metrics, we employ‘recall’ and ‘precision’, which come from Information Re-trieval [4]. We evaluate the performance of the proposedschemes by demonstrating that:
• The proposed event boundary detection technique us-ing Energy and High Frequency Contents (HFC) func-tion can detect and classify accurately transitions ofevents in WCE videos.
• The proposed event hierarchy can provide the bound-aries of digestive organs each of which has differenttypes of intestinal contraction.
Our experiments are performed on an Intel Pentium IV3.0 GHz CPU and 960 MB memory computer with Java 2SDK 1.4.2 and JMF 2.1e.
4.1 Performance of the Event Boundary De-tection
To assess the performance of our energy-based event bound-ary detection algorithm (EG-EBD), we compare it with ahistogram based comparison technique (HS-EBD). Amongmany existing techniques based on color histogram, we choosea selective HSI histogram comparison algorithm proposedin [6, 5], since it outperforms both histogram (gray level onglobal and local) and pixel differences approaches for thetemporal video segmentation. The details of our dataset,i.e. wireless capsule endoscopy videos, and event boundarydetection results are given in Table 1. In this table, the num-bers in the third column indicate the numbers of annotatedinformation by the specialist, such as location of digestiveorgans, and active bleedings. We use ‘Recall’ (Hr) and ‘Pre-cision’ (Hp) mentioned above to verify the performance ofthose techniques. The higher recall indicates a higher ca-pacity of detecting correct events, while the higher precisionindicates a higher capacity of avoiding false matches. Inmedical domains, recall is more important than precisionsince it is not desirable to loose any true positive.
The results given in Table 1 show that the averages of Hr
and Hp using EG-EBD are 76% and 51%, respectively. Therecall of EG-EBD is two-times better than that of HS-EBD.For the precision, that is three-times better than HS-EBD.
4.2 Event HierarchyIn order to evaluate the performance of the event hierar-
chy for WCE videos, we compare the results of the upperlevel in the event hierarchy with the annotated informationprovided by a specialist. Since the upper level of event hier-archy is built by merging the correlated events, it eventuallyrepresents the digestive tract. Table 2 shows the results ofdigestive organs using event hierarchy. We focus on four dif-ferent events: ‘entering stomach’, ‘entering duodenal’ (i.e.small intestine), ‘entering ileum’, and ‘entering cecum’ (i.e.
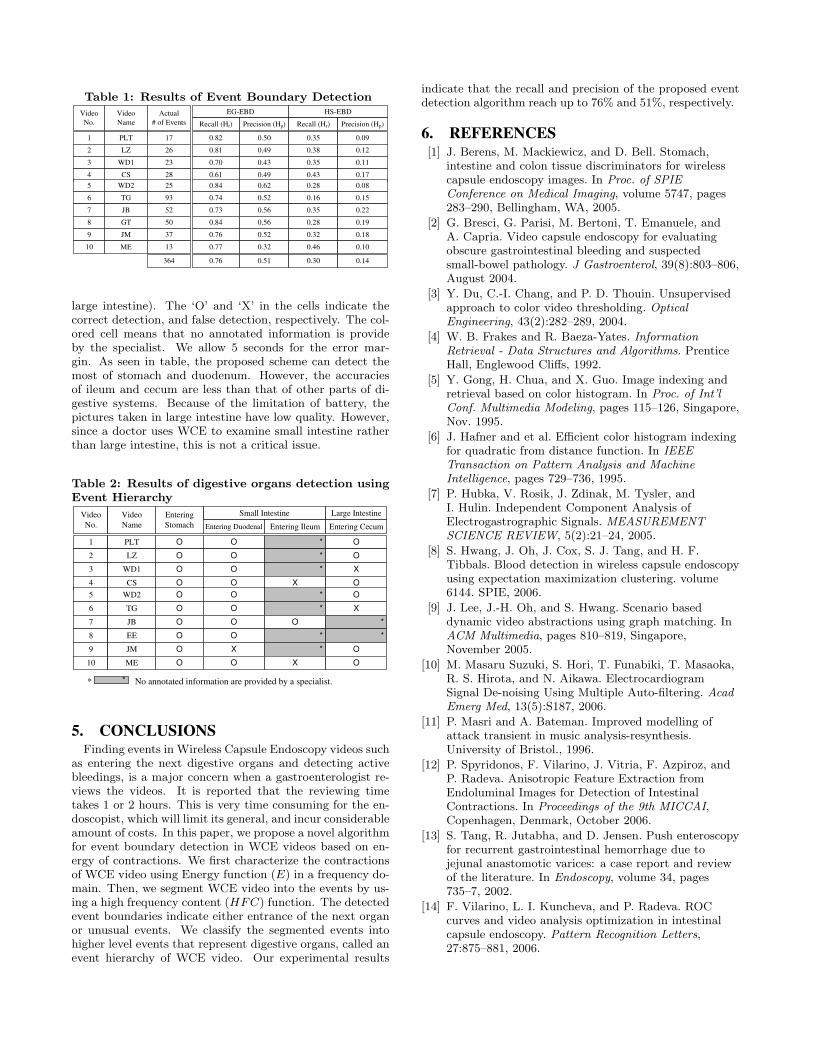
Table 1: Results of Event Boundary Detection
Video
No.
EG-EBDActual
# of Events Recall (Hr) Precision (Hp)
HS-EBD
Recall (Hr) Precision (Hp)
1 17 0.82 0.50 0.35 0.09
2 26 0.81 0.49 0.38 0.12
3 23 0.70 0.43 0.35 0.11
4 28 0.61 0.49 0.43 0.17
5 25 0.84 0.62 0.28 0.08
6 93 0.74 0.52 0.16 0.15
7 52 0.73 0.56 0.35 0.22
8 50 0.84 0.56 0.28 0.19
9 37 0.76 0.52 0.32 0.18
10 13 0.77 0.32 0.46 0.10
364 0.76 0.51 0.30 0.14
Video
Name
PLT
LZ
WD1
CS
WD2
TG
JB
GT
JM
ME
large intestine). The ‘O’ and ‘X’ in the cells indicate thecorrect detection, and false detection, respectively. The col-ored cell means that no annotated information is provideby the specialist. We allow 5 seconds for the error mar-gin. As seen in table, the proposed scheme can detect themost of stomach and duodenum. However, the accuraciesof ileum and cecum are less than that of other parts of di-gestive systems. Because of the limitation of battery, thepictures taken in large intestine have low quality. However,since a doctor uses WCE to examine small intestine ratherthan large intestine, this is not a critical issue.
Table 2: Results of digestive organs detection usingEvent Hierarchy
Video
No.
Small IntestineEntering
Stomach Entering Duodenal Entering Ileum
Large Intestine
Entering Cecum
1 O O * O
2 O O * O
3 O O * X
4 O O X O
5 O O * O
6 O O * X
7 O O O *
8 O O * *
9 O X * O
10 O O X O
Video
Name
PLT
LZ
WD1
CS
WD2
TG
JB
EE
JM
ME
** No annotated information are provided by a specialist.
5. CONCLUSIONSFinding events in Wireless Capsule Endoscopy videos such
as entering the next digestive organs and detecting activebleedings, is a major concern when a gastroenterologist re-views the videos. It is reported that the reviewing timetakes 1 or 2 hours. This is very time consuming for the en-doscopist, which will limit its general, and incur considerableamount of costs. In this paper, we propose a novel algorithmfor event boundary detection in WCE videos based on en-ergy of contractions. We first characterize the contractionsof WCE video using Energy function (E) in a frequency do-main. Then, we segment WCE video into the events by us-ing a high frequency content (HFC) function. The detectedevent boundaries indicate either entrance of the next organor unusual events. We classify the segmented events intohigher level events that represent digestive organs, called anevent hierarchy of WCE video. Our experimental results
indicate that the recall and precision of the proposed eventdetection algorithm reach up to 76% and 51%, respectively.
6. REFERENCES[1] J. Berens, M. Mackiewicz, and D. Bell. Stomach,
intestine and colon tissue discriminators for wirelesscapsule endoscopy images. In Proc. of SPIEConference on Medical Imaging, volume 5747, pages283–290, Bellingham, WA, 2005.
[2] G. Bresci, G. Parisi, M. Bertoni, T. Emanuele, andA. Capria. Video capsule endoscopy for evaluatingobscure gastrointestinal bleeding and suspectedsmall-bowel pathology. J Gastroenterol, 39(8):803–806,August 2004.
[3] Y. Du, C.-I. Chang, and P. D. Thouin. Unsupervisedapproach to color video thresholding. OpticalEngineering, 43(2):282–289, 2004.
[4] W. B. Frakes and R. Baeza-Yates. InformationRetrieval - Data Structures and Algorithms. PrenticeHall, Englewood Cliffs, 1992.
[5] Y. Gong, H. Chua, and X. Guo. Image indexing andretrieval based on color histogram. In Proc. of Int’lConf. Multimedia Modeling, pages 115–126, Singapore,Nov. 1995.
[6] J. Hafner and et al. Efficient color histogram indexingfor quadratic from distance function. In IEEETransaction on Pattern Analysis and MachineIntelligence, pages 729–736, 1995.
[7] P. Hubka, V. Rosik, J. Zdinak, M. Tysler, andI. Hulin. Independent Component Analysis ofElectrogastrographic Signals. MEASUREMENTSCIENCE REVIEW, 5(2):21–24, 2005.
[8] S. Hwang, J. Oh, J. Cox, S. J. Tang, and H. F.Tibbals. Blood detection in wireless capsule endoscopyusing expectation maximization clustering. volume6144. SPIE, 2006.
[9] J. Lee, J.-H. Oh, and S. Hwang. Scenario baseddynamic video abstractions using graph matching. InACM Multimedia, pages 810–819, Singapore,November 2005.
[10] M. Masaru Suzuki, S. Hori, T. Funabiki, T. Masaoka,R. S. Hirota, and N. Aikawa. ElectrocardiogramSignal De-noising Using Multiple Auto-filtering. AcadEmerg Med, 13(5):S187, 2006.
[11] P. Masri and A. Bateman. Improved modelling ofattack transient in music analysis-resynthesis.University of Bristol., 1996.
[12] P. Spyridonos, F. Vilarino, J. Vitria, F. Azpiroz, andP. Radeva. Anisotropic Feature Extraction fromEndoluminal Images for Detection of IntestinalContractions. In Proceedings of the 9th MICCAI,Copenhagen, Denmark, October 2006.
[13] S. Tang, R. Jutabha, and D. Jensen. Push enteroscopyfor recurrent gastrointestinal hemorrhage due tojejunal anastomotic varices: a case report and reviewof the literature. In Endoscopy, volume 34, pages735–7, 2002.
[14] F. Vilarino, L. I. Kuncheva, and P. Radeva. ROCcurves and video analysis optimization in intestinalcapsule endoscopy. Pattern Recognition Letters,27:875–881, 2006.