Automatic calibration and equalization of a Line Array System
8
Proc. of the 18 th Int. Conference on Digital Audio Effects (DAFx-15), Trondheim, Norway, Nov 30 - Dec 3, 2015 AUTOMATIC CALIBRATION AND EQUALIZATION OF A LINE ARRAY SYSTEM Fernando Vidal Wagner and Vesa Välimäki Department of Signal Processing and Acoustics Aalto University Espoo, Finland [email protected] [email protected] ABSTRACT This paper presents an automated Public Address processing unit, using delay and magnitude response adjustment. The aim is to achieve a flat frequency response and delay adjustment between different physically-placed speakers at the measuring point, which is nowadays usually made manually by the sound technician. The adjustment is obtained using three signal processing operations to the audio signal: time delay adjustment, crossover filtering, and graphic equalization. The automation is in the calculation of dif- ferent parameter sets: estimation of the time delay, the selection of a suitable crossover frequency, and calculation of the gains for a third-octave graphic equalizer. These automatic methods reduce time and effort in the calibration of line-array PA systems, since only three sine sweeps must be played through the sound system. Measurements have been conducted in an anechoic chamber using a 1:10 scale model of a line array system to verify the functioning of the automatic calibration and equalization methods. 1. INTRODUCTION During the last decade, the music industry business model has shifted from record releasing to promote live performances, raising the number and quality of concerts. Live audio systems have be- come more complex due to the computer-controlled digital signal processing part and the acoustical improvements using innovative loudspeaker systems. The vast majority of concert Public Address (PA) systems used nowadays consist of hanging line arrays, which help reduce acous- tic shadows and increase the distance of the line source effect [1, 2]. These speakers are used to reproduce the middle and high fre- quencies, usually above 100 Hz to 150 Hz. For the low frequency coverage different subwoofer configurations are used, which are usually placed on the floor in front of the stage. These loudspeaker configurations requires various signal pro- cessing techniques in order to achieve a flat and coherent response. Basically the calibration consists of three operations: apply a crossover to split the audio band between the subwoofers and the line array, adjust a time delay [3] and equalize the complete system to achieve a flat magnitude response. Figure 1 shows a two-dimensional diagram with approximate values of the relative delay problem. Different arrival times of the wavefront from the subwoofers and the line array speakers, which are physically at different positions provoke phase shading, strongly noticed in the crossover band. As line array elements can be divided in different vertical sections for short, mid or long throws, the system adjustment is also possible at several measuring positions, placed at different distances from the stage. In our work, just one measuring point has been taken in to account. The target area is usually placed at the Front of House position [4]. A similar phenomenon occurs between the loudspeaker com- ponents in the line array, which can be treated with different DSP procedures to compensate those problems [5], but the relative po- sition between the array elements is limited. Lots of improvements using DSP and Wave Field Synthesis have been done the last years to control the response and directivity of line arrays [6, 7] but the complete system tuning has not had such attention. In the case of the subwoofers and the line array, those can be placed at very different positions and configurations depending on the venue, the characteristics of the stage, and the space where it takes place. Nowadays there are several automated systems, though they are usually bundled to a specific brand with pre-loaded speaker data, such as Meyer Sound’s Galileo [8], or need additional tools to integrate it with the system processor. The consequence of this is that most of the small and mid sized line array systems are still adjusted manually using PA processing units in addition to graphic equalizers. The manual procedure requires to play different ex- citation signals, usually pseudorandom [9] pink-spectrum noise through the PA, which is disturbing for the audience and time con- suming. For this reason it has to be adjusted and configured hours prior to the venue. The sound engineer adjusts then the crossover frequency and filter type, the delay of the different loudspeakers and the graphic equalizer supported by a spectrum and phase ana- lyzer. Some examples are EASERA [10] and Smaart [11]. In this paper we explain a method to automatically perform the adjustment of those three operations playing three sweep sig- nals through the PA. This avoids all the manual procedure, and it can be done even with audience, as spreading the spectral en- ergy along time and makes it less noticeable and disturbing than pseudorandom noise, being therefore much more time and effort d1 d2 20 m 1.7 m 6 m 2 m +/- 3m Figure 1: Relative distances to measuring point. DAFX-1
Transcript of Automatic calibration and equalization of a Line Array System
Proc. of the 18th Int. Conference on Digital Audio Effects (DAFx-15), Trondheim, Norway, Nov 30 - Dec 3, 2015
AUTOMATIC CALIBRATION AND EQUALIZATION OF A LINE ARRAY SYSTEM
Fernando Vidal Wagner and Vesa Välimäki
Department of Signal Processing and AcousticsAalto UniversityEspoo, Finland
[email protected] [email protected]
ABSTRACT
This paper presents an automated Public Address processingunit, using delay and magnitude response adjustment. The aim isto achieve a flat frequency response and delay adjustment betweendifferent physically-placed speakers at the measuring point, whichis nowadays usually made manually by the sound technician. Theadjustment is obtained using three signal processing operations tothe audio signal: time delay adjustment, crossover filtering, andgraphic equalization. The automation is in the calculation of dif-ferent parameter sets: estimation of the time delay, the selectionof a suitable crossover frequency, and calculation of the gains fora third-octave graphic equalizer. These automatic methods reducetime and effort in the calibration of line-array PA systems, sinceonly three sine sweeps must be played through the sound system.Measurements have been conducted in an anechoic chamber usinga 1:10 scale model of a line array system to verify the functioningof the automatic calibration and equalization methods.
1. INTRODUCTION
During the last decade, the music industry business model hasshifted from record releasing to promote live performances, raisingthe number and quality of concerts. Live audio systems have be-come more complex due to the computer-controlled digital signalprocessing part and the acoustical improvements using innovativeloudspeaker systems.
The vast majority of concert Public Address (PA) systems usednowadays consist of hanging line arrays, which help reduce acous-tic shadows and increase the distance of the line source effect [1,2]. These speakers are used to reproduce the middle and high fre-quencies, usually above 100 Hz to 150 Hz. For the low frequencycoverage different subwoofer configurations are used, which areusually placed on the floor in front of the stage.
These loudspeaker configurations requires various signal pro-cessing techniques in order to achieve a flat and coherent response.Basically the calibration consists of three operations: apply a crossoverto split the audio band between the subwoofers and the line array,adjust a time delay [3] and equalize the complete system to achievea flat magnitude response.
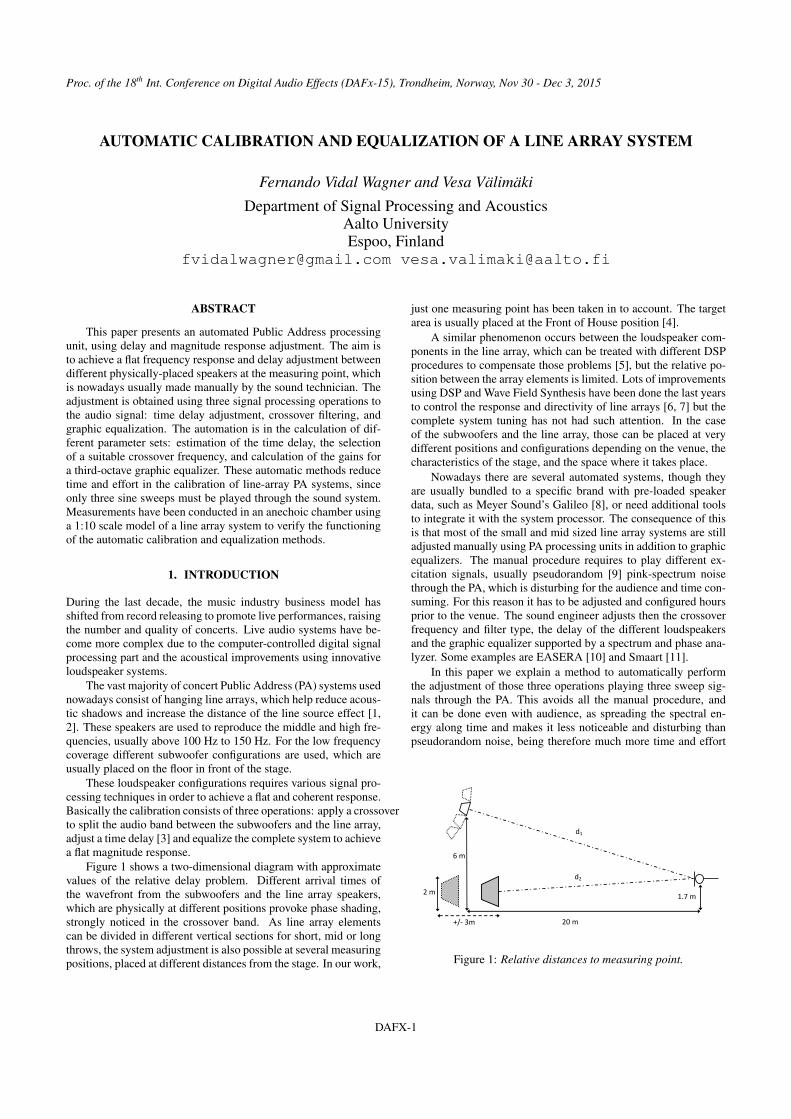
Figure 1 shows a two-dimensional diagram with approximatevalues of the relative delay problem. Different arrival times ofthe wavefront from the subwoofers and the line array speakers,which are physically at different positions provoke phase shading,strongly noticed in the crossover band. As line array elementscan be divided in different vertical sections for short, mid or longthrows, the system adjustment is also possible at several measuringpositions, placed at different distances from the stage. In our work,
just one measuring point has been taken in to account. The targetarea is usually placed at the Front of House position [4].
A similar phenomenon occurs between the loudspeaker com-ponents in the line array, which can be treated with different DSPprocedures to compensate those problems [5], but the relative po-sition between the array elements is limited. Lots of improvementsusing DSP and Wave Field Synthesis have been done the last yearsto control the response and directivity of line arrays [6, 7] but thecomplete system tuning has not had such attention. In the caseof the subwoofers and the line array, those can be placed at verydifferent positions and configurations depending on the venue, thecharacteristics of the stage, and the space where it takes place.
Nowadays there are several automated systems, though theyare usually bundled to a specific brand with pre-loaded speakerdata, such as Meyer Sound’s Galileo [8], or need additional toolsto integrate it with the system processor. The consequence of thisis that most of the small and mid sized line array systems are stilladjusted manually using PA processing units in addition to graphicequalizers. The manual procedure requires to play different ex-citation signals, usually pseudorandom [9] pink-spectrum noisethrough the PA, which is disturbing for the audience and time con-suming. For this reason it has to be adjusted and configured hoursprior to the venue. The sound engineer adjusts then the crossoverfrequency and filter type, the delay of the different loudspeakersand the graphic equalizer supported by a spectrum and phase ana-lyzer. Some examples are EASERA [10] and Smaart [11].
In this paper we explain a method to automatically performthe adjustment of those three operations playing three sweep sig-nals through the PA. This avoids all the manual procedure, andit can be done even with audience, as spreading the spectral en-ergy along time and makes it less noticeable and disturbing thanpseudorandom noise, being therefore much more time and effort
d1
d2
20 m
1.7 m
6 m
2 m
+/- 3m
Figure 1: Relative distances to measuring point.
DAFX-1
Proc. of the 18th Int. Conference on Digital Audio Effects (DAFx-15), Trondheim, Norway, Nov 30 - Dec 3, 2015
Graphic
EQ
HF gain
Main mix IN
Line Array
Subwoofers
X-Over
�lters
LF gain
Delay
Delay
Figure 2: One channel of the signal processing chain for a PA.
efficient.In order to evaluate the system, a 1:10 factor scale model was
tested in an anechoic chamber. Thus, the distances were divided by10, and the frequencies were multiplied by 10. To be able to workwith standard audio material and avoid problems due to increasedair absorption and distortions in ultrasound band, the system hasbeen tested with frequencies up to 20 kHz in the scale model. Thislimitation is affordable as the main phase, crossover and equaliza-tion issues happen in the crossover and middle band. Therefore theresults shown in the paper have to be analyzed as 10 times scaledto a real model and band limited to 2 kHz in a real application.
This paper is organized as follows. In Section 2, the calibra-tion system and the test setup are explained. Section 3 describesthe details of signal processing operations. Section 4 discusses theground reflection problem and how it can be treated. Conclusionsand future applications are explained in Section 5.
2. SYSTEM OVERVIEW
In this section a brief explanation of the different steps in the sig-nal processing and parameter calculation is given. In Section 2.1an introduction to the actual processing operations applied to theaudio signal is made. In Sections 2.2 and 2.3 the different opera-tions are explained in order to obtain automatically the parameters.
Three sweeps will be used in total. The first two sweeps col-lect separately the responses of the subwoofers and the line arrayto calculate the different audio processing chain parameters. Thethird sweep runs trough the designed processing chain and soundsthrough the whole PA for verifying and re-adjusting some param-eters if necessary.
2.1. Audio processing chain
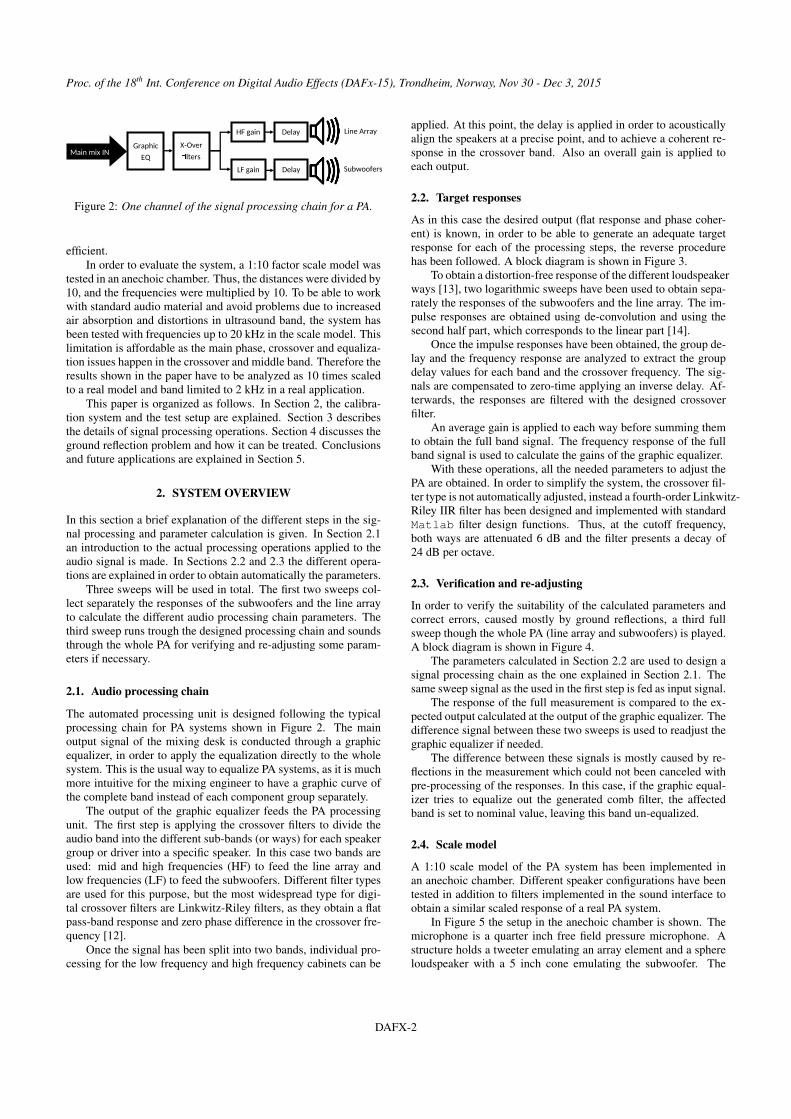
The automated processing unit is designed following the typicalprocessing chain for PA systems shown in Figure 2. The mainoutput signal of the mixing desk is conducted through a graphicequalizer, in order to apply the equalization directly to the wholesystem. This is the usual way to equalize PA systems, as it is muchmore intuitive for the mixing engineer to have a graphic curve ofthe complete band instead of each component group separately.
The output of the graphic equalizer feeds the PA processingunit. The first step is applying the crossover filters to divide theaudio band into the different sub-bands (or ways) for each speakergroup or driver into a specific speaker. In this case two bands areused: mid and high frequencies (HF) to feed the line array andlow frequencies (LF) to feed the subwoofers. Different filter typesare used for this purpose, but the most widespread type for digi-tal crossover filters are Linkwitz-Riley filters, as they obtain a flatpass-band response and zero phase difference in the crossover fre-quency [12].
Once the signal has been split into two bands, individual pro-cessing for the low frequency and high frequency cabinets can be
applied. At this point, the delay is applied in order to acousticallyalign the speakers at a precise point, and to achieve a coherent re-sponse in the crossover band. Also an overall gain is applied toeach output.
2.2. Target responses
As in this case the desired output (flat response and phase coher-ent) is known, in order to be able to generate an adequate targetresponse for each of the processing steps, the reverse procedurehas been followed. A block diagram is shown in Figure 3.
To obtain a distortion-free response of the different loudspeakerways [13], two logarithmic sweeps have been used to obtain sepa-rately the responses of the subwoofers and the line array. The im-pulse responses are obtained using de-convolution and using thesecond half part, which corresponds to the linear part [14].
Once the impulse responses have been obtained, the group de-lay and the frequency response are analyzed to extract the groupdelay values for each band and the crossover frequency. The sig-nals are compensated to zero-time applying an inverse delay. Af-terwards, the responses are filtered with the designed crossoverfilter.
An average gain is applied to each way before summing themto obtain the full band signal. The frequency response of the fullband signal is used to calculate the gains of the graphic equalizer.
With these operations, all the needed parameters to adjust thePA are obtained. In order to simplify the system, the crossover fil-ter type is not automatically adjusted, instead a fourth-order Linkwitz-Riley IIR filter has been designed and implemented with standardMatlab filter design functions. Thus, at the cutoff frequency,both ways are attenuated 6 dB and the filter presents a decay of24 dB per octave.
2.3. Verification and re-adjusting
In order to verify the suitability of the calculated parameters andcorrect errors, caused mostly by ground reflections, a third fullsweep though the whole PA (line array and subwoofers) is played.A block diagram is shown in Figure 4.
The parameters calculated in Section 2.2 are used to design asignal processing chain as the one explained in Section 2.1. Thesame sweep signal as the used in the first step is fed as input signal.
The response of the full measurement is compared to the ex-pected output calculated at the output of the graphic equalizer. Thedifference signal between these two sweeps is used to readjust thegraphic equalizer if needed.
The difference between these signals is mostly caused by re-flections in the measurement which could not been canceled withpre-processing of the responses. In this case, if the graphic equal-izer tries to equalize out the generated comb filter, the affectedband is set to nominal value, leaving this band un-equalized.
2.4. Scale model
A 1:10 scale model of the PA system has been implemented inan anechoic chamber. Different speaker configurations have beentested in addition to filters implemented in the sound interface toobtain a similar scaled response of a real PA system.
In Figure 5 the setup in the anechoic chamber is shown. Themicrophone is a quarter inch free field pressure microphone. Astructure holds a tweeter emulating an array element and a sphereloudspeaker with a 5 inch cone emulating the subwoofer. The
DAFX-2

Proc. of the 18th Int. Conference on Digital Audio Effects (DAFx-15), Trondheim, Norway, Nov 30 - Dec 3, 2015
Impulse response
treatment
Group delay
HF Audio in
Averaging HF Sample delay
Spectral
Smoothing
Impulse response
treatment
Group delay
LF Audio in
Averaging LF Sample delay
Spectral
Smoothing
X-Over
frequency
X-Over point
defini!on
X-Over + Delay
Channel
leveling
LF gain
HF gain
GEQ
parameters
GEQ gains
Reflec!on
cancelling Expected
response
HF Sweep
LF Sweep
X-Over + Delay
+
Figure 3: Parameter calculation block diagram.
Audio in Sweep Parallel GEQ X-Over filters
HF gain
LF gain
Delay
Delay
GEQ gains X-Over frequency
Δ delay FFT Comparison with
expected
GEQ parameter
recalcula)on
Defini)ve GEQ
gains
Figure 4: Verification and re-adjusting block diagram.
Figure 5: Image of the scale model in the anechoic room. The bassand treble speakers are seen on the right, the microphone on theleft, and a reflection plate below it.
structure allows to move freely the high and low-frequency speak-ers to arrange different setups. In order to test the influence of theground reflection, laminated wooden plates have been used.
The prediction is band limited from 300 Hz to 20 kHz, whichequals a real case scenario from 30 Hz to 2 kHz. The sweeps
have been performed from 200 Hz to 40 kHz during 3 seconds,as the used HF speaker has a reasnoable flat response up to thisfrequency, and could be equalized up to this band. A 96-kHz sam-pling frequency has been used for the anechoic measurements.
The fact of testing the system with a 1:10 scale model impliesthat the precision of the time related measures has to be also 10times higher. Both measurements, with and without ground reflec-tion, have been taken place.
The wooden panels used in the scale model exaggerate theintensity of a ground reflection in real case scenarios, with an av-erage absorption coefficient around 0.4, which means that the re-flected signal intensity is between −2 and −3 dB below the directsound intensity.
3. CALIBRATION AND EQUALIZATION METHODS
In this section a detailed explanation of the procedures for obtain-ing the parameters explained in Section 2.2 is given.
3.1. Impulse response acquisition
As the system is designed to work in rough environments, a pre-processing of the measured responses is made to avoid undesiredreflections to affect the measure and to compensate the measure-ment system errors.
DAFX-3
Proc. of the 18th Int. Conference on Digital Audio Effects (DAFx-15), Trondheim, Norway, Nov 30 - Dec 3, 2015
ms
0 1 2 3 4 5 6 7 8 9 10
×10-3
-4
-2
0
2
4Impulse response
10xLF
HF
Frequency / Hz
500 1k 1.5k 2k 2.5k 3k 4k 5k 10k 20k
Magnitude / d
B
-25
-20
-15
-10
-5
0Frequency response
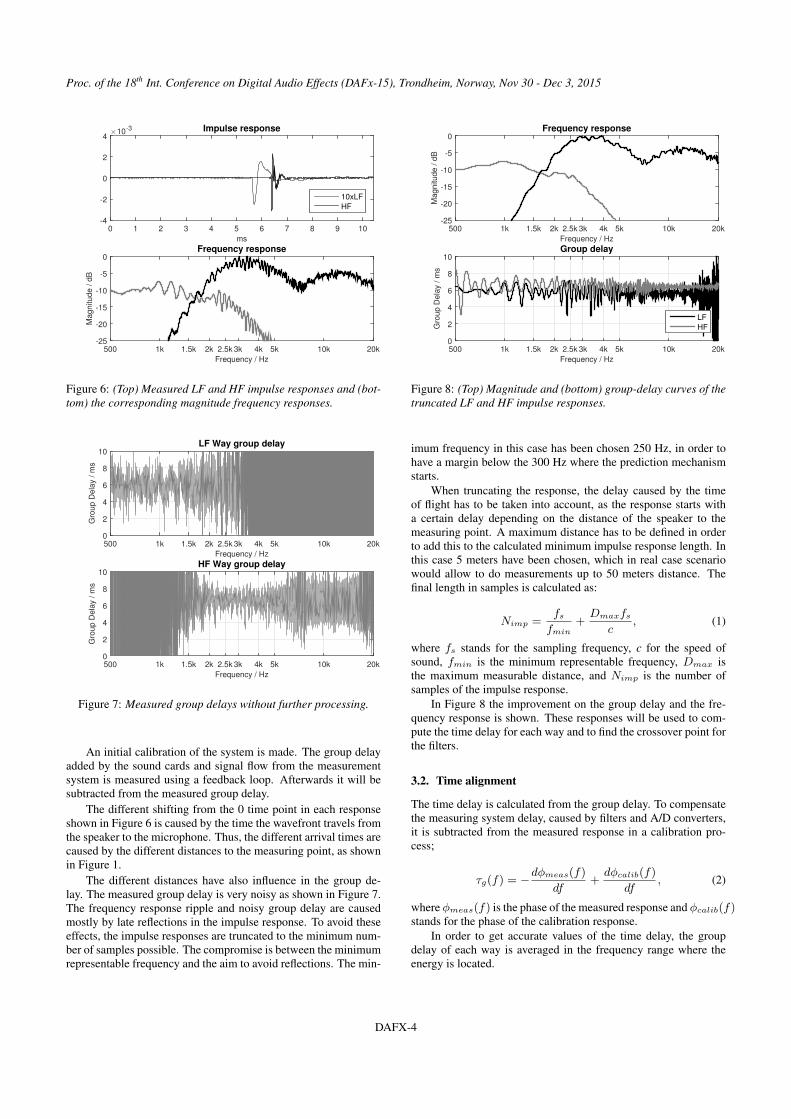
Figure 6: (Top) Measured LF and HF impulse responses and (bot-tom) the corresponding magnitude frequency responses.
Frequency / Hz
500 1k 1.5k 2k 2.5k 3k 4k 5k 10k 20k
Gro
up D
ela
y / m
s
0
2
4
6
8
10LF Way group delay
Frequency / Hz
500 1k 1.5k 2k 2.5k 3k 4k 5k 10k 20k
Gro
up D
ela
y / m
s
0
2
4
6
8
10HF Way group delay
Figure 7: Measured group delays without further processing.
An initial calibration of the system is made. The group delayadded by the sound cards and signal flow from the measurementsystem is measured using a feedback loop. Afterwards it will besubtracted from the measured group delay.
The different shifting from the 0 time point in each responseshown in Figure 6 is caused by the time the wavefront travels fromthe speaker to the microphone. Thus, the different arrival times arecaused by the different distances to the measuring point, as shownin Figure 1.
The different distances have also influence in the group de-lay. The measured group delay is very noisy as shown in Figure 7.The frequency response ripple and noisy group delay are causedmostly by late reflections in the impulse response. To avoid theseeffects, the impulse responses are truncated to the minimum num-ber of samples possible. The compromise is between the minimumrepresentable frequency and the aim to avoid reflections. The min-
Frequency / Hz
500 1k 1.5k 2k 2.5k 3k 4k 5k 10k 20k
Magnitude / d
B
-25
-20
-15
-10
-5
0Frequency response
Frequency / Hz
500 1k 1.5k 2k 2.5k 3k 4k 5k 10k 20k
Gro
up D
ela
y / m
s
0
2
4
6
8
10Group delay
LF
HF
Figure 8: (Top) Magnitude and (bottom) group-delay curves of thetruncated LF and HF impulse responses.
imum frequency in this case has been chosen 250 Hz, in order tohave a margin below the 300 Hz where the prediction mechanismstarts.
When truncating the response, the delay caused by the timeof flight has to be taken into account, as the response starts witha certain delay depending on the distance of the speaker to themeasuring point. A maximum distance has to be defined in orderto add this to the calculated minimum impulse response length. Inthis case 5 meters have been chosen, which in real case scenariowould allow to do measurements up to 50 meters distance. Thefinal length in samples is calculated as:
Nimp =fsfmin
+Dmaxfs
c, (1)
where fs stands for the sampling frequency, c for the speed ofsound, fmin is the minimum representable frequency, Dmax isthe maximum measurable distance, and Nimp is the number ofsamples of the impulse response.
In Figure 8 the improvement on the group delay and the fre-quency response is shown. These responses will be used to com-pute the time delay for each way and to find the crossover point forthe filters.
3.2. Time alignment
The time delay is calculated from the group delay. To compensatethe measuring system delay, caused by filters and A/D converters,it is subtracted from the measured response in a calibration pro-cess;
τg(f) = −dφmeas(f)
df+dφcalib(f)
df, (2)
where φmeas(f) is the phase of the measured response and φcalib(f)stands for the phase of the calibration response.
In order to get accurate values of the time delay, the groupdelay of each way is averaged in the frequency range where theenergy is located.
DAFX-4

Proc. of the 18th Int. Conference on Digital Audio Effects (DAFx-15), Trondheim, Norway, Nov 30 - Dec 3, 2015
To achieve fine tuning in the calculated delay, fractional de-lay lines have been implemented using a linear interpolation filter[15]. As the linear interpolator, which is a two-tap FIR filter, has alowpass magnitude response, it has only been implemented in theLF band. The fractional part of the HF band is subtracted fromthe LF band to compensate the relative delay. Also some offsetsamples are subtracted from the calculated time delay in order notto truncate the impulse response peak. The delay values are calcu-lated as:
DHF ′ =∑f2
f1τg(f)
f2 − f1−NHF , (3)
DHF = bDHF ′c, (4)
DLF =
∑f4f3τg(f)
f4 − f3−NHF − (DHF ′ −DHF ), (5)
where N stands for the offset in samples and D is the delay amountin samples. The values of f3 and f4 are 1 and 5 kHz for LF and f1and f2 are 2 and 10 kHz in the HF band. These limits are chosenas the signals contain its energy this range, thus the group delayhas valid values. In Table 1 a comparison between real measureddistances and calculated via group delay averaging is presented.
The error is as low as 5 mm for high frequencies and 21 mmfor low frequencies. The overall error is about 3 cm, which equalshalf wavelength at about 5.7 kHz, far beyond the interaction bandof both ways.
Once the delay values have been determined, the signals aretruncated according to the group delay adjusting them to the zeropoint. In Figure 9 the compensated impulse responses and thegroup delay are shown. The group delay is not exactly zero andflat. The slope is caused by the loudspeakers, as they are not ex-actly linear or minimum phase.
3.3. Choosing the crossover frequency
The crossover frequency is defined from the smoothed frequencyresponses obtained by the truncated impulse responses. For the LFand HF frequency responses the peak frequency and its magnitudevalue is searched. From the peak frequency a search for the -6 dBpoint is performed. For the LF band, the search is made from thepeak toward higher frequencies, and for the HF band from the peaktoward lower frequencies. These are estimated the cutoff frequen-cies for the subwoofers and the line array as shown in Figure 10.A limited crossover frequency band is determined, to avoid thatpeaks in higher areas of the HF frequency response cause shiftingin the calulated crossover frequency (in the scale model between 1and 4 kHz).
The crossover point can be determined by choosing a frequencypoint between the cutoff frequencies, allowing to exploit more the
Table 1: Measured vs calculated distances in mm.
Way Measured Calculated ∆LF 1978 1957 -21HF 2305 2310 5
ms
0 0.5 1 1.5 2 2.5 3 3.5 4
×10-3
-4
-2
0
2
4Impulse response
10xLF
HF
Frequency / Hz
500 1k 1.5k 2k 2.5k 3k 4k 5k 10k 20k
Gro
up D
ela
y / m
s
-2
-1
0
1
2Group delay
LF
HF
Figure 9: (Top) Truncated and time aligned LF and HF impulsesresponses and (bottom) their group-delay curves.
Frequency / Hz
1.00k
Xov=2.40k 3.72k
Magnitude / d
B
LF -6dB
LF PkHF -6dB
HF Pk
Sub CUT=2.84k
Array CUT=1.96k
Figure 10: Crossover frequency determination. The estimatedpeaks of LF and HF responses are marked with circles, and the–6-dB points are marked with asterisks. The selected crossoverfrequency is indicated with a vertical dash-dot line.
subwoofers using higher frequencies or the line array using lowerfrequencies in this band. In the model case, different options havebeen tested, and the middle point on the linear frequency scale hasbeen used as the crossover frequency.
At this point, the Linkwitz-Riley filters are designed and im-plemented. Two second-order Butterworth filters with the chosencutoff frequency are chained. In Figure 11 the input frequencyresponses are shown as well as the filtered responses. Also it isobserved that the group delays of the filtered signals are very closeto each other in the crossover band.
Next an average gain is applied to each band before obtainingthe full band signal. The average level values are calculated foreach way. Then a general target level is calculated by averaging
DAFX-5
Proc. of the 18th Int. Conference on Digital Audio Effects (DAFx-15), Trondheim, Norway, Nov 30 - Dec 3, 2015
Frequency / Hz
200 500 1k 1.5k X-Ov 4k 5k 10k
Magnitude / d
B
-30
-20
-10
0In/Out Frequency responses
Lowpass
LF In
Highpass
HF In
Frequency / Hz
200 500 1k 1.5k X-Ov 4k 5k 10k
Gro
up D
ela
y / m
s
-2
-1
0
1
2Output group delays
Lowpass
Highpass
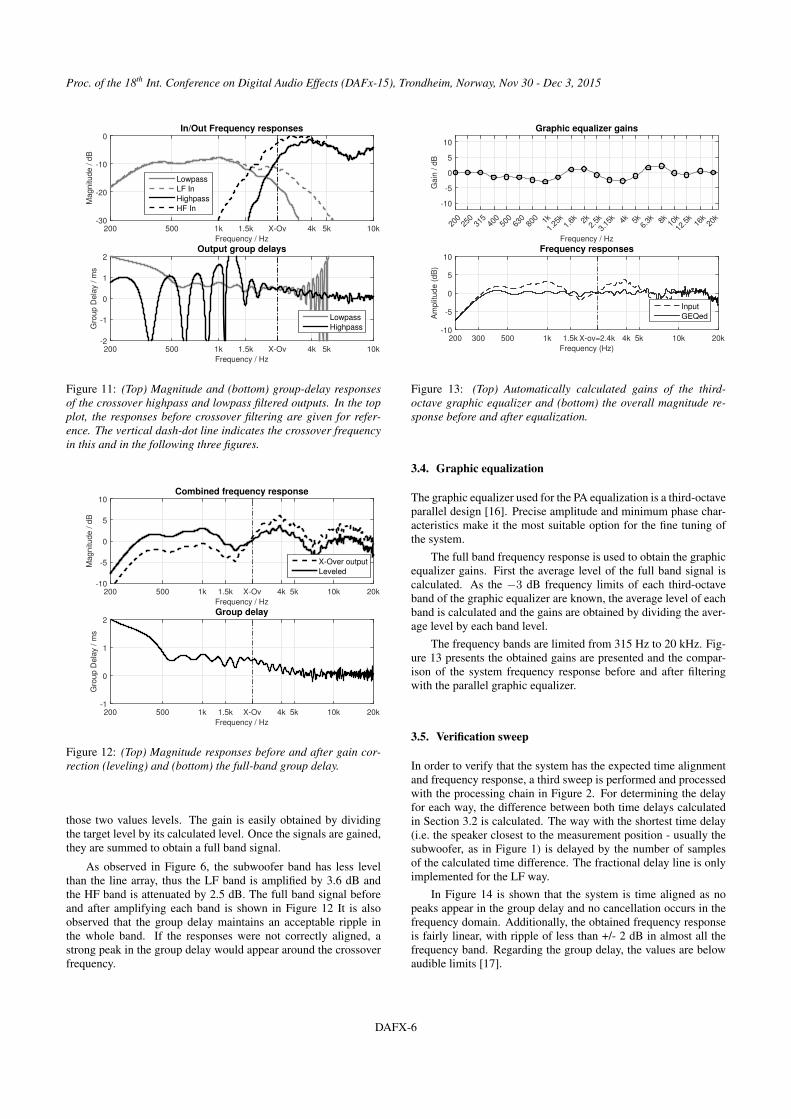
Figure 11: (Top) Magnitude and (bottom) group-delay responsesof the crossover highpass and lowpass filtered outputs. In the topplot, the responses before crossover filtering are given for refer-ence. The vertical dash-dot line indicates the crossover frequencyin this and in the following three figures.
Frequency / Hz
200 500 1k 1.5k X-Ov 4k 5k 10k 20k
Magnitude / d
B
-10
-5
0
5
10Combined frequency response
X-Over output
Leveled
Frequency / Hz
200 500 1k 1.5k X-Ov 4k 5k 10k 20k
Gro
up D
ela
y / m
s
-1
0
1
2Group delay
Figure 12: (Top) Magnitude responses before and after gain cor-rection (leveling) and (bottom) the full-band group delay.
those two values levels. The gain is easily obtained by dividingthe target level by its calculated level. Once the signals are gained,they are summed to obtain a full band signal.
As observed in Figure 6, the subwoofer band has less levelthan the line array, thus the LF band is amplified by 3.6 dB andthe HF band is attenuated by 2.5 dB. The full band signal beforeand after amplifying each band is shown in Figure 12 It is alsoobserved that the group delay maintains an acceptable ripple inthe whole band. If the responses were not correctly aligned, astrong peak in the group delay would appear around the crossoverfrequency.
Frequency / Hz
200
250
315
400
500
630
800 1k
1.25
k1.
6k 2k2.
5k
3.15
k 4k 5k6.
3k 8k 10k
12.5
k16
k20
k
Gain
/ d
B
-10
-5
0
5
10
Graphic equalizer gains
Frequency (Hz)
200 300 500 1k 1.5k X-ov=2.4k 4k 5k 10k 20k
Am
plit
ude (
dB
)
-10
-5
0
5
10Frequency responses
Input
GEQed
Figure 13: (Top) Automatically calculated gains of the third-octave graphic equalizer and (bottom) the overall magnitude re-sponse before and after equalization.
3.4. Graphic equalization
The graphic equalizer used for the PA equalization is a third-octaveparallel design [16]. Precise amplitude and minimum phase char-acteristics make it the most suitable option for the fine tuning ofthe system.
The full band frequency response is used to obtain the graphicequalizer gains. First the average level of the full band signal iscalculated. As the −3 dB frequency limits of each third-octaveband of the graphic equalizer are known, the average level of eachband is calculated and the gains are obtained by dividing the aver-age level by each band level.
The frequency bands are limited from 315 Hz to 20 kHz. Fig-ure 13 presents the obtained gains are presented and the compar-ison of the system frequency response before and after filteringwith the parallel graphic equalizer.
3.5. Verification sweep
In order to verify that the system has the expected time alignmentand frequency response, a third sweep is performed and processedwith the processing chain in Figure 2. For determining the delayfor each way, the difference between both time delays calculatedin Section 3.2 is calculated. The way with the shortest time delay(i.e. the speaker closest to the measurement position - usually thesubwoofer, as in Figure 1) is delayed by the number of samplesof the calculated time difference. The fractional delay line is onlyimplemented for the LF way.
In Figure 14 is shown that the system is time aligned as nopeaks appear in the group delay and no cancellation occurs in thefrequency domain. Additionally, the obtained frequency responseis fairly linear, with ripple of less than +/- 2 dB in almost all thefrequency band. Regarding the group delay, the values are belowaudible limits [17].
DAFX-6

Proc. of the 18th Int. Conference on Digital Audio Effects (DAFx-15), Trondheim, Norway, Nov 30 - Dec 3, 2015
Frequency / Hz
200 300 500 1k 1.5k1.8kX-Ov3k 10k 20k
Magnitude / d
B
-10
-5
0
5
10Expected and measured Frequency response
Expected
Measured
Frequency / Hz
200 300 500 1k 1.5k1.8kX-Ov3k 10k 20k
Gro
up d
ela
y / m
s
-2
-1
0
1
2Expected and measured Group Delay
Expected
Measured
Figure 14: (Top) Expected and measured overall magnitude re-sponse and (bottom) group delay.
Time / ms
0 0.05 0.1 0.15 0.2 0.25 0.3 0.35 0.4 0.45 0.5
×10-5
-5
0
5
10
L
Direct
Ground Reflection
Figure 15: Autocorrelation of input signal with ground reflection.
4. GROUND REFLECTION ISSUES
As this system is initially designed for use in outdoor venues orarenas, the majority of reflective areas are far away from the mea-surement point, and the effects over the impulse response are shiftedfar from the direct sound impulse. This is not the case with theground reflection, as the microphone is usually placed at ear height,1 to 1.70 m depending if the audience is seated or standing. Theground reflections can affect the measurement creating a comb fil-ter effect over the frequency response and a shifting in the groupdelay.
The upper frequency response in Figure 16 shows the influ-ence of the ground plates used in the measurement. The extradistance of the ground reflection is approximately 17 cm, whichis equivalent to a half wavelength approximately at 2 kHz, wherethe first notch appears.
To correct the comb filter effect of the reflection, a filter hasbeen designed with an inverse response to the reflection. A first-
Frequency / Hz
500 1k 1.5k 2k 2.5k 3k 4k 5k 10k 20k
Magnitude / d
B
-30
-20
-10
0Measured frequency response
Frequency / Hz
500 1k 1.5k 2k 2.5k 3k 4k 5k 10k 20k
Magnitude / d
B
-30
-20
-10
0Filtered and truncated frequency response
Figure 16: (Top) Measured magnitude response with the reflectionplate and (bottom) the corrected magnitude response.
z-L
+ +
r
+
IN OUT
Figure 17: Reflection cancellation filter.
Frequency / Hz
200
250
315
400
500
630
800 1k
1.25
k1.
6k 2k2.
5k
3.15
k 4k 5k6.
3k 8k 10k
12.5
k16
k20
k
Gain
/ d
B
-10
-5
0
5
10
Frequency / Hz
200 300 500 1k 1.5k 2k X-Ov 4k 5k 10k 20k
Magnitude / d
B
-25
-20
-15
-10
-5
0
Expected
Measured
Figure 18: (Top) Difference between the expected and measuredmagnitude responses and the calculated gains for the graphicequalizer: asterisks correspond to the first calculation and circlessecond calculation. (Bottom) Expected and measured magnituderesponses.
order IIR filter, shown in Figure 17 creates a cancellation signal tothe reflection. The parameters for this filter, delay L and coefficient
DAFX-7

Proc. of the 18th Int. Conference on Digital Audio Effects (DAFx-15), Trondheim, Norway, Nov 30 - Dec 3, 2015
r, are obtained from the auto-correlation of the measured signal,shown in Figure 15. The distance between the zero-point peak andthe second peak in the auto-correlation indicates the relative delayof the reflected signal, and therefore the delay L of the loop. Therelative level between the the direct sound peak and the secondpeak determines the gain of the feedback loop r. This filter hasbeen used as it is enough to obtain a proper frequency response totune the system as shown in Figure 16.
The main influence of the comb filter effect is noticed in theautomated graphic equalizer. To avoid that a notch or a bump inthe frequency band falsify the gains of the equalizer, the full bandverification sweep is used to compare both responses. The averagedifference between the expected and the measured band is calcu-lated. If both, the difference and the equalizer gain in a certainband is higher than 2 dB, it is considered that the band has beenfalsified and the gain is set to 0 dB.
In Figure 18 the calculated equalization is made with the cor-rected response in Figure 16. If it is compared to the equalizationwithout ground reflection in Figure 13, very similar responses areobtained. In this case no corrections to the graphic equalizer isdone, as the difference signal between the expected signal and themeasured signal is fairly low.
5. CONCLUSION
An automatic calibration and equalization system for line-arrayPAs has been presented in this paper. The procedure for calcu-lating the different parameters has been tested using a 1:10 scalemodel, and the obtained results have been described and analyzer.Four sets of parameters have been successfully obtained from thesubwoofer and line-array responses to time align and equalize thewhole system: delay time for the closest cabinets, crossover fre-quency, average gain for each way, and graphic equalization pa-rameters.
The obtained results are in the line with what we expected: aclose to flat frequency response and low group delay can be ob-tained using phase (delay) adjustment in the crossover band. Sucha system could be incorporated in PA processors making the line-array adjustment a much faster and easier task than it is today.
Even so, some improvements could be introduced to the sys-tem. Future work could be oriented in adapting the system formulti-channel operation, being able to equalize stereo or morechannels (as central channel or outfills). Also subwoofer arrayscould be adjusted with similar procedures, based on obtaining theresponse of each cabinet separately. This would allow to use phaseadjustments to generate different subwoofer configurations and SPLpatterns.
6. REFERENCES
[1] Mark S. Ureda, “Line arrays: Theory and applications,” inAudio Engineering Society Convention 110, Amsterdam, TheNetherlands, May 2001.
[2] Mark S. Ureda, “Analysis of loudspeaker line arrays,” J.Audio Eng. Soc., vol. 52, no. 5, pp. 467–495, 2004.
[3] Natàlia Milán and Joan Amate, “Time alignment of sub-woofers in large PA systems,” in Audio Engineering SocietyConvention 130, London, UK, May 2011.
[4] Anthony B. Kitson, “Equalisation of sound systems by earand instruments: Similarities and differences,” in Audio En-gineering Society 5th Australian Regional Convention, Syd-ney, Australia, Mar. 1995.
[5] Ambrose Thompson, “Improved methods for controllingtouring loudspeaker arrays,” in Audio Engineering SocietyConvention 127, New York, NY, USA, Oct. 2009.
[6] Stefan Feistel, Mario Sempf, Kilian Köhler, and HolgerSchmalle, “Adapting loudspeaker array radiation to thevenue using numerical optimization of fir filters,” in AudioEngineering Society Convention 135, New York, NY, USA,Oct. 2013.
[7] Frank Schultz, Till Rettberg, and Sascha Spors, “On spatial-aliasing-free sound field reproduction using finite length linesource arrays,” in Audio Engineering Society Convention137, Los Angeles, CA, USA, Oct. 2014.
[8] “Meyer Sound Galileo System,” Available athttp://www.meyersound.com/, accessed May 08, 2015.
[9] Jeffrey Borish and James B. Angell, “An efficient algo-rithm for measuring the impulse response using pseudoran-dom noise,” J. Audio Eng. Soc., vol. 31, no. 7/8, pp. 478–488,1983.
[10] “EASERA measurement platform,” Available athttp://easera.afmg.eu/, accessed May 08, 2015.
[11] “Smaart measurement tool,” Available athttp://www.rationalacoustics.com/smaart/about-smaart/,accessed May 08, 2015.
[12] Siegfried H. Linkwitz, “Active crossover networks for non-coincident drivers,” J. Audio Eng. Soc., vol. 24, no. 1, pp.2–8, 1976.
[13] Angelo Farina, “Simultaneous measurement of impulse re-sponse and distortion with a swept-sine technique,” in Au-dio Engineering Society Convention 108, Paris, France, Feb.2000.
[14] Thomas Kite, “Measurement of audio equipment with log-swept sine chirps,” in Audio Engineering Society Convention117, San Francisco, CA, USA, Oct 2004.
[15] T.I. Laakso, V. Välimäki, M. Karjalainen, and U.K. Laine,“Splitting the unit delay: Tools for fractional delay filter de-sign,” IEEE Signal Processing Magazine, vol. 13, no. 1, pp.30–60, Jan. 1996.
[16] Jussi Rämö, Vesa Välimäki, and Balazs Bank, “High-precision parallel graphic equalizer,” IEEE/ACM Trans. Au-dio, Speech and Lang. Process., vol. 22, no. 12, pp. 1894–1904, Dec. 2014.
[17] Sheila Flanagan, Brian C. J. Moore, and Michael A. Stone,“Discrimination of group delay in clicklike signals presentedvia headphones and loudspeakers,” J. Audio Eng. Soc., vol.53, no. 7/8, pp. 593–611, 2005.
DAFX-8