Automated Vision-Based Diagnosis of Cassava Mosaic Disease
9
Automated Vision-Based Diagnosis of Cassava Mosaic Disease Jennifer R. Aduwo, Ernest Mwebaze and John A. Quinn Faculty of Computing and Informatics Technology Makerere University Kampala, Uganda Abstract. Cassava Mosaic Disease (CMD) has been an increasing con- cern to all countries in sub-Saharan Africa that depend on cassava for both commercial and local consumption. Information about the country- wide spread of this disease is difficult to obtain due to logistics and hu- man resource issues in these countries. The objective of this study was to assess the feasibility of automated computer vision based diagnosis of CMD. Images of healthy and CMD-infected cassava leaves were taken at Namulonge Crop Resources Research Institute, Uganda. We performed classification on these images based on shape and colour features, using a set of standard classification methods (na¨ ıve Bayes, two-layer MLP networks, support vector machines, k-nearest neighbour and divergence- based learning vector quantization). We find near-perfect classification to be attainable for leaf images captured under ideal conditions, and outline a method for performing this classification on natural, cluttered images taken in situ. 1 Introduction Cassava is the third largest source of carbohydrate for human consumption in the world, and provides more food calories per unit of land than any other staple crop. One of the main causes of yield loss for this crop is Cassava Mosaic Disease (family:geminiviridae; genus: begomovirus). The disease is spread both by whitefly and by the planting of infected stem cuttings, and destroys the plant’s chlorophyll and hence its ability to feed itself, resulting in poor yields. The symptoms of CMD are yellowish leaf colour affecting much of the leaf area, distortion of the leaf shape with reduced size and stunting of the plant. Its existence in Uganda dates back to 1928. However by 1999, a severe form of CMD had expanded to cover more than 750,000km 2 of East and Central Africa, including virtually all the cassava growing regions of Uganda and neighbouring countries [1]. Achievable cassava yields in Africa are estimated to decrease by 15% to 24% due to CMD, which is equivalent to between 12 and 23 million tonnes per an- num. In Uganda, estimated production losses due to CMD are USD 60 million annually, and region-wide losses in East Africa have been estimated in excess of USD 100 million annually [1]. The long term effects of a CMD pandemic are
Transcript of Automated Vision-Based Diagnosis of Cassava Mosaic Disease

Automated Vision-Based Diagnosis of CassavaMosaic Disease
Jennifer R. Aduwo, Ernest Mwebaze and John A. Quinn
Faculty of Computing and Informatics TechnologyMakerere UniversityKampala, Uganda
Abstract. Cassava Mosaic Disease (CMD) has been an increasing con-cern to all countries in sub-Saharan Africa that depend on cassava forboth commercial and local consumption. Information about the country-wide spread of this disease is difficult to obtain due to logistics and hu-man resource issues in these countries. The objective of this study wasto assess the feasibility of automated computer vision based diagnosis ofCMD. Images of healthy and CMD-infected cassava leaves were taken atNamulonge Crop Resources Research Institute, Uganda. We performedclassification on these images based on shape and colour features, usinga set of standard classification methods (naıve Bayes, two-layer MLPnetworks, support vector machines, k-nearest neighbour and divergence-based learning vector quantization). We find near-perfect classificationto be attainable for leaf images captured under ideal conditions, andoutline a method for performing this classification on natural, clutteredimages taken in situ.
1 Introduction
Cassava is the third largest source of carbohydrate for human consumption inthe world, and provides more food calories per unit of land than any otherstaple crop. One of the main causes of yield loss for this crop is Cassava MosaicDisease (family:geminiviridae; genus: begomovirus). The disease is spread bothby whitefly and by the planting of infected stem cuttings, and destroys theplant’s chlorophyll and hence its ability to feed itself, resulting in poor yields.The symptoms of CMD are yellowish leaf colour affecting much of the leaf area,distortion of the leaf shape with reduced size and stunting of the plant. Itsexistence in Uganda dates back to 1928. However by 1999, a severe form ofCMD had expanded to cover more than 750,000km2 of East and Central Africa,including virtually all the cassava growing regions of Uganda and neighbouringcountries [1].
Achievable cassava yields in Africa are estimated to decrease by 15% to 24%due to CMD, which is equivalent to between 12 and 23 million tonnes per an-num. In Uganda, estimated production losses due to CMD are USD 60 millionannually, and region-wide losses in East Africa have been estimated in excessof USD 100 million annually [1]. The long term effects of a CMD pandemic are
a crisis in food security and widespread poverty since cassava is predominantlygrown by small holder farmers for food and as a source of income. The CMDpandemic slows the market diversification of cassava use in the production oflivestock feed, textiles, pharmaceuticals, alcohol and other beverages [2].
Consequently, there is continuous need for timely and accurate informationfor proper management of the CMD incidence and severity. This informationwould be used in monitoring and forecasting CMD prevalence over time andplanning appropriate interventions to avert crises. However, such information isdifficult to obtain at present, due to challenges such as the availability of suitabletechnical staff with the expertise to detect the CMD, the time and cost incurredby transport to rural regions of the country, availability of salaries for the fieldstaff, and impassable roads during rainy seasons in some regions of the country,and the time taken to coordinate paper reports [3].
We propose a computer vision system based on camera-phone input to pro-vide a more efficient solution. Given some training and a basic camera-phone(common in even the most rural areas of Uganda), farmers themselves can pro-vide data in the form of images taken of their crops. In return they receivemicropayments to cover data transfer costs and appropriate agricultural advice,both sent by SMS. Applying computer vision techniques to large sets of suchuploaded images, we can automatically classify the state of health of plants, andthen map the extent of the disease in a district or country. In this way, moredata can be collected, more rapidly and at lower cost. This paper describes ex-periments to enable this latter part of the process, showing that CMD can bediagnosed automatically with high accuracy based on images of leaves.
The use of computer vision for surveilling the health of crops has been lookedat in a number of related settings, including the identification of weeds [4], thesegmentation of diseased leaves [5] and disease-related discolouration in citrusfruit [6].
The remainder of this paper is organized as follows. Our classification method-ology is described in section 2, including data collection and feature extraction,and we outline a method for processing natural, cluttered images in section 3.Classification results are given in section 4 and we conclude in section 5.
2 Classification of leaf images
We now describe experiments carried out to classify a leaf image as exhibitinghealthy growth or CMD.
2.1 Data collection
Image samples of cassava leaves were captured from Namulonge Crops ResourcesResearch Institute, Uganda. We collected sample leaves from three different plan-tations, placed each leaf on a light box and captured images with a standarddigital camera, at a resolution of 3072×2304. Leaf images were captured from92 healthy plants and 101 plants infected with cassava mosaic disease. Examplesof these images are shown in Figure 1.
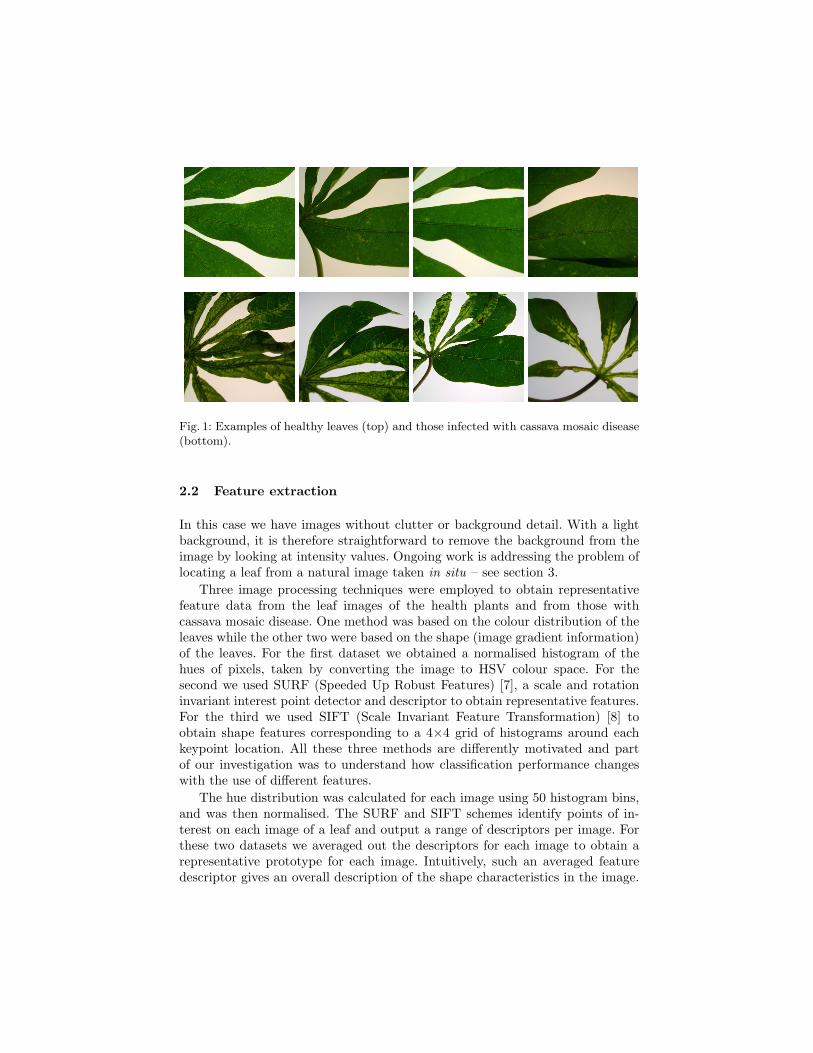
Fig. 1: Examples of healthy leaves (top) and those infected with cassava mosaic disease(bottom).
2.2 Feature extraction
In this case we have images without clutter or background detail. With a lightbackground, it is therefore straightforward to remove the background from theimage by looking at intensity values. Ongoing work is addressing the problem oflocating a leaf from a natural image taken in situ – see section 3.
Three image processing techniques were employed to obtain representativefeature data from the leaf images of the health plants and from those withcassava mosaic disease. One method was based on the colour distribution of theleaves while the other two were based on the shape (image gradient information)of the leaves. For the first dataset we obtained a normalised histogram of thehues of pixels, taken by converting the image to HSV colour space. For thesecond we used SURF (Speeded Up Robust Features) [7], a scale and rotationinvariant interest point detector and descriptor to obtain representative features.For the third we used SIFT (Scale Invariant Feature Transformation) [8] toobtain shape features corresponding to a 4×4 grid of histograms around eachkeypoint location. All these three methods are differently motivated and partof our investigation was to understand how classification performance changeswith the use of different features.
The hue distribution was calculated for each image using 50 histogram bins,and was then normalised. The SURF and SIFT schemes identify points of in-terest on each image of a leaf and output a range of descriptors per image. Forthese two datasets we averaged out the descriptors for each image to obtain arepresentative prototype for each image. Intuitively, such an averaged featuredescriptor gives an overall description of the shape characteristics in the image.
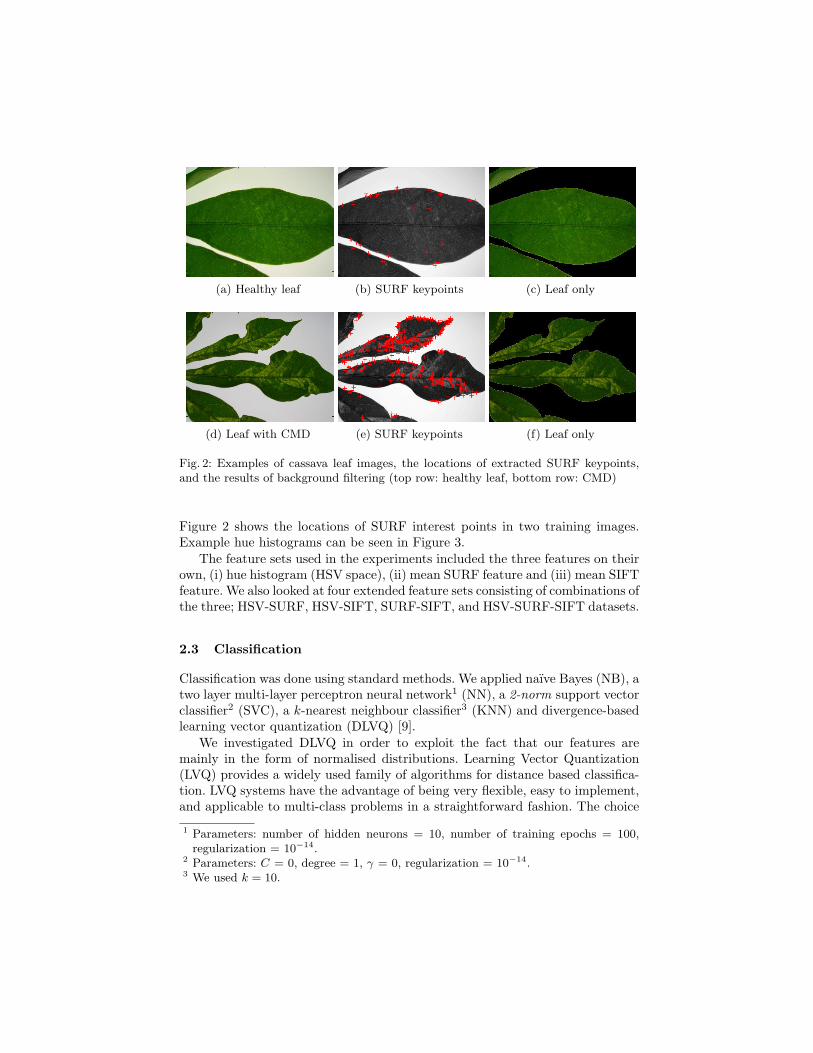
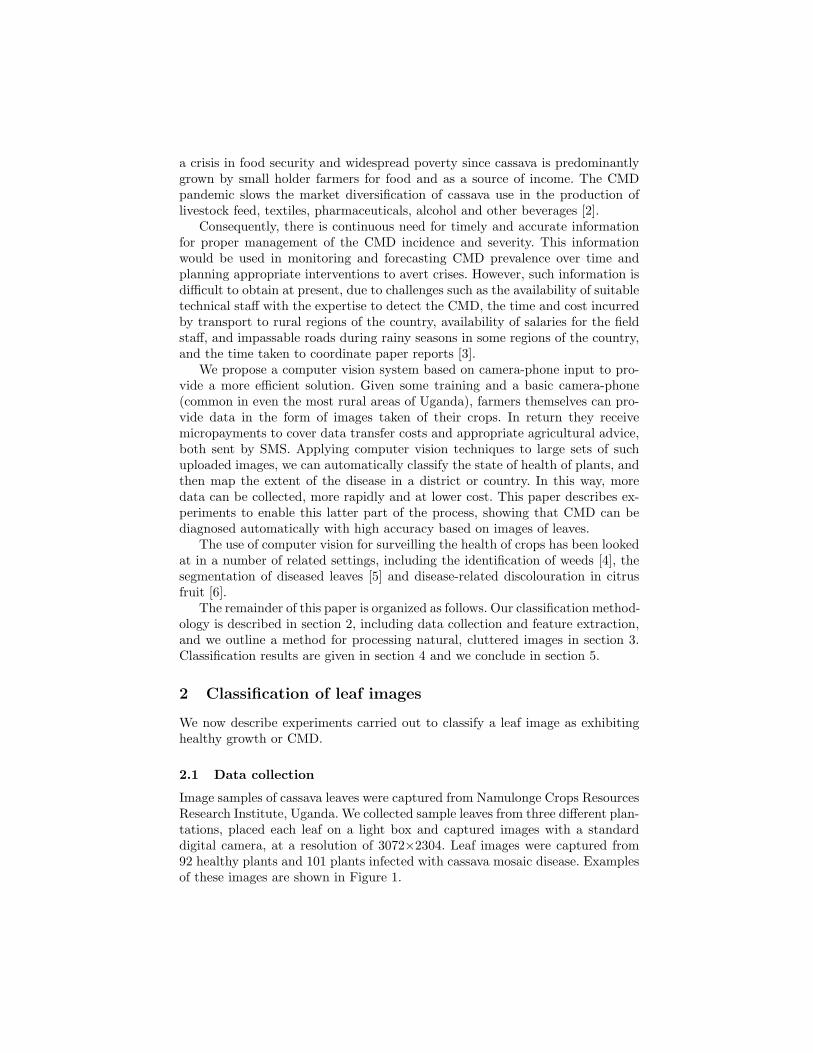
(a) Healthy leaf (b) SURF keypoints (c) Leaf only
(d) Leaf with CMD (e) SURF keypoints (f) Leaf only
Fig. 2: Examples of cassava leaf images, the locations of extracted SURF keypoints,and the results of background filtering (top row: healthy leaf, bottom row: CMD)
Figure 2 shows the locations of SURF interest points in two training images.Example hue histograms can be seen in Figure 3.
The feature sets used in the experiments included the three features on theirown, (i) hue histogram (HSV space), (ii) mean SURF feature and (iii) mean SIFTfeature. We also looked at four extended feature sets consisting of combinations ofthe three; HSV-SURF, HSV-SIFT, SURF-SIFT, and HSV-SURF-SIFT datasets.
2.3 Classification
Classification was done using standard methods. We applied naıve Bayes (NB), atwo layer multi-layer perceptron neural network1 (NN), a 2-norm support vectorclassifier2 (SVC), a k-nearest neighbour classifier3 (KNN) and divergence-basedlearning vector quantization (DLVQ) [9].
We investigated DLVQ in order to exploit the fact that our features aremainly in the form of normalised distributions. Learning Vector Quantization(LVQ) provides a widely used family of algorithms for distance based classifica-tion. LVQ systems have the advantage of being very flexible, easy to implement,and applicable to multi-class problems in a straightforward fashion. The choice
1 Parameters: number of hidden neurons = 10, number of training epochs = 100,regularization = 10−14.
2 Parameters: C = 0, degree = 1, γ = 0, regularization = 10−14.3 We used k = 10.
0 20 400
0.1
Hue histogram bin
Fre
quen
cy
0 20 400
0.1
0 20 400
0.1
0 20 400
0.1
0 20 400
0.1
0 20 400
0.1
0 20 400
0.1
0 20 400
0.1
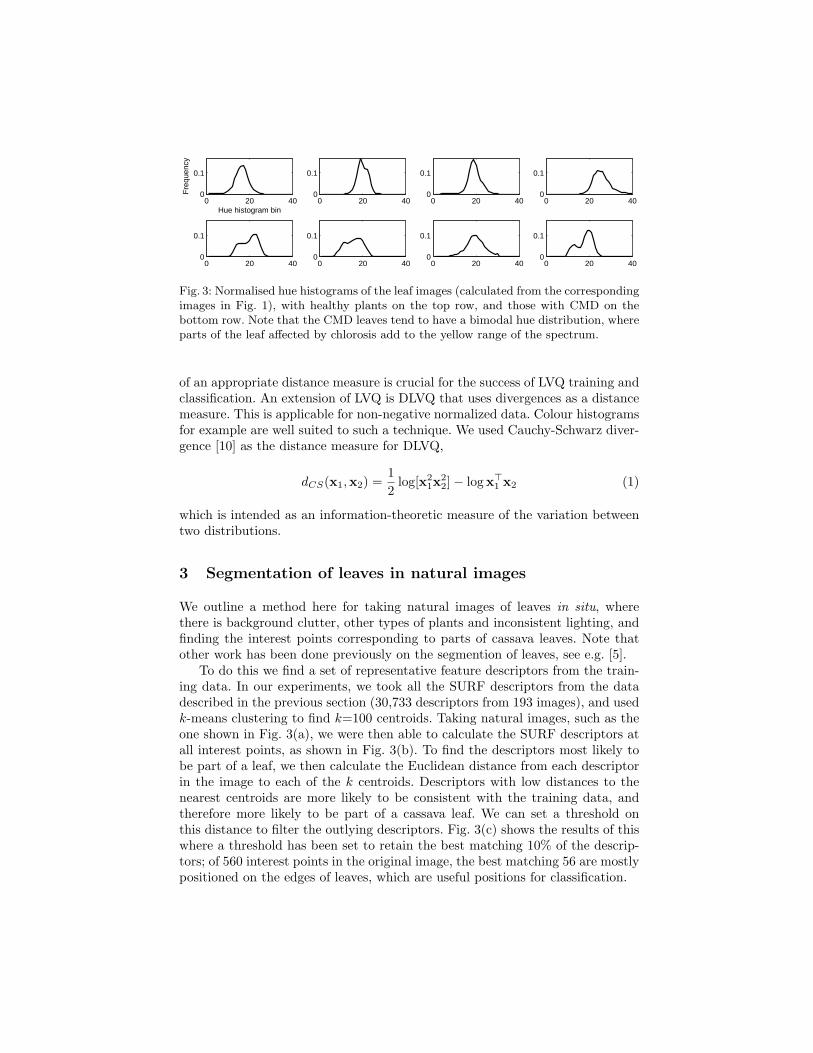
Fig. 3: Normalised hue histograms of the leaf images (calculated from the correspondingimages in Fig. 1), with healthy plants on the top row, and those with CMD on thebottom row. Note that the CMD leaves tend to have a bimodal hue distribution, whereparts of the leaf affected by chlorosis add to the yellow range of the spectrum.
of an appropriate distance measure is crucial for the success of LVQ training andclassification. An extension of LVQ is DLVQ that uses divergences as a distancemeasure. This is applicable for non-negative normalized data. Colour histogramsfor example are well suited to such a technique. We used Cauchy-Schwarz diver-gence [10] as the distance measure for DLVQ,
dCS(x1, x2) =12
log[x21x
22]− log x>1 x2 (1)
which is intended as an information-theoretic measure of the variation betweentwo distributions.
3 Segmentation of leaves in natural images
We outline a method here for taking natural images of leaves in situ, wherethere is background clutter, other types of plants and inconsistent lighting, andfinding the interest points corresponding to parts of cassava leaves. Note thatother work has been done previously on the segmention of leaves, see e.g. [5].
To do this we find a set of representative feature descriptors from the train-ing data. In our experiments, we took all the SURF descriptors from the datadescribed in the previous section (30,733 descriptors from 193 images), and usedk-means clustering to find k=100 centroids. Taking natural images, such as theone shown in Fig. 3(a), we were then able to calculate the SURF descriptors atall interest points, as shown in Fig. 3(b). To find the descriptors most likely tobe part of a leaf, we then calculate the Euclidean distance from each descriptorin the image to each of the k centroids. Descriptors with low distances to thenearest centroids are more likely to be consistent with the training data, andtherefore more likely to be part of a cassava leaf. We can set a threshold onthis distance to filter the outlying descriptors. Fig. 3(c) shows the results of thiswhere a threshold has been set to retain the best matching 10% of the descrip-tors; of 560 interest points in the original image, the best matching 56 are mostlypositioned on the edges of leaves, which are useful positions for classification.
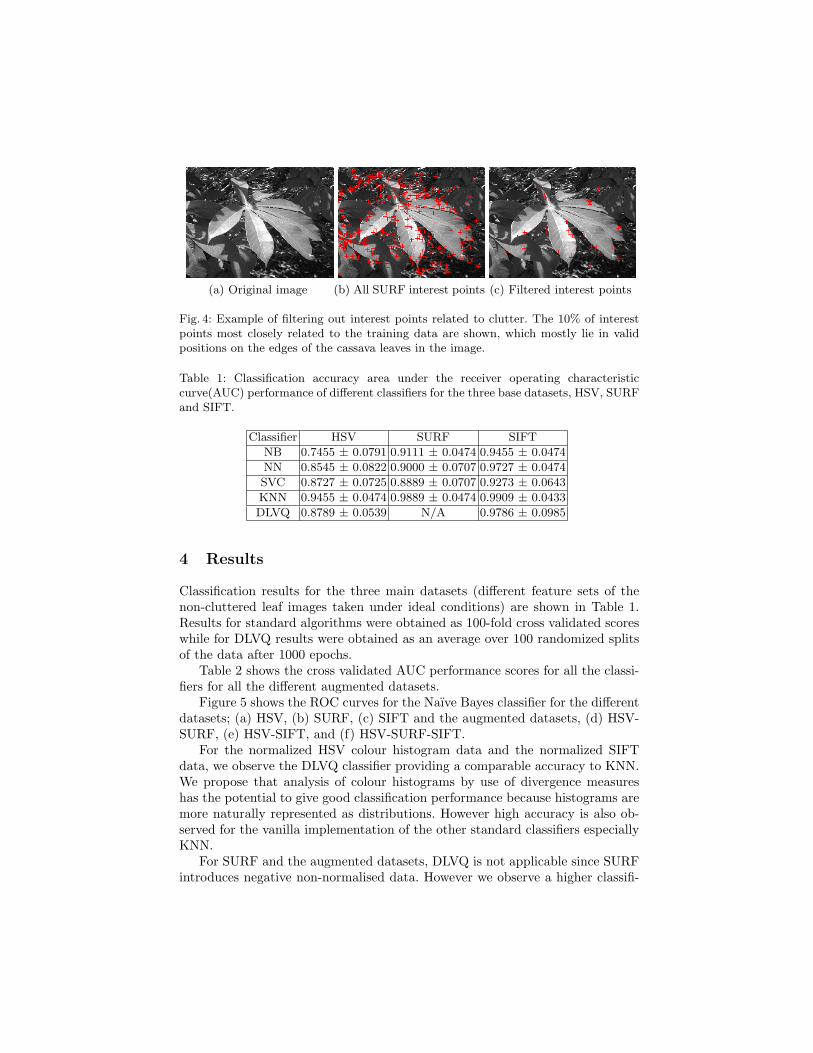
(a) Original image (b) All SURF interest points (c) Filtered interest points
Fig. 4: Example of filtering out interest points related to clutter. The 10% of interestpoints most closely related to the training data are shown, which mostly lie in validpositions on the edges of the cassava leaves in the image.
Table 1: Classification accuracy area under the receiver operating characteristiccurve(AUC) performance of different classifiers for the three base datasets, HSV, SURFand SIFT.
Classifier HSV SURF SIFT
NB 0.7455 ± 0.0791 0.9111 ± 0.0474 0.9455 ± 0.0474
NN 0.8545 ± 0.0822 0.9000 ± 0.0707 0.9727 ± 0.0474
SVC 0.8727 ± 0.0725 0.8889 ± 0.0707 0.9273 ± 0.0643
KNN 0.9455 ± 0.0474 0.9889 ± 0.0474 0.9909 ± 0.0433
DLVQ 0.8789 ± 0.0539 N/A 0.9786 ± 0.0985
4 Results
Classification results for the three main datasets (different feature sets of thenon-cluttered leaf images taken under ideal conditions) are shown in Table 1.Results for standard algorithms were obtained as 100-fold cross validated scoreswhile for DLVQ results were obtained as an average over 100 randomized splitsof the data after 1000 epochs.
Table 2 shows the cross validated AUC performance scores for all the classi-fiers for all the different augmented datasets.
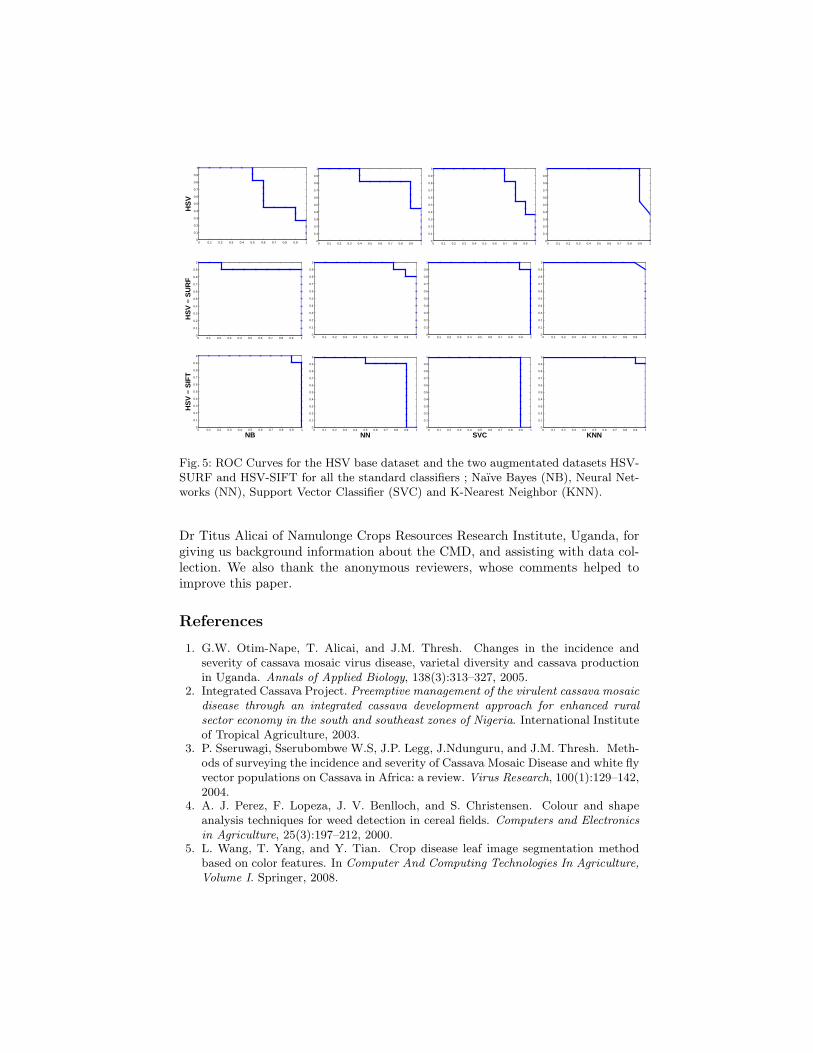
Figure 5 shows the ROC curves for the Naıve Bayes classifier for the differentdatasets; (a) HSV, (b) SURF, (c) SIFT and the augmented datasets, (d) HSV-SURF, (e) HSV-SIFT, and (f) HSV-SURF-SIFT.
For the normalized HSV colour histogram data and the normalized SIFTdata, we observe the DLVQ classifier providing a comparable accuracy to KNN.We propose that analysis of colour histograms by use of divergence measureshas the potential to give good classification performance because histograms aremore naturally represented as distributions. However high accuracy is also ob-served for the vanilla implementation of the other standard classifiers especiallyKNN.
For SURF and the augmented datasets, DLVQ is not applicable since SURFintroduces negative non-normalised data. However we observe a higher classifi-

Table 2: Classification performance (AUC) Scores for Augmented datasets for variedclassifiers; NB - Naıve Bayes, NN - Neural Networks, SVC - Support Vector Classifierand KNN - K-Nearest Neighbour
Classifier HSV - SURF HSV - SIFT SURF - SIFT HSV - SURF - SIFT
NB 0.9222 ± 0.0474 0.9909 ± 0.0433 0.9333 ± 0.0474 0.9778 ± 0.0474
NN 0.9778 ± 0.0524 1.0000 ± 0.0000 1.0000 ± 0.0000 0.9778 ± 0.0474
SVC 0.9889 ± 0.0474 0.9000 ± 0.0474 1.0000 ± 0.0000 1.0000 ± 0.0000
KNN 0.9944 ± 0.0474 0.9909 ± 0.0433 0.9944 ± 0.0474 0.9944 ± 0.0474
cation accuracy of 100% for the Neural Network and Support Vector classifierswhen applied to the combined datasets, which is higher than any of the individ-ual dataset accuracies. We conclude that the extra information in the augmentedfeature sets leads to better generalisation of the classifiers using them.
5 Conclusion
The paper presents preliminary results in the automated vision based diagnosisof cassava mosaic disease in Uganda based on colour and shape. We found veryhigh classification performance to be possible, partly due to the use of highquality images taken under consistent lighting conditions. However, the near-perfect accuracy of the best performing combination of feature set and classifieris encouraging for the development of an automated diagnostic system for CMDusing field images. For this we might favour algorithms such as naıve Bayes forwhich inference is rapid, as they might be more suitable for implementation on amobile device. This work is therefore a step towards automated monitoring andmapping of the disease on a country-wide level, useful for surveillance of foodsecurity, prediction of famine, and the planning of agricultural intervention.
Future work will include taking typical cassava leaf images from cameraphones, with background clutter and mixed lighting conditions, and establishingwhether the accuracy of classification can be maintained in these conditions. Wehave used training images taken under ideal conditions, and demonstrated thefeasibility of identifying a leaf amongst clutter in a natural image. However, morework on leaf segmentation is needed before this can be practically deployed.
It is also necessary to add other potential classes and extend the scope of theclassifiers; for example, the brown streak virus is also becoming prevalent amongcassava plants in East Africa and would also need to be diagnosed where present.Currently such conditions, which also cause yellowing and discolouration in theleaves, would act as confounders to the classifiers we have considered here. Otherissues to look at include inferring the extent of the severity of the illness wherepresent, going beyond the binary classification we carry out in the current work.
Acknowledgments
The authors would like to thank the Director General of NARO, Uganda, forgranting us permission to access disease and pest surveillance data. We thank
0 0.1 0.2 0.3 0.4 0.5 0.6 0.7 0.8 0.9 10
0.1
0.2
0.3
0.4
0.5
0.6
0.7
0.8
0.9
1
HS
V
0 0.1 0.2 0.3 0.4 0.5 0.6 0.7 0.8 0.9 10
0.1
0.2
0.3
0.4
0.5
0.6
0.7
0.8
0.9
1
0 0.1 0.2 0.3 0.4 0.5 0.6 0.7 0.8 0.9 10
0.1
0.2
0.3
0.4
0.5
0.6
0.7
0.8
0.9
1
0 0.1 0.2 0.3 0.4 0.5 0.6 0.7 0.8 0.9 10
0.1
0.2
0.3
0.4
0.5
0.6
0.7
0.8
0.9
1
0 0.1 0.2 0.3 0.4 0.5 0.6 0.7 0.8 0.9 10
0.1
0.2
0.3
0.4
0.5
0.6
0.7
0.8
0.9
1
HS
V −
SU
RF
0 0.1 0.2 0.3 0.4 0.5 0.6 0.7 0.8 0.9 10
0.1
0.2
0.3
0.4
0.5
0.6
0.7
0.8
0.9
1
0 0.1 0.2 0.3 0.4 0.5 0.6 0.7 0.8 0.9 10
0.1
0.2
0.3
0.4
0.5
0.6
0.7
0.8
0.9
1
0 0.1 0.2 0.3 0.4 0.5 0.6 0.7 0.8 0.9 10
0.1
0.2
0.3
0.4
0.5
0.6
0.7
0.8
0.9
1
0 0.1 0.2 0.3 0.4 0.5 0.6 0.7 0.8 0.9 10
0.1
0.2
0.3
0.4
0.5
0.6
0.7
0.8
0.9
1
HS
V −
SIF
T
NB0 0.1 0.2 0.3 0.4 0.5 0.6 0.7 0.8 0.9 1
0
0.1
0.2
0.3
0.4
0.5
0.6
0.7
0.8
0.9
1
NN0 0.1 0.2 0.3 0.4 0.5 0.6 0.7 0.8 0.9 1
0
0.1
0.2
0.3
0.4
0.5
0.6
0.7
0.8
0.9
1
SVC0 0.1 0.2 0.3 0.4 0.5 0.6 0.7 0.8 0.9 1
0
0.1
0.2
0.3
0.4
0.5
0.6
0.7
0.8
0.9
1
KNN
Fig. 5: ROC Curves for the HSV base dataset and the two augmentated datasets HSV-SURF and HSV-SIFT for all the standard classifiers ; Naıve Bayes (NB), Neural Net-works (NN), Support Vector Classifier (SVC) and K-Nearest Neighbor (KNN).
Dr Titus Alicai of Namulonge Crops Resources Research Institute, Uganda, forgiving us background information about the CMD, and assisting with data col-lection. We also thank the anonymous reviewers, whose comments helped toimprove this paper.
References
1. G.W. Otim-Nape, T. Alicai, and J.M. Thresh. Changes in the incidence andseverity of cassava mosaic virus disease, varietal diversity and cassava productionin Uganda. Annals of Applied Biology, 138(3):313–327, 2005.
2. Integrated Cassava Project. Preemptive management of the virulent cassava mosaicdisease through an integrated cassava development approach for enhanced ruralsector economy in the south and southeast zones of Nigeria. International Instituteof Tropical Agriculture, 2003.
3. P. Sseruwagi, Sserubombwe W.S, J.P. Legg, J.Ndunguru, and J.M. Thresh. Meth-ods of surveying the incidence and severity of Cassava Mosaic Disease and white flyvector populations on Cassava in Africa: a review. Virus Research, 100(1):129–142,2004.
4. A. J. Perez, F. Lopeza, J. V. Benlloch, and S. Christensen. Colour and shapeanalysis techniques for weed detection in cereal fields. Computers and Electronicsin Agriculture, 25(3):197–212, 2000.
5. L. Wang, T. Yang, and Y. Tian. Crop disease leaf image segmentation methodbased on color features. In Computer And Computing Technologies In Agriculture,Volume I. Springer, 2008.
6. R. Pydipati andT.F. Burks and W.S. Lee. Identification of citrus disease usingcolor texture features and discriminant analysis. Computers and Electronics inAgriculture, 52(1-2):49–59, 2006.
7. H. Bay and A. Ess and T. Tuytelaars and L. Van Gool. SURF: Speeded Up RobustFeatures. Computer Vision and Image Understanding, 110(3):346–359, 2008.
8. D.G. Lowe. Distinctive Image Features from Scale-Invariant Keypoints. Interna-tional Journal of Computer Vision, 60(2):91–110, 2004.
9. E. Mwebaze, P. Schneider, F.M. Schleif, S. Haase, T. Villmann, and M. Biehl.Divergence based Learning Vector Quantization. In Proceedings of the EuropeanSymposium on Artificial Neural Networks, 2010.
10. J.C. Principe and D. Xu. Information theoretic learning. In Unsupervised AdaptiveFiltering. Wiley, 2000.