Automated system testing of an automatic train protection ... · Automated system testing of an...
10
Automated system testing of an automatic train protection system B. Friman & T. Andreiouk Ansaldo-STS Sweden AB, Sweden Abstract The testing of safety critical software is becoming more and more automated. Automated testing has the advantage that the tests can be carried out much more frequently and with more numerous test cases. For low level unit testing, there are several good tools available, such as Aunit. For system testing, however, the test framework normally has to be specifically tailored for each project, since it has to deal with external interfaces, e.g. man-machine-interfaces, and sensor and control interfaces. For efficient operation, it is desirable that an automated framework for system testing shall be able to serve both in a pure software set- up, where most of the development is done, and in a hardware set-up, which is as close as possible to the environment where the product shall operate. This paper describes an automated system testing framework for a SIL 4 safety critical train protection system. The testing framework can be used both in the pure SW set- up and in the HW set-up, and is able to extract its test cases from readable Test Specification documents and also produce high quality Test Protocol documents. Approximately 98% of the system tests have been automated in this project. The project in question is the development of STM’s (Specific Transmission Modules) for Sweden, Norway and Finland. The STM’s carry out train protection on national equipped lines – lines that are not equipped with the ERTMS (European Rail Transport Management System). A total of approximately 1300 test scenarios are executed by the automated testing framework. Keywords: automated testing, system testing, ETCS, ERTMS, ATP. www.witpress.com, ISSN 1743-3509 (on-line) WIT Transactions on The Built Environment, Vol 114, © 2010 WIT Press Computers in Railways XII 71 doi:10.2495/CR100071
Transcript of Automated system testing of an automatic train protection ... · Automated system testing of an...

Automated system testing of an automatic train protection system
B. Friman & T. Andreiouk Ansaldo-STS Sweden AB, Sweden
Abstract
The testing of safety critical software is becoming more and more automated. Automated testing has the advantage that the tests can be carried out much more frequently and with more numerous test cases. For low level unit testing, there are several good tools available, such as Aunit. For system testing, however, the test framework normally has to be specifically tailored for each project, since it has to deal with external interfaces, e.g. man-machine-interfaces, and sensor and control interfaces. For efficient operation, it is desirable that an automated framework for system testing shall be able to serve both in a pure software set-up, where most of the development is done, and in a hardware set-up, which is as close as possible to the environment where the product shall operate. This paper describes an automated system testing framework for a SIL 4 safety critical train protection system. The testing framework can be used both in the pure SW set-up and in the HW set-up, and is able to extract its test cases from readable Test Specification documents and also produce high quality Test Protocol documents. Approximately 98% of the system tests have been automated in this project. The project in question is the development of STM’s (Specific Transmission Modules) for Sweden, Norway and Finland. The STM’s carry out train protection on national equipped lines – lines that are not equipped with the ERTMS (European Rail Transport Management System). A total of approximately 1300 test scenarios are executed by the automated testing framework. Keywords: automated testing, system testing, ETCS, ERTMS, ATP.
www.witpress.com, ISSN 1743-3509 (on-line) WIT Transactions on The Built Environment, Vol 114, © 2010 WIT Press
Computers in Railways XII 71
doi:10.2495/CR100071
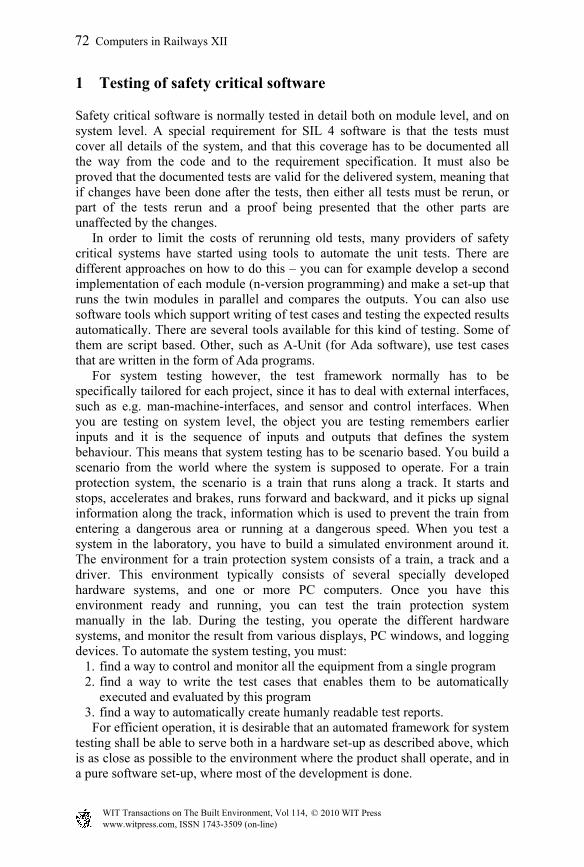
1 Testing of safety critical software
Safety critical software is normally tested in detail both on module level, and on system level. A special requirement for SIL 4 software is that the tests must cover all details of the system, and that this coverage has to be documented all the way from the code and to the requirement specification. It must also be proved that the documented tests are valid for the delivered system, meaning that if changes have been done after the tests, then either all tests must be rerun, or part of the tests rerun and a proof being presented that the other parts are unaffected by the changes. In order to limit the costs of rerunning old tests, many providers of safety critical systems have started using tools to automate the unit tests. There are different approaches on how to do this – you can for example develop a second implementation of each module (n-version programming) and make a set-up that runs the twin modules in parallel and compares the outputs. You can also use software tools which support writing of test cases and testing the expected results automatically. There are several tools available for this kind of testing. Some of them are script based. Other, such as A-Unit (for Ada software), use test cases that are written in the form of Ada programs. For system testing however, the test framework normally has to be specifically tailored for each project, since it has to deal with external interfaces, such as e.g. man-machine-interfaces, and sensor and control interfaces. When you are testing on system level, the object you are testing remembers earlier inputs and it is the sequence of inputs and outputs that defines the system behaviour. This means that system testing has to be scenario based. You build a scenario from the world where the system is supposed to operate. For a train protection system, the scenario is a train that runs along a track. It starts and stops, accelerates and brakes, runs forward and backward, and it picks up signal information along the track, information which is used to prevent the train from entering a dangerous area or running at a dangerous speed. When you test a system in the laboratory, you have to build a simulated environment around it. The environment for a train protection system consists of a train, a track and a driver. This environment typically consists of several specially developed hardware systems, and one or more PC computers. Once you have this environment ready and running, you can test the train protection system manually in the lab. During the testing, you operate the different hardware systems, and monitor the result from various displays, PC windows, and logging devices. To automate the system testing, you must:
1. find a way to control and monitor all the equipment from a single program 2. find a way to write the test cases that enables them to be automatically
executed and evaluated by this program 3. find a way to automatically create humanly readable test reports.
For efficient operation, it is desirable that an automated framework for system testing shall be able to serve both in a hardware set-up as described above, which is as close as possible to the environment where the product shall operate, and in a pure software set-up, where most of the development is done.
www.witpress.com, ISSN 1743-3509 (on-line) WIT Transactions on The Built Environment, Vol 114, © 2010 WIT Press
72 Computers in Railways XII

This paper describes how we have done this in the STM projects, at Ansaldo STS Sweden, in Stockholm. STM = Specific Transmission Module, in practice an Automated Train Protection system that runs alongside and in co-operation with ETCS (European Train Control System) onboard systems, in order to provide continued protection on lines equipped with local (national) signalling systems. See ERTMS Subsets 035 [1] and 058 [2] for more information about STM.
2 Manual system testing
Manual system testing will still be the primary method for the developers to test new functions and bug fixes in the software in their daily work. It means that the test environment shall both support the manual tests by the developers and the automatic tests by the validation team. The natural way to implement automatic system testing is thus to build it on top of the manual test environment. The following figure shows a typical system test environment:
3 Controlling and monitoring the test equipment from a single program
In order to control and monitor the test equipment, we first must find a way to communicate with the PC software associated with the different devices. We
Figure 1: The photo shows a substantial number of different hardware devices connected to each other and to one or more PC computers.
www.witpress.com, ISSN 1743-3509 (on-line) WIT Transactions on The Built Environment, Vol 114, © 2010 WIT Press
Computers in Railways XII 73

PC
Train and track simulator
STM (device to be tested) Recorder
ETCS
Vital computer
S/W
S/W
S/W
DMI EVC BTM
Sniffer
Log
Log
track
Test program
Figure 2: The test system overview, now with the controlling and monitoring connections included.
asked the developers of the different software to implement TCP/IP server ports which we could connect to, send control directives to and read logged data from. We must also find a way to push buttons on the DMI (Driver Machine Interface) and to register the information shown on it. To our luck, the ETCS DMI already had a serial port dedicated to testing, which enabled us to send simulated button pushes using an RS 232 connection. Automatic pushing of buttons is absolutely indispensable for automated testing. Had it been required, we have even considered building a device with electrically controlled “fingers” for this purpose. The registering of information shown on the DMI was no problem, since we can pick it up from the high speed bus between the STM vital computer and the ETCS EVC (European Vital computer), with the sniffer.
4 Writing test cases so they can be automatically executed and evaluated
As mentioned earlier, system test cases normally are built as scenarios. In a scenario for a train protection system, you describe each event along the track, from the time when the equipment is powered-on, to the time when the test is finished. A common way to do this is in the form of a table, where inputs are specified on the left side, and expected outputs on the right. For automatic testing, all inputs and outputs must be machine readable, but they must also be humanly readable, so that the meaning of the test is comprehensible. For this
www.witpress.com, ISSN 1743-3509 (on-line) WIT Transactions on The Built Environment, Vol 114, © 2010 WIT Press
74 Computers in Railways XII

Group Pos. Information Acceptance criterion
--- +10 •Accelerate to 70 km/h
---
10 +290 (500)
Si 160/130, 5000m
(Preset speed increase exists = No) (Linking distance = 1,2*5000 + 100 = 6100 m) (Linking margin = 0,2*5000 + 100 = 1100 m)
11 +200 SH 100, 1000m
(Reference location = 500 m) (Linking distance = 700 - 500 + 1,2*1000 + 100 = 1500 m) (Linking margin = 0,2*1000 + 100 = 300 m) (Linking distance will be updated because current point < primary target point: 1500 < 6100)
--- +1295 ---
(Reference location + Linking distance was passed) (Balise erasing = SIG) •MR ceiling speed = 80 km/h DMI indications: •Indicator C5 = Balise failure 2/Fixed_Yellow •Text Message = 7UU Signal missing •Service brake = Yes
--- +142
(Brake is autoreleased) •Accelerate to 70 km/h
•Service brake = No
Figure 3: An excerpt from a test case for automatic execution. Parentheses are used for comments.
purpose, we have created a symbolic language for signal information and driving commands, that both shall be easy to understand, and possible to compile to binary data. The test case scenarios have four columns – Transponder id (group), position (m), Information, and Acceptance criterion. The information column can contain both trackside signalling information (transponder data) and driving commands. As you can see, the scenario positions (Pos.) are relative, which makes it easier to later insert or remove lines in the scenario. The absolute locations will be automatically calculated by the script.
5 Distilling test cases from the test case database
In order to automatically distil the files needed to run the tests, from the test case database, we must first export it into a public format. We chose to export it to html, since our database tool – DOORS – had the possibility to export to html. XML would have worked too, if DOORS had been equipped with an XML exporting facility. Below we have used the command <filtersvs> to distil all the test cases in the database. Only the end of the summary is visible in the figure: The test base database is approximately 1000 pages long, when printed out. The distilling script requires approximately 45 seconds to convert the html-version of the database to the files needed for running the tests. If you want to test not the entire test database, but only a chapter, it is also possible to extract a single chapter or a single test case.
www.witpress.com, ISSN 1743-3509 (on-line) WIT Transactions on The Built Environment, Vol 114, © 2010 WIT Press
Computers in Railways XII 75
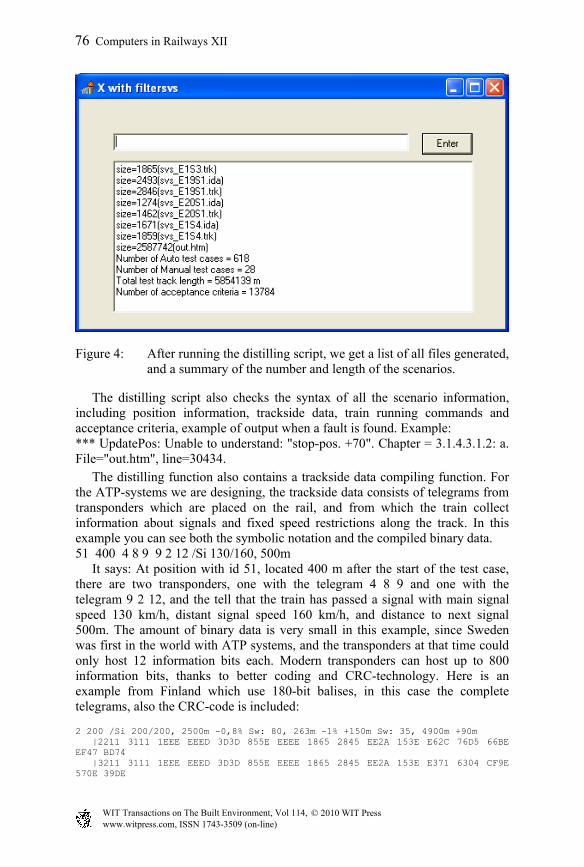
Figure 4: After running the distilling script, we get a list of all files generated, and a summary of the number and length of the scenarios.
The distilling script also checks the syntax of all the scenario information, including position information, trackside data, train running commands and acceptance criteria, example of output when a fault is found. Example: *** UpdatePos: Unable to understand: "stop-pos. +70". Chapter = 3.1.4.3.1.2: a. File="out.htm", line=30434. The distilling function also contains a trackside data compiling function. For the ATP-systems we are designing, the trackside data consists of telegrams from transponders which are placed on the rail, and from which the train collect information about signals and fixed speed restrictions along the track. In this example you can see both the symbolic notation and the compiled binary data. 51 400 4 8 9 9 2 12 /Si 130/160, 500m It says: At position with id 51, located 400 m after the start of the test case, there are two transponders, one with the telegram 4 8 9 and one with the telegram 9 2 12, and the tell that the train has passed a signal with main signal speed 130 km/h, distant signal speed 160 km/h, and distance to next signal 500m. The amount of binary data is very small in this example, since Sweden was first in the world with ATP systems, and the transponders at that time could only host 12 information bits each. Modern transponders can host up to 800 information bits, thanks to better coding and CRC-technology. Here is an example from Finland which use 180-bit balises, in this case the complete telegrams, also the CRC-code is included:
2 200 /Si 200/200, 2500m -0,8% Sw: 80, 263m -1% +150m Sw: 35, 4900m +90m |2211 3111 1EEE EEED 3D3D 855E EEEE 1865 2845 EE2A 153E E62C 76D5 66BE EF47 BD74 |3211 3111 1EEE EEED 3D3D 855E EEEE 1865 2845 EE2A 153E E371 6304 CF9E 570E 39DE
www.witpress.com, ISSN 1743-3509 (on-line) WIT Transactions on The Built Environment, Vol 114, © 2010 WIT Press
76 Computers in Railways XII

It says that, there is a transponder group at position 200m after the start of the test case, in which there is a signal with id=2, main signal speed 200 km/h, distant signal speed 200km/h, plus information of distance to next signal, and two switches which reduce the allowed speed of the train.
6 Running the test cases in a PC environment
At earlier stages of development, most tests are run in a PC environment. All the equipment that the tested ATP needs to communicate is then simulated by PC programs. Some of these simulators are written in Ada, others are written in a script language (X). In our case, we need simulators for the following equipment: ETCS (European Train Control System) – the European standard ATP
system. Written in Ada. Brake curve algorithm by Friman [3] is used. The train, including acceleration, braking, driving forward, reversing,
changing cabin, measuring brake pressure, etcetera. Written in Ada. The track, including transponders which shall send data when the train
passes them. Written in Ada. A profibus sniffer, which in the real test will be connected to the physical
profibus connection between the STM (national ATP) and the ETCS (European standard ATP). Written in script language.
A recorder, which is part of the STM to be developed, and will play a role in extracting test results in the real tests. Written in script language.
ETCS DMI, which in the real test set-up is an LCD device with pressure sense surface to enable pushing buttons. The DMI has an input interface (RS232) that enables automatic pushing of buttons. Written in Ada.
The driver. For automatic testing, also the driver is simulated. Written in script language (X).
For all these simulators to work together, there is a script which co-ordinates the entire tests. In this script you can order the test of a separate chapter, or the entire test database. Example: <test 3.1.5+>. The “+” means that all the subchapters shall also be included in the test. The test is started by specifying which chapter in the test database shall be tested. If the chapter is on high level, example chapter 3, then a large number of scenarios will be run before the tests ends. If a low level chapter, e.g. 3.1.4.3.1.3 is specified, then a single scenario is run, but also a single scenario can take long time to run, e.g. one hour. A single scenario is separated into several test cases, a, b, c etcetera, which test different requirements belonging to the same chapter. If a single test case is specified (e.g. <test 3.1.4.3.1.3_g>, then the test co-ordination script will first run the common initialisation part of the scenario, then jump to test case g. During the test, all output data are saved in an output data file. Here follows an excerpt from an output data file:
20547 (70 km/h) Service brake = Yes 20586 (70 km/h) MR ceiling speed = 150 km/h 20586 (70 km/h) V_PERMIT = 150 km/h 20586 (70 km/h) V_INTERV = 160 km/h
www.witpress.com, ISSN 1743-3509 (on-line) WIT Transactions on The Built Environment, Vol 114, © 2010 WIT Press
Computers in Railways XII 77

20586 (70 km/h) Button F8 = Loss/On 20586 (70 km/h) Indicator C3 = 150/Fixed_Green 20617 (70 km/h) Button F8 = Off 20617 (70 km/h) Service brake = No 20652 (70 km/h) Text Message = 6 L U 20652 (70 km/h) Indicator C5 = Balisfel 1/Fixed_Yellow 20850 (70 km/h) Indicator C5 = Off
The excerpt above shows the output data between position 20547 and 20850 in a test scenario. The output data is seen as a number of variables which can change value. A logging is done every time a variable changes its value. In the example above we can both see changes on the DMI (e.g. Button F8= Off) and in the brake interface (e.g. Service brake = yes). Since all variable changes are logged, it will later be possible to determine the value of each variable at any given position, just by searching for the last time it was changed before the given position.
7 Test report generation
A test report is automatically generated after the end of a test scenario. The test report contains the test cases, the output data, and an evaluation, PASS or FAIL, of each acceptance criteria. The test report generator, starts with the table containing the test cases, then evaluates the acceptance criteria and adds a column with the evaluation result, then merges this table with the output data file, and finally converts the now 8 column wide table into an RTF document.
Figure 5: The test co-ordination script will start all the simulators, and put the windows of those that shall be visible during the test, on the PC screen.
www.witpress.com, ISSN 1743-3509 (on-line) WIT Transactions on The Built Environment, Vol 114, © 2010 WIT Press
78 Computers in Railways XII

Input = svs_3.1.4.3.1.5_a_e4s1.ida Output = svs_3.1.4.3.1.5_a_e4s1.oda Grp Pos Information Acceptance criterion Pos +
marg Spd Test output Res.
11 700 SH 100, 1000m •(Reference location = 500 m) •(Linking distance = 700 - 500 + 1,2*1000 + 100 = 1500 m) •(Linking margin = 0,2*1000 + 100 = 300 m) •(Linking distance will be updated because current point < primary target point: 1500 < 6100)
704 70 MR target distance = 1200 m -
- - - - 1693 70 V_PERMIT = 130 km/h Permitted Speed Bar = 130/Grey V_INTERV = 140 km/h D_TARGET = 0 m Target Distance Bar = 0 Indicator C2 = Off Indicator C3 = 130/Flash Slow_Green
-
- 1995 - •(Reference location + Linking distance was passed) •(Balise erasing = SIG) •MR ceiling speed = 80 km/h •Indicator C5 = Balisfel 2/Fixed_Yellow •Text Message = 7UU Signal missing •Service brake = Yes
1992 70 MR ceiling speed = 80 km/h Release speed = 10 km/h Text Message = 7 U U V_PERMIT = None km/h Permitted Speed Bar = Off V_INTERV = None km/h Intervention Speed Bar = Off Indicator C3 = FEL/Flash Fast_Green Indicator C5 = Balisfel 2/Fixed_Yellow Indicator C7 = Tågöverv/Fixed_White
PASS PASS PASS FAIL (value=No)
Figure 6: Example excerpt from a test report.
Both the evaluation of the test criteria and the merging of test cases with output data require some amount of arithmetic calculation. For evaluation, it must be decided at which position the expected value shall be compared with the logged value. The calculation must then take into account the delays in the ATP system. A similar calculation is done in the merging, in order to decide whether an output data logging shall be on the same line or a different line as a line in the test case scenario. The test report contains all output data, not only those needed to evaluate the acceptance criteria. This is an advantage, because even if a test case is targeted to test a specific requirement, manual analysis of other output data can sometime reveal interesting insight in how the system works. Errors in other requirements can also be discovered earlier, by analysing the output data. In Ansaldo STS Swedish STM project, the customer has decided to allocate some of its own experts to analyse the output data of the automated tests.
8 Running automated tests on the real hardware
The scripts which distil the test cases, and those which co-ordinate the automated tests and create the test reports, are written so that they shall be compatible with both the PC based environment and the real hardware environment. You can see a picture of the real hardware test environment in section 2 above. The input files and the output files will look exactly the same. The script will adapt to the changes in the interfaces. For example, in the real hardware environment, a profibus sniffer is used to monitor the output data from the STM, and a serial interface RS232C to send simulated button pushes to the DMI. In the PC based
www.witpress.com, ISSN 1743-3509 (on-line) WIT Transactions on The Built Environment, Vol 114, © 2010 WIT Press
Computers in Railways XII 79

test environment, all interfaces use TCP/IP. There are other differences. In the real hardware environment, there are ID-plugs which contain installation parameters for both the ETCS and the STM. In order to test the function of these parameters, the system has to be manually restarted after each change of ID-plug. In order to minimise these manual interceptions, the test case distilling script contains a sorting function so that all test cases which use the same combination of ID-plugs, can be run in an unbroken sequence.
9 Conclusions
Automated system testing is today an obvious part of the daily work at the validation department of Ansaldo-STS Sweden. It does the tedious work of repeating old test every week, and enables the personnel to focus their efforts on developing new and exploratory tests. The increased amount of testing also appears to boost project performance. Site acceptance test 1 for STM Finland was successfully completed in record time, in April 2010. Finally, it can be mentioned that the customers have expressed their trust in the automated system tests and how they are repeated and documented.
References
[1] ERTMS/ETCS Class 1, Specific Transmission Module FFFIS, SUBSET-035, Alcatel, Alstom, Issue 2.1.1, Date 2003-07-24
[2] ERTMS/ETCS Class 1, FFFIS STM Application Layer. SUBSET-058, Alcatel, Alstom, Issue 2.1.1, Date 2003-11-19
[3] Friman, Bertil. An algorithm for Braking Curve Calculations in ERTMS. Proc. of the 10th Int. Conf. On Computers in Railways, ed. C.A. Brebbia, pp. 421-429, 2006.
www.witpress.com, ISSN 1743-3509 (on-line) WIT Transactions on The Built Environment, Vol 114, © 2010 WIT Press
80 Computers in Railways XII