
Automated Morphometry of the Visual Pathway in Primary ... · Automated Morphometry of the Visual...
10
University of Groningen Automated Morphometry of the Visual Pathway in Primary Open-Angle Glaucoma Hernowo, Aditya T.; Boucard, Christine C.; Jansonius, Nomdo M.; Hooymans, Johanna M. M.; Cornelissen, Frans W. Published in: Investigative ophthalmology & visual science DOI: 10.1167/iovs.10-5682 IMPORTANT NOTE: You are advised to consult the publisher's version (publisher's PDF) if you wish to cite from it. Please check the document version below. Document Version Publisher's PDF, also known as Version of record Publication date: 2011 Link to publication in University of Groningen/UMCG research database Citation for published version (APA): Hernowo, A. T., Boucard, C. C., Jansonius, N. M., Hooymans, J. M. M., & Cornelissen, F. W. (2011). Automated Morphometry of the Visual Pathway in Primary Open-Angle Glaucoma. Investigative ophthalmology & visual science, 52(5), 2758-2766. https://doi.org/10.1167/iovs.10-5682 Copyright Other than for strictly personal use, it is not permitted to download or to forward/distribute the text or part of it without the consent of the author(s) and/or copyright holder(s), unless the work is under an open content license (like Creative Commons). Take-down policy If you believe that this document breaches copyright please contact us providing details, and we will remove access to the work immediately and investigate your claim. Downloaded from the University of Groningen/UMCG research database (Pure): http://www.rug.nl/research/portal. For technical reasons the number of authors shown on this cover page is limited to 10 maximum. Download date: 15-08-2019
Transcript of Automated Morphometry of the Visual Pathway in Primary ... · Automated Morphometry of the Visual...
University of Groningen
Automated Morphometry of the Visual Pathway in Primary Open-Angle GlaucomaHernowo, Aditya T.; Boucard, Christine C.; Jansonius, Nomdo M.; Hooymans, Johanna M.M.; Cornelissen, Frans W.Published in:Investigative ophthalmology & visual science
DOI:10.1167/iovs.10-5682
IMPORTANT NOTE: You are advised to consult the publisher's version (publisher's PDF) if you wish to cite fromit. Please check the document version below.
Document VersionPublisher's PDF, also known as Version of record
Publication date:2011
Link to publication in University of Groningen/UMCG research database
Citation for published version (APA):Hernowo, A. T., Boucard, C. C., Jansonius, N. M., Hooymans, J. M. M., & Cornelissen, F. W. (2011).Automated Morphometry of the Visual Pathway in Primary Open-Angle Glaucoma. Investigativeophthalmology & visual science, 52(5), 2758-2766. https://doi.org/10.1167/iovs.10-5682
CopyrightOther than for strictly personal use, it is not permitted to download or to forward/distribute the text or part of it without the consent of theauthor(s) and/or copyright holder(s), unless the work is under an open content license (like Creative Commons).
Take-down policyIf you believe that this document breaches copyright please contact us providing details, and we will remove access to the work immediatelyand investigate your claim.
Downloaded from the University of Groningen/UMCG research database (Pure): http://www.rug.nl/research/portal. For technical reasons thenumber of authors shown on this cover page is limited to 10 maximum.
Download date: 15-08-2019
Automated Morphometry of the Visual Pathway inPrimary Open-Angle Glaucoma
Aditya T. Hernowo,1,2 Christine C. Boucard,3 Nomdo M. Jansonius,4
Johanna M. M. Hooymans,4 and Frans W. Cornelissen1
PURPOSE. To establish whether primary open-angle glaucoma(POAG) is associated with a change in volume of the visualpathway structures between the eyes and the visual cortex.
METHODS. To answer this question, magnetic resonance imag-ing (MRI) was used in combination with automated segmenta-tion and voxel-based morphometry (VBM). Eight patients withPOAG and 12 age-matched control subjects participated in thestudy. Only POAG patients with bilateral glaucomatous visualfield loss were admitted to the study. The scotoma in both eyeshad to include the paracentral region and had to, at leastpartially, overlap. All participants underwent high-resolution,T1-weighted, 3-T MRI scanning[b]. Subsequently, VBM wasused to determine the volume of the optic nerves, the opticchiasm, the optic tracts, the lateral geniculate nuclei (LGN),and the optic radiations. Analysis of covariance was used tocompare these volumes in the POAG and control groups. Themain outcome parameter of the measurement was the volumeof visual pathway structures.
RESULTS. Compared with the controls, subjects with glaucomashowed reduced volume (P � 0.005) of all structures along thevisual pathway, including the optic nerves, the optic chiasm,the optic tracts, the LGN, and the optic radiations.
CONCLUSIONS. POAG adversely affects structures along the fullvisual pathway, from the optic nerve to the optic radiation.Moreover, MRI in combination with automated morphometrycan be used to aid the detection and assessment of glaucoma-tous damage in the brain. (Invest Ophthalmol Vis Sci. 2011;52:2758–2766) DOI:10.1167/iovs.10-5682
In the developed world, glaucoma is one of the most notori-ous causes of visual field defects.1 Typically, over the course
of the disease, the visual field becomes narrower, but fovealvision remains relatively intact. The pathogenesis of the diseaseis not well understood, and that hampers early diagnosis andadvances in treatment.
Degeneration of retinal ganglion cells (RGCs) is currentlythought to play a key role in the pathogenesis of glaucoma.2–22
The resulting damage to the RGC axonal projections2,22–25 isreflected by thinning of the retinal nerve fiber layer (RNFL).26
Analysis of RNFL thickness has thus become a primary tool forinvestigating volumetric changes in the most anterior part ofthe visual pathway.27–37
Moreover, growing evidence suggests translation of theRGC degeneration to more distal parts of the visual path-way.25,38–41 In mice, the loss of RGCs is followed by a reduc-tion in the thickness and area of the optic tract.38 In nonhumanprimates, an experimentally induced increase in intraocularpressure led to RGC loss and to the degeneration of the lateralgeniculate nucleus (LGN) cell layers.25 In humans, magneticresonance (MR) studies have shown that patients with glau-coma, compared with healthy individuals, have smaller opticnerves, a smaller optic chiasm,40 and smaller LGNs.41 A diffu-sion tensor imaging (DTI) study found marked, disease-stage–correlated changes in the optic nerves and weak changes in theoptic radiations when comparing glaucoma patients andhealthy controls.42 Finally, the visual cortex was shown todecline in volume in glaucoma, as revealed in one postmortemstudy by Gupta et al.43 and in a recent in vivo MR study fromour group.44 The degeneration in these central portions of thevisual pathway in humans may also be a sign of transsynapticneuronal degeneration, which is provoked by the death of theRGCs.
Thus far, MR-based measurements of the size of the humanprecortical portion of the visual pathway have all been per-formed manually.39–41,45 Besides being time consuming, thismanual assessment can result in subjective measurement bias.To overcome these disadvantages, in a recent study, our groupused an automated morphometric technique that can objec-tively compare anatomic changes at all locations in the brainsimultaneously. Using this new approach, we found MR evi-dence of gray matter density loss in the primary visual cortexin individuals with a long-standing visual field defect due toprimary open-angle glaucoma (POAG).44 This, together withthe DTI findings mentioned earlier,42 implies that the opticradiation that carries visual information from the LGN to thevisual cortex may also be affected in POAG. To our knowledge,morphologic changes have not yet been reported for thesestructures.
If morphologic changes in the visual pathway can be reli-ably measured, it could assist a clinician in deciding on thediagnosis, prognosis, and further management of individualpatients. In the present study, we investigated volumetricchanges along the entire afferent visual pathway in individuals
From the 1Laboratory for Experimental Ophthalmology and the4Department of Ophthalmology, University Medical Center Groningen,University of Groningen, Groningen, The Netherlands; the 2Depart-ment of Ophthalmology, Gadjah Mada University, Yogyakarta, Indone-sia; and the 3Department of Ophthalmology, Jikei University School ofMedicine, Tokyo, Japan.
Supported by the RuG Fellowship Program grant scheme (ATH)and an Ubbo Emmius Grant (CCB), both from the University ofGroningen, and by the following foundations: Stichting NederlandsOogheelkundig Onderzoek, Nelly Reef Fund, Algemene Neder-landse Vereniging ter Voorkoming van Blindheid, Landelijke Sticht-ing voor Blinden en Slechtzienden, and Stichting MD Fonds. Thelatter three foundations contributed through Uitzicht. The fundingorganizations had no role in the design or implementation of theresearch.
Submitted for publication April 12, 2010; revised October 18 andDecember 9, 2010; accepted January 5, 2011.
Disclosure: A.T. Hernowo, None; C.C. Boucard, None; N.M.Jansonius, None; J.M.M. Hooymans, None; F.W. Cornelissen,None
Corresponding author: Aditya T. Hernowo, Laboratory for Exper-imental Ophthalmology, University Medical Center Groningen, Univer-sity of Groningen, PO Box 30001, 9700 RB Groningen, The Nether-lands; [email protected].
Glaucoma
Investigative Ophthalmology & Visual Science, April 2011, Vol. 52, No. 52758 Copyright 2011 The Association for Research in Vision and Ophthalmology, Inc.
Downloaded From: http://iovs.arvojournals.org/pdfaccess.ashx?url=/data/journals/iovs/932973/ on 05/03/2018
with POAG by using automated morphometric methods. Spe-cifically, we addressed the following research questions: (1)Compared with healthy controls, do subjects with glaucomaexhibit changes in the volume of the visual pathway? (2) Ifthere are such changes, does the change in volume correlatewith changes in visual field sensitivity?
METHODS
Subjects
This study conformed to the tenets of the Declaration of Helsinki andwas approved by the medical review board of the University MedicalCenter Groningen (Groningen, The Netherlands). All participants gavetheir informed written consent before participation.
Patients with POAG were recruited from participants in the Gro-ningen Longitudinal Glaucoma Study.46 Eight patients participated(one woman and seven men; mean age, 72 years; range, 62–85). Theparticipant inclusion criteria were the following: (1) a glaucomatousvisual field defect of at least 10° in diameter in at least one quadrant,affecting both eyes; (2) these visual field defects had to include theparacentral regions in both eyes; (3) the defects had to have beenpresent for at least 3 years. The severity of the visual field loss wasdetermined by the mean deviation (MD) scores (Humphrey Field An-alyzer; Carl Zeiss Meditec AG, Jena, Germany). Table 1 lists the char-acteristics of the patients. Patients with any other ophthalmic orneuro-ophthalmic disease that may affect the visual field were ex-cluded.
For the control group, 12 healthy, age-matched subjects (threewomen and nine men; mean age, 67 years, range 61–83) were re-cruited from among the partners and unrelated acquaintances of thevisual field–impaired participants or by advertisements in a local news-paper. Control subjects were required to have good best-correctedvisual acuity (logMAR � 0), not to have any visual field defects (ac-cording to the Groningen Longitudinal Glaucoma Study),46 and to be freeof any ophthalmic, neurologic, or general health problems. Detection ofan abnormal visual field is explained in the Perimetry section.
This study involved participants reported in another study44; theparticipants of our present study are the same as those listed in thePOAG group in that study; the healthy controls in that study were alsothe same. The present study used the same MRI scans as those used inthe prior study44, but addressed volumetric changes along the visualpathway, rather than being limited to gray matter changes in the visualcortex.
Data Acquisition
Perimetry. The visual field was tested with a retinal perimeter(HFA; Carl Zeiss Meditec AG, Jena, Germany). A standardized methodof examining the central visual field up to 30° eccentricity, the 30-2Swedish interactive threshold algorithm (SITA-fast), was used. A visualfield defect was considered to be present if one of the glaucomahemifield tests was outside normal limits, if the pattern standarddeviation’s probability is �0.05, if there were at least three adjacentnon–edge points (with P � 0.05) in the pattern deviation probabilityplot, with at least one point having a P � 0.01.47 This defect had to bepresent on at least two consecutive, reliable tests in the same region ofthe visual field (not including the first visual field measurement evermade). A test result was considered unreliable if false-positive catchtrials exceeded 10%, or if both false-negative catch trials and fixationlosses exceeded 10% and 20%, respectively. Moreover, deficits had tobe compatible with glaucoma and have no other explanation.
T1-Weighted Image Acquisition. All participants werescanned on the 3.0-T MRI scanner (Philips Intera; Eindhoven, TheNetherlands) located at the BCN Neuro-imaging Center of the Univer-sity Medical Center, Groningen. For each participant, a high-resolution,T1-weighted, anatomic scan was made using the magnetization se-quence T1W/3D/TFE-2, 8° flip angle; repetition time, 8.70 ms, matrix
size, 256 � 256; and field of view, 230 � 160 � 180,; yielding 160slices and a voxel dimension of 1 � 1 � 1 mm.
MR Data Analysis
The data analysis procedure involved the following steps: image pre-processing, generation of study-specific tissue probability maps(TPMs), segmentation, registration, modulation of the segments, andfinally a statistical comparison of differences in the volumes of differenttissue segments between the POAG and control groups within thevisual pathway. The process from the segmentation to the voxel-wisestatistical analyses is known as voxel-based morphometry orVBM. We used the VBM that is part of the SPM8 software package(Wellcome Department of Imaging Neuroscience, University CollegeLondon, London, UK; http://www.fil.ion.ucl.ac.uk/spm) to comparethe volume of subcortical structures between the glaucoma and controlgroups.48 VBM statistically assesses local changes in gray and/or whitevolumes between groups of anatomic scans. The steps in the data analysisprocedure are described in more detail in the following sections.
Image Preprocessing. Several preprocessing steps were per-formed on the scanned images before the actual measurement andstatistical analyses. Image reorientation to the average image of allsubjects’ brains was applied, to ensure registration of the images.
Generating Study-Specific TPMs. One problem was that thestandard TPMs available in the SPM8 software did not facilitate the detec-tion of diencephalic nuclei, including the LGN. As a solution, we gener-ated our own TPMs. TPM generation began by extracting the brains usingthe Brain Extraction Tool (BET),49 available within the FMRIB (FunctionalMRI of the Brain) Software Library (FSL; http://www.fmrib.ox.ac.uk/fsl). Next, for the segmentation, we used the FMRIB Automated Seg-mentation Tool (FAST).50 However, instead of letting FAST segmentthe extracted brains into the standard three tissue classes (gray andwhite matter and cerebral spinal fluid [CSF]), we made it segment thebrains into six tissue classes. Next, we created average tissue classimages based on the data from all subjects from the POAG and thecontrol groups. After this, these average images were smoothed byusing a Gaussian kernel with a full-width half-maximum (FWHM) of 8mm. In the SPM8 segmentation, the sixth tissue class image was usedas the TPM containing the prior for the optic nerves, chiasm, tracts,and radiations. The fifth tissue class image was used as the TPM withthe prior for the thalamus and other diencephalic nuclei. The first tofourth tissue classes were collated and used as the TPM with the priorfor other brain tissues.
Segmentation, Registration, and Modulation. We usedSPM8’s DARTEL (Diffeomorphic Anatomic Registration through Expo-nentiated Lie Algebra) suite of tools.51,52 In short, the DARTEL toolsenabled us to create modulated gray and white matter images thatwere registered to a common reference image specifically representingour sample, instead of registering them to a more general template,such as the MNI (Montreal Neurologic Institute) template that comeswith SPM8. The study-specific method we used enabled a more accu-rate intersubject registration of brain images with improved localiza-tion and sensitivity of the VBM.
The process began with SPM8’s segmentation, using the TPMs wehad created (as we explained in the prior paragraph). After all thebrains were segmented, a reference, or template, image was generated.The first step in generating this reference image was averaging theimages of all brains. After this, the individual brains were deformed andregistered as closely as possible to this reference image. Next, using theregistered brain images, we created a new average reference image towhich the individual brain images were again registered. After six ofthese averaging and registration cycles, the final reference image wasgenerated. The final reference image was then used as the template towhich the native segmentations of the individual brains in the studywere registered and modulated.
Smoothing. To increase the signal-to-noise ratio before statisticaltesting, we smoothed the segmented images with a Gaussian kernel(FWHM � 4 mm).
IOVS, April 2011, Vol. 52, No. 5 Automated Morphometry of the Visual Pathway in Glaucoma 2759
Downloaded From: http://iovs.arvojournals.org/pdfaccess.ashx?url=/data/journals/iovs/932973/ on 05/03/2018
Statistical Testing. Covariance analysis was used to examinebetween-group differences in the segments, with age as the covariate.Statistical testing was restricted to the visual pathway, which wasdemarcated by using a mask that included the optic nerves up to thewhite matter regions where the optic radiations can be expected to besituated. The visual pathway mask was created manually, based on theaverage brain image from all participants.
Regarding statistical testing, no correction for multiple compari-sons was used, because we only compared the groups within a well-defined region (the visual pathway). Hence, our hypothesis was ananatomically closed one, and no further correction for overall brainvolumes was necessary.
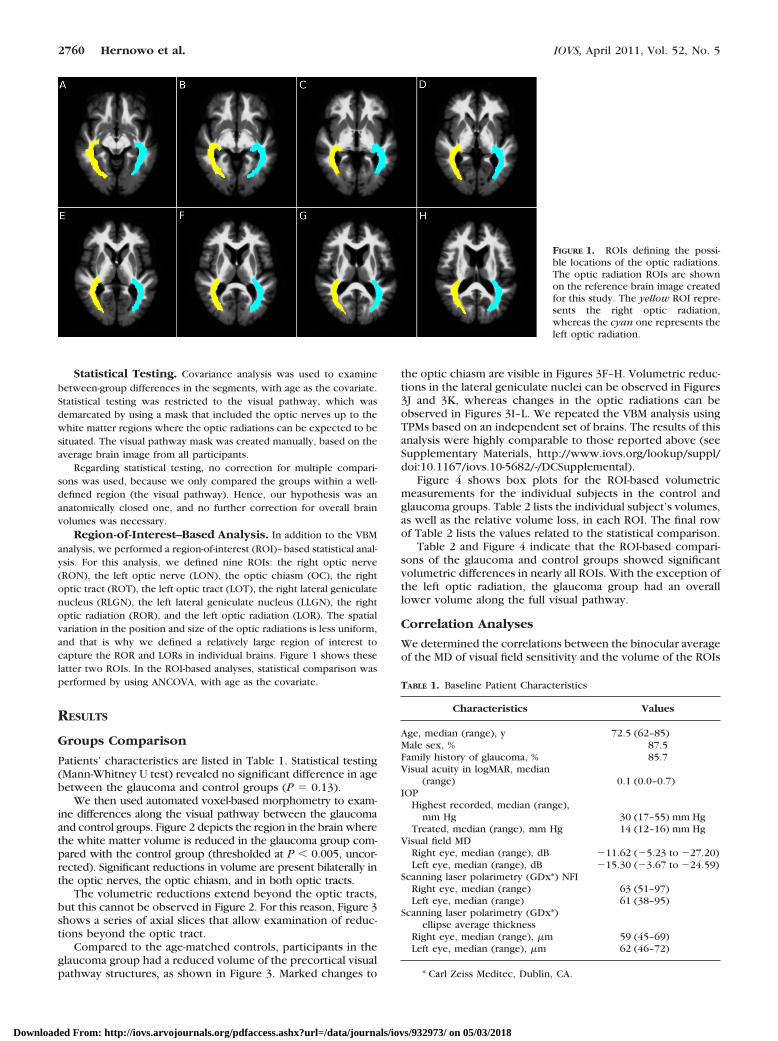
Region-of-Interest–Based Analysis. In addition to the VBManalysis, we performed a region-of-interest (ROI)–based statistical anal-ysis. For this analysis, we defined nine ROIs: the right optic nerve(RON), the left optic nerve (LON), the optic chiasm (OC), the rightoptic tract (ROT), the left optic tract (LOT), the right lateral geniculatenucleus (RLGN), the left lateral geniculate nucleus (LLGN), the rightoptic radiation (ROR), and the left optic radiation (LOR). The spatialvariation in the position and size of the optic radiations is less uniform,and that is why we defined a relatively large region of interest tocapture the ROR and LORs in individual brains. Figure 1 shows theselatter two ROIs. In the ROI-based analyses, statistical comparison wasperformed by using ANCOVA, with age as the covariate.
RESULTS
Groups Comparison
Patients’ characteristics are listed in Table 1. Statistical testing(Mann-Whitney U test) revealed no significant difference in agebetween the glaucoma and control groups (P � 0.13).
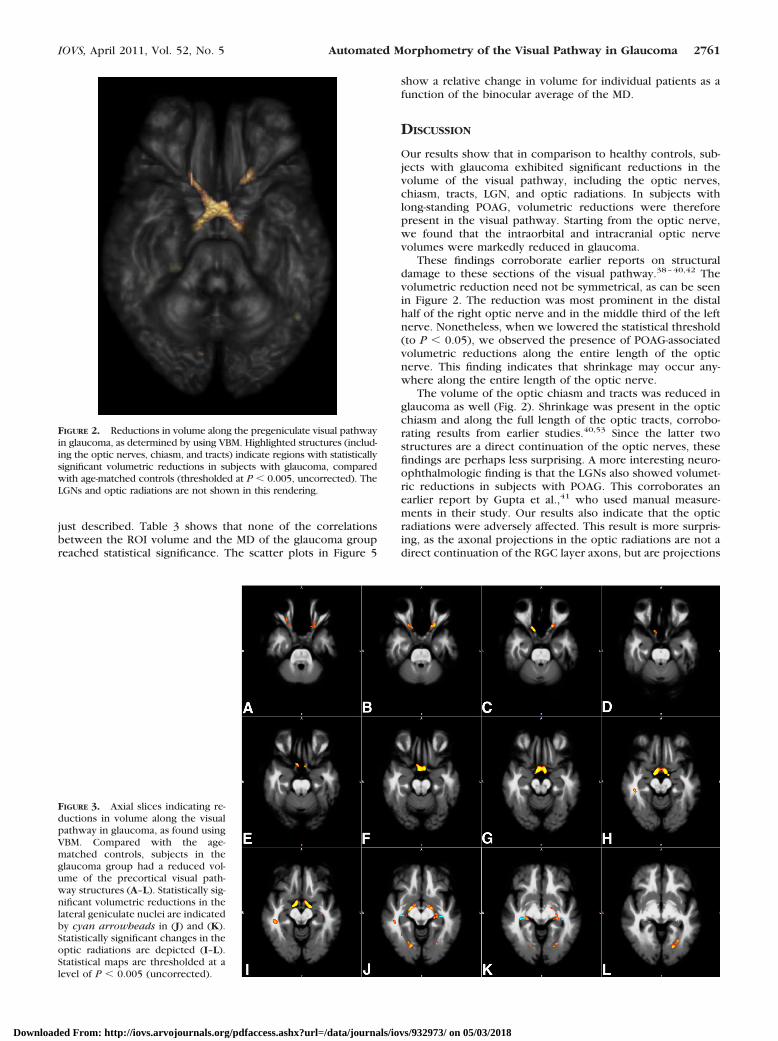
We then used automated voxel-based morphometry to exam-ine differences along the visual pathway between the glaucomaand control groups. Figure 2 depicts the region in the brain wherethe white matter volume is reduced in the glaucoma group com-pared with the control group (thresholded at P � 0.005, uncor-rected). Significant reductions in volume are present bilaterally inthe optic nerves, the optic chiasm, and in both optic tracts.
The volumetric reductions extend beyond the optic tracts,but this cannot be observed in Figure 2. For this reason, Figure 3shows a series of axial slices that allow examination of reduc-tions beyond the optic tract.
Compared to the age-matched controls, participants in theglaucoma group had a reduced volume of the precortical visualpathway structures, as shown in Figure 3. Marked changes to
the optic chiasm are visible in Figures 3F–H. Volumetric reduc-tions in the lateral geniculate nuclei can be observed in Figures3J and 3K, whereas changes in the optic radiations can beobserved in Figures 3I–L. We repeated the VBM analysis usingTPMs based on an independent set of brains. The results of thisanalysis were highly comparable to those reported above (seeSupplementary Materials, http://www.iovs.org/lookup/suppl/doi:10.1167/iovs.10-5682/-/DCSupplemental).
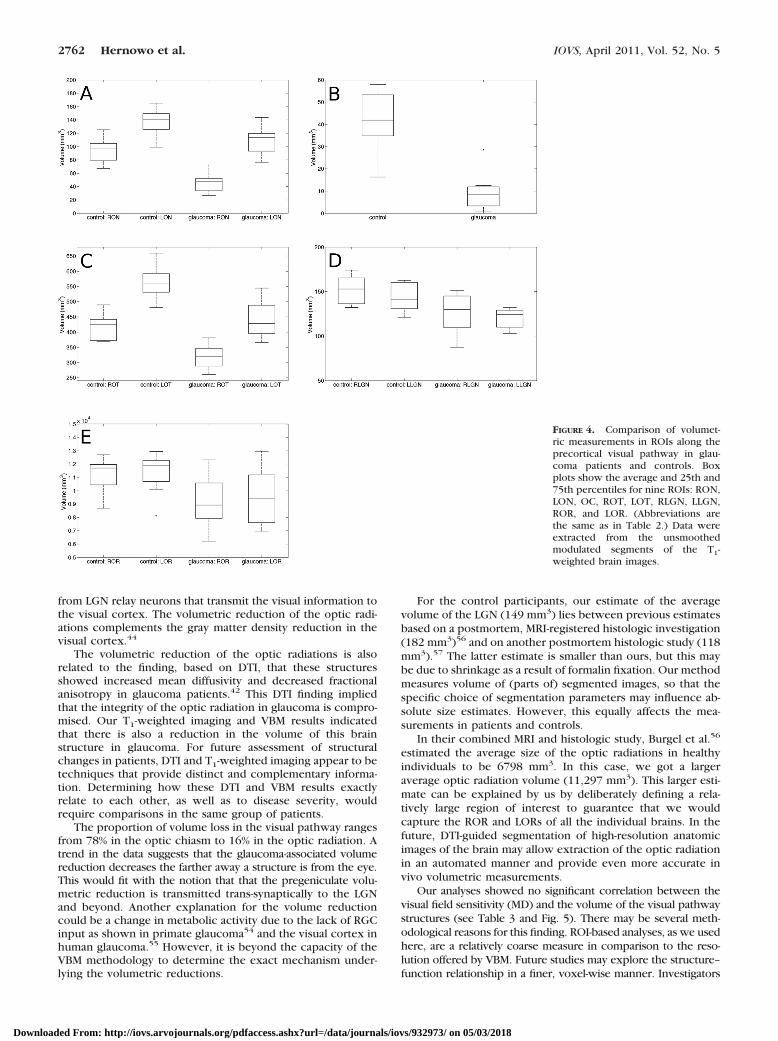
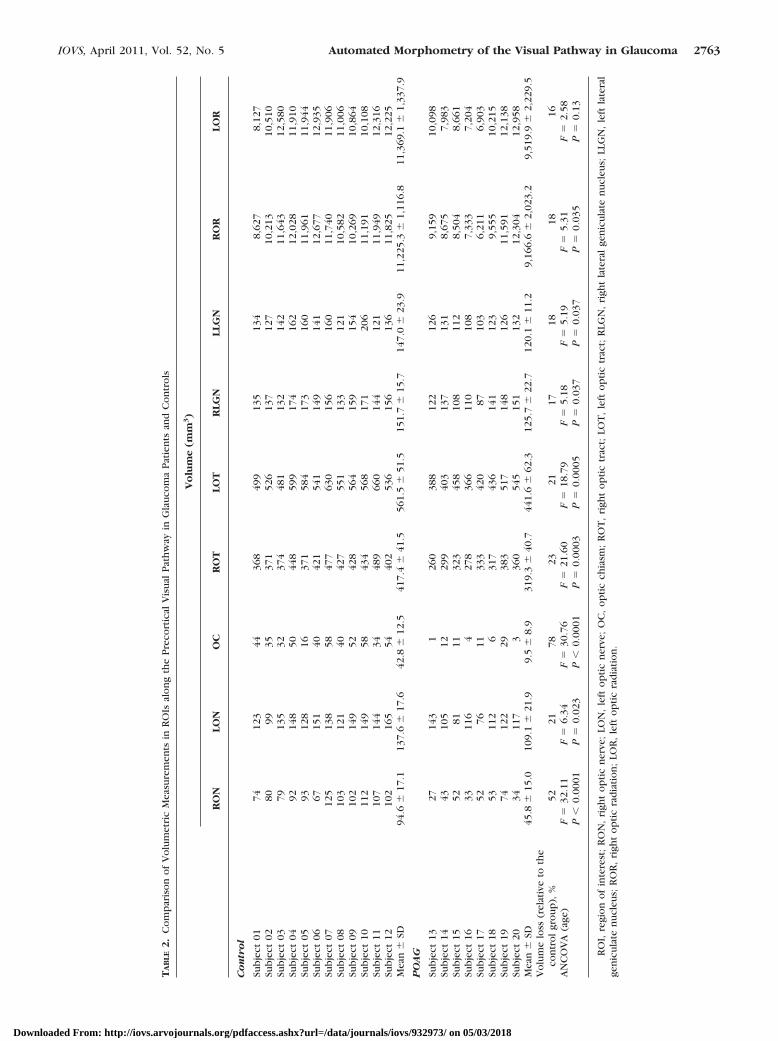
Figure 4 shows box plots for the ROI-based volumetricmeasurements for the individual subjects in the control andglaucoma groups. Table 2 lists the individual subject’s volumes,as well as the relative volume loss, in each ROI. The final rowof Table 2 lists the values related to the statistical comparison.
Table 2 and Figure 4 indicate that the ROI-based compari-sons of the glaucoma and control groups showed significantvolumetric differences in nearly all ROIs. With the exception ofthe left optic radiation, the glaucoma group had an overalllower volume along the full visual pathway.
Correlation Analyses
We determined the correlations between the binocular averageof the MD of visual field sensitivity and the volume of the ROIs
FIGURE 1. ROIs defining the possi-ble locations of the optic radiations.The optic radiation ROIs are shownon the reference brain image createdfor this study. The yellow ROI repre-sents the right optic radiation,whereas the cyan one represents theleft optic radiation.
TABLE 1. Baseline Patient Characteristics
Characteristics Values
Age, median (range), y 72.5 (62–85)Male sex, % 87.5Family history of glaucoma, % 85.7Visual acuity in logMAR, median
(range) 0.1 (0.0–0.7)IOP
Highest recorded, median (range),mm Hg 30 (17–55) mm Hg
Treated, median (range), mm Hg 14 (12–16) mm HgVisual field MD
Right eye, median (range), dB �11.62 (�5.23 to �27.20)Left eye, median (range), dB �15.30 (�3.67 to �24.59)
Scanning laser polarimetry (GDx*) NFIRight eye, median (range) 63 (51–97)Left eye, median (range) 61 (38–95)
Scanning laser polarimetry (GDx*)ellipse average thickness
Right eye, median (range), �m 59 (45–69)Left eye, median (range), �m 62 (46–72)
* Carl Zeiss Meditec, Dublin, CA.
2760 Hernowo et al. IOVS, April 2011, Vol. 52, No. 5
Downloaded From: http://iovs.arvojournals.org/pdfaccess.ashx?url=/data/journals/iovs/932973/ on 05/03/2018
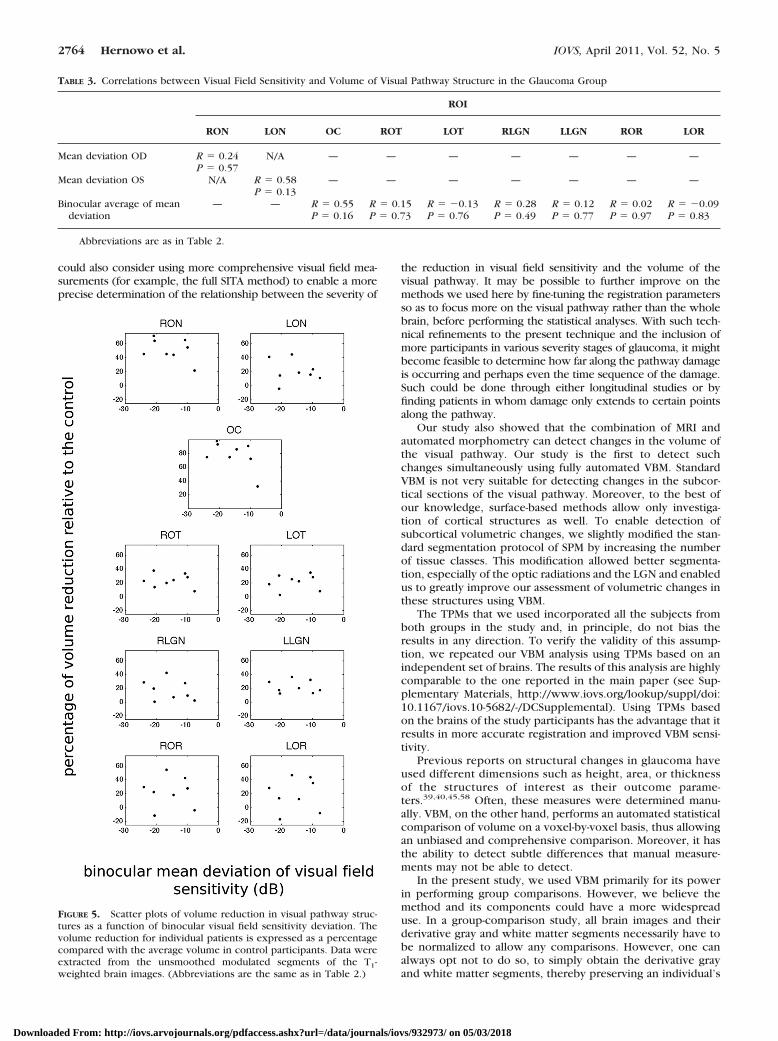
just described. Table 3 shows that none of the correlationsbetween the ROI volume and the MD of the glaucoma groupreached statistical significance. The scatter plots in Figure 5
show a relative change in volume for individual patients as afunction of the binocular average of the MD.
DISCUSSION
Our results show that in comparison to healthy controls, sub-jects with glaucoma exhibited significant reductions in thevolume of the visual pathway, including the optic nerves,chiasm, tracts, LGN, and optic radiations. In subjects withlong-standing POAG, volumetric reductions were thereforepresent in the visual pathway. Starting from the optic nerve,we found that the intraorbital and intracranial optic nervevolumes were markedly reduced in glaucoma.
These findings corroborate earlier reports on structuraldamage to these sections of the visual pathway.38–40,42 Thevolumetric reduction need not be symmetrical, as can be seenin Figure 2. The reduction was most prominent in the distalhalf of the right optic nerve and in the middle third of the leftnerve. Nonetheless, when we lowered the statistical threshold(to P � 0.05), we observed the presence of POAG-associatedvolumetric reductions along the entire length of the opticnerve. This finding indicates that shrinkage may occur any-where along the entire length of the optic nerve.
The volume of the optic chiasm and tracts was reduced inglaucoma as well (Fig. 2). Shrinkage was present in the opticchiasm and along the full length of the optic tracts, corrobo-rating results from earlier studies.40,53 Since the latter twostructures are a direct continuation of the optic nerves, thesefindings are perhaps less surprising. A more interesting neuro-ophthalmologic finding is that the LGNs also showed volumet-ric reductions in subjects with POAG. This corroborates anearlier report by Gupta et al.,41 who used manual measure-ments in their study. Our results also indicate that the opticradiations were adversely affected. This result is more surpris-ing, as the axonal projections in the optic radiations are not adirect continuation of the RGC layer axons, but are projections
FIGURE 2. Reductions in volume along the pregeniculate visual pathwayin glaucoma, as determined by using VBM. Highlighted structures (includ-ing the optic nerves, chiasm, and tracts) indicate regions with statisticallysignificant volumetric reductions in subjects with glaucoma, comparedwith age-matched controls (thresholded at P � 0.005, uncorrected). TheLGNs and optic radiations are not shown in this rendering.
FIGURE 3. Axial slices indicating re-ductions in volume along the visualpathway in glaucoma, as found usingVBM. Compared with the age-matched controls, subjects in theglaucoma group had a reduced vol-ume of the precortical visual path-way structures (A–L). Statistically sig-nificant volumetric reductions in thelateral geniculate nuclei are indicatedby cyan arrowheads in (J) and (K).Statistically significant changes in theoptic radiations are depicted (I–L).Statistical maps are thresholded at alevel of P � 0.005 (uncorrected).
IOVS, April 2011, Vol. 52, No. 5 Automated Morphometry of the Visual Pathway in Glaucoma 2761
Downloaded From: http://iovs.arvojournals.org/pdfaccess.ashx?url=/data/journals/iovs/932973/ on 05/03/2018
from LGN relay neurons that transmit the visual information tothe visual cortex. The volumetric reduction of the optic radi-ations complements the gray matter density reduction in thevisual cortex.44
The volumetric reduction of the optic radiations is alsorelated to the finding, based on DTI, that these structuresshowed increased mean diffusivity and decreased fractionalanisotropy in glaucoma patients.42 This DTI finding impliedthat the integrity of the optic radiation in glaucoma is compro-mised. Our T1-weighted imaging and VBM results indicatedthat there is also a reduction in the volume of this brainstructure in glaucoma. For future assessment of structuralchanges in patients, DTI and T1-weighted imaging appear to betechniques that provide distinct and complementary informa-tion. Determining how these DTI and VBM results exactlyrelate to each other, as well as to disease severity, wouldrequire comparisons in the same group of patients.
The proportion of volume loss in the visual pathway rangesfrom 78% in the optic chiasm to 16% in the optic radiation. Atrend in the data suggests that the glaucoma-associated volumereduction decreases the farther away a structure is from the eye.This would fit with the notion that that the pregeniculate volu-metric reduction is transmitted trans-synaptically to the LGNand beyond. Another explanation for the volume reductioncould be a change in metabolic activity due to the lack of RGCinput as shown in primate glaucoma54 and the visual cortex inhuman glaucoma.55 However, it is beyond the capacity of theVBM methodology to determine the exact mechanism under-lying the volumetric reductions.
For the control participants, our estimate of the averagevolume of the LGN (149 mm3) lies between previous estimatesbased on a postmortem, MRI-registered histologic investigation(182 mm3)56 and on another postmortem histologic study (118mm3).57 The latter estimate is smaller than ours, but this maybe due to shrinkage as a result of formalin fixation. Our methodmeasures volume of (parts of) segmented images, so that thespecific choice of segmentation parameters may influence ab-solute size estimates. However, this equally affects the mea-surements in patients and controls.
In their combined MRI and histologic study, Burgel et al.56
estimated the average size of the optic radiations in healthyindividuals to be 6798 mm3. In this case, we got a largeraverage optic radiation volume (11,297 mm3). This larger esti-mate can be explained by us by deliberately defining a rela-tively large region of interest to guarantee that we wouldcapture the ROR and LORs of all the individual brains. In thefuture, DTI-guided segmentation of high-resolution anatomicimages of the brain may allow extraction of the optic radiationin an automated manner and provide even more accurate invivo volumetric measurements.
Our analyses showed no significant correlation between thevisual field sensitivity (MD) and the volume of the visual pathwaystructures (see Table 3 and Fig. 5). There may be several meth-odological reasons for this finding. ROI-based analyses, as we usedhere, are a relatively coarse measure in comparison to the reso-lution offered by VBM. Future studies may explore the structure–function relationship in a finer, voxel-wise manner. Investigators
FIGURE 4. Comparison of volumet-ric measurements in ROIs along theprecortical visual pathway in glau-coma patients and controls. Boxplots show the average and 25th and75th percentiles for nine ROIs: RON,LON, OC, ROT, LOT, RLGN, LLGN,ROR, and LOR. (Abbreviations arethe same as in Table 2.) Data wereextracted from the unsmoothedmodulated segments of the T1-weighted brain images.
2762 Hernowo et al. IOVS, April 2011, Vol. 52, No. 5
Downloaded From: http://iovs.arvojournals.org/pdfaccess.ashx?url=/data/journals/iovs/932973/ on 05/03/2018
TA
BLE
2.
Co
mp
aris
on
of
Vo
lum
etri
cM
easu
rem
ents
inR
OIs
alo
ng
the
Pre
cort
ical
Vis
ual
Pat
hw
ayin
Gla
uco
ma
Pat
ien
tsan
dC
on
tro
ls
Vo
lum
e(m
m3)
RO
NLO
NO
CR
OT
LOT
RLG
NLL
GN
RO
RLO
R
Co
ntr
ol
Sub
ject
0174
123
4436
849
913
513
48,
627
8,12
7Su
bje
ct02
8099
3537
152
613
712
710
,213
10,5
10Su
bje
ct03
7913
532
374
481
132
142
11,6
4312
,580
Sub
ject
0492
148
5044
859
917
416
212
,028
11,9
10Su
bje
ct05
9312
816
371
584
173
160
11,9
6111
,944
Sub
ject
0667
151
4042
154
114
914
112
,677
12,9
35Su
bje
ct07
125
138
5847
763
015
616
011
,740
11,9
06Su
bje
ct08
103
121
4042
755
113
312
110
,582
11,0
06Su
bje
ct09
102
149
5242
856
415
915
410
,269
10,8
64Su
bje
ct10
112
149
5843
456
817
120
611
,191
10,1
08Su
bje
ct11
107
144
3448
966
014
412
111
,949
12,3
16Su
bje
ct12
102
165
5440
253
615
613
611
,825
12,2
25M
ean
�SD
94.6
�17
.113
7.6
�17
.642
.8�
12.5
417.
4�
41.5
561.
5�
51.5
151.
7�
15.7
147.
0�
23.9
11,2
25.3
�1,
116.
811
,369
.1�
1,33
7.9
PO
AG
Sub
ject
1327
143
126
038
812
212
69,
159
10,0
98Su
bje
ct14
4310
512
299
403
137
131
8,67
57,
983
Sub
ject
1552
8111
323
458
108
112
8,50
48,
661
Sub
ject
1633
116
427
836
611
010
87,
333
7,20
4Su
bje
ct17
5276
1133
342
087
103
6,21
16,
903
Sub
ject
1853
112
631
743
614
112
39,
555
10,2
15Su
bje
ct19
7412
229
383
517
148
126
11,5
9112
,138
Sub
ject
2034
117
336
054
515
113
212
,304
12,9
58M
ean
�SD
45.8
�15
.010
9.1
�21
.99.
5�
8.9
319.
3�
40.7
441.
6�
62.3
125.
7�
22.7
120.
1�
11.2
9,16
6.6
�2,
023.
29,
519.
9�
2,22
9.5
Vo
lum
elo
ss(r
elat
ive
toth
eco
ntr
ol
gro
up
),%
5221
7823
2117
1818
16A
NC
OV
A(a
ge)
F�
32.1
1F
�6.
34F
�30
.76
F�
21.6
0F
�18
.79
F�
5.18
F�
5.19
F�
5.31
F�
2.58
P�
0.00
01P
�0.
023
P�
0.00
01P
�0.
0003
P�
0.00
05P
�0.
037
P�
0.03
7P
�0.
035
P�
0.13
RO
I,re
gio
no
fin
tere
st;
RO
N,
righ
to
pti
cn
erve
;LO
N,
left
op
tic
ner
ve;
OC
,o
pti
cch
iasm
;R
OT
,ri
ght
op
tic
trac
t;LO
T,
left
op
tic
trac
t;R
LGN
,ri
ght
late
ral
gen
icu
late
nu
cleu
s;LL
GN
,le
ftla
tera
lge
nic
ula
ten
ucl
eus;
RO
R,
righ
to
pti
cra
dia
tio
n;
LOR
,le
fto
pti
cra
dia
tio
n.
IOVS, April 2011, Vol. 52, No. 5 Automated Morphometry of the Visual Pathway in Glaucoma 2763
Downloaded From: http://iovs.arvojournals.org/pdfaccess.ashx?url=/data/journals/iovs/932973/ on 05/03/2018
could also consider using more comprehensive visual field mea-surements (for example, the full SITA method) to enable a moreprecise determination of the relationship between the severity of
the reduction in visual field sensitivity and the volume of thevisual pathway. It may be possible to further improve on themethods we used here by fine-tuning the registration parametersso as to focus more on the visual pathway rather than the wholebrain, before performing the statistical analyses. With such tech-nical refinements to the present technique and the inclusion ofmore participants in various severity stages of glaucoma, it mightbecome feasible to determine how far along the pathway damageis occurring and perhaps even the time sequence of the damage.Such could be done through either longitudinal studies or byfinding patients in whom damage only extends to certain pointsalong the pathway.
Our study also showed that the combination of MRI andautomated morphometry can detect changes in the volume ofthe visual pathway. Our study is the first to detect suchchanges simultaneously using fully automated VBM. StandardVBM is not very suitable for detecting changes in the subcor-tical sections of the visual pathway. Moreover, to the best ofour knowledge, surface-based methods allow only investiga-tion of cortical structures as well. To enable detection ofsubcortical volumetric changes, we slightly modified the stan-dard segmentation protocol of SPM by increasing the numberof tissue classes. This modification allowed better segmenta-tion, especially of the optic radiations and the LGN and enabledus to greatly improve our assessment of volumetric changes inthese structures using VBM.
The TPMs that we used incorporated all the subjects fromboth groups in the study and, in principle, do not bias theresults in any direction. To verify the validity of this assump-tion, we repeated our VBM analysis using TPMs based on anindependent set of brains. The results of this analysis are highlycomparable to the one reported in the main paper (see Sup-plementary Materials, http://www.iovs.org/lookup/suppl/doi:10.1167/iovs.10-5682/-/DCSupplemental). Using TPMs basedon the brains of the study participants has the advantage that itresults in more accurate registration and improved VBM sensi-tivity.
Previous reports on structural changes in glaucoma haveused different dimensions such as height, area, or thicknessof the structures of interest as their outcome parame-ters.39,40,45,58 Often, these measures were determined manu-ally. VBM, on the other hand, performs an automated statisticalcomparison of volume on a voxel-by-voxel basis, thus allowingan unbiased and comprehensive comparison. Moreover, it hasthe ability to detect subtle differences that manual measure-ments may not be able to detect.
In the present study, we used VBM primarily for its powerin performing group comparisons. However, we believe themethod and its components could have a more widespreaduse. In a group-comparison study, all brain images and theirderivative gray and white matter segments necessarily have tobe normalized to allow any comparisons. However, one canalways opt not to do so, to simply obtain the derivative grayand white matter segments, thereby preserving an individual’s
TABLE 3. Correlations between Visual Field Sensitivity and Volume of Visual Pathway Structure in the Glaucoma Group
ROI
RON LON OC ROT LOT RLGN LLGN ROR LOR
Mean deviation OD R � 0.24P � 0.57
N/A — — — — — — —
Mean deviation OS N/A R � 0.58 — — — — — — —P � 0.13
Binocular average of meandeviation
— — R � 0.55P � 0.16
R � 0.15P � 0.73
R � �0.13P � 0.76
R � 0.28P � 0.49
R � 0.12P � 0.77
R � 0.02P � 0.97
R � �0.09P � 0.83
Abbreviations are as in Table 2.
FIGURE 5. Scatter plots of volume reduction in visual pathway struc-tures as a function of binocular visual field sensitivity deviation. Thevolume reduction for individual patients is expressed as a percentagecompared with the average volume in control participants. Data wereextracted from the unsmoothed modulated segments of the T1-weighted brain images. (Abbreviations are the same as in Table 2.)
2764 Hernowo et al. IOVS, April 2011, Vol. 52, No. 5
Downloaded From: http://iovs.arvojournals.org/pdfaccess.ashx?url=/data/journals/iovs/932973/ on 05/03/2018
brain shape. For example, a clinician could then use the whitematter segment, which is virtually free from the other non–white matter brain tissue, to precisely measure the dimensionsof the optic chiasm or the optic tracts. In this case, only theaccurate segmentation abilities of the VBM method are used toimprove the sensitivity of manual measurements.
In our view, a fully automated VBM approach could also beapplied at the individual patient level, although this wouldrequire further research and development. Based on a largenumber of images of normal, healthy brains, a normative data-base of templates for subjects of various ages could be created.After automated normalization and segmentation, the brainimages of an individual patient, could be compared, on avoxel-wise basis, to the appropriate normal template in thedatabase. Deviant structures in the patient’s brain could behighlighted. Such measurements and visualizations could assista clinician in deciding on the diagnosis, prognosis, and furthermanagement of an individual patient. Potentially, multivariatepattern classification techniques could be applied to improvethe sensitivity of such automated assistive measurements. Inthe long run, volume reduction and other MR based assess-ments could become additional indicators to assess glaucomaprogress.42
In the future, these new methods could also help to decidewhether a vision rehabilitation program for a patient is worth-while, since a degenerated pathway may limit the efficacy ofrehabilitation and training programs59 and retinal prostheses.60
Furthermore, due to the potentially deteriorative effect of glau-coma, physicians may also need to consider the prevention ofdegeneration as a new goal. In addition to such clinical impli-cations, our results indicate that the automated and objectiveprocedure of VBM can be applied in future research on thevisual pathway. Finally, the present approach need not berestricted to the realms of neuro-ophthalmology. Automaticdetection of changes in subcortical structures may also beuseful in neurologic or psychiatric disorders.
In summary, compared with healthy individuals, glaucomapatients show the presence of volumetric reductions that mayextend all the way from the optic nerve to the optic radiations.Glaucoma, besides affecting the eye and optic nerves, may thusalso disrupt the central visual system. Despite the markedchanges observed in pregeniculate structures of the visualpathway, more data are needed, to ascertain the extent of theoptic radiations’ involvement.
Acknowledgments
The authors thank Hans de Haas and Sander Paas for assistance in dataextraction, the BCN Neuroimaging Center for the use of their MRIscanner, Anita Kuiper for assistance in magnetic resonance imageacquisition, and Marije van Beilen for useful comments and suggestionson an earlier version of the manuscript.
References
1. Resnikoff S, Pascolini D, Etya’ale D, et al. Global data on visualimpairment in the year 2002. Bull World Health Organ. 2004;82(11):844–851.
2. Dandona L, Hendrickson A, Quigley HA. Selective effects of exper-imental glaucoma on axonal transport by retinal ganglion cells tothe dorsal lateral geniculate nucleus. Invest Ophthalmol Vis Sci.1991;32(5):1593–1599.
3. Desatnik H, HA Quigley, Glovinsky Y. Study of central retinalganglion cell loss in experimental glaucoma in monkey eyes. JGlaucoma. 1996;5(1):46–53.
4. Fu QL, Li X, Shi J, et al. Synaptic degeneration of retinal ganglioncells in a rat ocular hypertension glaucoma model. Cell Mol Neu-robiol. 2009;29(4):575–581.
5. Garcia-Valenzuela E, Shareef S, Walsh J, Sharma SC. Programmedcell death of retinal ganglion cells during experimental glaucoma.Exp Eye Res. 1995;61(1):33–44.
6. Glovinsky Y, Quigley HA, Dunkelberger GR. Retinal ganglion cellloss is size dependent in experimental glaucoma. Invest Ophthal-mol Vis Sci. 1991;32(3):484–491.
7. Guo L, Moss SE, Alexander RA, Ali RR, Fitzke FW, Cordeiro MF.Retinal ganglion cell apoptosis in glaucoma is related to intraocularpressure and IOP-induced effects on extracellular matrix. InvestOphthalmol Vis Sci. 2005;46(1):175–182.
8. Holcombe DJ, Lengefeld N, Gole GA, Barnett NL. Selective innerretinal dysfunction precedes ganglion cell loss in a mouse glau-coma model. Br J Ophthalmol. 2008;92(5):683–638.
9. Ikeda Y, Ohguro H, Maruyama I. Two cases of primary open angleglaucoma with serum autoantibody against retinal ganglion cells.Jpn J Ophthalmol. 2000;44(6):648–652.
10. Morgan, JE. Retinal ganglion cell shrinkage in glaucoma. J Glau-coma. 2002;11(4):365–370.
11. Nickells, RW. Retinal ganglion cell death in glaucoma: the how,the why, and the maybe. J Glaucoma. 1996;5(5):345–356.
12. Nickells RW. Apoptosis of retinal ganglion cells in glaucoma: anupdate of the molecular pathways involved in cell death. SurvOphthalmol. 1999;43(suppl 1):S151–S161.
13. Pavlidis M, Stupp T, Naskar R, Cengiz C, Thanos S. Retinal ganglioncells resistant to advanced glaucoma: a postmortem study of hu-man retinas with the carbocyanine dye DiI. Invest Ophthalmol VisSci. 2003;44(12):5196–5205.
14. Quigley HA, Dunkelberger GR, Green WR. Retinal ganglion cellatrophy correlated with automated perimetry in human eyes withglaucoma. Am J Ophthalmol. 1989;107(5):453–464.
15. Reichstein D, Ren L, Filippopoulos T, Mittag T, Danias J. Apoptoticretinal ganglion cell death in the DBA/2 mouse model of glaucoma.Exp Eye Res. 2007;84(1):13–21.
16. Takatsuji K, Tohyama M, Sato Y, Nakamura A. Selective loss ofretinal ganglion cells in albino avian glaucoma. Invest OphthalmolVis Sci. 1988;29(6):901–909.
17. Morgan JE, Uchida H, Caprioli J. Retinal ganglion cell death inexperimental glaucoma. Br J Ophthalmol. 2000;84(3):303–310.
18. Urcola JH, Hernandez M, Vecino E. Three experimental glaucomamodels in rats: comparison of the effects of intraocular pressureelevation on retinal ganglion cell size and death. Exp Eye Res.2006;83(2):429–437.
19. Wax MB, Tezel G. Immunoregulation of retinal ganglion cell fate inglaucoma. Exp Eye Res. 2009;88(4):825–830.
20. Quigley HA, Nickells RW, Kerrigan LA, Pease ME, Thibault DJ,Zack DJ. Retinal ganglion cell death in experimental glaucoma andafter axotomy occurs by apoptosis. Invest Ophthalmol Vis Sci.1995;36(5):774–786.
21. Saleh M, Nagaraju M, Porciatti V. Longitudinal evaluation of retinalganglion cell function and IOP in the DBA/2J mouse model ofglaucoma. Invest Ophthalmol Vis Sci. 2007;48(10):4564–4572.
22. Soto I, Oglesby E, Buckingham BP, et al. Retinal ganglion cellsdownregulate gene expression and lose their axons within theoptic nerve head in a mouse glaucoma model. J Neurosci. 2008;28(2):548–561.
23. Howell GR, Libby RT, Jakobs TC, et al. Axons of retinal ganglioncells are insulted in the optic nerve early in DBA/2J glaucoma.J Cell Biol. 2007;179(7):1523–37.
24. Ventura LM, Sorokac N, De Los Santos R, Feuer WJ, Porciatti V.The relationship between retinal ganglion cell function and retinalnerve fiber thickness in early glaucoma. Invest Ophthalmol Vis Sci.2006;47(9):3904–11.
25. Yucel YH, Zhang Q, Weinreb RN, Kaufman PL, Gupta N. Effects ofretinal ganglion cell loss on magno-, parvo-, koniocellular path-ways in the lateral geniculate nucleus and visual cortex in glau-coma. Prog Retin Eye Res. 2003;22(4):465–81.
26. Medeiros FA, Alencar LM, Zangwill LM, et al. Detection of progres-sive retinal nerve fiber layer loss in glaucoma using scanning laserpolarimetry with variable corneal compensation. Invest Ophthal-mol Vis Sci. 2009;50(4):1675–81.
27. Chang YC, Tsai RK. Correlation between quadrant specific auto-matic visual field defect and retinal nerve fiber layer thickness as
IOVS, April 2011, Vol. 52, No. 5 Automated Morphometry of the Visual Pathway in Glaucoma 2765
Downloaded From: http://iovs.arvojournals.org/pdfaccess.ashx?url=/data/journals/iovs/932973/ on 05/03/2018
measured by scanning laser polarimetry in patients with primaryopen angle glaucoma. Kaohsiung J Med Sci. 2008;24(5):233–239.
28. Baraibar B, Sanchez-Cano A, Pablo LE, Honrubia FM. Preperimetricglaucoma assessment with scanning laser polarimetry (GDx VCC):analysis of retinal nerve fiber layer by sectors. J Glaucoma. 2007;16(8):659–664.
29. Tsai JC, Chang HW, Teng MC, Lin PW, Lai IC. Scanning laserpolarimetry for measurement of retinal nerve fiber layer in abso-lute, advanced and early glaucoma. Chang Gung Med J. 2006;29(2):162–168.
30. Reus NJ, Lemij HG. Scanning laser polarimetry of the retinal nervefiber layer in perimetrically unaffected eyes of glaucoma patients.Ophthalmology. 2004;111(12):2199–2203.
31. Mocan MC, Bozkurt B, Irkec M, Orhan M, Karabulut E. The eval-uation of retinal nerve fiber layer in pigment dispersion syndromeand pigmentary glaucoma using scanning laser polarimetry. Eur JOphthalmol. 2003;13(4):377–382.
32. Weinreb RN. Evaluating the retinal nerve fiber layer in glaucomawith scanning laser polarimetry. Arch Ophthalmol. 1999;117(10):1403–1406.
33. Shirakashi M, Abe H, Sawaguchi S, Funaki S. Measurement ofthickness of retinal nerve fiber layer by scanning laser polarimetryand high-pass resolution perimetry in patients with primary open-angle or normal-tension glaucoma. Acta Ophthalmol Scand. 1997;75(6):641–644.
34. Shirakashi M, Funaki S, Funaki H, Yaoeda K, Abe H. Measurementof retinal nerve fibre layer by scanning laser polarimetry and highpass resolution perimetry in normal tension glaucoma with rela-tively high or low intraocular pressure. Br J Ophthalmol. 1999;83(3):353–357.
35. Hollo G, Suveges I, Nagymihaly A, Vargha P. Scanning laser pola-rimetry of the retinal nerve fibre layer in primary open angle andcapsular glaucoma. Br J Ophthalmol. 1997;81(10):857–861.
36. Heeg GP, Jansonius NM. The Groningen longitudinal glaucomastudy III. The predictive value of frequency-doubling perimetryand GDx nerve fibre analyser test results for the development ofglaucomatous visual field loss. Eye. 2009;23:1647–1652.
37. Jansonius NM, Heeg GP. The Groningen Longitudinal GlaucomaStudy. II A prospective comparison of frequency doubling perim-etry, the GDx nerve fibre analyser and standard automated perim-etry in glaucoma suspect patients. Acta Ophthalmol. 2009;87(4):429–432.
38. Ito Y, Shimazawa M, Inokuchi Y, et al. Degenerative alterations inthe visual pathway after NMDA-induced retinal damage in mice.Brain Res. 2008;1212:89–101.
39. Breitenseher M, Uhl F, Prayer Wimberger D, Deecke L, Trattnig S,Kramer J. Morphological dissociation between visual pathwaysand cortex: MRI of visually-deprived patients with congenital pe-ripheral blindness. Neuroradiology. 1998;40(7):424–427.
40. Kashiwagi K, Okubo T, Tsukahara S. Association of magneticresonance imaging of anterior optic pathway with glaucomatousvisual field damage and optic disc cupping. J Glaucoma. 2004;13(3):189–195.
41. Gupta N, Greenberg G, de Tilly LN, Gray B, Polemidiotis M, YucelYH. Atrophy of the lateral geniculate nucleus in human glaucomadetected by magnetic resonance imaging. Br J Ophthalmol. 2009;93(1):56–60.
42. Garaci FG, Bolacchi F, Cerulli A, et al. Optic nerve and opticradiation neurodegeneration in patients with glaucoma: in vivo
analysis with 3-T diffusion-tensor MR imaging. Radiology. 2009;252(2):496–501.
43. Gupta N, Ang LC, Noel de Tilly L, Bidaisee L, Yucel YH. Humanglaucoma and neural degeneration in intracranial optic nerve,lateral geniculate nucleus, and visual cortex. Br J Ophthalmol.2006;90(6):674–678.
44. Boucard CC, Hernowo AT, Maguire RP, et al. Changes in corticalgrey matter density associated with long-standing retinal visualfield defects. Brain. 2009;132:1898–1906.
45. Parravano JG, Toledo A, Kucharczyk W. Dimensions of the opticnerves, chiasm, and tracts: MR quantitative comparison betweenpatients with optic atrophy and normals. J Comput Assist Tomogr.1993;17(5):688–690.
46. Heeg GP, Blanksma LJ, Hardus PL, Jansonius NM. The GroningenLongitudinal Glaucoma Study. I. Baseline sensitivity and specificityof the frequency doubling perimeter and the GDx nerve fibreanalyser. Acta Ophthalmol Scand. 2005;83(1):46–52.
47. Katz J, Sommer A, Gaasterland DE, Anderson DR. Comparison ofanalytic algorithms for detecting glaucomatous visual field loss.Arch Ophthalmol. 1991;109(12):1684–1689.
48. Ashburner J, Friston KJ. Voxel-based morphometry: the methods.Neuroimage. 2000;11:805–821.
49. Smith SM. Fast robust automated brain extraction. Hum BrainMapp. 2002;17(3):143–155.
50. Zhang Y, Brady M, Smith S. Segmentation of brain MR imagesthrough a hidden Markov random field model and the expectation-maximization algorithm. IEEE Trans Med Imaging. 2001;20(1):45–57.
51. Klein A, Andersson J, Ardekani BA, et al. Evaluation of 14 nonlineardeformation algorithms applied to human brain MRI registration.Neuroimage. 2009;46(3):786–802.
52. Ashburner J. A fast diffeomorphic image registration algorithm.Neuroimage. 2007;38(1):95–113.
53. Iba-Zizen MT, Istoc A, Cabanis EA. The results of MRI explorationof glaucoma patients: what are the benefits (in French)? J FrOphtalmol. 2008;31:S24–S28.
54. Imamura K, Onoe H, Shimazawa M, et al. Molecular imagingreveals unique degenerative changes in experimental glaucoma.Neuroreport. 2009;20(2):139–144.
55. Duncan RO, Sample PA, Weinreb RN, Bowd C, Zangwill LM.Retinotopic organization of primary visual cortex in glaucoma:comparing fMRI measurements of cortical function with visualfield loss. Prog Retin Eye Res. 2007;26(1):38–56.
56. Burgel U, Schormann T, Schleicher A, Zilles K. Mapping of histo-logically identified long fiber tracts in human cerebral hemispheresto the MRI volume of a reference brain: position and spatialvariability of the optic radiation. Neuroimage. 1999;10(5):489–499.
57. Andrews TJ, Halpern SD, Purves D. Correlated size variations inhuman visual cortex, lateral geniculate nucleus, and optic tract.J Neurosci. 1997;17(8):2859–2868.
58. Wagner AL, Murtagh FR, Hazlett KS, Arrington JA. Measurement ofthe normal optic chiasm on coronal MR images. AJNR Am JNeuroradiol. 1997;18(4):723–726.
59. Safran AB, Landis T. Plasticity in the adult visual cortex: implica-tions for the diagnosis of visual field defects and visual rehabilita-tion. Curr Opin Ophthalmol. 1996;7(6):53–64.
60. Hossain P, Seetho IW, Browning AC, Amoaku WM. Artificial meansfor restoring vision. BMJ. 2005;330(7481):30–33.
2766 Hernowo et al. IOVS, April 2011, Vol. 52, No. 5
Downloaded From: http://iovs.arvojournals.org/pdfaccess.ashx?url=/data/journals/iovs/932973/ on 05/03/2018